Design, Construction, and Test of the Gas Pixel Detectors for the IXPE Mission
Abstract
Due to be launched in late 2021, the Imaging X-Ray Polarimetry Explorer (IXPE) is a NASA Small Explorer mission designed to perform polarization measurements in the 2–8 keV band, complemented with imaging, spectroscopy and timing capabilities. At the heart of the focal plane is a set of three polarization-sensitive Gas Pixel Detectors (GPD), each based on a custom ASIC acting as a charge-collecting anode.
In this paper we shall review the design, manufacturing, and test of the IXPE focal-plane detectors, with particular emphasis on the connection between the science drivers, the performance metrics and the operational aspects. We shall present a thorough characterization of the GPDs in terms of effective noise, trigger efficiency, dead time, uniformity of response, and spectral and polarimetric performance. In addition, we shall discuss in detail a number of instrumental effects that are relevant for high-level science analysis—particularly as far as the response to unpolarized radiation and the stability in time are concerned.
keywords:
X-ray polarimetry , Gas detectorsPACS:
95.55.Ka , 95.55.Qf1 Introduction
Due to the limited sensitivity achievable with conventional techniques, polarimetry of X-ray astrophysical sources is, to date, essentially limited to high-significance detections for a single bright source, the Crab Nebula [1, 2]. Gas Pixel Detectors (GPD) [3] were proposed in the early 2000 as the first practical implementation of soft X-ray photoelectric polarimetry, with the potential for a leap in sensitivity by more than an order of magnitude.111Previous attempts to exploit the photoelectric effect in gas were effective at higher energy, see e.g. [4]. This technology opened the way to mission concepts offering for the first time the opportunity to observe tens of sources for precision measurements of their polarimetric properties, providing invaluable insight into their geometries and the physical processes at play.
After about two decades of dedicated R&D to bring the GPD technology readiness level to flight standards, and a demonstration (without use of imaging property) on the PolarLight CubeSat [5], IXPE [6] will be the first mission to fully exploit this technology, starting the first ever polarimetric sky study in X-rays at the end of 2021.
In this work we describe the IXPE GPD, as matured in the last decade and verified with a number of prototype detectors evolved towards the final design. We assembled and tested 9 GPDs of this design, of which we selected 4 to be incorporated into flight-model detector units (3 flight plus a spare). We provide details of the detector key components, the front-end Application Specific Integrated Circuit (ASIC) enabling the photoelectron track reconstruction, the readout electronics controlling the signal digitization, and the mechanical design ensuring the necessary structural and thermal robustness.
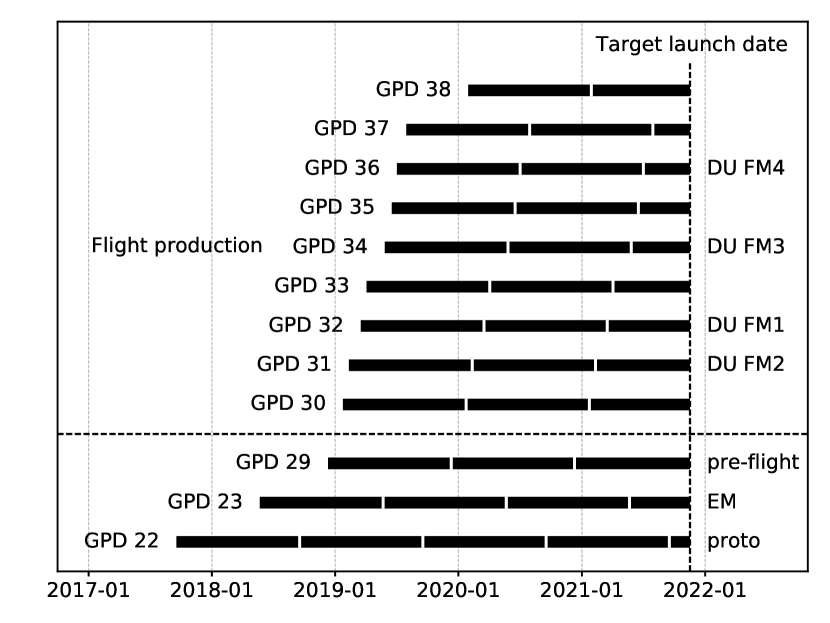
Having accumulated the equivalent of GPD-years of test data at the time of writing (see Figure 1), we uncovered some more subtle instrumental effects that are now understood and must be taken into account with dedicated calibrations during the IXPE mission. Minimizing these effects in an improved GPD design offers an exciting research opportunities for the next generation of astrophysical polarimeters.
2 Design Drivers
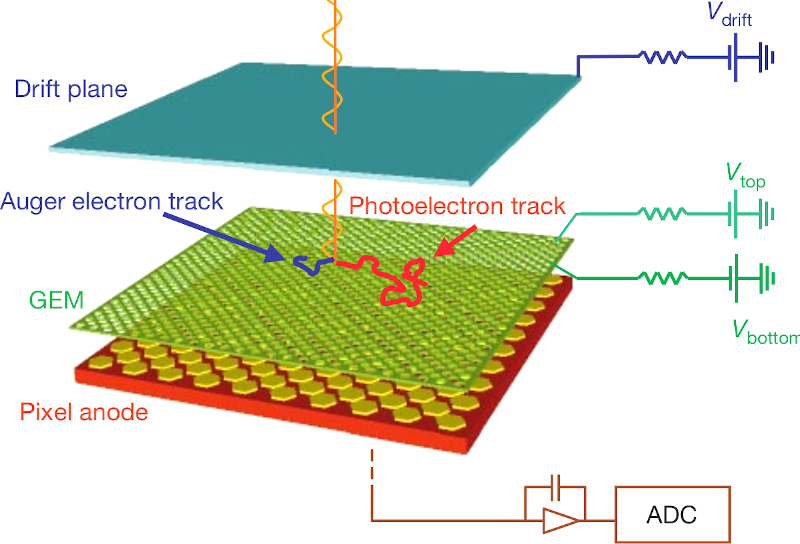
Figure 2 illustrates the conceptual design of the gas pixel detector, as well as the basic detection principle. Photons enter the active gas volume through a beryllium window, and can be absorbed in the gas. Under the action of the electric field (parallel to the optical axis) in the absorption gap, the primary ionization electrons generated by the photoelectron drifts toward the Gas Electon Multiplier (GEM) [7], which provides the necessary gas gain while preserving the track shape. Finally, the charge generated in the avalanche is collected on the readout ASIC [8, 9], acting as a finely pixellated anode. The polarization information is recovered on a statistical basis from the azimuthal distribution of the photoelectron directions of emission, reconstructed by imaging the track projections onto the readout plane.
| Parameter | Value |
|---|---|
| Thickness of the absorption gap | 10 mm |
| Thickness of the transfer gap | 0.7 mm |
| Thickness of the Be window | 50 m ( nm Al) |
| Active area | mm2 |
| Readout pitch | 50 m |
| Gas Volume | mm3 |
| Gas mixture | Pure DME |
| Filling pressure | 800 mbar |
| Typical | V |
| Typical | V |
| Typical | V |
| V | |
| Operating temperature | +15 ∘C to +30 ∘C |
The basic parameters determining the sensitivity of a polarimeter are its quantum efficiency and its modulation factor —the latter representing the response to 100% linearly polarized radiation in the form of a single number ranging from 0 (for a detector with no polarization sensitivity) to 1 (for a perfect polarimeter). The two are customarily combined (see, e.g., [10]) into a single figure of merit called the minimum detectable polarization (MDP):
| (1) |
where is the quality factor. Notably, the inverse of the MDP scales linearly with the modulation factor and only as the square root of the quantum efficiency. Much of the trade-offs that went into the design of the IXPE gas pixel detectors are readily understood as a coherent attempt at maximizing the quality factor in the target 2–8 keV energy band.
The GPD, whose main characteristics are summarized in Table 1, is one of the key ingredients in achieving the IXPE target polarization sensitivity. In addition, as we shall see in Section 6, it is naturally suited for precise (s) time tagging of the events, which will give access to time-resolved polarimetry in classes of sources such as accreting pulsars and binary systems, and provides moderate spectroscopic capabilities (at the level of FWHM at 5.9 keV, roughly scaling as ), enabling energy-resolved polarimetry where statistics is large enough. With the design focal length of 4 m, the GPD is a good match for the IXPE optics, providing an intrinsic spatial resolution significantly better than the half-power diameter (HPD) of the optics over a field of view of arcmin, sufficient to cover the vast majority of the extended sources that we shall observe.
2.1 The Choice of the Filling Gas
The choice of the gas acting as the absorbing medium is a complex trade-off involving several different aspects of detector operation and performance. Heavy elements are favoured from the standpoint of the quantum efficiency; however, light gas mixtures provide a favourable stopping-power/scattering ratio, which translates into relatively longer and straighter tracks, allowing for a higher modulation factor. For our specific application, since the photoelectron emission direction is 100% modulated only for orbitals, working above the -edge of the absorbing material is critical, which further limits the maximum that can be used. In addition, the effect of the atomic relaxation via the (isotropically distributed) emission of an Auger electron becomes one of the dominant limiting factors for the low-energy polarimetric sensitivity. In practice oxygen, with a -edge of 525 eV is the heaviest candidate atomic element that can be considered in the – keV energy band.
Noting that this effectively leaves out all the noble gases customarily exploited in traditional proportional counters, we choose pure dimethyl-ether (DME, (CH3)2O, see Table 2) as a good compromise between the various design considerations. DME has a long history of application in gas detectors for high-energy physics, and its quenching properties are desirable in our application, as they limit the risk of accidental discharges in the detector. In addition, DME features one of the lowest transverse diffusion coefficients, which is also desirable, as in practice the track blurring due to diffusion is one of the limiting factors to our ability to reconstruct the photoelectron emission direction.
2.2 Geometrical Detector Layout
The thickness of the absorption gap is the single, most important geometrical parameter determining the polarimetric performance of the GPD. Although a thicker gap provides a relatively higher quantum efficiency, the corresponding increase of drift length for the primary ionization causes a decrease of the modulation factor due to the track blurring induced by the transverse diffusion. The effect is somewhat exacerbated when the absorption efficiency approaches unity, as in the optically-thick regime photons tend to convert primarily in the uppermost layer of the absorbing medium, further increasing the average drift length.
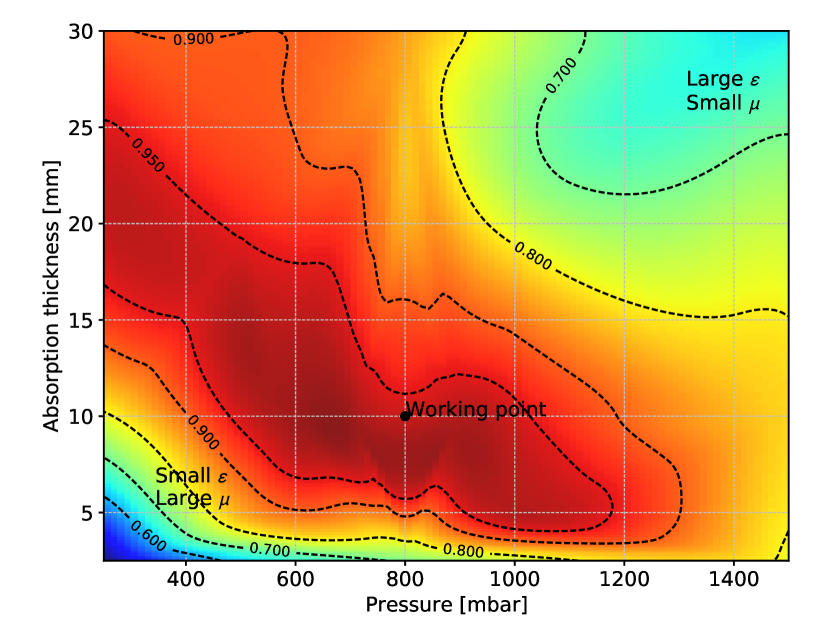
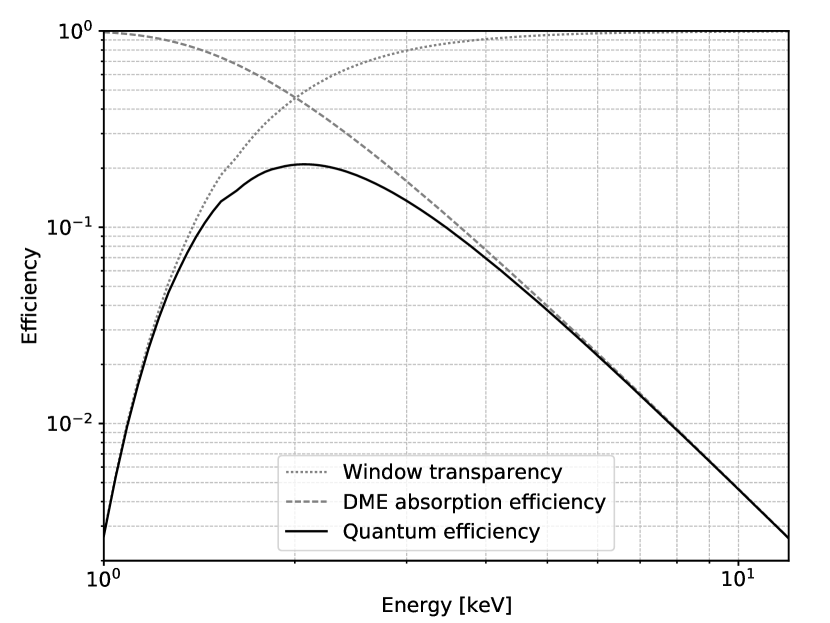
The optimization of the geometry of the gas cell is tightly coupled to the choice of the gas pressure, and Figure 3 shows the quality factor in Eq. (1), calculated at 3 keV, in the absorption thickness-pressure plane222 The actual broadband sensitivity depends on the effective area of the X-ray optics and the source spectrum, but, being 3 keV close to the energy of peak sensitivity, this is a sensible proxy, providing a good illustration of the expected performance across the phase space of interest.. Although we emphasize that our sweet spot is fairly shallow, 10 mm of pure DME at 800 mbar provide a nearly optimal sensitivity in a configuration that is well matched to basic detector components: with an average photoelectron track length ranging from about m at 2 keV to slightly over mm at keV, the m pitch of the readout ASIC and of the GEM allows a meaningful reconstruction of the track morphology across the entire energy band, and is comparable to the characteristic scale of the transverse diffusion. When convolved with the transparency of the entrance window, this geometrical arrangement provides an overall peak quantum efficiency in excess of at keV, dropping to about at keV, as shown in Figure 4.
The transfer gap acts mainly as a physical separation between the bottom face of the GEM and the readout plane and, as such its thickness should be in principle as small as possible to avoid additional track blurring. The nominal value of m that we choose is mainly driven by the distance between the bottom face of the GEM and the top of the wire-bonding loops from the ASIC to the ceramic package hosting it.
We also emphasize that the footprint of the gas cell ( cm2) is significantly larger than the active area of the readout chip, which has the twofold benefit of guaranteeing a more uniform electric field in the absorption gap and reducing the effect of possible background generated in the ceramic walls of the cell itself [13].
3 The Gas Electron Multiplier
The Gas Electron Multiplier [7] provides the gain stage for the GPD. Being intrinsically two-dimensional, it is particularly suited for our application. Compared with other GEM devices customarily used in high-energy physics applications, the main peculiarity of those developed for the IXPE mission is their fine pitch, which is in turn dictated by the necessity to preserve as much as possible the morphology of the photoelectron track and match the sampling capabilities of the readout plane.
We choose the laser-etching technique described in [14] as a well proven technology for producing a GEM with such a small pitch. As a matter of fact, the production process was fine-tuned through the development phase of the mission, pushing the manufacturing technology to the limits.
| Parameter | Value |
|---|---|
| Number of holes | |
| Horizontal pitch | m |
| Vertical pitch | m |
| Hole diameter | m |
| Hole diameter dispersion | m (typical) |
| Top-bottom alignment | m (typical) |
| Metal coating | Copper |
| Coating thickness | m |
| Substrate | Liquid crystal polymer (LCP) |
| Substrate thickness | m |
| Manufacturing process | Laser etching |
| Typical operating voltage | V |
| Gain gain scaling | V) |
| Working effective gain |
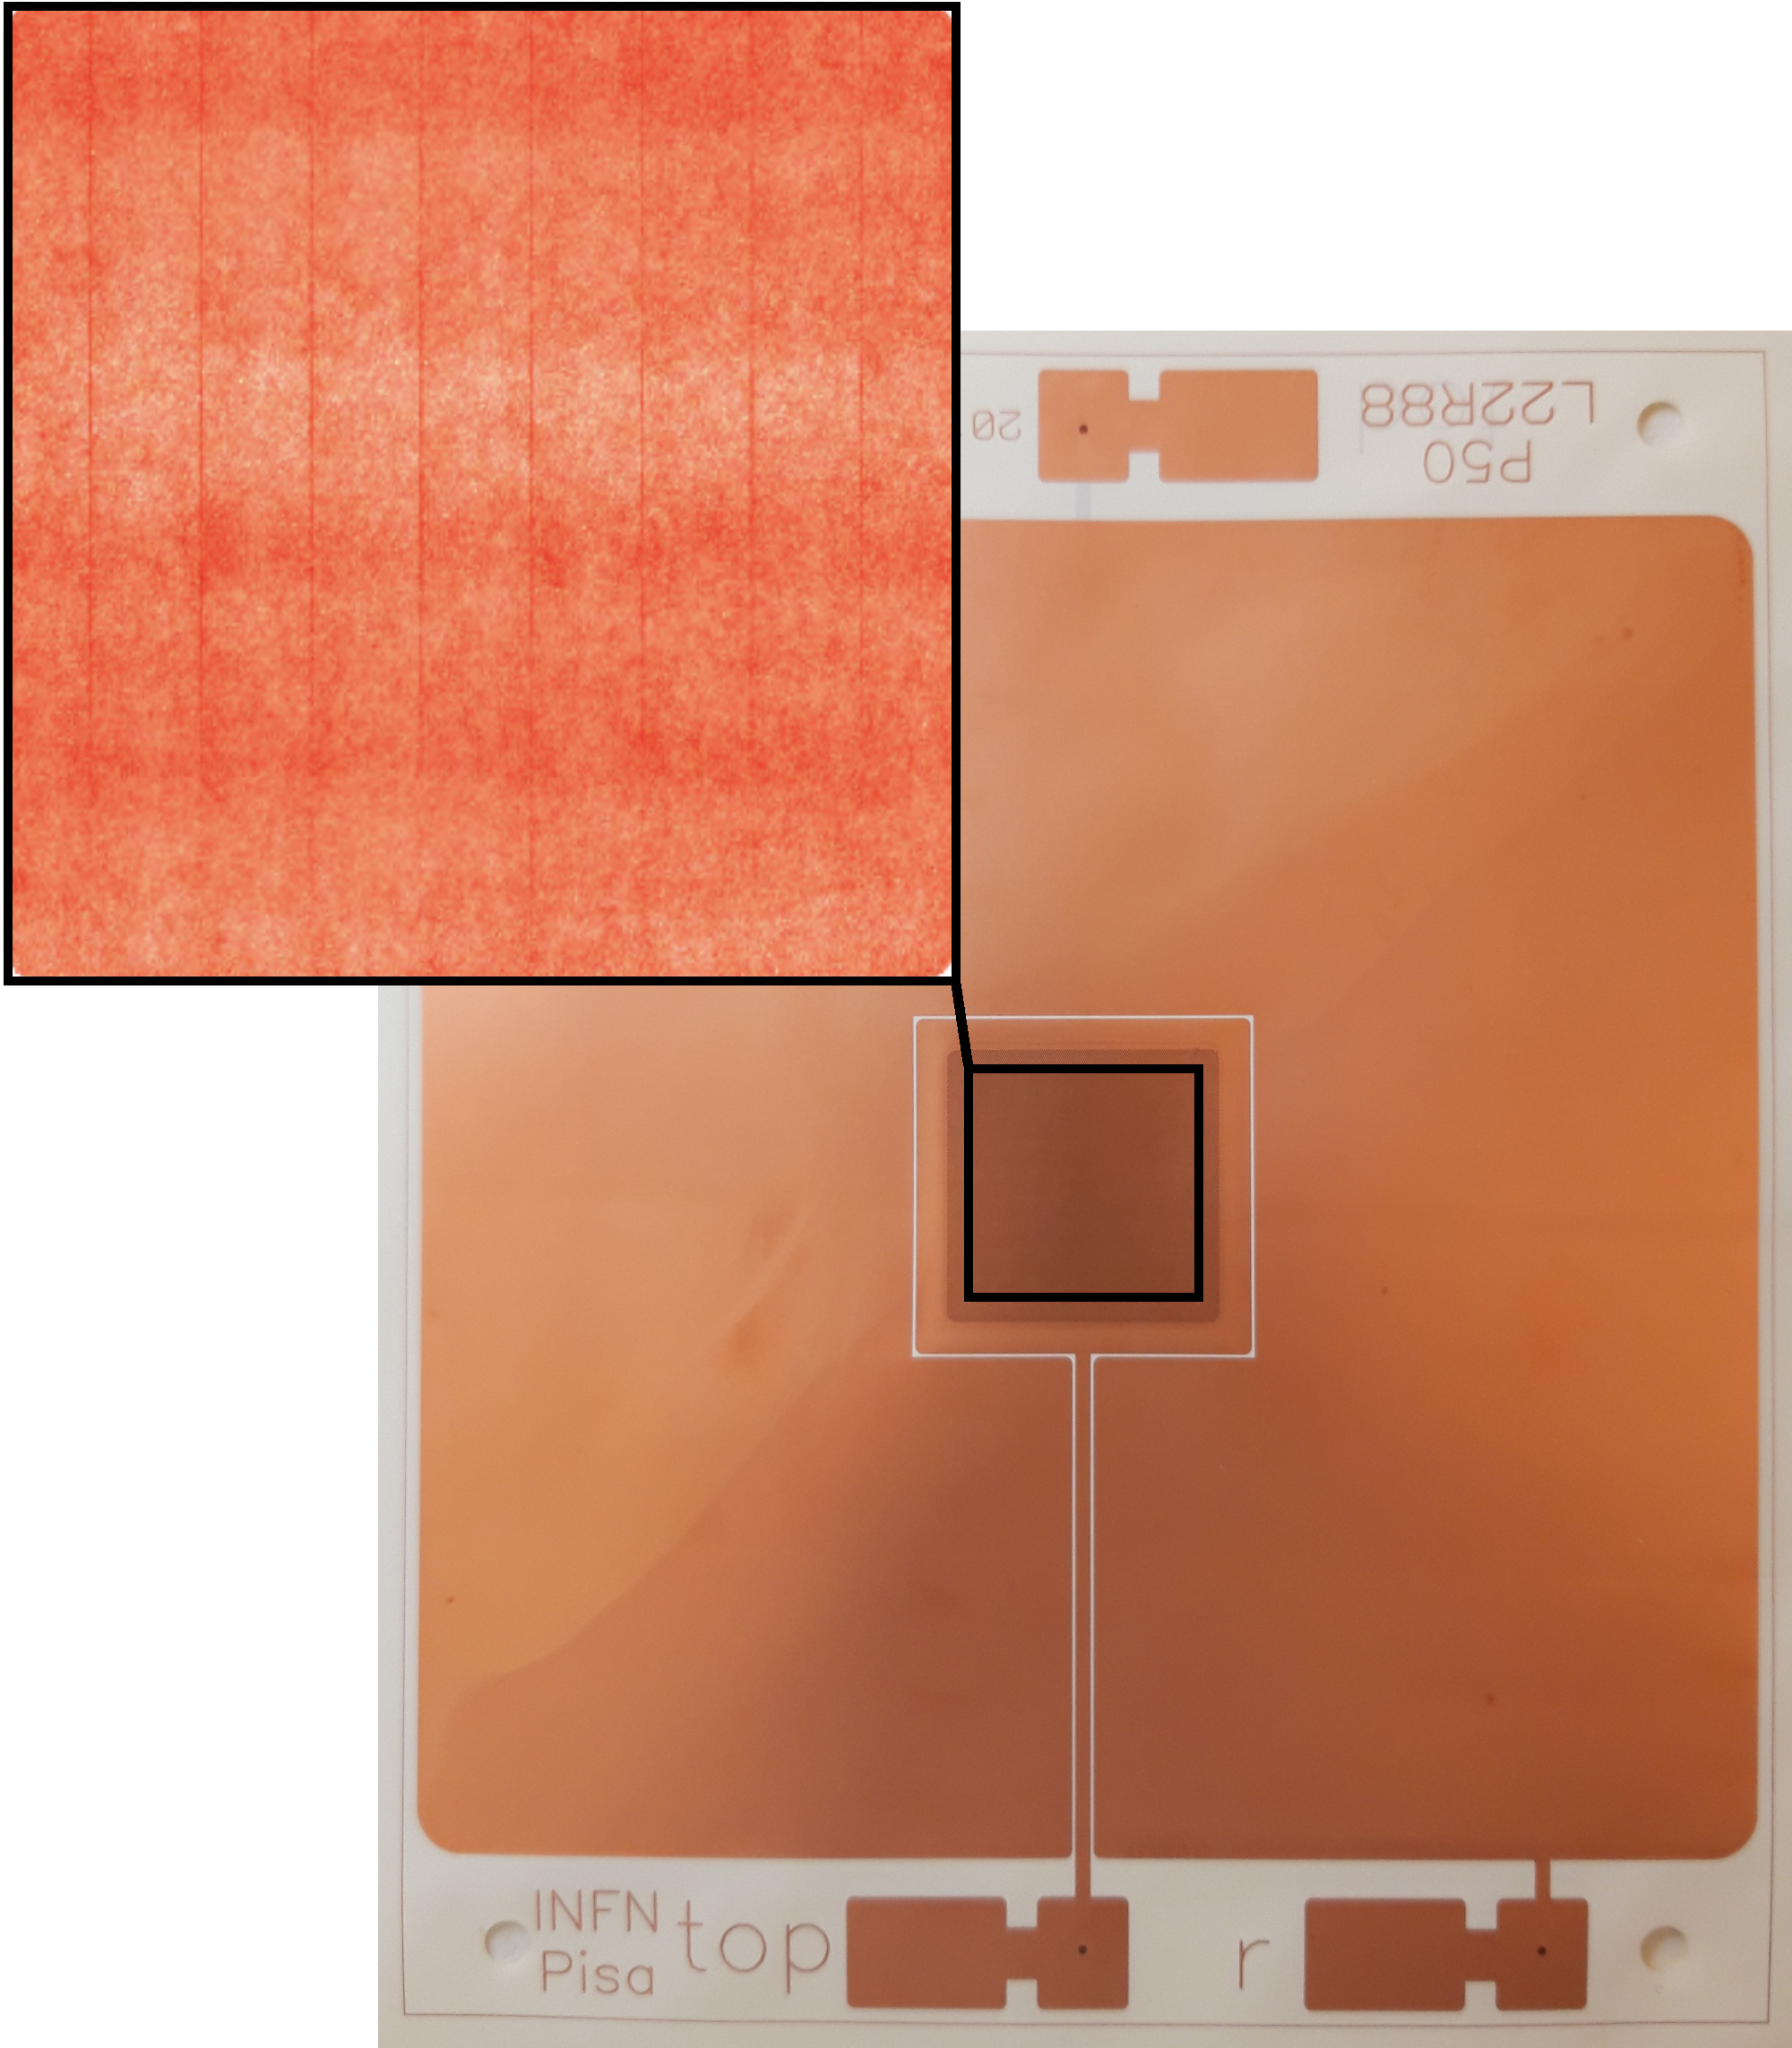
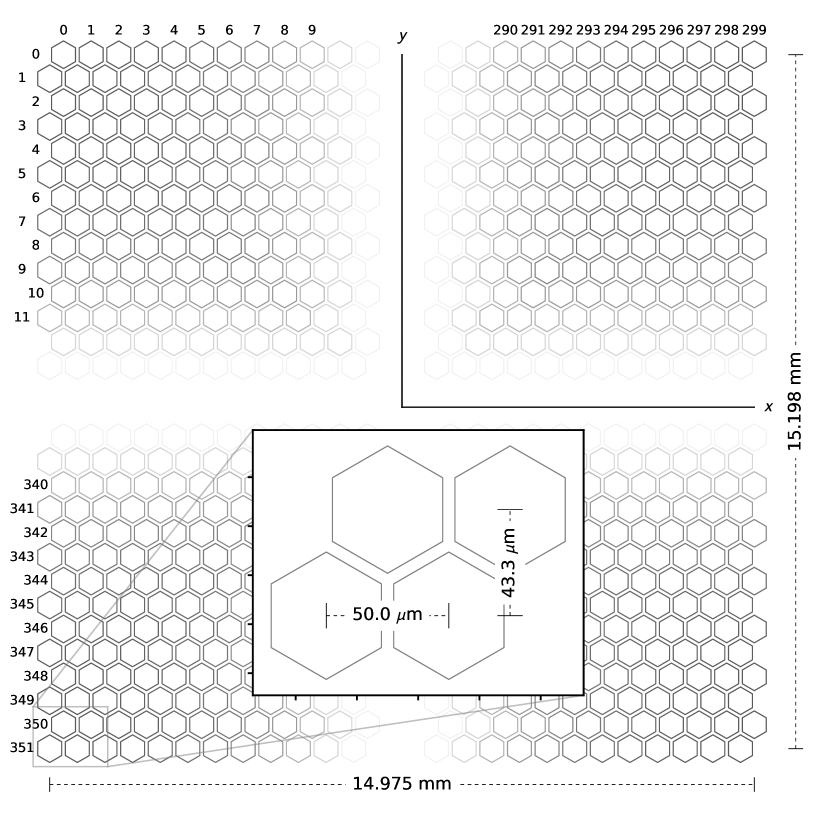
The main characteristics of the GEM are summarized in Table 3, and a picture of a flight model is shown in Figure 5. The hole pattern follows a hexagonal grid matching the pitch of the ASIC. The active area of the GEM is mm larger, on all four sides, than that of the readout ASIC, to compensate for a possible misalignment in the assembly. A guard ring of about cm surrounding the top face of the GEM, matching the footprint of the drift electrode, helps improving the uniformity of the drift field and reducing possible edge effects.
3.1 GEM Manufacturing
Although the details of the GEM manufacturing is not the primary focus of this paper, the matter is relevant for the discussion of the systematic effects in Section 7. The GEMs are produced by SciEnergy in Japan in collaboration with RIKEN. Roughly speaking, the manufacturing process can be broken up into three main steps: (i) the holes are drilled in the top and bottom copper layers through standard chemical etching; (ii) the foil is irradiated with a de-focused laser to drill the holes into the dielectric substrate, with the residual copper acting as a mask; (iii) a wet-etching post-processing is applied in order to polish the copper surfaces and ensure the necessary robustness against micro-discharges.
Among the three manufacturing steps, the second is noteworthy in that it leaves a definite geometrical imprinting in the GEM foils. The laser drilling of the substrate is achieved by using a mm-wide laser beam sweeping the GEM active surface multiple times to cover the entire area, with a small overlap of about m between successive passes. In order to reduce the amount of heat that needs to be dissipated in the process, the holes are drilled halfway through from the top GEM surface, with sweeps in the vertical direction, and completed from the bottom surface with sweeps in the horizontal direction. The net result is that even a naked-eye optical inspection of the GEM reveals 8 thin horizontal stripes and 8 thin vertical stripes (spaced by 1.8 mm) at the overlap positions of adjacent laser sweeps, as shown in the inset in Figure 5.
At a microscopic level this affects the properties of the holes in a way that, as we shall see in Section 7, has important implications for the polarimetric response of the detector.
3.2 GEM Screening and Functional Tests
Each finished GEM foil undergoes a thorough optical metrology to assess the accuracy in the mask alignment, the overall quality of the holes across the active surface and the possible presence of visible defects. This provides valuable information for the selection of the foils to be used for flight detectors. The initial screening proceeds with basic electrical tests: a verification of the isolation between the top and the bottom electrodes (up to 250 V in air) and a measurement of capacitance of the GEM and the ring.
Most of the functional tests prior to the integration of the actual detectors are performed in a test-box setup equipped with a readout ASIC identical to those used for flight and with a series of spacers specifically designed to hold the GEM in place and apply the high-voltages on the proper soldering pads by mechanical pressure (i.e., without the need to solder the cables on the pads themselves). The box is fluxed with a mixture of Ar/CO2 70/30 at atmospheric pressure, and a thin window acting as the drift electrode allows us to test of the assembly with a radioactive 55Fe source, in a geometrical configuration similar to the flight detectors. While the gas mixture used in the test box is not suitable for measuring the polarimetric response, it is useful to measure the energy resolution and the gain uniformity of the GEM with X-rays, as well as the possible presence of localized defects (e.g., dead or hot spots) to be correlated with the outcome of the optical inspection. (We emphasize, however, that the quality of the batches used for the GPD flight production was outstanding, with little or no presence of such defects.)
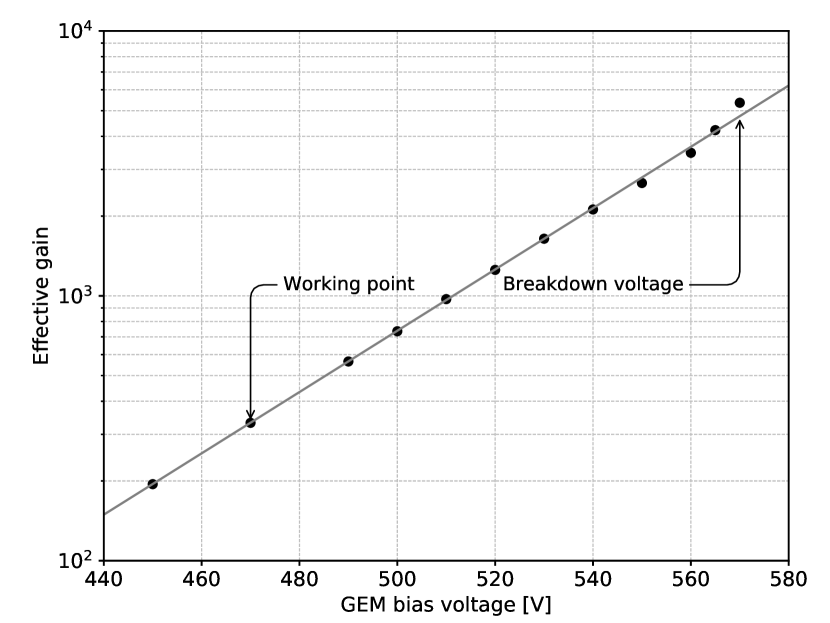
In addition to the standard tests that all the GEM foils undergo, we do perform sample destructive measurements on at least one foil per batch in a test setup with a single readout pad connected to a charge amplifier. Figure 6 shows a typical GEM gain characteristics in Ar/CO2 70/30 at 1 bar, increasing exponentially at a rate of per V (i.e., doubling every V). Due to the low readout noise, we typically operate at a gas gain of a few hundreds, and the breakdown voltage is V above our working point, at an effective GEM gain more than times larger. The excellent uniformity of the gain characteristics, with the index of the exponential typically varying by across different GEM foils, provides evidence that we will safely operate in space, far from the discharge regime333Strictly speaking these figures are measured with a different gas mixture with respect to the one used in flight, but the gain characteristics in pure DME at 800 mbar are very similar—modulo a slightly lower normalization, roughly corresponding to a difference of V in bias voltage. In addition, the quenching properties of the DME provide additional robustness against micro-discharges..
4 The Readout ASIC
The ASIC [8, 9] acts as a readout anode for the GPD. The chip, based on 0.18 m CMOS technology, integrates more than 16.5 million transistors and is organized as a matrix of 105,600 pixels (300 columns at m pitch and 352 rows at m pitch) with a mm2 active area, as shown in Figure 7 and Table 4.
| Parameter | Value |
|---|---|
| Number of pixels | |
| Horizontal pitch | 50.00 m |
| Vertical pitch | 43.30 m |
| Shaping time | 4 s |
| Pixel gain | mV fC-1 |
| Pixel Noise | ENC |
| Dynamic range | 1 V () |
Each pixel is composed of a hexagonal metal electrode connected to a charge-sensitive amplifier followed by a shaping circuit. The ASIC provides a built-in, customizable self-triggering capability, complemented with an on-chip signal processing for automatic localization of the event. Upon trigger, the maximum of the shaped pulse is stored inside each pixel cell for subsequent readout. Additionally, the chip features an internal charge-injection system that can be used to stimulate any pixel in the matrix, for diagnostic and calibration purposes.
4.1 Back-End Electronics
The Back-End Electronics (BEE) is responsible for all the commanding and control of the readout chip, as well as the generation of low- and high-voltages for the detector and the handling of the science data and telemetry interfaces [15]. At the hardware level, the BEE consists of three distinct electronic boards plugged onto a common backplane: a low-voltage power supply, a high-voltage power supply and a data acquisition (DAQ) board. (For completeness, all the tests described in this paper have been performed with a commercial HV power supply, since models with flight-like design were not yet available for this activity.)
The DAQ board incorporates two fundamental components of the GPD operation, i.e., the analog-to-digital converter for the serial readout and the Field Programmable Gate Array (FPGA) controlling the ASIC configuration, control and readout, as well as the data formatting and the communication with the detector service unit. The ADC on the DAQ board has a resolution of 14 bits over a 2.4 V full dynamic range, or a voltage resolution of 0.146 mV/ADC count. Coupled to the nominal pixel gain, this translates into a charge characteristics for the whole system of 2.3 electrons/ADC count. The V dynamic range of the pixel amplifiers in the readout ASIC results in a saturation value of about ADC counts, more than 5 times larger than the typical pixel signal in the Bragg peak at the nominal GEM gain. Table 5 shows a summary of the basic characteristics of the readout electronics.
| Parameter | Value |
|---|---|
| Dynamic range | V ( V to V) |
| ADC Resolution | bit |
| ADC voltage resolution | mV fC-1 |
| Charge characteristics | per ADC count |
| Typical gain | ADC counts keV-1 |
4.2 Event Triggering
At the very fundamental level every 4 adjacent pixels (see the inset in Figure 7) are logically OR-ed together to contribute to a local trigger with a dedicated, fast shaping amplifier. This basic building block of pixels is called a trigger mini-cluster, and is central to the entire machinery of event triggering and readout.
Upon trigger, the event is automatically localized by the ASIC in a rectangle containing all triggered mini-clusters plus a padding of 4 or 5 additional ones444Since, in normal operating conditions, only the part of the track with the largest specific ionization (i.e., the Bragg peak) participates into the trigger, the padding serves the fundamental purpose of capturing to the readout the entire track—including the parts with a relatively low ionization density. along the and coordinates, respectively, in order to compensate as much as possible for the uneven aspect ratio of the mini-cluster. More specifically, the chip calculates the coordinates of the upper-left and lower-right corners of such a rectangular region of interest (ROI), and limits the serial readout to the subset of pixels (typically 500–800) within that ROI. This allows for a reduction of the readout time of more than two orders of magnitude, compared to that for a complete frame.
4.3 Event Readout and Pedestal Subtraction
Upon definition of the region of interest, the serial readout proceeds driven by a dedicated readout clock, generated by the back-end electronics. The analog output of each pixel is sequentially routed to the differential output buffer of the ASIC, which in turn is connected to the ADC on the DAQ board. The typical settling time of the output buffer is of the order of ns, which limits to about 5 MHz the maximum clock frequency that can be used for serial readout without introducing potential readout artifacts.
During nominal data taking the region of interest corresponding to each physical track is read out two times in close succession. The readout following the first one is used by the DAQ board to perform a pedestal subtraction, and the resulting stream is zero-suppressed and compressed prior to being passed downstream. At the cost of a larger dead time, the event-by-event pedestal subtraction largely mitigates a class of potential subtle systematic effects that we shall discuss in more detail in Section 7.1. In addition, this readout strategy compensates for any potential dependence of the pedestals on the environmental conditions (e.g., the temperature).
5 GPD Assembly
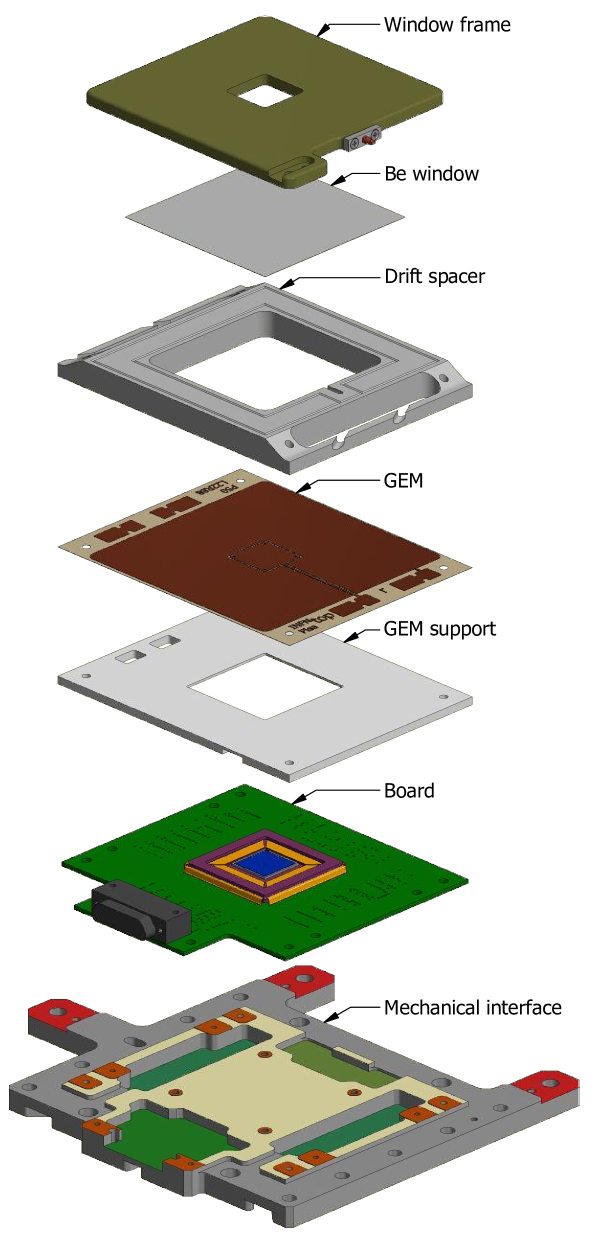
Figure 8 shows an exploded view of the basic GPD elements. The first and foremost challenge in the GPD assembly is for the stack of the various components, made of different materials and with different thermal expansion coefficients, to be able to sustain several thermal cycles for the glue to cure, and a final bake-out at high temperature, and yet guarantee a leak tightness better than mbar l-1 s-1, which is necessary for the sealed gas cell to operate throughout the duration of the mission. In addition, this must be accomplished within a tolerance envelope tight enough to allow for co-alignment of the detector active surface and the mirrors, once the Detector Units are integrated in the satellite. Finally, the tight out-gassing requirements severely limit the choices of the materials and the adhesives that can be practically used.
The GPD assembly—including the wire-bonding of the readout ASIC in its package and the positioning of the latter on the GPD board, the assembly of the gas cell, the metrological verifications and the initial leak test—was entirely performed in house, using the INFN facilities. The assembly procedure was developed in collaboration with our historical industrial partner, Oxford Instruments Technologies Oy in Finland (which also performed the final bake-out and filling of the detectors) and further refined through phases A and B of the mission.
5.1 GPD Board Assembly
The lowermost element of the GPD stack is a custom-design titanium frame, acting as a support for the structure and as a mechanical reference for the entire assembly process. The titanium frame hosts all the elements to control the GPD temperature (two heaters on the top face, two heaters, temperature sensors and a Peltier cell on the bottom one) and is the main thermal path for dissipating the heat from the readout ASIC. It is also the key element for the alignment of the detectors and the associated X-ray optics, thanks to three dedicated fingers (shown in red in Figure 8) that remain accessible throughout the satellite integration.
The readout ASIC is bonded with conductive glue on a commercial ceramic package, using a custom mechanical tool to control its positioning. The chip is then wire-bonded to the pads on the package using a standard wedge-bonding technique, and the package is glued and soldered on its printed circuit board (PCB). Finally, the PCB is glued on top of the mechanical interface, as shown in Figure 9, using positioning pins for controlling the alignment and maintaining it while the glue cures at high temperature.
The mechanical precision of this partial assembly is critical to control the thickness of the GPD transfer gap, and to guarantee that the active area of the detector and its optics can be properly co-aligned. As such, it is verified via optical metrology on a detector by detector basis. The precision in the positioning of the ASIC is at the level of m in the vertical direction, and m in the detector plane.
5.2 Gas Cell Assembly
The assembly of the gas cell can be divided in two parts: we first mount the GEM on its support frame and the beryllium window on the titanium drift frame, and then we stack these two partial assemblies on top of the GPD board.
The GEM is bonded to its ceramic (Shapal) support by applying a uniform tension by means of a dedicated tool holding the GEM on a circular frame like the skin of a drum. The GEM support is then glued directly on the PCB using alignment pins, as shown in Figure 10. We emphasize this is one of the crucial steps of the assembly, as the gluing between the GEM bottom and the ASIC package needs to guarantee a complete leak-tightness with no possibility of further intervention.
The top sub-assembly is prepared in parallel, gluing the entrance window to its titanium frame. The window is made from a -thick, optical grade, high-purity beryllium foil, and a thin ( nm) aluminum layer is sputtered on the inner face to enhance the leak-tightness. The electrical contact between the window and the frame is guaranteed by means of conductive glue, and output of the drift channel of the high-voltage power supply is connected directly to the titanium frame. The latter is also holding the small copper tube used for the gas filling.
At this point the drift titanium frame is glued to a 1 cm-thick ceramic (Macor) spacer, defining the X-ray absorption gap, and the result is glued to the top of the GEM, completing the stack. After the mechanical assembly is completed, we measure the final leak rate to confirm it is below our requirement of mbar l-1 s-1.
5.3 Bake-out and gas filling
The bake-out, filling and sealing of the detectors is performed by Oxford Instruments Technologies Oy in Espoo, Finland. The GPD is first connected to a vacuum system and placed in a temperature-controlled chamber at 100 ∘C for at least 14 days. A secondary pump is connected to a flange placed on top of the entrance window in order to reduce the differential pressure on the window itself during the bake-out cycle.
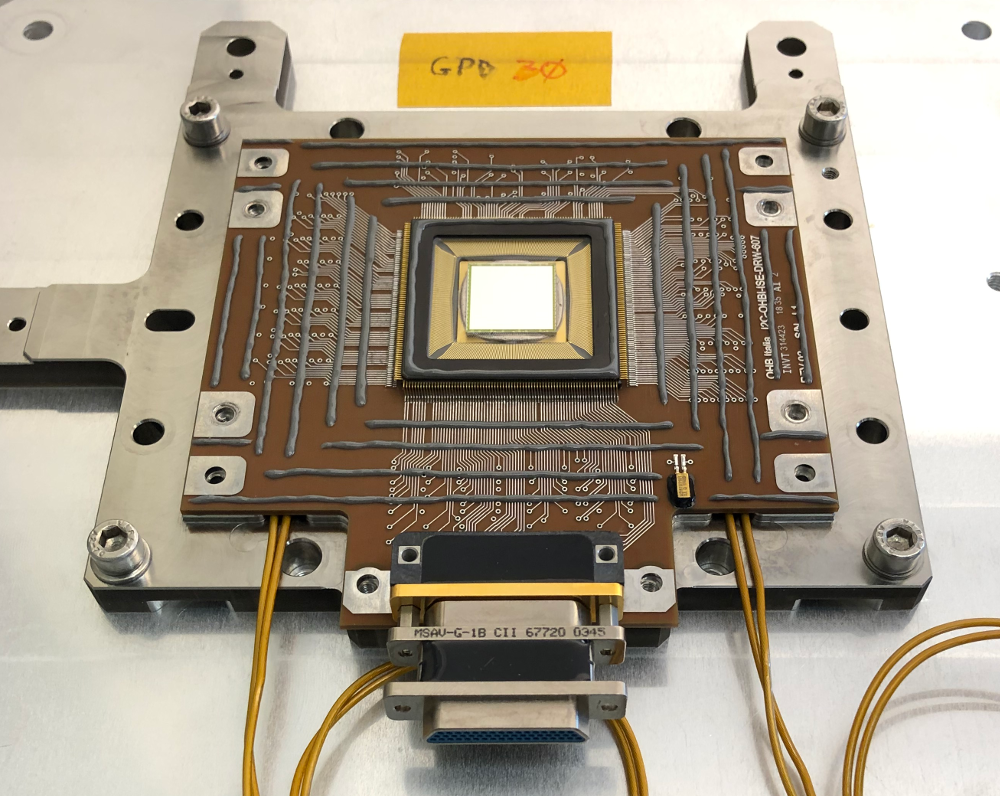
Once the bake-out process is completed, the detector is brought back at room temperature, tested for leak-tightness one final time to exclude possible damage during the bake-out, and filled with purified DME at the desired pressure (i.e., the equivalent of 800 mbar at 20 ∘C). After the filling tube is crimped to the final length, the complete detector, as shown in Figure 11, is equipped with high-voltage cables and ready for functional tests.
6 Detector Characterization
We produced 9 flight GPD—out of which four were chosen to be installed in the (three plus one spare) Detector Units (DU). All of them were extensively tested to verify their basic performance as focal-plane detectors (see Table 6) using a dedicated test setup at INFN and the calibration facility at IAPS later used for the calibration of the DUs. We found all the detectors to show very similar performance metrics, as we shall detail in the remainder of this section.
| Parameter | Typical value |
|---|---|
| Effective noise | 22.5 electrons ENC |
| Gain uniformity | |
| Energy resolution | FWHM at 5.9 keV |
| Position resolution | m rms |
| Modulation factor | % @ 2.7–6.4 keV |
| Spurious modulation | at 5.9 keV |
| Trigger efficiency | % down to 1 keV |
| Dead time per event | ms at 2.7 keV |
6.1 Event Reconstruction
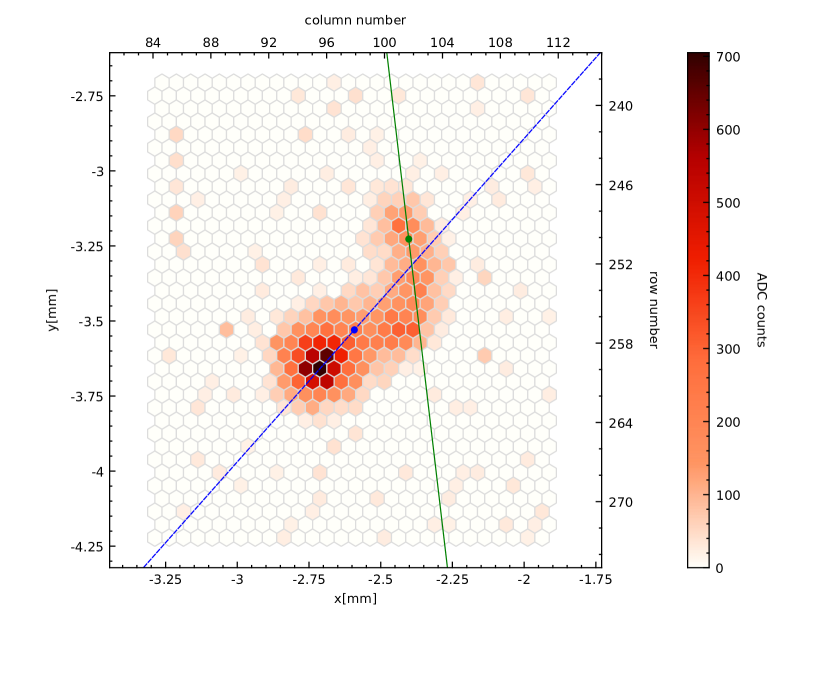
Since the event-level analysis plays an active role in determining the detector performance, we start this section by illustrating the basic steps involved in the processing of the track images, such as that shown in Figure 12. The track reconstruction starts with a zero suppression, followed by a clustering stage (based on DBSCAN [16]) aimed at separating the physical photoelectron track from the residual noise pixels. The reconstruction proceeds with a moment analysis around the barycenter to identify the principal axis of the two-dimensional charge distribution. As most of the energy is deposited in the Bragg peak at the end of the photoelectron path, the longitudinal charge profile can be used to discriminate the track head from its tail and estimate the photon absorption point. Finally, a second moment analysis is run, de-weighting the pixels close to the end of the track, to get a more accurate estimate of the photoelectron emission direction. At the very basic level, the reconstruction provides estimates of the event energy, photon absorption point, photoelectron direction emission, as well as a series of topological variables characterizing both the region of interest and the physical track, e.g., the size, the longitudinal and lateral extension and the charge asymmetry.
The reader is referred to [17] for more details on the standard analysis of track images. We also point out that recent developments in this area based on machine-learning techniques [18, 19], while providing significant improvements in polarimetric sensitivity, are not directly relevant for the lower-level detector performance that is the main focus of this work.
6.2 Noise, Gain, and Uniformity of Response
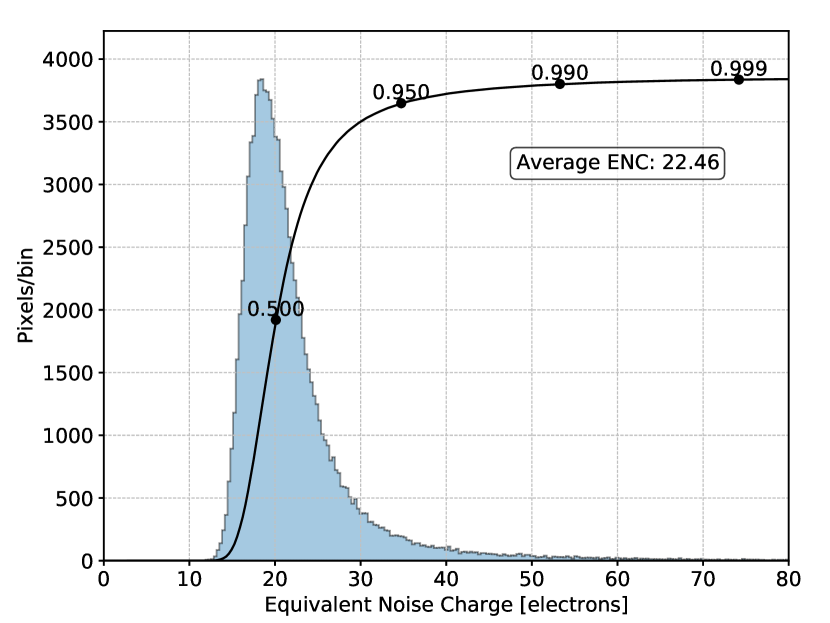
We measure the noise of each pixel using the ASIC internal charge injection system and looking at the non-triggering pixels in the ROI. Figure 13 shows a typical distribution of the equivalent noise charge. The average value is electrons rms, with only about one pixel in a thousand exceeding electrons, and no significant spatial pattern across the active surface. Due to the double-readout strategy used for nominal science acquisitions, the effective noise is a factor higher; yet, even at a gas gain as low as , we are sensitive to the single primary electron at more than .
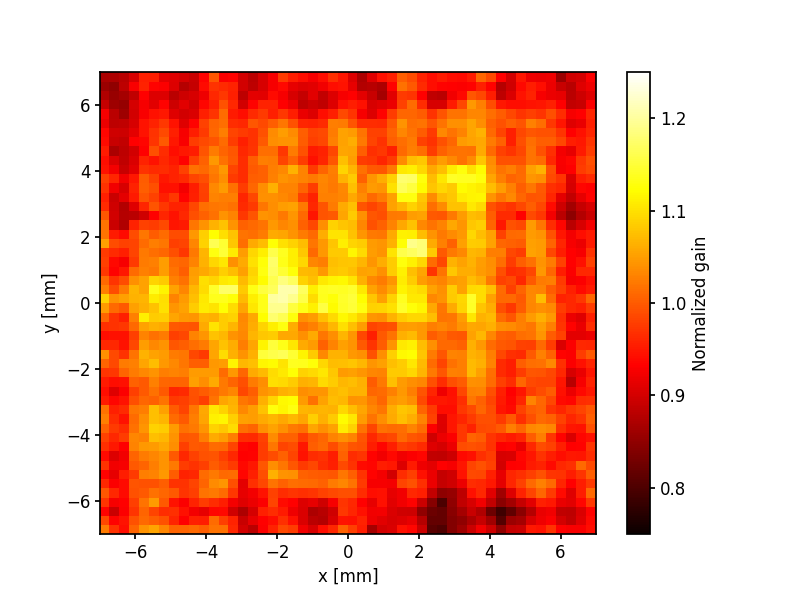
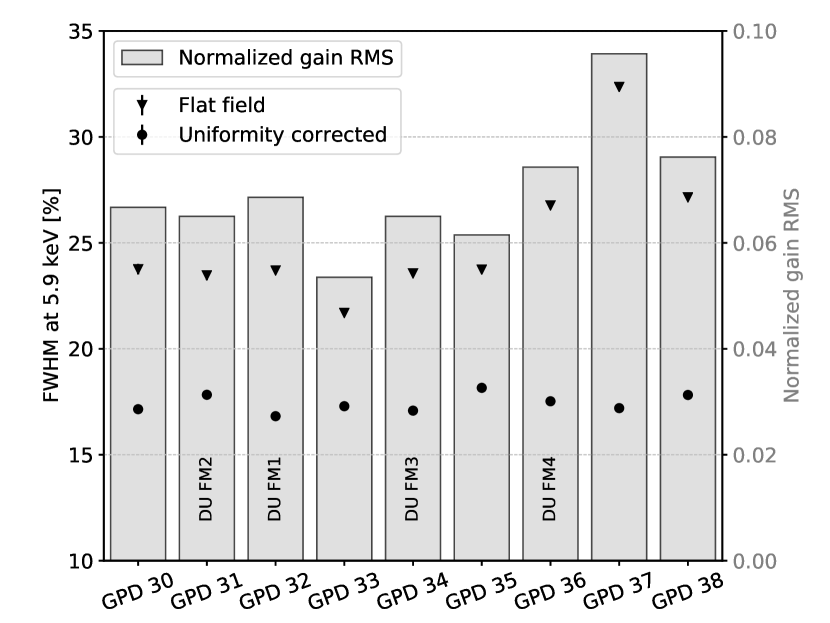
The uniformity of response is typically measured with a flat field (i.e. a beam with almost uniform illumination covering the whole detector surface) using 5.9 keV X-rays from a 55Fe source. The corresponding map of normalized gain—an example of which is show in Figure 14—is also useful to verify the absence of defects (e.g., hot or dead spots) on the active surface. The large-scale gain non-uniformity, which we ascribe to small variations in the thickness of the GEM foil, is characterized by the dispersion of the gain values, and is typically better than rms. (This metrics for all the flight models is represented by the gray histogram in Figure 17.) The vertical and horizontal patterns that are visible with a pitch of mm, on the other hand, are a clear imprinting of the manufacturing process described in Section 3.1 and are likely connected with a spatial modulation of the microscopic hole inner structure, of which we have circumstantial evidence from the optical metrology.
We further emphasize that, somewhat counter-intuitively, the reconstructed event direction is extremely robust against these mid- and large-scale gain variations, although important to recover the ultimate energy resolution, has little or no effect on the polarimetric response of the detector.
6.3 Trigger Efficiency
We typically operate the GPD at an effective trigger threshold of electrons of signal counts, which allows us to achieve a noise trigger rate Hz with only handful of noisy pixels masked—typically less than one in 10,000, or the very far outliers in the distributions shown in Figure 13. This ensures full efficiency with a fairly large margin, as illustrated by the threshold scan in Figure 15.
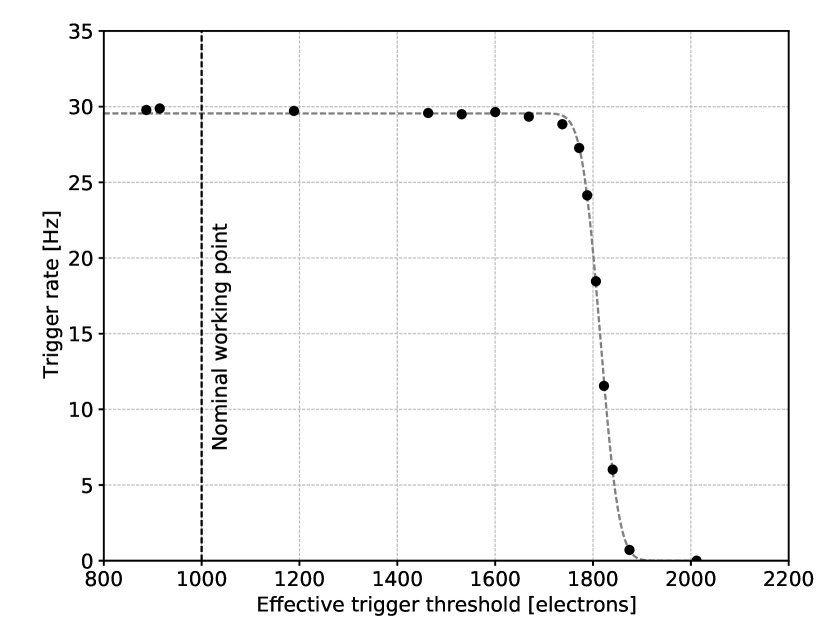
Since the trigger mini-clusters involved in the trigger are primarily those produced by the Bragg peak of the track, and the latter is energy-independent, the metrics shown in Figure 15 apply equally well to the entire IXPE energy band. As mentioned in Section 4, the padding in the definition of the region of interest ensures that the beginning of the track, with a comparatively lower ionization density, is captured in the readout even if the corresponding pixels do not trigger up to the highest energies of interest.
6.4 Pulse Height Analysis and Energy Resolution
Figure 16 shows a typical pulse height spectrum of a 55Fe source, corrected for the spatial non uniformity of response. The energy resolution is of the order of % FWHM at 5.9 keV for all the flight detectors, as shown in figure 17, scaling approximately with the square root of the energy. We have monitored the energy resolution for all the flight detectors over temporal baselines of years without detecting significant variations, which is indirect evidence of the leak-tightness of the detectors and of the quality of the assembly—as any small electro-negative contaminants in the gas cell would have catastrophic consequences on the energy resolution.
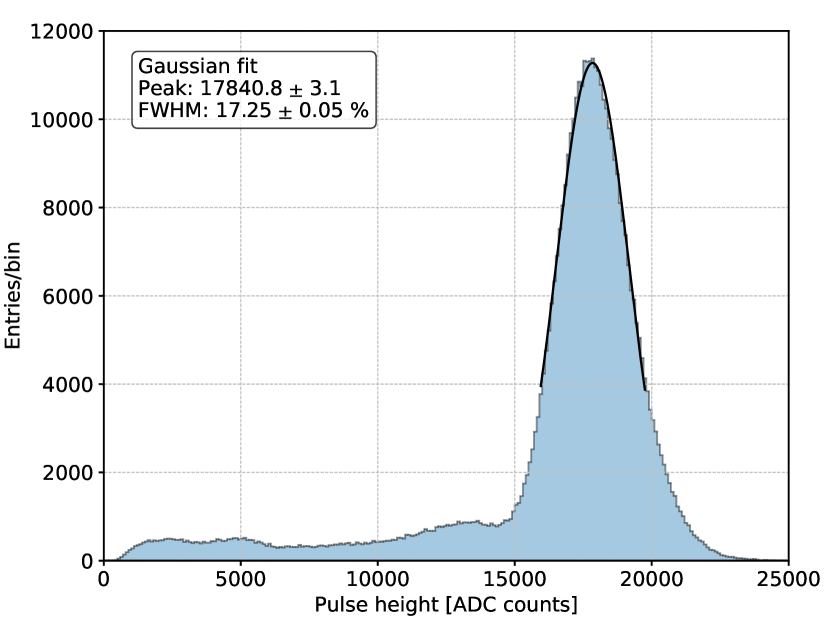
Not all the events triggering the readout originate in the active gas volume—occasionally photons absorbed in either the entrance window (and particularly in the 50 nm inner aluminum layer) or on the upper copper face of the GEM can produce a photoelectron that leaves the passive material depositing enough energy in the gas cell. Such events, characterized by incomplete charge collection, account for the vast majority of the low-energy tail in the pulse-height spectra. The relative frequency of these passive conversion (Figure 16), estimated from a detailed Monte Carlo simulation of the detector, is less than 2% at 2 keV, increasing with energy to almost 15% at 8 keV, and needs to be modeled and calibrated using ground data in order to have a detailed description of the instrument response functions—the effective area, the energy dispersion and the polarimetric response.
6.5 Polarimetric Response
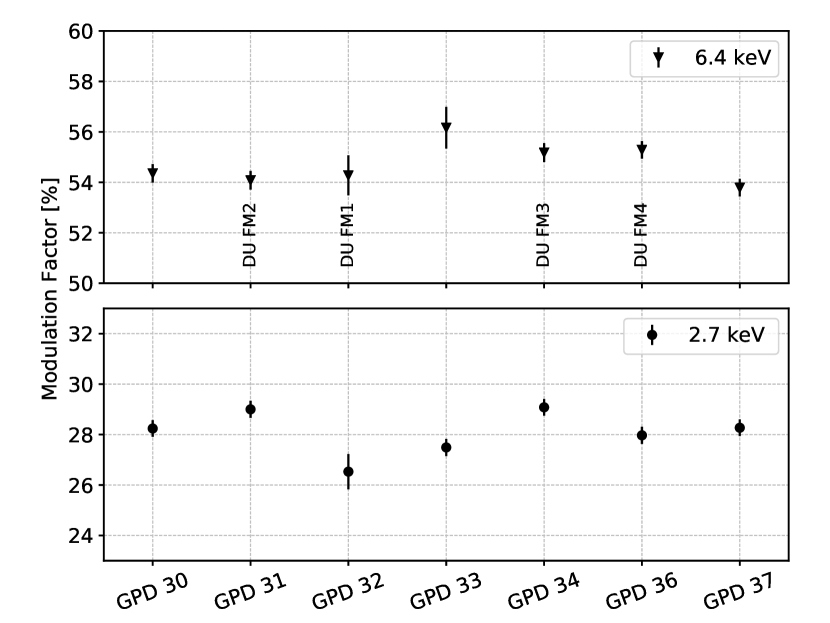
The modulation factor is routinely measured at two discrete energies (2.7 and 6.4 keV), and for a set of different points on the active surface, for all the flight detectors as part of the standard acceptance tests (prior to the integration of the detector units). Figure 18 shows the typical modulation curves, for 2.7 and 6.4 keV, polarized and 5.9 keV unpolarized X-rays. The polarimetric response is fairly uniform across different detectors, as show in Figure 19. The actual calibration of the flight detector units is significantly more extensive, and will be covered in details in a separate paper.
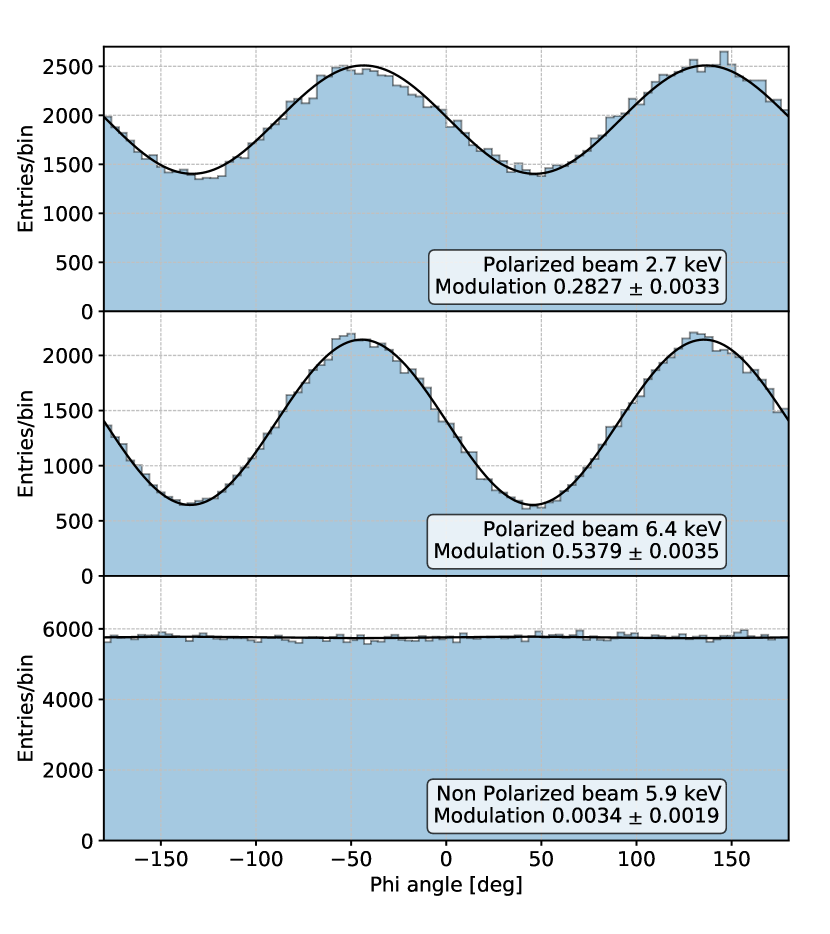
While the GPD polarimetric response to un-polarized radiation shows little or no sign of systematic effects at 5.9 keV (i.e., the bottom modulation curve in Figure 18 is statistically consistent with a uniform distribution), we found a small but significant spurious modulation at lower energies, varying across the active detector surface, that needs to be properly calibrated and corrected to meet the IXPE science goals. We shall discuss the instrumental origin of such spurious modulation, that we circumstantially traced back to the microscopic structure of the GEM holes, in Section 7.1. The detailed calibration and correction strategy have been performed; however, a detailed description is beyond the scope of this paper and will be provided elsewhere. (See also Section 7.)
6.6 Spatial resolution
The GPD capability of measuring the X-ray impact point is strictly related to the photoelectron track imaging and polarimetric response. For this reason we did not measure the spatial resolution directly, but relied on the result with polarized beam to indirectly verify the adherence to the expected performance. This choice has been dictated by the tight schedule of the mission. Dedicated measurements are performed during the calibration campaign (including tests with the optics) and will be discussed in separate papers. Here we can anticipate that the expected resolution of m (half-power diameter, on-axis, almost flat in energy) is met, equivalent to 5 arcsec at 4 m, leading to a telescope point spread function (PSF) dominated by the optics’ resolution.
6.7 Dead Time
The dead time per event depends on the specifics of the readout sequence and can in general be factored into two different terms—one constant and one proportional to the number of pixels in the region of interest:
| (2) |
The two coefficients depend on the particular readout settings of the back-end electronics: roughly speaking, is mainly determined by the clock period of the serial readout while relates to the timing constraints imposed by the ASIC for a correct readout, and particularly the fixed delay (s) needed between two successive readouts. (Both figures further depend on the number of additional event readouts used for the pedestal subtraction). In nominal data taking configuration s and ns per pixel, yielding an average dead time per event slightly in excess of 1 ms for a typical ROI of 500 pixels.

Figure 20 shows the time difference between two consecutive events for monochromatic 2.7 keV X-rays (representative of the average energy for a typical astronomical observation) in nominal data-taking configuration. The average dead-time per event is in line with our parametrization Eq. (2). To put things in context, this will enable observations of the Crab Nebula, which is the archetypal prototype of our bright sources, yielding counts per second per detector unit, at overall dead-time.
7 Systematic Effects
Long-term operations and in-depth performance characterization of the many GPDs developed for the IXPE mission unveiled three different sources of systematic effects which add up to the nominal detector operation as presented so far and were never fully documented in previous publications. We find that such effects have different nature and magnitude, and can be strongly constrained by either dedicated calibrations, offline data analysis or specific operation modes of the telescope, with a controlled, small effect on the IXPE scientific throughput.
7.1 Low-energy Azimuthal Response
Early tests of engineering and qualification GPD models with low-energy, un-polarized pencil beams indicated the presence of a residual modulation amounting to an average amplitude of several % at 2.7 keV, rapidly decreasing with energy, and varying over spatial scales smaller than the PSF of the IXPE optics on the detector active surface (i.e., at least down to a few hundred m). All the data we collected indicate that such modulation is stable in time, and not dependent on the temperature, the GEM gain, or the trigger rate, and can be therefore calibrated by means of dedicated ground measurements, and subtracted from science observations at a level consistent with the IXPE design sensitivity.
This systematic, uneven azimuthal response of the GPD, often referred to as spurious modulation, is hard to model from first principles as it results from a sum of different sources whose magnitude is strongly related to the track shape.
A first type of effects show no measurable dependence on the position across the active area of the detector and is therefore straightforward to correct.
-
•
We found that the ASIC digital activity within the readout generates a tiny shift of the baseline for a definite subset of the pixels, not fully canceled by the pedestal subtraction, and manifesting itself as a series of vertical structures affecting the region of interest with an even-odd pattern of electrons amplitude. (This is to be compared to an average pixel noise of electrons and an actual signal of thousands of electrons per pixel in the core of the track.) The ASIC layout incorporates some unavoidable design asymmetries (e.g., column-wise bias voltage distribution, horizontal readout, pixel and mini-cluster footprints) that could in principle account for such behavior. However, the effect is so small that it is necessary to stack thousands of track images to be able to even measure it. Yet, by virtue of its coherent nature, this effect can produce a clear effect at the same frequency of the genuine signal at the level of a few % for low-ellipticity tracks, typical of low energy photons. We therefore measure it and entirely correct it in the offline software.
-
•
When the serial clock approaches the characteristic settling time of the readout chip analog buffer, the shape of the modulation curve can be affected via effective cross talk between adjacent pixels. In such conditions, the signal at the output of the serial buffer is latched too early and this causes subtle deformations of the track image. This effect is mitigated by limiting the readout frequency to about MHz
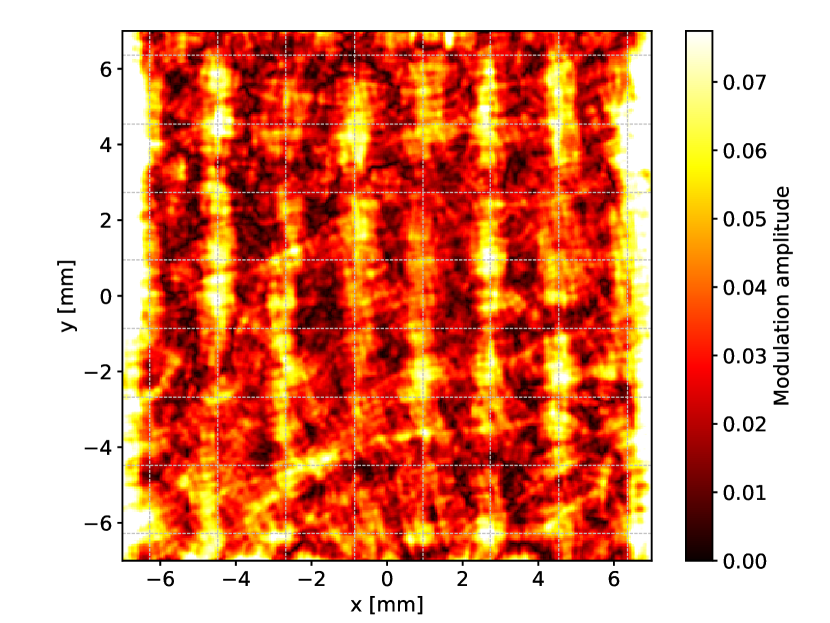
A second type of asymmetric GPD response shows a clear position dependence in high statistics maps recorded from un-polarized beams, such as the one shown in Figure 21. By analyzing these images, we firmly track back the source of this behavior to the GEM manufacturing.
-
•
The features in these modulation maps precisely track the known coordinates of the vertical lines where adjacent laser-drilling sweeps overlap—in other words, the regular pattern in the map, with a 1.8 mm horizontal spacing, is a clear imprinting from the GEM manufacturing process.
-
•
Similar maps from qualification model GPDs assembled with chemically-etched GEM foils show significant differences: (i) the modulation amplitude is considerably smaller when averaged over relatively large regions, although peak magnitudes can be similar; (ii) no coherent pattern between different detectors was seen, clearly reflecting the different mechanisms used to drill the holes in the dielectric (laser-based, inherently regular, vs. chemical).
All the data we have collected unambiguously exclude gain non-uniformity in the GEM as the cause of the spurious modulation. Although toy Monte Carlo simulations show that a stretch of the effective pitch of the GEM holes in one of the two orthogonal directions as small as could explain the observed modulation, provided that it is characterized by a coherence length of the order of the track size (a few hundred m), the effect is too small to be measured directly with optical scans.
Correcting similar effects by mapping the response of each GPD down to the spatial scales of the detector PSF is in principle possible, but prohibitively time-consuming when considering the necessary statistical accuracy, the total number of flight units and the multiple energy layers to be calibrated. (For reference, Figure 21 alone required 250 hours of un-interrupted dedicated calibrations.) The decision was then taken to smooth these effects by dithering the Observatory along the line of sight for nominal science observations. The dithering effectively broadens the image of the source in detector coordinates (in our case over several mm2 for a point source) while preserving the intrinsic angular resolution of the telescope. Averaging over a larger area is beneficial as it decreases the average modulation amplitude thanks to partial cancellation due to phase incoherence. We shall address the details of the calibration procedure and its statistical treatment as an effective background component for the observations of celestial sources, in an upcoming companion paper.
7.2 Rate-Dependent Gain Variations
Although one of the primary reasons for the choice of the laser etching technology was the observation that standard-pitch (m) GEM foils produced with this process are largely immune to rate-dependent gain instabilities [14], this desirable property does not carry over to the very fine pitch of the IXPE GEMs. When the detector is irradiated, part of the charge from the avalanche can be temporarily deposited onto the dielectric substrate of the GEM, modifying the configuration of the electric field, and causing local (and reversible) changes in the gain. This was actively investigated through the development phase of the mission, and mitigated by fine-tuning specific steps of the GEM manufacturing process. Nonetheless, a residual effect at the level is still present in the IXPE flight units.
The basic phenomenology of this charging is a definite decrease of the GEM gain, when the detector is irradiated at a sufficiently high rate. The asymptotic gain value and the time-scale associated to the gain variations both depend on the input energy flux. As the charge trapping is not permanent, a competing discharging process, with a much longer associated time scale, is continuously at play, causing the gain to recover, provided that the input energy flux is low enough. We have developed a simple phenomenological model of the effect, described in A, that allows us to predict and correct the gain variations, based on the energy flux measured by the GPD itself as a function of time and position.
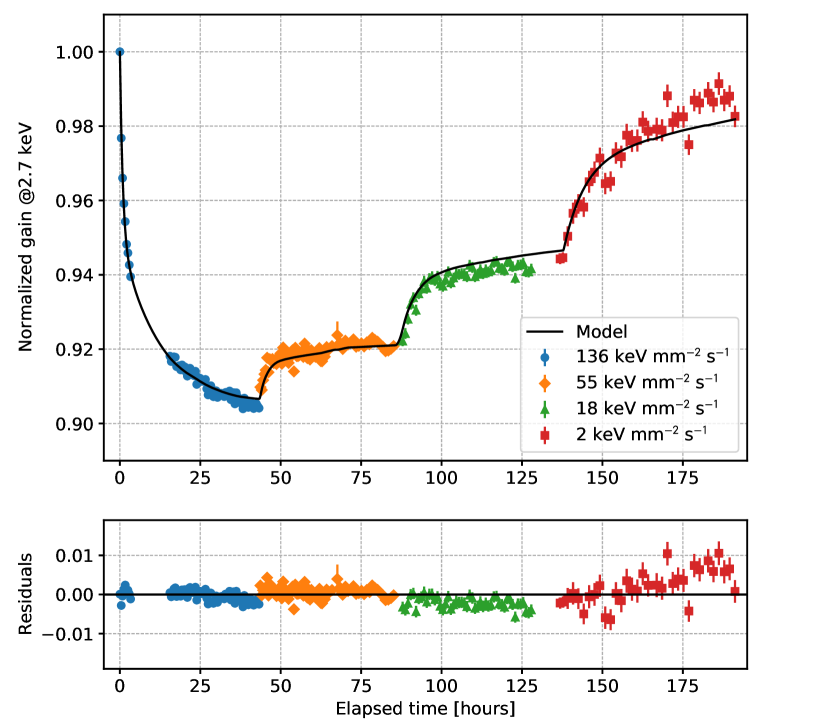
We verified the accuracy of this description by irradiating the detector with X-ray sources at different energies and rate per unit area. Figure 22 shows an example of a data acquisition performed for the purpose of studying the charging and extracting the model parameters necessary for its dynamic correction. Although typical X-ray celestial sources can induce about a few charging effect, as illustrated in A, IXPE will also observe brighter sources throughout its operations. Consequently, gain variations over very different time scales, spanning from minutes to days, are to be expected. We shall rely on a dynamic correction of such variations based on our phenomenological model, tuned for each detector unit using dedicated ground calibrations, and informed by periodic on-orbit calibrations.
7.3 Secular Pressure Variations
One unexpected realization of the development of the IXPE instrument was the fact that the pressure in the GPD gas cell decreases with time, over time scales of months, with an overall asymptotic deficit of about mbar, compared to the nominal 800 mbar at filling time.
The first indirect hint of this phenomenon was a slow change with time of the gas gain, that was then connected to a deficit of internal pressure based on the calibration of the absolute quantum efficiency, which will be described in a subsequent paper. While we have no direct measurement of the internal pressure of the gas cell, our continuous monitoring of key detector parameters for the flight detectors consistently support this scenario: the average track length (and the modulation factor as a consequence) increase with time, while the event rate from a reference source decreases accordingly, as shown in Figure 23. Furthermore, metrological measurements independently confirm that the vertical position of the center of the beryllium window changes continuously due to the pressure reduction (this is further discussed in B). The effect tends to saturate with time—and, in fact, all the detectors installed in the flight detector units will be within a few % from the asymptotic pressure value by the time IXPE is launched.
Although the root cause of the effect is unknown, it is clear that the phenomenon is not due to a real leak between the gas cell and the external world (which is by the way excluded by the leak tests performed at various stages of the GPD assembly) because the energy resolution of all the flight detectors, with no exception, does not show any sign of worsening with time. Additionally, we have experimental indications that the effect is largely reversible by heating the gas cell at high ( C) temperature—and therefore, in all likeness physical, (as opposed to chemical) in nature.

As further discussed in B, we devised a simple analytical model describing the pressure variation with time, that is adjusted to data on a detector-by-detector basis by means of a simultaneous fit to the three pressure proxies that are regularly monitored in time: the gain, the track length and the trigger rate from a reference radioactive source. Any residual evolution in flight will be properly corrected using this very model, which is also used to scale all the relevant performance metrics from the values measured at the time of the ground calibrations.
We emphasize that the impact of this pressure variation on the polarimetric sensitivity is limited. On one hand, the detector quantum efficiency scales linearly with the pressure, causing a net loss of effective area. On the other hand, the modulation factor increases as the pressure decreases, owing to fact that the tracks become more elongated. The net effect of these two competing processes at play is that the relative loss of sensitivity, expressed as the broadband minimum detectable polarization for a typical source spectrum, is less than 2% when going from 800 to 650 mbar. This is qualitatively consistent with the sensitivity scaling across the phase space shown in Figure 3.
8 Conclusions
Gas Pixel Detectors, proposed nearly twenty years ago as a revolutionary tool to access X-ray polarization properties in the photo-electric domain, have now reached full maturity to enable first-time, high-sensitivity observations of astrophysical sources at the level for several source classes.
This paper presents the design choices, the main steps in the integration and test flow of the detecting elements, and the resulting system performance in terms of polarization sensitivity, imaging and spectroscopic capabilities in the context of the NASA IXPE mission.
For the first time, we also discuss the main sources of systematic uncertainties that emerged along the qualification of this technology for space, and their implications on operations of the IXPE mission.
9 Acknowledgements
The Italian contribution to the IXPE mission is supported by the Italian Space Agency (ASI) through the contract ASI-OHBI-2017-12-I.0, the agreements ASI-INAF-2017-12-H0 and ASI-INFN-2017.13-H0, and its Space Science Data Center (SSDC), and by the Istituto Nazionale di Astrofisica (INAF) and the Istituto Nazionale di Fisica Nucleare (INFN) in Italy. T. Tamagawa aknowledges support from the JSPS KAKENHI Grant Number JP19H05609.
Appendix A Modeling Rate-Dependent Gain Variations
We present the analytical effective treatment that we developed to describe and correct the charging effect. Our results are largely in agreement with the microscopic Monte Carlo simulation of the very same phenomenon presented in [20].
The simplest possible model encapsulating the observed charging development in amplitude and time can be cast in terms of the time-dependent accumulated charge per unit area as
| (3) |
where is the input charge flux per unit area, is an adimensional charging constant, and is a discharge time constant.
The one additional piece of information that we need to recast the model in terms of measured quantities is the link between the accumulated charge and the gain variation. Since the overall effect is , which corresponds to a variation of a fraction of a % in terms of the effective electric field, it is reasonable to assume a linear relation between the change in the relative gain and the relative accumulated charge:
| (4) |
With this new setting, equation 3 can be rewritten as
| (5) |
where is the input energy flux per unit area of the source, measured in units of keV s-1 mm-2, is the maximum relative gain excursion, reached when the accumulated charge saturates to its maximum value , and is a charging constant, measured in keV mm-2, incorporating the and parameters of our original model, that we cannot measure separately.
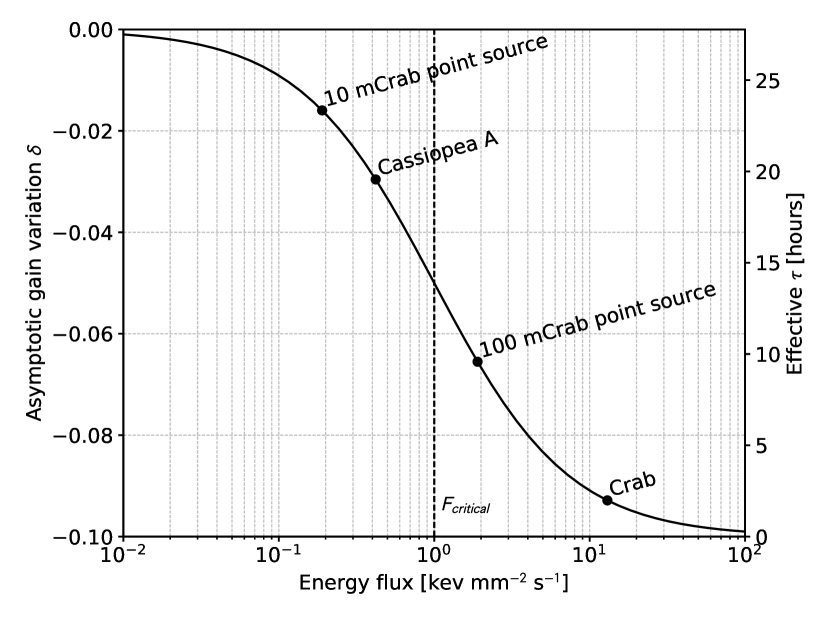
Naive as it is, this very simple model can be solved analytically in the particular case of constant input energy flux , which allows us to derive a number of interesting consequences. First of all, the quantity
| (6) |
acts as a charging time constant. Since is inversely proportional to , the charging process is faster the larger the input energy flux. The system evolves with an effective time constant
| (7) |
toward an asymptotic relative gain variation given by
| (8) |
i.e., the overall asymptotic gain excursion increases with the input energy flux and reaches . Finally, there exists a critical energy flux
| (9) |
separating the two fundamentally different regimes: when the system is dominated by the charging processes and with a time constant . On the other hand, when the discharge process is dominating, and the gain tends to the unperturbed value () with a time constant . Incidentally, .
| Parameter | Typical Value |
|---|---|
| keV mm-2 | |
| s | |
| keV mm-2 s-1 |
When performing celestial observations, controlling the absolute energy scale is important for the measurement of the absolute source fluxes. More importantly, an unbiased energy estimate on an event by-event basis is pivotal for the polarization measurement, as the modulation factor is energy dependent.
Table 7 shows the typical values for the charging parameters, while Figure 24 shows the potential impact on different science observations. For faint sources the gain variations will not be appreciable over the typical time scale for an observation, but for medium to bright sources the charging correction is definitely important.
Appendix B Modeling Pressure Variations
In absence of direct measurements, we use mainly three proxies for inferring the internal pressure of the gas cell: the (absolute or relative) quantum efficiency, the average track length and the gas gain.
The quantum efficiency is, in principle, the most straightforward measurement of the pressure. Measurements of the absolute quantum efficiency are somewhat complex to perform, and are typically systematic-limited, which makes it impractical to use them as a means for fine, long-term monitoring of the detector performance. The quantum efficiency can be measured in relative terms, e.g., by measuring the event rate with a reference radioactive source in a standard holder. This is a much simpler measurement to do and has been indeed systematically exploited in order to investigate the secular pressure variations.
Any change of the pressure in the gas cell will cause changes in the track topology, e.g., through changes in the electron range and transverse diffusion. In principle there are several (not independent) topological track quantities that can be used for the purpose. Among them, the track length (defined via the moment analysis event reconstruction) is the most robust against changes in the environmental conditions and the data acquisition settings, and is empirically found to scale as
| (10) |
with .
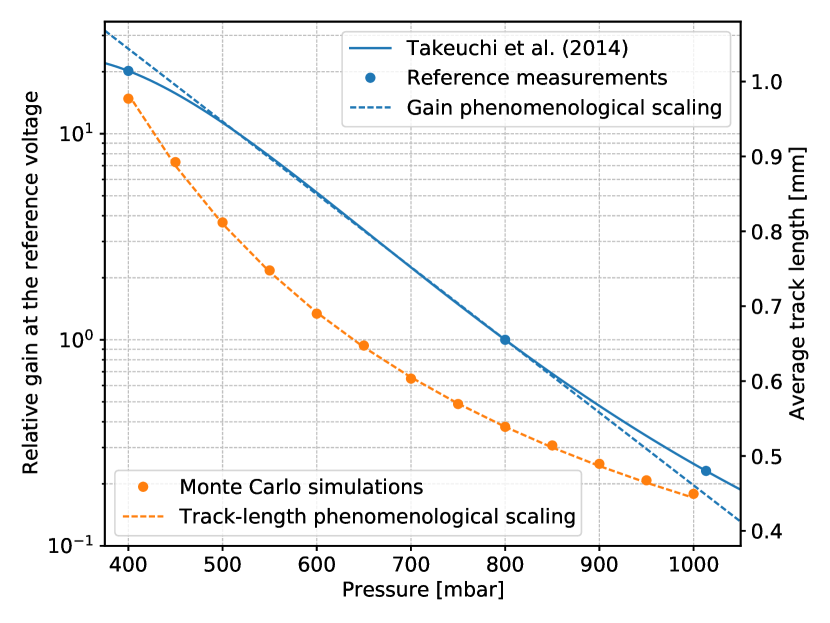
The gas gain depends on the gas pressure at a fixed composition, and is a third, independent proxy that we have customarily used to investigate the secular variations. We emphasize that, compared to the former two quantities, the gain is somewhat more difficult to use, as its dependence on the pressure is complex, and the pulse-height must be properly re-scaled to a common high-voltage working point in order to compare different detectors. In addition, the gain is known to show other kind of variations (e.g., due to the GEM charging, or induced by changes in the environmental conditions) that need to be carefully controlled. We use the parametrization in [21] for modeling the pressure dependence of the gain, anchored to our detector geometry by means of dedicated measurements at three different pressures, as shown in figure 25.
From a purely phenomenological point of view, the scaling of the gain vs. pressure is approximately exponential (at least locally), and the
| (11) |
with mbar describes the full model to within 1% around mbar.
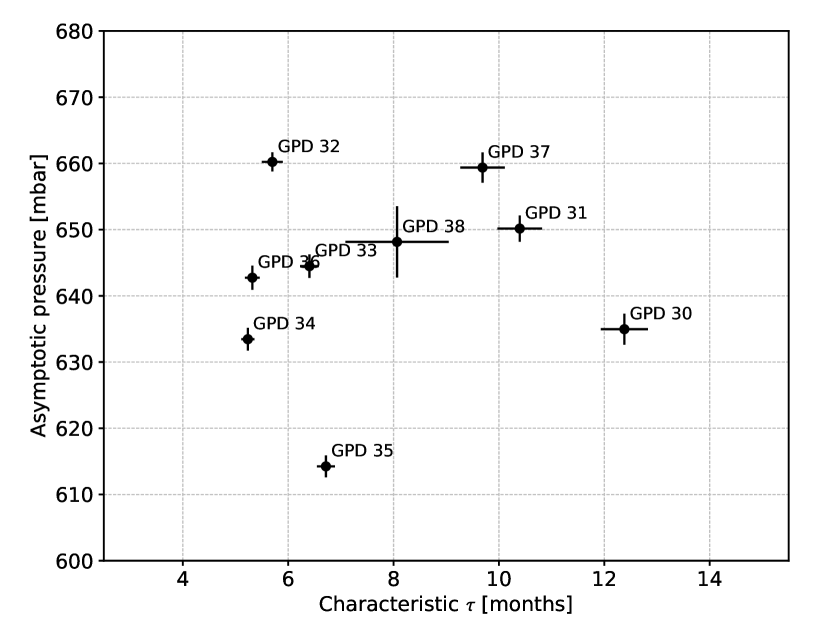
We model the time dependence of the pressure with a two-parameter exponential function
| (12) |
where and are the time constant of the process and the asymptotic pressure loss, respectively. (In contrast, is assumed to be the nominal mbar at the filling time .)
We recover and from a combined fit of the three independent proxies, as illustrated in figure 23.
The objective function that we minimize is
| (13) |
Note that we simultaneously fit three scale parameters for the three proxies to allow for modeling uncertainties or setup-dependent scaling. These fit byproducts can be used to evaluate the consistency of the modeling across different detectors. Also note that, since most of the measurements are statistics-limited, we allow for a constant systematic error on each of the three proxies. Figure 26 shows a summary of the fit parameters.
Finally, we report independent, quantitative evidence that the pressure inside the gas cell decreases using data from the standard detector metrology that is performed to support the alignmnent of the detector units with the mirror-module assemblies in the integration stage. Prior to filling, the vertical position of the center of the Be window is measured for each detector with respect to the bottom plane of the titanium frame. In this configuration the differential pressure between the two sides of the window is zero, and therefore the window itself is, in principle, perfectly aligned to the titanium bottom plane. This first measurement constitutes the zero for the following ones.
After the gas filling, the window is subjected to a mbar differential pressure (that, as we have seen, is changing with time), which causes a measurable movement of the vertical position of the window center. Based on FEM simulations and actual tests, this shift is expected to be linear with the differential pressure up to several hundreds mbar:
| (14) |
It is therefore possible, at least in principle, to gauge the internal pressure in the gas cell from a direct metrological measurement. A precision of m can be achieved with a CMM with an optical head.
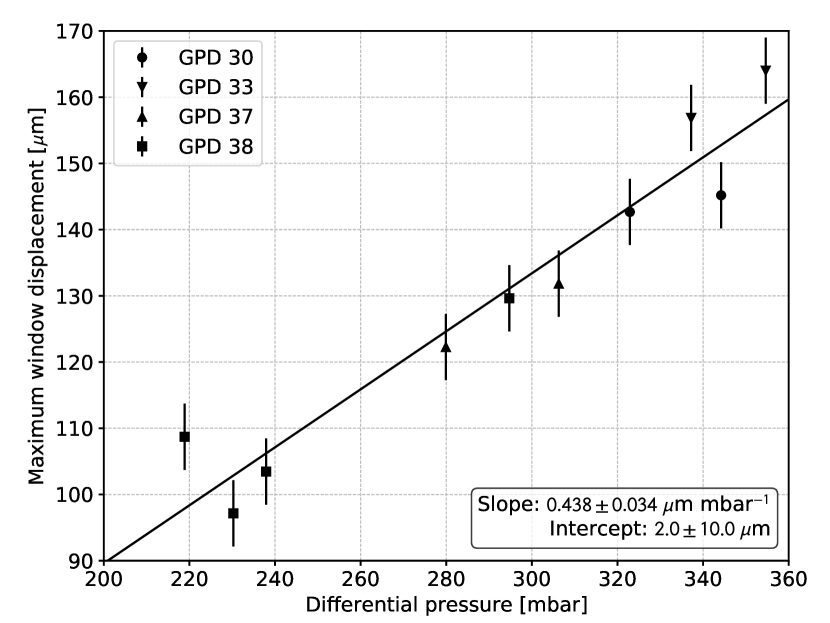
In figure 27 the window displacement measurement is shown for each GPD in the flight control sample, and at different moments in time, as a function of the pressure in the gas cell, estimated from the combined fit described above. Different points in the plot with the same color track directly the pressure evolution of any given detector. Overall, the data points are consistent, as expected, with a straight line, for an overall excursion of m over an estimated maximum pressure range in excess of mbar. We emphasize that the intercept of the best-fit straight line is consistent with , as predicted by our naive linear model.
References
- [1] M. C. Weisskopf, E. H. Silver, H. L. Kestenbaum, K. S. Long, and R. Novick. A precision measurement of the X-ray polarization of the Crab Nebula without pulsar contamination. Astrophysical Journal, 220:L117–L121, March 1978.
- [2] Hua Feng, Hong Li, Xiangyun Long, Ronaldo Bellazzini, Enrico Costa, Qiong Wu, Jiahui Huang, Weichun Jiang, Massimo Minuti, Weihua Wang, Renxin Xu, Dongxin Yang, Luca Baldini, Saverio Citraro, Hikmat Nasimi, Paolo Soffitta, Fabio Muleri, Aera Jung, Jiandong Yu, Ge Jin, Ming Zeng, Peng An, Alessandro Brez, Luca Latronico, Carmelo Sgro, Gloria Spandre, and Michele Pinchera. Re-detection and a possible time variation of soft X-ray polarization from the Crab. Nature Astronomy, 4:511–516, May 2020.
- [3] Enrico Costa, Paolo Soffitta, Ronaldo Bellazzini, Alessandro Brez, Nicholas Lumb, and Gloria Spandre. An efficient photoelectric x-ray polarimeter for the study of black holes and neutron stars. Nature, 411:662–665, 2001.
- [4] Robert A. Austin and Brian D. Ramsey. Optical imaging chamber for x-ray astronomy. Optical Engineering, 32(8):1990 – 1994, 1993.
- [5] Hua Feng, Weichun Jiang, Massimo Minuti, Qiong Wu, Aera Jung, Dongxin Yang, Saverio Citraro, Hikmat Nasimi, Jiandong Yu, Ge Jin, Jiahui Huang, Ming Zeng, Peng An, Luca Baldini, Ronaldo Bellazzini, Alessandro Brez, Luca Latronico, Carmelo Sgrò, Gloria Spandre, Michele Pinchera, Fabio Muleri, Paolo Soffitta, and Enrico Costa. PolarLight: a CubeSat X-ray polarimeter based on the gas pixel detector. Experimental Astronomy, 47(1-2):225–243, April 2019.
- [6] Stephen L. O’Dell, Primo Attinà, Luca Baldini, Mattia Barbanera, Wayne H. Baumgartner, Ronaldo Bellazzini, Jeff Bladt, Stephen D. Bongiorno, Alessandro Brez, Elisabetta Cavazzuti, Saverio Citraro, Enrico Costa, William D. Deininger, Ettore Del Monte, Kurtis L. Dietz, Niccolò Di Lalla, Immacolata Donnarumma, Ronald F. Elsner, Sergio Fabiani, Riccardo Ferrazzoli, Larry Guy, William Kalinowski, Victoria M. Kaspi, Anthony R. Kelley, Jeffrey J. Kolodziejczak, Luca Latronico, Carlo Lefevre, Leonardo Lucchesi, Alberto Manfreda, Herman L. Marshall, James Masciarelli, Giorgio Matt, Massimo Minuti, Fabio Muleri, Hikmat Nasimi, Alessio Nuti, Leonardo Orsini, Darren Osborne, Matteo Perri, Melissa Pesce-Rollins, Colin Peterson, Michele Pinchera, Simonetta Puccetti, Brian D. Ramsey, Ajay Ratheesh, Roger W. Romani, Francesco Santoli, Andrea Sciortino, Carmelo Sgrò, Brian T. Smith, Gloria Spandre, Paolo Soffitta, Allyn F. Tennant, Antonino Tobia, Alessio Trois, Jeffrey Wedmore, Martin C. Weisskopf, Fei Xie, Francesco Zanetti, Cheryl Alexander, D. Zachery Allen, Fabrizio Amici, Spencer Antoniak, Raffaella Bonino, Fabio Borotto, Shawn Breeding, Daniele Brienza, H. Kyle Bygott, Ciro Caporale, Claudia Cardelli, Marco Ceccanti, Mauro Centrone, Giuseppe Di Persio, Yuri Evangelista, MacKenzie Ferrie, Joseph Footdale, Brent Forsyth, Michelle Foster, Shuichi Gunji, Eli Gurnee, Grant Hibbard, Sandra Johnson, Eric Kelly, Kiranmayee Kilaru, Fabio La Monaca, Shelley Le Roy, Pasqualino Loffredo, Guido Magazzu, Marco Marengo, Alessandra Marrocchesi, Francesco Massaro, Jeffery McCracken, Michael McEachen, Paolo Mereu, Scott Mitchell, Ikuyuki Mitsuishi, Alfredo Morbidini, Federico Mosti, Michela Negro, Chiara Oppedisano, Richard Pacheco, Alessandro Paggi, Steven D. Pavelitz, Christina Pentz, Raffaele Piazzola, Brad Porter, Alessandro Profeti, Jaganathan Ranganathan, John Rankin, Noah Root, Alda Rubini, Stephanie Ruswick, Javier Sanchez, Emanuele Scalise, Sarah Schindhelm, Chet O. Speegle, Toru Tamagawa, Marcello Tardiola, Amy L. Walden, Bruce Weddendorf, and David Welch. The Imaging X-Ray Polarimetry Explorer (IXPE): technical overview II. In UV, X-Ray, and Gamma-Ray Space Instrumentation for Astronomy XXI, volume 11118 of Society of Photo-Optical Instrumentation Engineers (SPIE) Conference Series, page 111180V, September 2019.
- [7] F. Sauli. Gem: A new concept for electron amplification in gas detectors. Nuclear Instruments and Methods in Physics Research Section A: Accelerators, Spectrometers, Detectors and Associated Equipment, 386(2):531 – 534, 1997.
- [8] R. Bellazzini, F. Angelini, L. Baldini, F. Bitti, A. Brez, M. Ceccanti, L. Latronico, M.M. Massai, M. Minuti, N. Omodei, M. Razzano, C. Sgrò, G. Spandre, E. Costa, and P. Soffitta. Reading a gem with a vlsi pixel asic used as a direct charge collecting anode. Nuclear Instruments and Methods in Physics Research Section A: Accelerators, Spectrometers, Detectors and Associated Equipment, 535(1):477 – 484, 2004. Proceedings of the 10th International Vienna Conference on Instrumentation.
- [9] R. Bellazzini, G. Spandre, M. Minuti, L. Baldini, A. Brez, F. Cavalca, L. Latronico, N. Omodei, M.M. Massai, C. Sgro’, E. Costa, P. Soffitta, F. Krummenacher, and R. de Oliveira. Direct reading of charge multipliers with a self-triggering cmos analog chip with 105k pixels at 50m pitch. Nuclear Instruments and Methods in Physics Research Section A: Accelerators, Spectrometers, Detectors and Associated Equipment, 566(2):552 – 562, 2006.
- [10] Martin C. Weisskopf, Ronald F. Elsner, and Stephen L. O’Dell. On understanding the figures of merit for detection and measurement of x-ray polarization. In Monique Arnaud, Stephen S. Murray, and Tadayuki Takahashi, editors, Space Telescopes and Instrumentation 2010: Ultraviolet to Gamma Ray, volume 7732, pages 98 – 102. International Society for Optics and Photonics, SPIE, 2010.
- [11] A. Pansky, Amos Breskin, and Rachel Chechik. Fano factor and the mean energy per ion pair in counting gases, at low x-ray energies. Journal of Applied Physics, 82:871–877, 07 1997.
- [12] Archana Sharma. Properties of some gas mixtures used in tracking detectors, 1998.
- [13] Paolo Soffitta, Riccardo Campana, Enrico Costa, Sergio Fabiani, Fabio Muleri, Alda Rubini, Ronaldo Bellazzini, Alessandro Brez, Massimo Minuti, Michele Pinchera, and Gloria Spandre. The background of the gas pixel detector and its impact on imaging X-ray polarimetry. In Tadayuki Takahashi, Stephen S. Murray, and Jan-Willem A. den Herder, editors, Space Telescopes and Instrumentation 2012: Ultraviolet to Gamma Ray, volume 8443, pages 417 – 427. International Society for Optics and Photonics, SPIE, 2012.
- [14] T. Tamagawa, N. Tsunoda, A. Hayato, H. Hamagaki, M. Inuzuka, H. Miyasaka, I. Sakurai, F. Tokanai, and K. Makishima. Development of gas electron multiplier foils with a laser etching technique. Nuclear Instruments and Methods in Physics Research Section A: Accelerators, Spectrometers, Detectors and Associated Equipment, 560(2):418 – 424, 2006.
- [15] M. Barbanera, S. Citraro, C. Magazzù, A. Manfreda, M. Minuti, H. Nasimi, and C. Sgrò. Initial tests and characterization of the readout electronics for the ixpe mission. IEEE Transactions on Nuclear Science, pages 1–1, 2021.
- [16] Martin Ester, Hans-Peter Kriegel, Jörg Sander, and Xiaowei Xu. A density-based algorithm for discovering clusters in large spatial databases with noise. In KDD-96 Proceedings, pages 226–231. AAAI Press, 1996.
- [17] Ronaldo Bellazzini, F. Angelini, Luca Baldini, Alessandro Brez, Enrico Costa, Giuseppe Di Persio, Luca Latronico, M. M. Massai, Nicola Omodei, Luigi Pacciani, Paolo Soffitta, and Gloria Spandre. Novel gaseous x-ray polarimeter: data analysis and simulation. In Silvano Fineschi, editor, Polarimetry in Astronomy, volume 4843, pages 383 – 393. International Society for Optics and Photonics, SPIE, 2003.
- [18] T. Kitaguchi, K. Black, T. Enoto, A. Hayato, J. Hill, W. Iwakiri, P. Kaaret, T. Mizuno, and T. Tamagawa. A convolutional neural network approach for reconstructing polarization information of photoelectric x-ray polarimeters. Nuclear Instruments and Methods in Physics Research Section A-accelerators Spectrometers Detectors and Associated Equipment, 942:162389, 2019.
- [19] A.L. Peirson, R.W. Romani, H.L. Marshall, J.F. Steiner, and L. Baldini. Deep ensemble analysis for imaging x-ray polarimetry. Nuclear Instruments and Methods in Physics Research Section A: Accelerators, Spectrometers, Detectors and Associated Equipment, 986:164740, 2021.
- [20] P Hauer, S Urban, K Flöthner, M Ball, and B Ketzer. Study of charge-up processes in gas electron multipliers. Journal of Physics: Conference Series, 1498:012029, apr 2020.
- [21] Y Takeuchi, T Tamagawa, T Kitaguchi, S Yamada, W Iwakiri, F Asami, A Yoshikawa, K Kaneko, T Enoto, A Hayato, T Kohmura, and the GEMS/XACT team. Property of LCP-GEM in pure dimethyl ether at low pressure. Journal of Instrumentation, 9(01):C01002–C01002, jan 2014.