Repo2Vec: A Comprehensive Embedding Approach for Determining Repository Similarity
Abstract
How can we identify similar repositories and clusters among a large online archive, such as GitHub? Determining repository similarity is an essential building block in studying the dynamics and the evolution of such software ecosystems. The key challenge is to determine the right representation for the diverse repository features in a way that: (a) it captures all aspects of the available information, and (b) it is readily usable by ML algorithms. We propose Repo2Vec, a comprehensive embedding approach to represent a repository as a distributed vector by combining features from three types of information sources. As our key novelty, we consider three types of information: (a) metadata, (b) the structure of the repository, and (c) the source code. We also introduce a series of embedding approaches to represent and combine these information types into a single embedding. We evaluate our method with two real datasets from GitHub for a combined 1013 repositories. First, we show that our method outperforms previous methods in terms of precision (93% vs 78%), with nearly twice as many Strongly Similar repositories and 30% fewer False Positives. Second, we show how Repo2Vec provides a solid basis for: (a) distinguishing between malware and benign repositories, and (b) identifying a meaningful hierarchical clustering. For example, we achieve 98% precision, and 96% recall in distinguishing malware and benign repositories. Overall, our work is a fundamental building block for enabling many repository analysis functions such as repository categorization by target platform or intention, detecting code-reuse and clones, and identifying lineage and evolution.
Index Terms:
Embedding, GitHub, Similarity, Clustering, Software.I Introduction
Establishing a way to measure similarity between software repositories is an essential building block for studying the plethora of repositories in online Open Source Software (OSS) platforms. These OSS platforms contain a massive number of repositories and engagement of millions of users [1]. There are significant collaborations and code reuses [2, 3] on these platforms, which are openly supported and encouraged. Researchers are interested in studying the dynamics of such repositories, which include the ability to identify: (a) derivative repositories, (b) families of repositories, (c) the evolution of software projects, and (d) coding and technology trends. GitHub is arguably the largest such platform with more than 32 million repositories and 34 million users exhibiting significant collaborative interactions [4].
 |
How can we quantify the level of similarity between two repositories? This is the problem that we address here. Focusing on GitHub, every repository consists of metadata, source code, and auxiliary files. Given a repository, how can we identify the most similar repositories among a large set? The input here is a large number of repositories and a set of queries. The desired output is: (a) the most similar repositories for a given query repository and (b) clusters of similar repositories. The key challenge here is to represent the repository data into a numeric feature vectors to enable ML approaches to compute the similarities and cluster among repositories. In addition, combining vectors from different types of information, as we will do here, is also a challenge.
There are relatively few efforts that focus on establishing similarity between repositories, and most of them use either metadata or source code level information, while none of them use the three types of information that we do here. First, LibRec [5], SimApp [6], Collaborative Tagging [7], and RepoPal [8] utilize only metadata to find similarity among repositories. Second, MUDABLUE [9] and CLAN [10] are two similarity computation approaches using only source code of repositories as plain text. Third, CrossSim [11, 12] proposes a graph representation to compute similarity between repositories using both metadata and source code. We discuss the related works in more detail in Section VII.
As our key contribution, we propose Repo2Vec, an embedding approach to represent software repositories with a multi-dimensional distributed continuous vector which can be used to measure the similarity between repositories. We briefly describe the key features of our approach. First, our method represents a repository as a distributed continuous vector in an embedding space. Second, we consider three types of information: (a) metadata, (b) source code, and (c) the repository directory structure. Our approach provides a flexible way to combine these three types using our default values which can be customized to match the niche needs of a savvy user. The significance of our approach is that it generates a relatively-low dimensional vector that can enable follow up repository analysis. Such follow up studies can leverage the plethora of ML techniques: we provide a proof of concept for two such applications here.
We deploy our approach and study the similarity on a malware dataset of 433 repositories and a benign dataset of 580 repositories. First, we demonstrate the effectiveness of our method by comparing it against state of the art works. Second, we show how our Repo2Vec can enable algorithms for: (a) distinguishing between malware and benign repositories, and (b) identifying a meaningful hierarchical clustering. The key results are briefly discussed below.
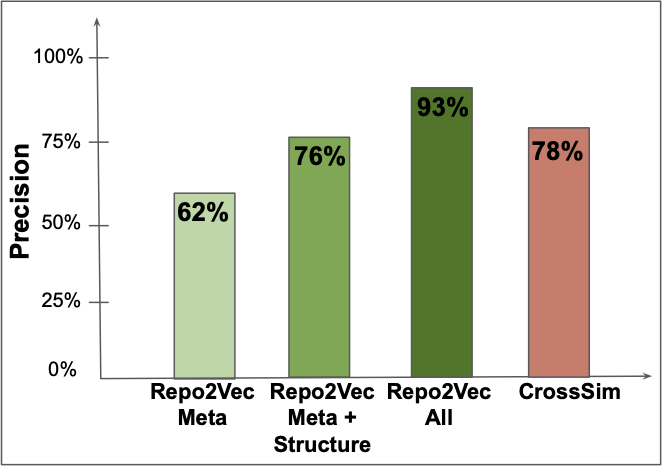
a. Repo2Vec outperforms prior works. For this comparison, we select the best approach to date, CrossSim, which has been shown to outperform previous approaches [8, 9, 10]. For consistency, we also follow their evaluation methodology and use their dataset with 580 benign repository. We show that our approach identifies similar repositories with 93% precision compared to 78% as shown in Figure 1. Further, our approach finds nearly twice as many strongly similar repositories and 30% fewer False Positives, as we see in Figure 6.
b. Metadata and structure provide significant performance. We assess the information contribution of three types of information. Interestingly, we can identify similarity fairly well without the use of source code as shown in Figure 1. Using only metadata and structure leads to a 76% precision, which is comparable to the previous best method, which uses source code.
c. Application: identifying malware repositories accurately. We show that our approach can enable a supervised classification approach. We focus on distinguishing malware from benign repositories, which is a practical problem [13]. Using our embedding, we can identify malware repositories with 98% precision and 97% recall, which outperforms the previous approaches.
d. Application: identifying a meaningful hierarchy. We show that our approach can form the basis for a meaningful (unsupervised) hierarchical clustering of repositories. We show that the emerging structure aligns with their purpose and lineage. In our evaluation, we focus at two levels of granularity: a coarse and a fine level with 3 and 26 clusters respectively. Using an LDA-based topic extraction method, we find that the clusters are cohesive: more than 80% of the repositories per cluster have the same focus. We discuss the clustering in Section V.
Our work in perspective. Our approach can be seen as a first step towards the use of embedding approaches in repository analysis. In fact, it can be seen as a general framework where the selection of individual features can be driven by the intention of the application. For example, one can focus on different primary features depending on whether we want to identify: (a) plagiarism or function level similarity, (b) programming styles, or (c) software intention. We intend to share our method and our dataset to facilitate follow up research in this direction.
II Background
We provide some background on GitHub and describe embedding approaches, which we extend and use later.
A. GitHub and its features. GitHub is a massive software archive, which enables users to store and share code creating a global social network of interaction. Users can collaborate on a repository by raising issues or forking projects, where they copy and evolve projects. Users can follow projects, and “up-vote” projects using “stars”. We describe the key elements of a GitHub repository here. A repository contains three types of information (a) metadata, (b) project directory, and (c) source code files, which we explain below.
a. Metadata: A repository in GitHub has a large number of metadata fields. Most notable are: (a) title, (b) descriptions, (c) topics, and (d) readme file. All these fields are optional and they are provided by the author. Commit and issues are other sources of textual metadata which include messages about the specific functionality of the repository. At the same time, there are metrics that capture the popularity of a repository including: (a) stars, (b) forks, and (c) watches. As the text fields are provided by the repository author, they can be unstructured, noisy, or missing altogether.
b. Source code: It is the core element of a software repository. A repository contains software projects written in various programming languages such as C/C++, Java, Python, and so on. These source codes are the logical centre of a software stored in a repository.
c. Project directory structure: A well-crafted software repository follows a best-practices directory structure containing dataset, source code, and other auxiliary files. We hypothesize that the structure could be useful in establishing similarity between repositories.
B. Embedding approaches. An embedding (a.k.a. distributed representation) is an unsupervised approach for mapping entities, such as words or images, into a relatively low-dimensional space by using a deep neural network on a large training corpus [14, 15]. Although the method is unsupervised, it relies on ideally a large dataset, which is used to “train” the neural network. The neural network develops a model of the dataset, which we can think of as probabilities and correlations of its entities. Embedding approaches have revolutionized research in several fields, such as Natural Language Processing (NLP) [14, 15, 16, 17], computer vision [18], graph mining [19, 20], and software analysis [21].
The power of an embedding is twofold: (a) it can simplify the representation of a complex entity with diverse features, including categorical, and (b) it provides a way to quantify entity similarity as a function of the distance of their corresponding vectors. An efficient embedding has the following properties: (a) it gives a fixed and low dimensional vector, and (b) it ensures that semantically similar objects are “close by” in the embedding space.
a. Word embedding: word2vec. In the seminal word2vec work [15], we map words to vectors in a way that similar words, such as “father” and “parent”, map to nearby vectors. This similarity is established by “feeding” a large corpus of documents to the deep neural network. In other words, the model captures word correlations by calculating the probability with which a word can appear within a given neighborhood of words.
b. Document embedding: doc2vec. The doc2vec [14] is an unsupervised embedding model for a variable length paragraph or document. The model takes a document as input and maps it to an M-dimensional embedding vectors while doing a proxy task, predicting target word or sampled words in the document.
In more detail, the document embedding model is based on the word embedding [15] model. The main difference between them is the introduction of the document id vector. Like word2vec, there are two types of doc2vec available: (a) Distributed Memory Model of Paragraph Vectors (PV-DM) and (b) Distributed Bag of Words version of Paragraph Vector (PV-DBOW). PV-DM is similar to the Continuous Bag of Words (CBOW) model in word2vec. The PV-DBOW model is similar to the skip-gram model of word2vec. The document vector is calculated at the same time as the word vectors of the document. Note that, PV-DM performs better for large, and well-structured documents. On the other hand, PV-DBOW is considered a better choice for small and defective documents, as it is computationally fast.
c. Code embedding: code2vec. Embedding approaches have also been proposed for detecting code similarity. A recent approach is code2vec which maps a method (or more generally a code snippet) of arbitrary length to an M-dimensional vector [21, 22]. The code2vec approach uses program structure explicitly to predicting program properties and uses an attention based neural network that learns a continuous distributed vector representation for the code snippet. As a result, one can compare and group code snippets. The process is fairly involved as it attempts to capture the logical structure and flow of the program and the sequence of commands. For example, the code is decomposed into a set of paths based on its abstract syntax tree. The neural network learns simultaneously: the representation of each path and how to aggregate a set of them. Due to space limitations, we refer the interested reader to the original work [21].
d. Node embedding: node2vec. The node2vec [20] is a graph embedding approach for mapping a node in a network to an M-dimensional embedding vector. The model maximizes the likelihood of preserving network neighborhoods of nodes using Stochastic Gradient Descent (SGD).
In more detail, the model computes the embedding based on nodes neighborhoods. First, the network structure is converted to a set of paths (node sequences) using a biased random walk sampling strategy which combines Depth-First Sampling (DFS) and Breadth-First Sampling (BFS) for every nodes. The sampling strategy efficiently explores diverse neighborhoods of a given node. These sets of paths can be analogized to the sentences in a document. Then the model is trained on these node sequences with the skip-gram models presented in word2vec [15] to get the vector representations for each node. For more details about the model, we refer to the original paper [20].
III Proposed Method
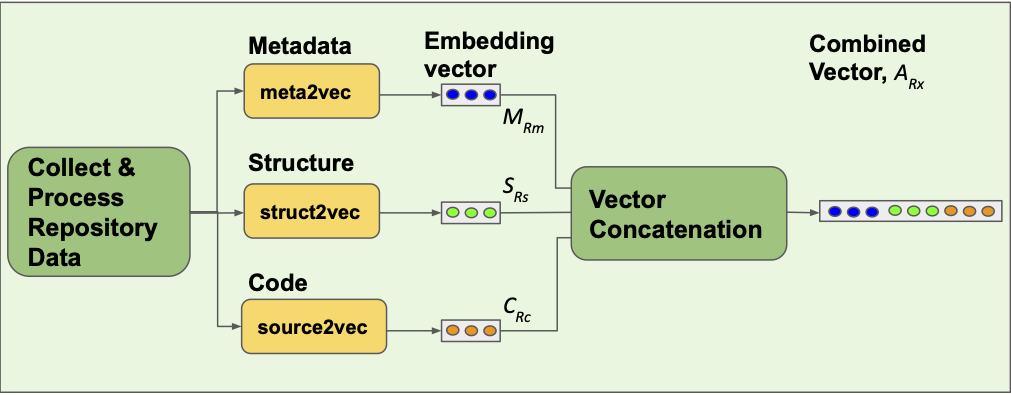
The main idea behind Repo2Vec is to combine the metadata, source code, and directory structure of a repository and provide an embedding representation for the whole repository. In fact, we create an embedding for each type of data, which we refer to as: (i) meta2vec for metadata, (ii) source2vec for the source code, and (iii) struct2vec for the directory structure. Our approach follows these four steps. In the first three steps, we create an embedding vector for each of the three types of data, and in the fourth step, we combine these into a repository embedding. The Repo2Vec pipeline is shown in Figure 2. We explain each step of our approach in more detail below.
 |
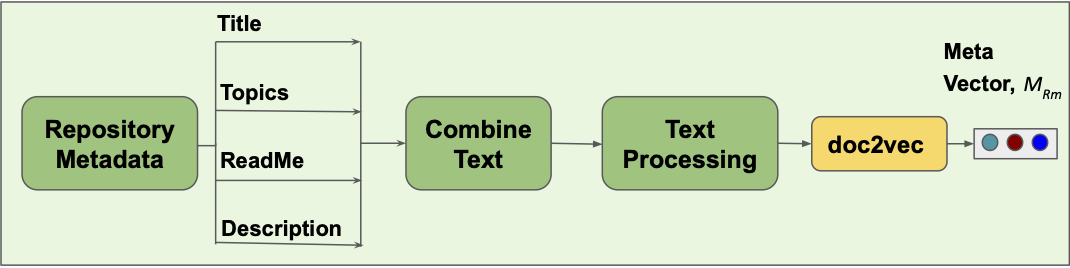
Step 1. Metadata embedding: meta2vec. We define meta2vec as mapping all the metadata in a repository to an -dimensional embedding vector, . In meta2vec, we follow three steps. First, we select the fields of metadata that we want to “summarize” in embedding. Second, we preprocess the metadata text to remove noise. Finally, we adapt the doc2vec approach to compute the embedding vector. The overview of meta2vec is shown in Figure 3.
a. Field selection: We consider all the fields of metadata that contain descriptive information regarding the content of a repository such as title, description, topics (or tags), and readme file. Recall that all this information is provided by the author. There are many ways to extract and combine textual information from each field. Here, we opt to treat each metadata field as a paragraph and concatenate them to generate a document, which we process as below. Note that we do not consider metrics that relates to the popularity of a repository, since our intuition and initial results suggest that it is less helpful in determining similarity.
b. Text preprocessing: Like any Natural Language Processing (NLP) method, we start with necessary preprocessing of the text to improve the effectiveness of our approach. As metadata in a repository text fields are often noisy, we follow the NLP best practices step which include removal of: (i) special characters e.g. ‘?’, and ‘!’, (ii) irrelevant words and numbers e.g. “URL”, “Email”, “123”, (ii) stopping words.
c. Repository meta vector generation: We map the metadata in a repository to an -dimensional distributed vector, in this step. Following the basic principles of doc2vec [14] approach, we adapt it to our needs and constraints here. Specifically, as metadata in a repository often consists of unstructured text and is small in size, we employ PV-DBOW, discussed in Section II, because it performs better for small text dataset.
 |
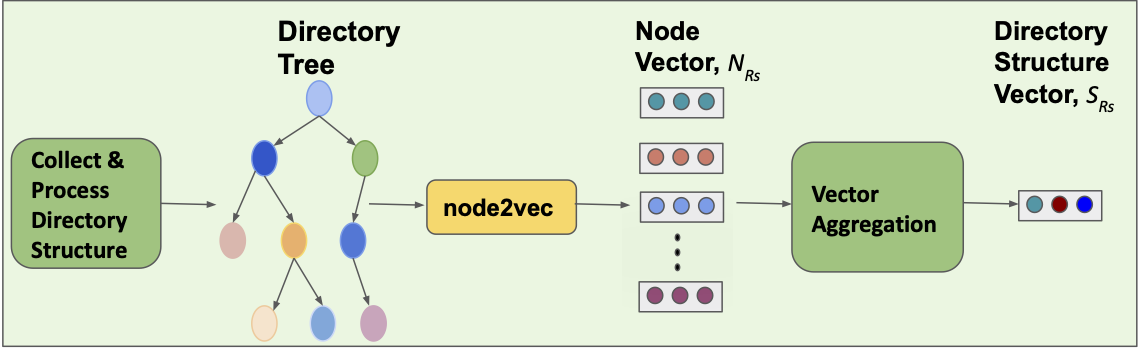
Step 2. Directory structure embedding: struct2vec. We define struct2vec as mapping of repository directory structure to an -dimensional embedding vector, . We compute struct2vec following three steps. First, we represent the directory structure into a tree representation. Second, we generate node vectors employing node2vec. Third, we synthesize node vectors into a single structure vector. The overview of struct2vec is shown in Figure 4.
a. Directory tree representation: A software repository in GitHub consists of a standard directory structure with necessary data files and source code files. We consider the directory structure and transform it into Tree representation to enable node2vec on it. Note that, in order to nullify the effect of directory or file names in the mapping, the representation does not include directory or file names in the tree.
b. Node vector generation: We map all nodes in the tree into an -dimensional node embedding vector, , in this step. Following the properties of node2vec, first, we convert the trees into a set of paths using a biased random walk sampling strategy to include a diverse set of neighborhood nodes for a node. Then, we apply skip-gram models on these paths to get vectors for all nodes.
c. Repository directory structure vector generation: We compute repository directory structure embedding vector, , by synthesizing the node vectors, , in the tree. We follow column-wise aggregation method to synthesize these into a single vector. In order to do that, we employ six aggregation functions: mean, mode, max, min, sum, and standard deviation to compute a value for a column in the resultant vector.
 |
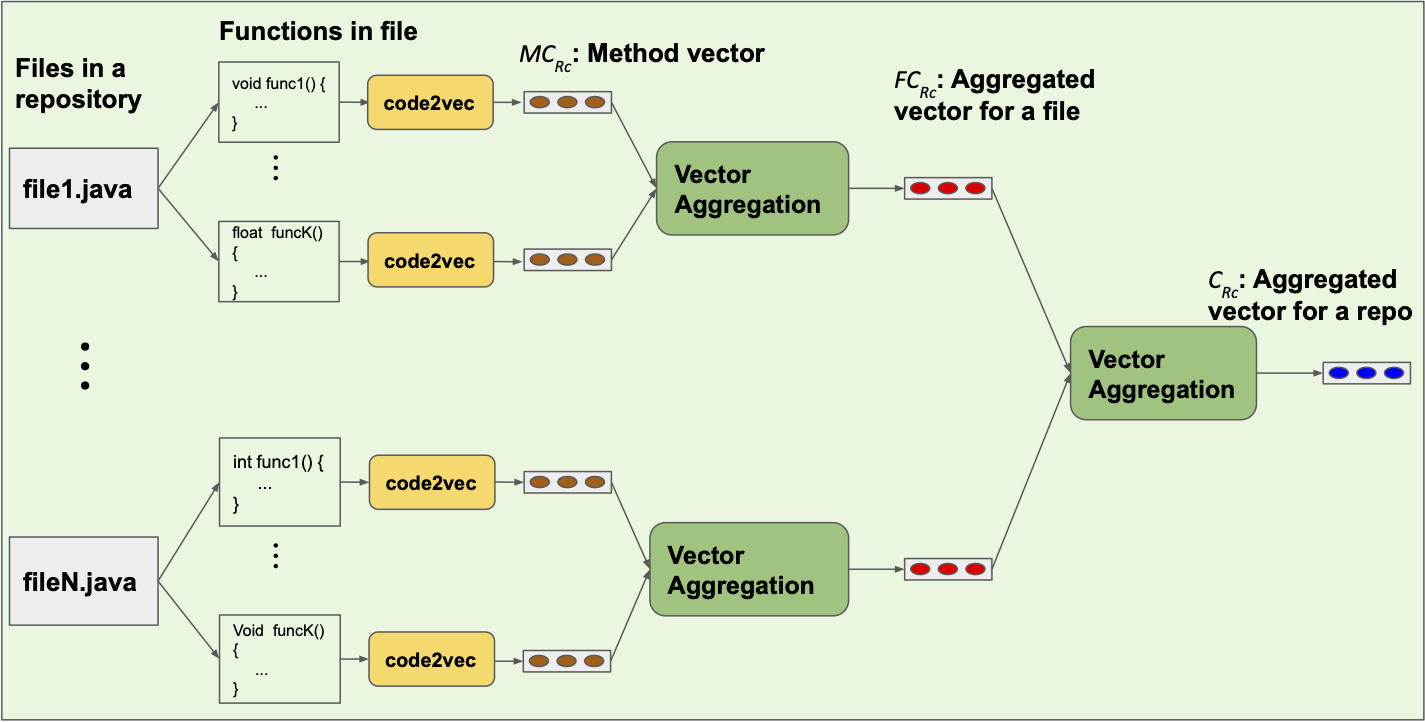 |
Step 3. Source code embedding: source2vec. We define source2vec as an embedding approach to represent the source code in a repository to an -dimensional embedding vector. In source2vec, we employ the Java method embedding techniques and a trained model with 15.3M methods discussed in Section II. We follow three steps in source2vec. First, we compute the -dimensional method code vectors for each method in the source file available in a repository. Second, we aggregate these method vectors in a single -dimensional file code vector. Finally, we compute the final -dimensional repository code vector for all the source files by another level of vector aggregation. The pipeline of our approach is shown in Figure 5 and discussed below in details.
a. Method code vector generation: A software repository may have multiple source code files and other files. First, each source file is decomposed into its methods. Next, methods are preprocessed into AST paths, and context vectors which are the input to the code2vec model. The model maps each method into an -dimensional embedding code vector, . These method vectors are then passed to the next stage of pipeline to be aggregated into a single vector.
b. File code vector generation: After generating the method code vectors, , in a file, the task is now to aggregate them into an -dimensional file code vector, . We follow a number of column-wise aggregation functions. The aggregation functions that we investigate are mean, mode, max, min, sum, and standard deviation. Following the procedure, the pipeline creates a single file code vector, , and passes it to the next stage to create a single repository vector.
c. Repository code vector generation: At this stage of the pipeline, source2vec aggregates all the -dimensional file code vectors, for all source code files available in the repository to a single -dimensional repository code vector, . The pipeline follows same procedure like previous step, column-wise aggregation function to get the repository code vector.
Step 4. Repo2Vec: Repository embedding. We propose Repo2Vec to present a GitHub repository in an embedding vectors using features from three types of information sources: metadata, source code, and project directory structure following the pipeline shown in Figure 2. In this step, we combine metadata vector , directory structure vector , and source code vector into repository vector .
Combining the vectors of each information type is a challenge as many methods exist following two types of approaches: (a) merging the numerical values into a single vector, using the sum, average or median, etc, and (b) concatenating vectors to create a “longer” vector. In both approaches one can consider weighting and normalizing to ensure “fairness”. Here, we opt to use the concatenation approach as follows:
| (1) |
where and are the weights for the meta vector , structure vector , and source code vector respectively, and these weights are in the range of .
IV Experiments and Evaluation
We evaluate the effectiveness of Repo2Vec using real data and answer two questions.
Q.1: What is the effect of each information type? We want to quantify the effect and contribution of the three information types in determining similarity.
Q.2: How does Repo2Vec compare to prior art? We compare our method with CrossSim [12, 11], which is arguably the state of the art approach and was shown to outperform previous approaches [8, 10, 9].
IV-A Experimental Setup
We present the datasets and our evaluation approach.
1. Datasets. We consider two datasets in our evaluation: (a) a dataset of benign repositories, D_ben, which was used in prior work [11, 12], and (b) a dataset of malware repositories, D_mal, collected by a prior repository analysis study [13].
a. Benign repositories D_ben: This dataset consists of 580 Java repositories from GitHub and was used in an earlier study introducing CrossSim [11]. We select this dataset in order to make a fair and reproducible comparison with CrossSim. The dataset spans various software categories such as: PDF processors, JSON parsers, Object relational mapping projects, Spring MVC related tools, SPARQL and RDF, Selenium test, Elastic search, Spring MVC, Hadoop, and Music player.
b. Malware repositories D_mal: This dataset consists of 433 Java malware repositories. The dataset is provided by the SourceFinder project [13], whose goal is to identify and provide malware source code repositories. Here, we choose only the Java language repositories, which are the focus of the CrossSim approach. The repositories have a fairly wide coverage across malware families including: Botnets, Keyloggers, Viruses, Ransomware, DDoS, Spyware, Exploits, Spam, Malicious code injections, Backdoors, and Trojans.
2. Query-based evaluation. For consistency and fairness, we follow the evaluation methodology and similarity metrics of prior work [11]. We conduct our evaluation by using similarity queries as follows: a given repository, we want to identify its five most similar repositories.
a. The query-set Q_ben: For the sake of compatibility with CrossSim, Q_ben consists of the same query set of 50 repositories as CrossSim. The query set spans various domains e.g. SPARQL and RDF, Selenium test, Elastic search, Spring MVC, Hadoop, and Music player.
b. The query-set Q_mal: For the D_mal dataset, we create a query-set by selecting 50 repositories uniformly at random. The query set includes various malware families such as Keylogger, Botnet, DDoS, Ransomware, Virus, Backdoor, Trojan, etc.
3. Ground truth generation. We establish the groundtruth for each dataset by manual evaluation and follow the scoring framework, which was used in prior work [11]. Namely, we use four categories of scores to label the level of similarity:
-
•
Category 4: Strongly Similar (SS) repositories.
-
•
Category 3: Weakly Similar (WS) repositories.
-
•
Category 2: Weakly Dissimilar (WD) repositories.
-
•
Category 1: Strongly Dissimilar (SD) repositories.
For consistency, we follow the convention of the previous study [11]: a repository in category 3 or 4 is considered (sufficiently) similar or a True Positive. Conversely, a repository in category of 1 or 2 is considered dissimilar or a False Positive.
For the evaluation, we opted to use experts, who are more reliable compared to a Mechanical Turk platform for highly technical questions [23] . Specifically, we recruited three computer science researchers with at least 3 years of Java programming experience. The evaluators are given the target repository and the response of 5 repositories per query. Note that the five repositories in each response are in random order to avoid introducing biases. The evaluators assign a score among the four categories of scores to each repository in the responses. The evaluators were provided with context and information in order to calibrate their criteria. The first and second evaluators independently assign a score to each repository in the response. Later, the third evaluator acts as judge by rechecking and finalizing their scores if their scores are not same for a query.
4. Evaluation metrics. For consistency, we adopt the metrics used in related works [11], which we describe below.
a. Success rate: We say an answer to a query is successful, if one or more of the returned repositories is similar to the above definition of similarity. The success rate is the percentage of successful queries.
b. Precision: Precision is the percentage of the returned repositories which are similar to their query repository. We compute the precision following the equation,
| (2) |
c. True and False Positives: Following the standard definitions, True Positives for a query-set is the total number of similar repositories returned, while False Positives is the number of non-similar repositories in the answers.
d. Ranking order correlation (ROC): We quantify the quality of the ranked answer to the query using again a metric introduced in prior work. The intuition is to ”reward” an algorithm that returns highly similar repositories ranked higher. To quantify this, we calculate the widely-used Spearman’s rank correlation coefficient [24], which is defined as:
| (3) |
where is the coefficient, is the difference between the two ranks of each repository, and is the number of ranked repositories. The coefficient is in the range of , with 1 implying perfect agreement, and -1 disagreement between the two rankings.
Comment: Given the way we formulate the query, the use of Recall is less relevant here: we ask the algorithms to report only the top five most similar repositories. Formulating a query we expect the methods to return all similar repositories is challenging for two reasons. First, we would need an established ground-truth, since manual validation would be labor-intensive. Second, there is no absolute way to define what constitutes “sufficiently similar” repositories, while relative similarity is easier to define.
IV-B Deploying Repo2Vec
We implement our method, which we described in Section III using Python3.6 packages: TensorFlow2.0.0, gensim PV-DBOW doc2vec. We discuss some implementation details and parameter choices.
Selecting the embedding dimensions. We select 128 as the embedding vector dimension for , , and , since well-established embedding techniques [15, 14, 21, 20] recommend this number for striking a balance between computational cost and effectiveness. We use the same number of dimensions for the vector of each type of information for fairness. Concatenating these three vectors creates a single Repo2Vec vector with =384 dimensions. The above choices give good results as we will see later. In the future, we will explore the effect of different vector dimensions.
Exploring the solution space via weight selection. The weights in equation 1 give us the ability to control the ”contribution” of each information type. Here, we focus on the following weight combinations, which give rise to three derivative algorithms: (a) Repo2Vec_M using only metadata with weights ; (b) Repo2Vec_MS using metadata and structure with weights ; and, (c) Repo2Vec_All using all three types of information with weights .
In other words, we explore the effect of weights but in a coarse way. In the future, we intend to explore non-integer weight combinations. Overall, our results suggest that equal weights seem to work quite well, but a savvy user can customize them to achieve optimal performance for niche problems.
Calculating the similarity. There are many different ways to calculate the similarity in an embedding space as the inverse of their distance in that space. Here, we use the widely used cosine similarity, which is often recommended for high dimensional spaces [25], and yields great results here as well.
Selecting the right aggregation function to aggregate multiple vectors into a single vector. As we see in Section III, we introduce six column-wise aggregation functions to aggregate vectors into a single vector. We find that mean aggregation function performs better than others. In more detail, we evaluate the performance of all aggregation functions: average, max, min, mode, sum, and standard deviation. We find that embedding with mean aggregation shows highest 93% precision for D_ben dataset and 95% precision for D_mal dataset. Max aggregation function shows the second best result 88% and 91% precision for benign and malware dataset respectively. Other aggregation functions show relatively lower precision for both dataset. In the remaining of the work, we use the mean aggregation function.
IV-C Evaluation
We evaluate Repo2Vec in two ways. First, we assess the effect of each type of information on the performance. Second, we compare our method against CrossSim [11], which is the state of the art approach.
a. The effect of the information types: We evaluate the effect of information types by comparing the performance of our three variants: Repo2Vec_M, Repo2Vec_MS, and Repo2Vec_All, which we defined earlier. We report the result in Table I for our three Repo2Vec variations and both datasets. This evaluation leads to two main observations:
| D_ben Dataset | D_mal Dataset | |||
|---|---|---|---|---|
| Method | Success Rate | Precision | Success Rate | Precision |
| Repo2Vec_M | 100% | 62% | 100% | 67% |
| Repo2Vec_MS | 100% | 76% | 100% | 82% |
| Repo2Vec_All | 100% | 93% | 100% | 95% |
Observation 1: Using all three data types provides significantly better performance. In the table, we see that Repo2Vec_All achieves 93% and 95% precision compared to 76% and 82% when only metada and structure information are used.
Observation 2: Metadata and structure provide fairly good results. Although Repo2Vec_All performs best, Repo2Vec_MS performs quite well especially if we compare it with CrossSim on the same benign dataset and query-set shown in Table II. Note that the computational effort for using metadata and structure is significantly less compared to analyzing the code.
 |
b. Comparing Repo2Vec to the state of the art. We compare the best configuration, Repo2Vec_All, with CrossSim with respect to success rate, precision, confidence, and ROC for the benign dataset D_ben. We find that Repo2Vec outperforms CrossSim in terms of precision and ROC and has the same success rate as CrossSim.
| Method | Success Rate | Precision | Spearman’s Coefficient (r) |
|---|---|---|---|
| CrossSim | 100% | 78% | 0.23 |
| Repo2Vec_All | 100% | 93% | 0.59 |
Observation 3: Repo2Vec: higher precision and better ranking. The results are presented in Table II. Although CrossSim does well in terms of success rate, its precision of 78% is significantly lower compared to the precision of 93% of Repo2Vec_All. Also, the ranking of similar repositories identified by Repo2Vec_All is better than CrossSim. We find that ROC = 0.59 for Repo2Vec_All, and ROC = 0.23 for CrossSim, which further suggests that Repo2Vec_All is better at computing similarity among repositories.
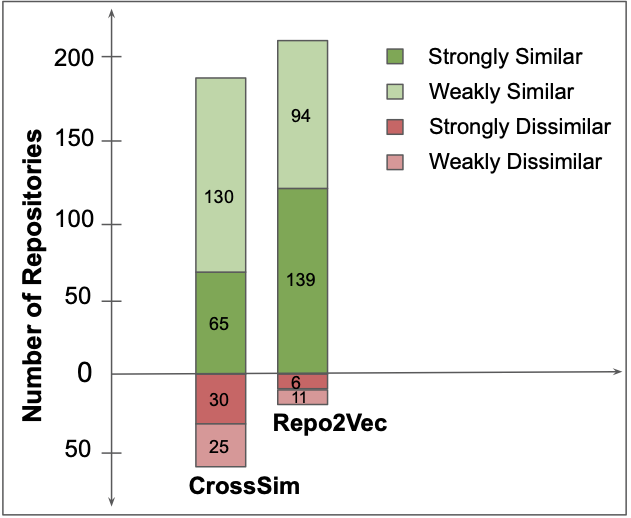
Observation 4: Repo2Vec provides better quality results. Given that we have four categories of similarity, we assess the quality of the results as follows. We plot the returned repositories from each method per category in Figure 6. Considering category 4 (strong similarity) only, Repo2Vec_All identifies nearly 100% more such repositories! Similarly, CrossSim reports 5 times more repositories in the strong dissimilarity category.
V Case Studies
In this section, we want to showcase how Repo2Vec can facilitate repository mining studies for specific applications considering both unsupervised and supervised techniques. We consider two likely case studies: a) classifying repositories as benign or malicious, and b) clustering a set of repositories.
V-A Identifying malware repositories
We showcase the usefulness of our Repo2Vec in a supervised classification problem, which is of interest to practitioners [13, 26, 27]. The question is to identify whether a repository contains malware or benign code. We assess the effectiveness of our approach and we also compare it with the state of the art method [13].
We create a dataset of 580 benign repositories from D_ben and 433 malware repositories from D_mal collected and discussed in Section IV.
| Method | Accuracy | Precision | Recall | F1 Score |
|---|---|---|---|---|
| SourceFinder | 90% | 89% | 99% | 94% |
| Repo2Vec | 97% | 98% | 96% | 97% |
Using our Repo2Vec, we determine the embedding vector for each repository. For the classification, one can use a plethora of ML approaches. Here, we use the Naive Bayes, which is widely used for NLP classification problems [28], and, more importantly, it is also used by the most recent SourceFinder study [13]. With this selection, we want to focus more on the effect of the features when comparing to the SourceFinder classification. We implement the SourceFinder classifier, and apply it on our dataset.
We assess the classification performance using 10-fold cross validation. The results are shown in Table III. Our model classifies the malware and benign repositories with 98% precision and 96% recall which clearly outperforms the previous malware repository classification study by SourceFinder [13].
V-B Hierarchical clustering
 |
| Cluster No. | Number of Repos | Dominant Repo Family | Cluster No. | Number of Repos | Dominant Repo Family |
|---|---|---|---|---|---|
| 1 | 25 | DDoS | 14 | 10 | Virus |
| 2 | 27 | Android Keylogger | 15 | 58 | Trojan and Spyware |
| 3 | 42 | Backdoor | 16 | 33 | REST API |
| 4 | 32 | Worms | 17 | 48 | Hadoop |
| 5 | 44 | Android Botnet | 18 | 36 | JSON Parser |
| 6 | 55 | Android Malware | 19 | 45 | Music Player |
| 7 | 31 | Rootkit | 20 | 71 | SPARQL |
| 8 | 24 | Java Keylogger | 21 | 146 | Elastic Search |
| 9 | 32 | Ransomware | 22 | 54 | Object Relational Mapping |
| 10 | 24 | Whitehat Hacking | 23 | 27 | PDF Processor |
| 11 | 15 | Malicious Code Injection | 24 | 25 | Graph-Aided Searc |
| 12 | 8 | Android Trojan | 25 | 31 | Selenium |
| 13 | 6 | Android Backdoor | 26 | 56 | Spring MVC |
| Cluster No. | Number of Repos | Cluster Type | Cluster Description |
|---|---|---|---|
| 1 | 433 | Malware | The D_mal malware repositories |
| 2 | 33 | Benign | Cluster 16 from the fine granularity with REST API repositories |
| 3 | 547 | Benign | The D_ben repositories. |
.
Here we showcase whether our approach can lead to a meaningful clustering of repositories creating the basis for an unsupervised solution. We consider the union of our two datasets, D_mal and D_ben dataset with a total of 1013 repositories.
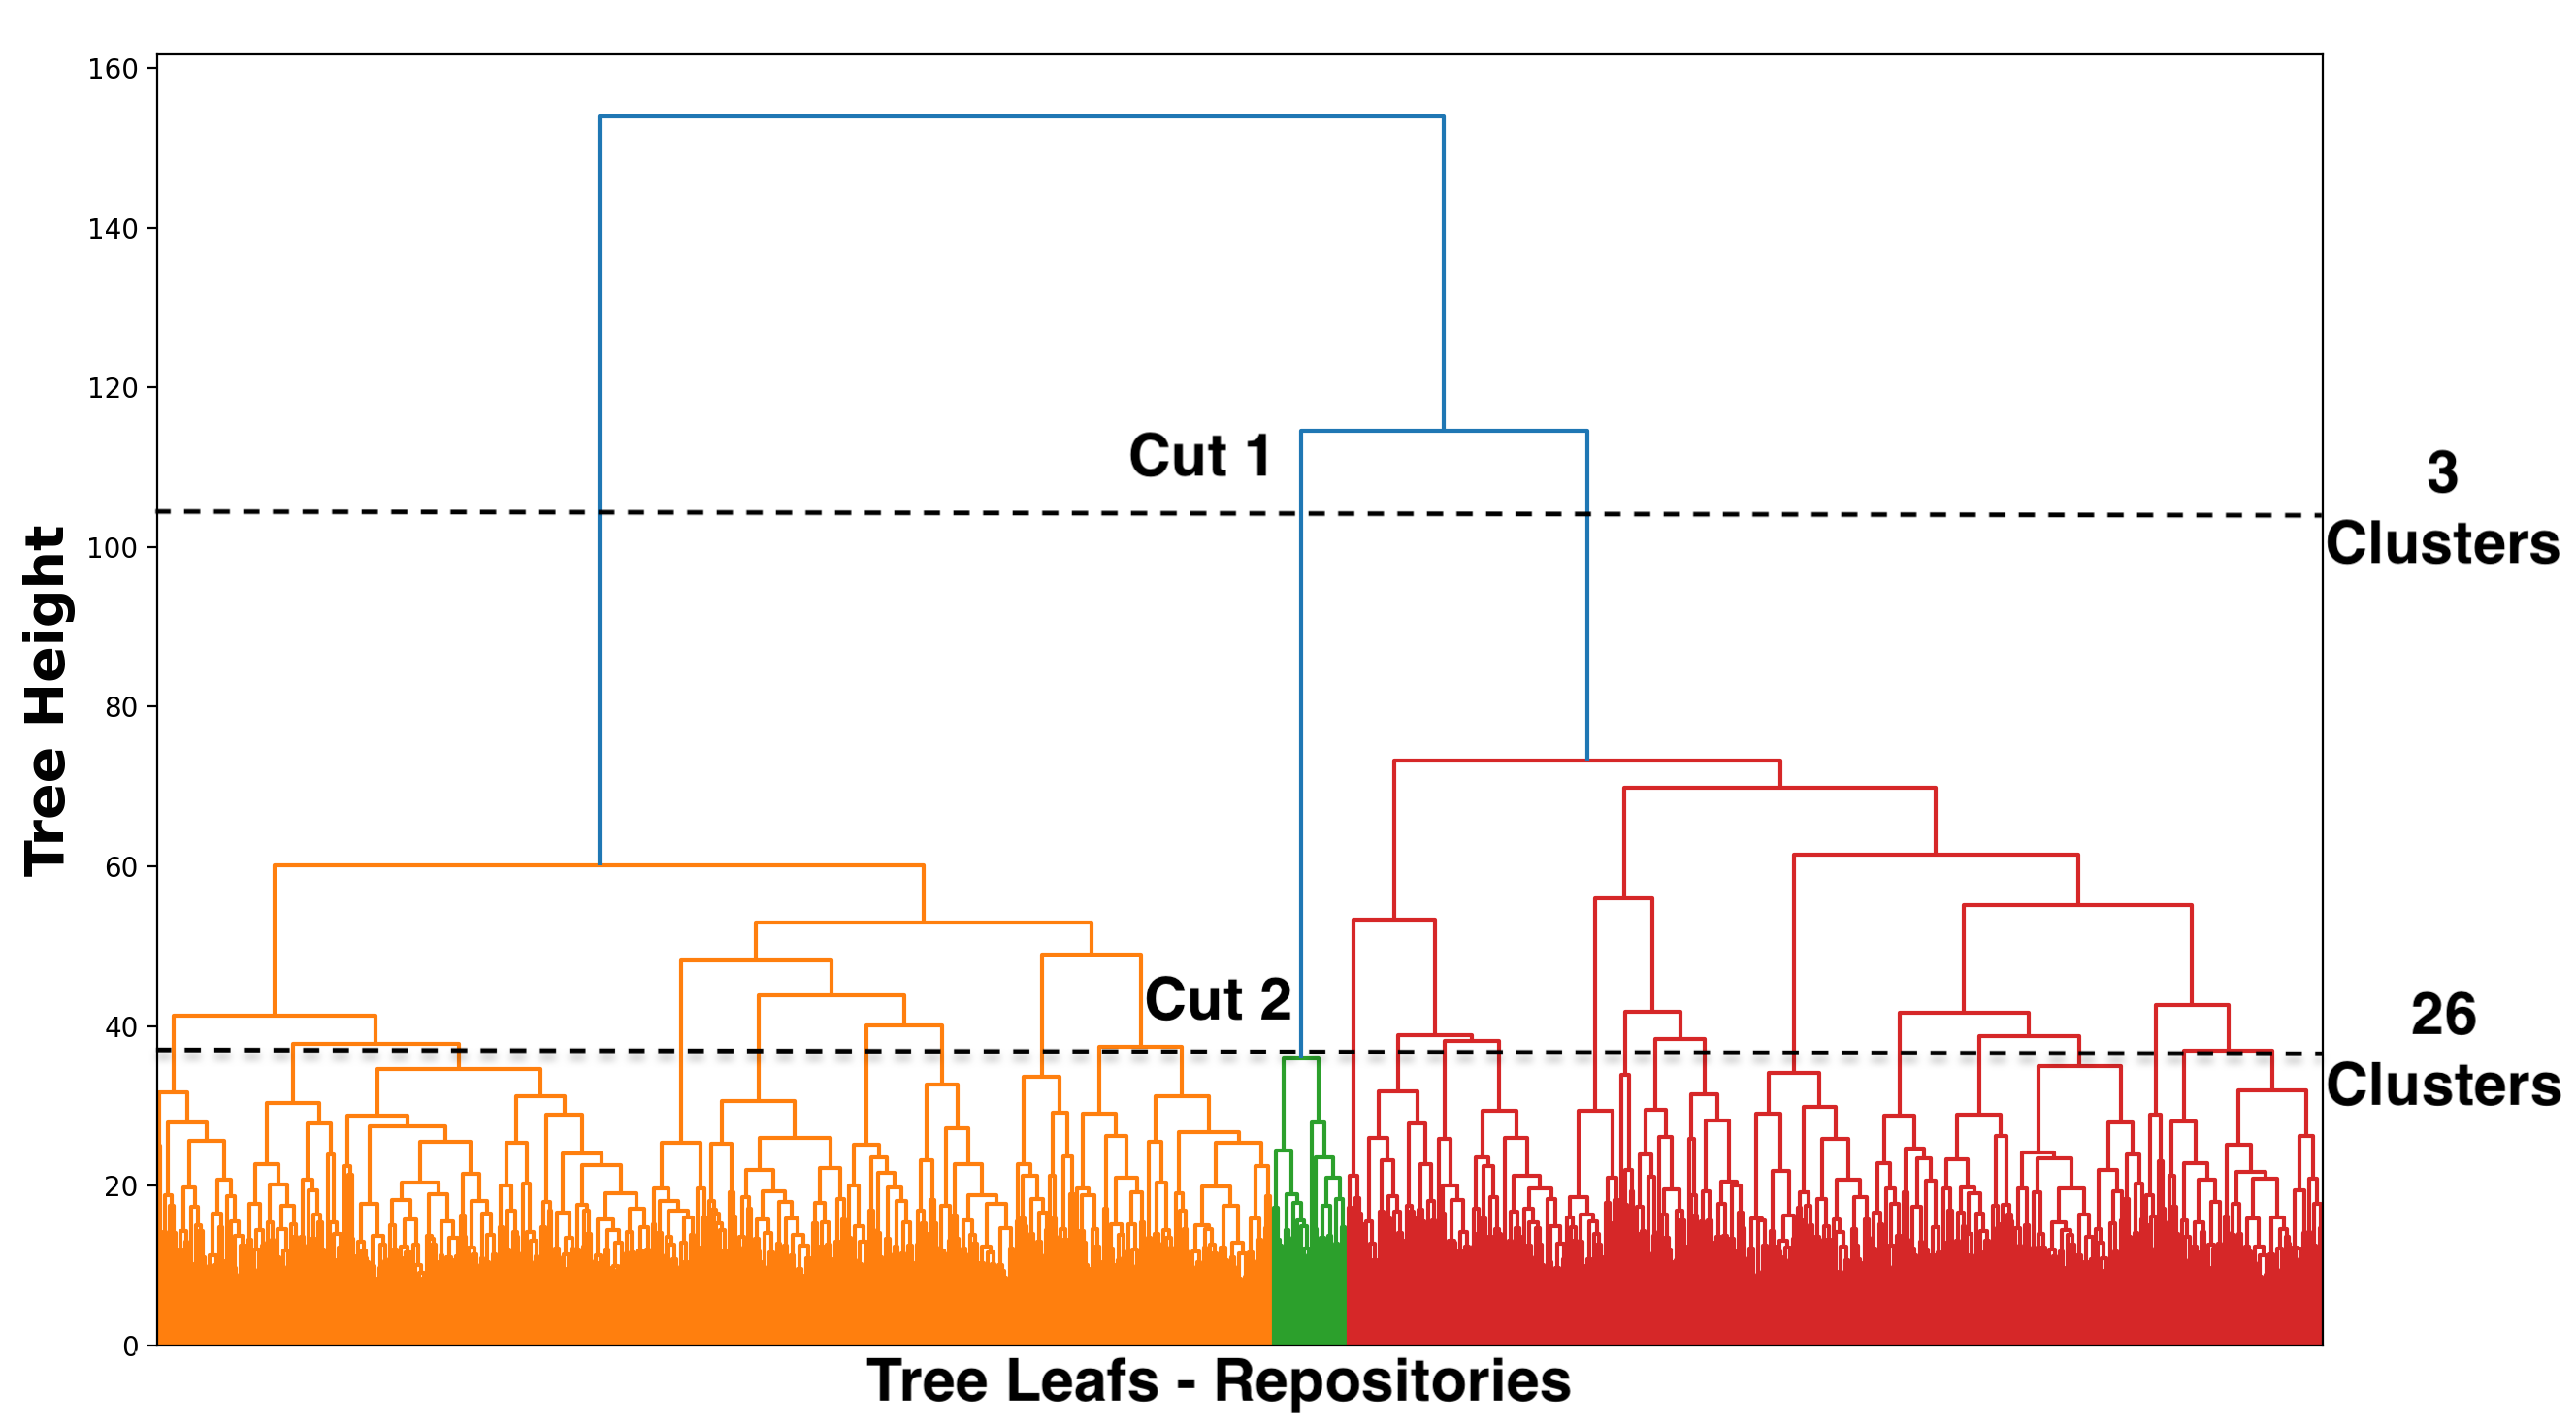
First, we apply Repo2Vec on all the repositories and get the embedding vectors. Second, we apply the widely-used agglomerative hierarchical clustering (AGNES) [29] on the vectors of the repositories. Clearly, there are many different clustering techniques, but note that our goal is to showcase the capability and not to propose a clustering method. We show the resulting hierarchical clustering in Figure 7.
How meaningful is this clustering? Assessing the effectiveness of a hierarchical clustering is challenging and it can depend on specific focus of a study. A related question is at what levels of granularity we should focus. We provide indirect proof that our clustering provides meaningful results.
Considering two levels of granularity. We analyze our hierarchical clustering at two different levels of granularity, which are represented by two horizontal lines in Figure 7. The first line (Cut 1) corresponds to a coarse level of granularity and yields three large clusters. The second line (Cut 2) corresponds to fine level of granularity and yields 26 smaller clusters.
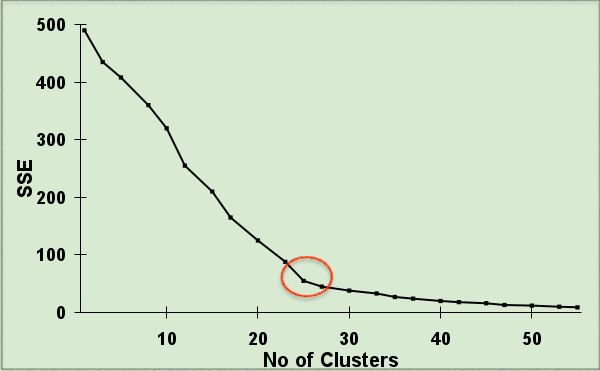
We elaborate on how we select the two cuts in the dendogram in Figure 7. First, we select Cut 1 to see if the clustering distinguishes the malware from the benign repositories. Second, we select a Cut 2 in a way that optimizes the number of clusters. A commonly-used approach is the elbow method [30]. The elbow or knee of a curve is a cutoff point in the number of clusters versus sum of squared error (SSE) graph, where increasing the number of cluster shows diminishing returns. Figure 8 shows that the elbow lies at around K=26 clusters, which is how we select Cut 2.
 |
Our goal is to profile the identified clusters at both levels of granularity. The results are shown in Table IV and V.
1. Fine level cluster profiling: We want to evaluate the nature and the cohesiveness of the 26 clusters at this level. We extract the profile of each cluster in terms of its focus and we present the results in Table IV. Our profiling consists of two steps: (a) we identify the dominant keywords of the cluster and (b) we assess how aligned its repository is to the profile cluster. In more detail, we identify the cluster topics using Latent Dirichlet Analysis (LDA) topic modeling [31] on the metadata of each repository. Note that we use a randomly selected subset of half of the repositories in the cluster. Second, we want to identify the most dominant topic among all the candidate topics. The most dominant topic is the one that appears in the most repositories of the cluster. We report that topic in table IV. The cohesiveness of the cluster is substantial: at least 80% of the inspected repositories are clearly members of the family of the cluster. Finally, as an extra optional step, we manually investigate the repositories to verify the accuracy of the profile.
This process gives us both cohesive and ”focused” clusters. Most of the clusters contain repositories from narrowly-defined malware or benign software families, such as Android Botnet, Keyloggers, Trojan, DDoS, Backdoor, Hadoop, Json parser, Elastic Search, and Spring MVC.
We provide an indication of an insight that can be extracted here. Interestingly, the largest malware cluster (cluster 15) with 58 repositories contains repositories from Trojan and spyware malware families. A Trojan malware program is similar to spyware except that it is packaged as another program. This observation can give rise to the following hypothesis: could Trojan and Spyware have more in common than we thought?
2. Coarse level cluster profiling: The overarching observation is that the three clusters of this level correspond correctly to different software domains as shown in Table V. We find that following clusters: (a) the D_mal, malware repositories, (b) the D_ben, benign repositories, and (c) REST API related benign repositories, which correspond to cluster 16 in the fine granularity clustering. The fact that the unsupervised clustering separated malware and benign repositories suggests that malware and benign software are different. The only exception seems to be the REST API cluster 16, which would have been bundled with the malware repositories if we have created a two cluster decomposition. We argue that the REST API repositories seem to resemble ddos and botnet malware (opening and listening to ports etc).
VI Discussion
In this section, we discuss the scope, extensions, and limitation of our study.
a. What are the limitations of Repo2Vec? As Repo2Vec is a comprehensive approach with data from three different sources, it performs even if every data source is not present. However, we believe unstructured software repositories with evasive metadata and obfuscated source code might fool Repo2Vec. In this case, previous works might perform better as these mostly depend on the graph connection of repositories.
b. Will our approach generalize to other programming language repositories? Our approach is generalizable and extendable for all programming languages, though accuracy levels may vary. First, code2vec [21] can be extended to other programming languages, and the researchers seem to have plans to expand to other languages. Second, two information types, metadata, and structure, are fairly programming-language independent. Furthermore, from Table I, we can see that even using only these two information types, we can achieve reasonably good performance.
c. What will happen if the quality of metadata is low or misleading? If metadata becomes unreliable, we could decrease its weight in our algorithm. At the same time, we find that developers have an inherent motivation to provide quality metadata. First, these repositories are part of the developers professional persona, and part of one’s professional portfolio or resume. Second, these repositories are public, therefore there is an intention to make them both easy to find and easy to use. The bragging rights of having a popular repository is a strong motivation to provide informative metadata. Hence, the number of these type of repositories tend to be very low. We only have 1 in 580 (0.17%) repositories in D_ben, and 3 in 433 (0.69%) repositories in D_mal with an empty metadata. Also, as Repo2Vec is a comprehensive approach with data from three information sources, even if metadata is unavailable, it will perform sufficiently.
d. Why is GitHub search not sufficient to identify similar repositories? GitHub only allows the retrieval of repositories based on the keywords. Though very useful, GitHub’s query capability is not answering the problem that we address here. First, it does not support query by example: ”find the most similar repositories to this repository”. Second, it does not provide the ability to measure similarity between a pair of repositories or rank a group of repositories based on similarity to a given repository. Third, the service does not seem to use source-code which as we saw, provides significant improvement.
e. Are our datasets representative? This is the typical hard question to answer for any measurement study. We attempt to answer the question by making two statements. First, we evaluate our approach with the same dataset of 580 repositories (D_ben) used by well-known prior studies [11, 12]. This dataset attempts to include repositories from ten different families as listed in Table IV. Second, our D_mal dataset includes 13 types of malware families listed in the same table. In the future, we intend to collect more repositories in our dataset and include more programming languages. The key bottleneck is the creation of groundtruth.
f. Should we consider the popularity metrics? So far, we did not consider the popularity metrics of the repositories, such as the number of stars, watches, and forks. While we intend to examine what information we can extract from such metrics, we argue that they will mostly help in finding the representative or influential repositories. Our preliminary analysis suggests that popularity does not provide information w.r.t. the type of the repository. As a proof of concept, we can consider an initial and a forked repository: they are most likely nearly identical, but their popularity metrics can vary significantly.
VII Related Works
Studying the similarity among software repositories has gained significant attention in the last few years. Most studies differ from our approach in that: (a) they do not incorporate all types of data present in a repository, (b) they do not present a feature vector keeping the semantic meaning of the metadata, source code, and structure of a repository, and (c) their approaches are not suitable for other ML classification tasks such as repository family classification, malware and benign repository classification, etc. We discuss the related works briefly below.
a. Software similarity computation: The prior studies in software similarity computation can be classified mainly into three groups based on the data they use: (a) high level meta data [7, 5, 6, 8], (b) low level source code [9, 10], and (c) the combination of both high and low level data [11, 12].
In an earlier study [7], authors utilize repository tags to compute the similarity among repositories written in different languages. Capturing the weights of tags present in a repository, they create the feature vector and apply cosine similarity to compute the similarity. Later, [5] proposes a library recommendation method, LibRec, using association rule mining and collaborative filtering techniques. It searches for the similar repositories to recommend related libraries for developers. Another effort [6] proposes SimApp to identify mobile applications with similar semantic requirements. A recent approach, RepoPal [8], utilizes readme file, and stars property of GitHub repositories to compute the similarity between two repositories.
On the other hand, MUDABLUE [9] is the first automatic approach to categorize the software repositories using Latent Semantic Analysis (LSA) on source code. Considering the source code as plain text, they create a identifiers-software matrix and apply LSA on it to compute the similarity. Later, another study [32] categorizes the software repositories applying Latent Dirichlet Allocation (LDA) on the source codes. A recent study named CLAN [10] computes the similarity between repositories by representing the source code files as a term-document matrix (TDM) where every class represents a row and the repositories are the columns.
Finally, a very recent study [11, 12] proposes CrossSim, a graph based similarity computation approach using both high level star property and API call references in source code files in a repository. Utilizing the mutual relationship, they represent a set of repositories as a graph and compute the similar repositories of a given repository from the graph. However, their work is limited by the external library call which may fool as the similarity will largely depends on it. Another study [33] has confirmed that CrossSim may identify dissimilarity based on external API usage while internally implementing similar functionalities.
b. Embedding approaches: A recent advancement in Natural Language Processing (NLP) has opened a whole new way of feature representation, a neural network based feature learning approach for discrete objects. First, introduction of word2vec [15], a continuous vector representation of words from very large corpus, has paved the way. Later, another study named doc2vec [14] introduces a distributed representation of variable length paragraph or documents. More recently, the embedding concept is being shared in other domains and has gained enormous success in effective feature representation such as graph embedding [20, 19], topic embedding [34], tweet embedding [35], and code embedding [21, 36, 37, 38].
VIII Conclusions
We present Repo2Vec, an approach to represent a repository in an embedding vector utilizing data from three types of information sources: (a) metadata, (b) repository structure, and (c) source code available in a repository. The main idea is to aggregate the embedding representations from these three types of information.
Our work can be summarized in the following points:
-
1.
A highly effective embedding: Repo2Vec is a comprehensive embedding approach, which enables us to determine similar repositories with 93% precision.
-
2.
Improving the state of the art: Our approach outperforms the best known method, CrossSim, by a margin of 15% in terms of precision. Also, it finds nearly twice as many Strongly Similar repositories and 30% less False Positives.
-
3.
Facilitating the identification of malware: Our approach can classify the malware and benign repositories with 98% precision outperforming previous studies.
-
4.
Enabling meaningful clustering: Our approach identifies a tree hierarchy of repositories that aligns well with their purpose and lineage.
In the future, we first plan to extend the work with a larger dataset and a more extensive ground truth dataset. In fact, we would like to help develop a community-wide benchmark that will facilitate further research. Second, we would like to extend our work to other programming languages, which hinges mostly on developing a code2vec capability for other languages. It would be interesting to see if different languages lend themselves to embedding representations the same way we are able to do here with Java.
Finally, we intend to open-source our code and datasets to maximize the impact of our work and facilitate follow up research.
References
- [1] A. Mockus, D. Spinellis, Z. Kotti, and G. J. Dusing, “A complete set of related git repositories identified via community detection approaches based on shared commits,” in IEEE International Working Conference on Mining Software Repositories, 2020.
- [2] D. Spinellis, Z. Kotti, and A. Mockus, “A dataset for github repository deduplication: Extended description,” in IEEE International Working Conference on Mining Software Repositories, 2020.
- [3] M. Gharehyazie, B. Ray, and V. Filkov, “Some from here, some from there: Cross-project code reuse in github,” in 2017 IEEE/ACM 14th International Conference on Mining Software Repositories (MSR). IEEE, 2017, pp. 291–301.
- [4] A. Mockus, “Large-scale code reuse in open source software,” in First International Workshop on Emerging Trends in FLOSS Research and Development (FLOSS’07: ICSE Workshops 2007). IEEE, 2007, pp. 7–7.
- [5] F. Thung, D. Lo, and J. Lawall, “Automated library recommendation,” in 2013 20th Working conference on reverse engineering (WCRE). IEEE, 2013, pp. 182–191.
- [6] N. Chen, S. C. Hoi, S. Li, and X. Xiao, “Simapp: A framework for detecting similar mobile applications by online kernel learning,” in Proceedings of the Eighth ACM International Conference on Web Search and Data Mining, 2015, pp. 305–314.
- [7] F. Thung, D. Lo, and L. Jiang, “Detecting similar applications with collaborative tagging,” in 2012 28th IEEE International Conference on Software Maintenance (ICSM). IEEE, 2012, pp. 600–603.
- [8] Y. Zhang, D. Lo, P. S. Kochhar, X. Xia, Q. Li, and J. Sun, “Detecting similar repositories on github,” in 2017 IEEE 24th International Conference on Software Analysis, Evolution and Reengineering (SANER). IEEE, 2017, pp. 13–23.
- [9] S. Kawaguchi, P. K. Garg, M. Matsushita, and K. Inoue, “Mudablue: An automatic categorization system for open source repositories,” Journal of Systems and Software, vol. 79, no. 7, pp. 939–953, 2006.
- [10] C. McMillan, M. Grechanik, and D. Poshyvanyk, “Detecting similar software applications,” in 2012 34th International Conference on Software Engineering (ICSE). IEEE, 2012, pp. 364–374.
- [11] P. T. Nguyen, J. Di Rocco, R. Rubei, and D. Di Ruscio, “Crosssim: exploiting mutual relationships to detect similar oss projects,” in 2018 44th Euromicro conference on software engineering and advanced applications (SEAA). IEEE, 2018, pp. 388–395.
- [12] ——, “An automated approach to assess the similarity of github repositories,” Software Quality Journal, pp. 1–37, 2020.
- [13] M. O. F. Rokon, R. Islam, A. Darki, E. E. Papalexakis, and M. Faloutsos, “Sourcefinder: Finding malware source-code from publicly available repositories in github,” in 23rd International Symposium on Research in Attacks, Intrusions and Defenses (RAID 2020), 2020, pp. 149–163.
- [14] Q. Le and T. Mikolov, “Distributed representations of sentences and documents,” in International conference on machine learning, 2014, pp. 1188–1196.
- [15] T. Mikolov, I. Sutskever, K. Chen, G. S. Corrado, and J. Dean, “Distributed representations of words and phrases and their compositionality,” Advances in neural information processing systems, vol. 26, pp. 3111–3119, 2013.
- [16] J. Pennington, R. Socher, and C. D. Manning, “Glove: Global vectors for word representation,” in Proceedings of the 2014 conference on empirical methods in natural language processing (EMNLP), 2014, pp. 1532–1543.
- [17] M. E. Peters, M. Neumann, M. Iyyer, M. Gardner, C. Clark, K. Lee, and L. Zettlemoyer, “Deep contextualized word representations,” arXiv preprint arXiv:1802.05365, 2018.
- [18] S. Kottur, R. Vedantam, J. M. Moura, and D. Parikh, “Visual word2vec (vis-w2v): Learning visually grounded word embeddings using abstract scenes,” in Proceedings of the IEEE Conference on Computer Vision and Pattern Recognition, 2016, pp. 4985–4994.
- [19] A. Narayanan, M. Chandramohan, R. Venkatesan, L. Chen, Y. Liu, and S. Jaiswal, “graph2vec: Learning distributed representations of graphs,” arXiv preprint arXiv:1707.05005, 2017.
- [20] A. Grover and J. Leskovec, “node2vec: Scalable feature learning for networks,” in Proceedings of the 22nd ACM SIGKDD international conference on Knowledge discovery and data mining, 2016, pp. 855–864.
- [21] U. Alon, M. Zilberstein, O. Levy, and E. Yahav, “code2vec: Learning distributed representations of code,” Proceedings of the ACM on Programming Languages, vol. 3, no. POPL, pp. 1–29, 2019.
- [22] R. Compton, E. Frank, P. Patros, and A. Koay, “Embedding java classes with code2vec: Improvements from variable obfuscation,” Proceedings of the 17th International Conference on Mining Software Repositories, 2020.
- [23] J. Gharibshah, E. E. Papalexakis, and M. Faloutsos, “Rest: A thread embedding approach for identifying and classifying user-specified information in security forums,” in Proceedings of the International AAAI Conference on Web and Social Media, vol. 14, 2020, pp. 217–228.
- [24] C. Spearman, “The proof and measurement of association between two things.” Appleton-Century-Crofts, 1961.
- [25] G. Sidorov, A. Gelbukh, H. Gómez-Adorno, and D. Pinto, “Soft similarity and soft cosine measure: Similarity of features in vector space model,” Computación y Sistemas, vol. 18, no. 3, pp. 491–504, 2014.
- [26] M. Soll and M. Vosgerau, “Classifyhub: an algorithm to classify github repositories,” in Joint German/Austrian Conference on Artificial Intelligence (Künstliche Intelligenz). Springer, 2017, pp. 373–379.
- [27] Y. Zhang, F. F. Xu, S. Li, Y. Meng, X. Wang, Q. Li, and J. Han, “Higitclass: Keyword-driven hierarchical classification of github repositories,” in 2019 IEEE International Conference on Data Mining (ICDM). IEEE, 2019, pp. 876–885.
- [28] S. Xu, “Bayesian naïve bayes classifiers to text classification,” Journal of Information Science, vol. 44, no. 1, pp. 48–59, 2018.
- [29] F. Murtagh and P. Legendre, “Ward’s hierarchical agglomerative clustering method: which algorithms implement ward’s criterion?” Journal of classification, vol. 31, no. 3, pp. 274–295, 2014.
- [30] T. M. Kodinariya and P. R. Makwana, “Review on determining number of cluster in k-means clustering,” International Journal, vol. 1, no. 6, pp. 90–95, 2013.
- [31] D. M. Blei, A. Y. Ng, and M. I. Jordan, “Latent dirichlet allocation,” Journal of machine Learning research, vol. 3, no. Jan, pp. 993–1022, 2003.
- [32] K. Tian, M. Revelle, and D. Poshyvanyk, “Using latent dirichlet allocation for automatic categorization of software,” in 2009 6th IEEE International Working Conference on Mining Software Repositories. IEEE, 2009, pp. 163–166.
- [33] A. Capiluppi, D. Di Ruscio, J. Di Rocco, P. T. Nguyen, and N. Ajienka, “Detecting java software similarities by using different clustering techniques,” Information and Software Technology, vol. 122, p. 106279, 2020.
- [34] L. Niu, X. Dai, J. Zhang, and J. Chen, “Topic2vec: learning distributed representations of topics,” in 2015 International conference on asian language processing (IALP). IEEE, 2015, pp. 193–196.
- [35] B. Dhingra, Z. Zhou, D. Fitzpatrick, M. Muehl, and W. W. Cohen, “Tweet2vec: Character-based distributed representations for social media,” arXiv preprint arXiv:1605.03481, 2016.
- [36] T. Hoang, H. J. Kang, D. Lo, and J. Lawall, “Cc2vec: Distributed representations of code changes,” in Proceedings of the ACM/IEEE 42nd International Conference on Software Engineering, 2020, pp. 518–529.
- [37] H. J. Kang, T. F. Bissyandé, and D. Lo, “Assessing the generalizability of code2vec token embeddings,” in 2019 34th IEEE/ACM International Conference on Automated Software Engineering (ASE). IEEE, 2019, pp. 1–12.
- [38] B. Theeten, F. Vandeputte, and T. Van Cutsem, “Import2vec: Learning embeddings for software libraries,” in 2019 IEEE/ACM 16th International Conference on Mining Software Repositories (MSR). IEEE, 2019, pp. 18–28.