Evidence for profile changes in PSR J1713+0747 using the uGMRT
Abstract
PSR J1713+0747 is one of the most precisely timed pulsars in the international pulsar timing array experiment. This pulsar showed an abrupt profile shape change between April 16, 2021 (MJD 59320) and April 17, 2021 (MJD 59321). In this paper, we report the results from multi-frequency observations of this pulsar carried out with the upgraded Giant Metrewave Radio Telescope (uGMRT) before and after the event. We demonstrate the profile change seen in Band 5 (1260 MHz – 1460 MHz) and Band 3 (300 MHz – 500 MHz). The timing analysis of this pulsar shows a disturbance accompanying this profile change followed by a recovery with a timescale of days. Our data suggest that a model with chromatic index as a free parameter is preferred over models with combinations of achromaticity with DM bump or scattering bump. We determine the frequency dependence to be .
keywords:
(stars:) pulsars: general – (stars:) pulsars: individual (PSR J1713+0747)1 Introduction
Radio pulsars generally show little variability in their average pulse profiles obtained after adding a large number of phase-aligned individual pulses. However, there are notable exceptions, where a pulsar switches between two or more distinct average profile shapes. This phenomenon, first noted by Backer (1970) and Lyne (1971), is known as a profile mode change and has been reported in many slow pulsars (Rankin, 1993; Wang et al., 2007). Mode changes may be accompanied by changes in the timing behaviour of the pulsar (Lyne et al., 2010), which can potentially degrade their timing precision and accuracy.
Pulsar Timing Array (PTA: Foster & Backer, 1990) experiments, such as the European Pulsar Timing Array (EPTA: Kramer & Champion, 2013), the Indian Pulsar Timing Array (InPTA: Joshi et al., 2018), the North American Nanohertz Observatory for Gravitational Waves (NANOGrav: McLaughlin, 2013), the Parkes Pulsar Timing Array (PPTA: Hobbs, 2013), and the International Pulsar Timing Array (IPTA: Hobbs et al., 2010), rely on precision timing of millisecond pulsars (MSPs) to detect nanohertz gravitational waves (GWs). While common in slow pulsars, phenomena similar to mode changes have been reported in only two millisecond pulsars till date. A periodic change in the profile over a timescale of about 2 s was reported for the first-detected black widow pulsar, PSR B1957+20 (Mahajan et al., 2018). A distinct profile change was reported in PSR J16431224 around MJD 57074 by Shannon et al. (2016), which introduced systematics in the timing residuals of this pulsar at 10 cm and 20 cm bands. Notably, this pulsar is included in the PTA experiments, and such events may hamper the PTA experiments in their quest to detect nanohertz GWs. Therefore, it is crucial to look for and accurately study and model the mode changes and similar phenomena in PTA pulsars. This will allow us to explore their implications and ensure continued high precision timing.
PSR J1713+0747 is a 4.6 ms pulsar with a low-mass white dwarf companion (Foster et al., 1993), and has the second lowest measured timing noise behaviour in the PTA ensemble (Perera et al., 2019). However, this pulsar has shown two timing events in the past, where a jump in the timing residuals was observed followed by an exponential recovery with timescales of about 62 days in 2008, and 25 days in 2016 (Lam et al., 2018; Goncharov et al., 2020). Both these events were interpreted as chromatic events, suggesting a connection with the line-of-sight passing through inter-stellar medium (ISM) structures (Lin et al., 2021). No evidence was reported for a change in the average profile of this pulsar in the first event but Goncharov et al. (2020) reported changes in the pulse profile associated with the second event.
A profile change event was recently reported in PSR J1713+0747 by Xu et al. (2021) using the Five hundred metre Aperture Spherical Telescope (FAST), Meyers & Chime/Pulsar Collaboration (2021) using the Canadian Hydrogen Intensity Mapping Experiment (CHIME) and Singha et al. (2021) using the uGMRT. Meyers & Chime/Pulsar Collaboration (2021) constrained the time of the event to between MJDs 59320 and 59321. This source is currently being actively monitored by multiple pulsar timing groups and PTAs, which are part of the IPTA using multiple telescopes. In this work, we report the evidence of a significant change in the pulse profile of this pulsar accompanied by a change in timing behaviour. The details of our observations are described in Section 2 followed by a brief description of our analysis and results in Section 3. The implications of this event are discussed in Section 4.
2 Observations and data reduction
PSR J1713+0747 was observed with the uGMRT (Gupta et al., 2017) as part of the Indian Pulsar Timing Array (InPTA: Joshi et al., 2018) observing program before and after the profile change event reported here, as well as via a Director’s Discretionary Time (DDT) project after the event. The InPTA observations were carried out using two sub-arrays of 10 and 15 antennae at 300500 MHz (Band 3) and 12601460 MHz (Band 5), respectively. The two frequency bands were covered in a single observing session simultaneously. While the antennae in both the arrays were phased before forming a sum, Band 3 data were also coherently dedispersed to the known dispersion measure (DM) of the pulsar using a real-time pipeline (De & Gupta, 2016). Simultaneous coverage of such widely separated frequency bands is a unique feature of the uGMRT observations. In addition, single-band observations at Band 3 were carried out on some of the epochs allocated in the DDT project. All observations used 200 MHz bandwidth. This bandwidth was split into 256 and 128 sub-bands (before and after MJD 59348, respectively) for Band 3 and 1024 sub-bands for Band 5 observations, respectively.
The time-series data were recorded using the GMRT Wide-band Backend (GWB: Reddy et al., 2017) together with the timestamp at the start of the observation with a sampling time of 10 s (before MJD 59348) and 5 s (after MJD 59348) at Band 3, and 40 s at Bands 5. The raw time-series were further reduced to Timer format (van Straten & Bailes, 2011) using the pinta pipeline (Susobhanan et al., 2021). Further analysis was carried out using the widely-used pulsar software PSRCHIVE (Hotan et al., 2004). The time-series were folded using pulsar ephemeris derived from the IPTA Data Release 2 (IPTA DR2: Perera et al., 2019). Out of the two radio-frequency mitigation methods available in pinta, we exclusively use RFIClean (Maan et al., 2021) in this work.
3 Analysis and Results
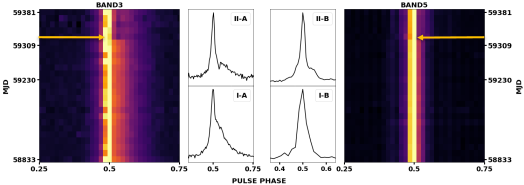
We used 20 observing epochs before the event with a cadence of around 14 days, and 6 epochs after the event with cadence ranging from 3-10 days. After dedispersion and collapsing all the sub-integrations and sub-bands, the folded profiles were normalised with the area under the profile and then stacked together to produce a single multi-epoch file for each of Band 3 and 5. These stacked profiles are shown as colour-map plots in Figure 1, where a distinct change is seen in both Band 3 and Band 5 before and after MJD 59321, reported to be the epoch of the event (Meyers & Chime/Pulsar Collaboration, 2021). The reduced data were collapsed in frequency and time for typical profiles before and after the event for both the bands and these are shown in the central panels of Figure 1. We see that the broad central component has given way to a narrow central component with the appearance of a weaker broad trailing component in Band 3 after the epoch of transition (EoT). On the other hand, the leading component has weakened with the appearance of a trailing component in Band 5 data. This is similar to the behaviour of the mode changing multi-component profile pulsar like PSR J0332+5434 (Lyne, 1971; Liu et al., 2006; Chen et al., 2011).
3.1 Profile Analysis
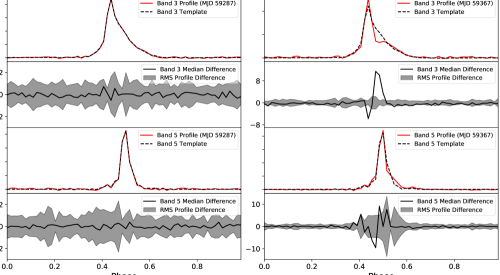
We quantified the degree of change in the profile as follows. First, a high signal-to-noise ratio (S/N) template profile was formed by averaging all the profiles before the event. Then, the profiles at individual epochs, both before and after the event, were scaled and shifted to align with this template using a frequency-domain cross-correlation method (Taylor, 1992). The scaled and shifted profiles were then subtracted from the template to form profile differences, and were examined for significant deviations. These comparisons for both the bands before and after the event are shown in Figure 2. The first and third rows in this figure show the profile for typical individual epochs before and after the EoT overlaid on the templates for Band 3 and Band 5, respectively. The median and standard deviation of the profile differences normalised by the off-pulse root-mean-square (RMS) obtained over all the epochs are shown in the second and fourth rows of this figure for epochs before and after the EoT. A peak deviation of about 12 and 8 times off-pulse RMS is seen for the profiles after the EoT, whereas all profiles for pre-EoT epochs seem to be consistent with the template profile. A much higher variability (12 times the off-pulse RMS) is evident for post-EoT profiles at Band 5 compared to Band 3.
3.2 Timing Analysis
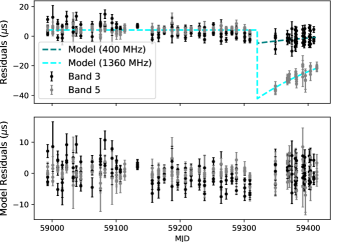
The impact of this profile change event on the timing of this ‘high-quality timing pulsar’ for the PTA experiments is important to examine. For the timing analysis, both the Band 5 and Band 3 data were collapsed to 4 sub-bands and a single frequency-resolved template was constructed from the highest S/N profile before the EoT in both bands. Multi-frequency times-of-arrival (TOAs) were then obtained by cross-correlation in the Fourier domain (Taylor 1992), and analysed using TEMPO2 (Hobbs et al. 2006; Edwards et al. 2006) in the TCB frame with the DE436 solar system ephemeris. The timing residuals obtained from this analysis are shown in Figure 3 as black (Band 3) and grey (Band 5) points. The phase jump seen in the timing residuals can be attributed to the profile change event and can be seen at all sub-bands in both Band 3 and Band 5. A hint of recovery is also visible, suggesting that the average profile is relaxing to its original shape. We observe that the timing jump and the subsequent recovery are stronger in Band 5 than in Band 3. This faster recovery following a larger jump seen in Band 5, as compared to Band 3, is also consistent with the higher variability of the Band 5 post-event profiles (indicated by increased standard deviation) as seen in Figure 2 (row 4, right column).
We investigated the frequency dependence of the timing event by assuming a jump plus exponential recovery models with different observing frequency () dependencies of the form . These models can be expressed mathematically as
where is the amplitude of the event, is the EoT, is the recovery timescale and is the chromatic index. Depending on the sign of the amplitude , the model can be a dip () or a bump (). From Figure 3, it is clear that we can immediately rule out all pure dip models with , including pure achromatic dip (), dispersion measure (DM) dip () and scattering dip (), since the jump is clearly stronger in Band 5 (higher frequency) than in Band 3 (lower frequency). Therefore, we investigate three alternative models to fit the timing jump and recovery: (A) a model with chromatic index as a free parameter, (B) an achromatic dip + DM bump model, and (C) an achromatic dip + scattering bump model. We used the ENTERPRISE package (Ellis et al., 2019) to compare these models to the timing residuals in a Bayesian framework. We assumed broad log-uniform priors for and , and a broad uniform prior for , whereas we used the constraint provided by Meyers & Chime/Pulsar Collaboration (2021) as an informative prior for . We find that, for the combined Band 3 and Band 5 data, the model A described above is preferred over model B and model C with Bayes factors of around and respectively (computed via nested sampling (Feroz et al., 2009) using the nestle package (Barbary, 2021)). We also cross-checked these Bayes factors outside of the ENTERPRISE framework using the dynesty package (Speagle, 2020), and confirmed that they agree with the ENTERPRISE-based estimates. According to the Jeffreys’ scale (Trotta, 2008), these point to decisive evidence for the model with chromatic index as a free parameter (model A) providing the best description of the data, amongst the models we investigated. The fit for model A is also plotted in Figure 3 along with the residuals after subtracting this model. The chromatic index in model A is estimated to be with an amplitude of 48 s and a recovery timescale of 159 days.
4 Discussion
We report the evidence for a profile change accompanied by a disturbance in the timing behaviour in PSR J1713+0747, which is known to be one of the three best timed pulsars (Perera et al., 2019; Kerr et al., 2020; Alam et al., 2020). The profile change is seen in both Band 3 and Band 5 data after MJD 59321 with a peak deviation of 12 and 8 times off-pulse RMS, and an enhanced variability in Band 5 profiles after the event. This variability appears to be linked with a jump that is followed by an exponential recovery seen in the timing residuals with a magnitude of 48 s and a recovery timescale of 159 days. These considerations make the present event more dramatic than the past two events seen in this pulsar. We find that a model with chromatic index as a free parameter suggesting a frequency dependence best describes this event, which is more consistent with its origin being at least partly magnetospheric rather than it being an ISM event.
We infer that the event is unlikely to be due to a change in the ISM alone as (a) the event appears to be more pronounced in Band 5 than in Band 3 with a chromatic index of , and (b) a profile change is seen in both high and low frequency bands. Although we cannot rule out a change in pulse scatter-broadening with the current data, this does not appear to be the cause of the event. The situation appears to be similar to the profile mode-change event in slow pulsars like PSR J0332+5434 (Lyne, 1971; Liu et al., 2006; Chen et al., 2011). If this is indeed the case, the tail-like feature seen before the event in the Band 3 profile is due to a profile component rather than prominent pulse broadening, implying that caution needs to be exercised in modeling ISM noise for this pulsar for PTA analysis.
Profile mode changes are believed to arise from a re-organisation of pulsar beams, probably due to global changes in the pulsar magnetosphere (Timokhin, 2010), and can exhibit quasi-periodicity (Lyne et al., 2010) accompanied by changes in the spin-down rate. This leads to higher timing noise in the pulsar (Naidu et al., 2017), which has the potential to degrade the precision achievable for PTA experiments relying on the high stability of MSPs. Moreover, Lam (2021) has reported the presence of multiple profile changes following this event. These observations motivate better modeling of these events.
The recovery seen in the timing can probably be explained by the magnetosphere of the star relaxing to the original configuration after switching abruptly to a new state. Such a recovery is not seen in any profile mode-changing pulsars so far. Hence, it provides a unique probe of magnetospheric physics, if the event can be interpreted as a profile mode change. We are continuing a high cadence monitoring campaign on the pulsar and strongly recommend continued dense monitoring in the future to establish the astrophysical reasons and implications of the present event.
Acknowledgements
This work is carried out by InPTA, which is part of the International Pulsar Timing Array consortium. We thank the staff of the GMRT who made our observations possible. GMRT is run by the National Centre for Radio Astrophysics of the Tata Institute of Fundamental Research. MPS acknowledges funding from the European Research Council (ERC) under the European Union’s Horizon 2020 research and innovation programme (grant agreement No. 694745). BCJ, PR, AS, AG, SD, LD, and YG acknowledge the support of the Department of Atomic Energy, Government of India, under project identification # RTI4002. BCJ and YG acknowledge support from the Department of Atomic Energy, Government of India, under project # 12-R&D-TFR-5.02-0700. AC acknowledge support from the Women’s Scientist scheme (WOS-A), Department of Science & Technology, India. NDB acknowledge support from the Department of Science & Technology, Government of India, grant SR/WOS-A/PM-1031/2014. SH is supported by JSPS KAKENHI Grant Number 20J20509. KT is partially supported by JSPS KAKENHI Grant Numbers 20H00180, 21H01130 and 21H04467, Bilateral Joint Research Projects of JSPS, and the ISM Cooperative Research Program (2021-ISMCRP-2017). We are grateful to the International Pulsar Timing Array consortium and the anonymous referee for useful feedback on the manuscript.
Data Availability
The data underlying this article will be shared on reasonable request to the corresponding author.
References
- Alam et al. (2020) Alam M. F., et al., 2020, ApJS, 252, 4
- Backer (1970) Backer D. C., 1970, Nature, 228, 1297
- Barbary (2021) Barbary K., 2021, nestle: Nested sampling algorithms for evaluating Bayesian evidence, http://kylebarbary.com/nestle/
- Chen et al. (2011) Chen J. L., Wang H. G., Wang N., Lyne A., Liu Z. Y., Jessner A., Yuan J. P., Kramer M., 2011, ApJ, 741, 48
- De & Gupta (2016) De K., Gupta Y., 2016, Experimental Astronomy, 41, 67
- Ellis et al. (2019) Ellis J. A., Vallisneri M., Taylor S. R., Baker P. T., 2019, ENTERPRISE: Enhanced Numerical Toolbox Enabling a Robust PulsaR Inference SuitE, https://github.com/nanograv/enterprise
- Feroz et al. (2009) Feroz F., Hobson M. P., Bridges M., 2009, MNRAS, 398, 1601
- Foster & Backer (1990) Foster R. S., Backer D. C., 1990, ApJ, 361, 300
- Foster et al. (1993) Foster R. S., Wolszczan A., Camilo F., 1993, ApJ, 410, L91
- Goncharov et al. (2020) Goncharov B., et al., 2020, MNRAS, 502, 478
- Gupta et al. (2017) Gupta Y., et al., 2017, Current Science, 113, 707
- Hobbs (2013) Hobbs G., 2013, Classical Quant. Grav., 30, 224007
- Hobbs et al. (2010) Hobbs G., et al., 2010, Classical Quant. Grav., 27, 084013
- Hotan et al. (2004) Hotan A. W., van Straten W., Manchester R. N., 2004, Publ. Astron. Soc. Australia, 21, 302
- Joshi et al. (2018) Joshi B. C., et al., 2018, Journal of Astrophysics and Astronomy, 39, 51
- Kerr et al. (2020) Kerr M., et al., 2020, Publ. Astron. Soc. Australia, 37, e020
- Kramer & Champion (2013) Kramer M., Champion D. J., 2013, Classical Quant. Grav., 30, 224009
- Lam (2021) Lam M. T., 2021, Research Notes of the AAS, 5, 167
- Lam et al. (2018) Lam M. T., et al., 2018, ApJ, 861, 132
- Lin et al. (2021) Lin F. X., Lin H.-H., Luo J., Main R., McKee J., Pen U.-L., Simard D., van Kerkwijk M. H., 2021, arXiv e-prints, p. arXiv:2106.09851
- Liu et al. (2006) Liu Z. Y., Wang N., Urama J. O., Manchester R. N., 2006, Chinese J. Astron. Astrophys., 6, 64
- Lyne (1971) Lyne A. G., 1971, MNRAS, 153, 27P
- Lyne et al. (2010) Lyne A., Hobbs G., Kramer M., Stairs I., Stappers B., 2010, Science, 329, 408
- Maan et al. (2021) Maan Y., van Leeuwen J., Vohl D., 2021, A&A, 650, A80
- Mahajan et al. (2018) Mahajan N., van Kerkwijk M. H., Main R., Pen U.-L., 2018, ApJ, 867, L2
- McLaughlin (2013) McLaughlin M. A., 2013, Classical Quant. Grav., 30, 224008
- Meyers & Chime/Pulsar Collaboration (2021) Meyers B., Chime/Pulsar Collaboration 2021, The Astronomer’s Telegram, 14652, 1
- Naidu et al. (2017) Naidu A., Joshi B. C., Manoharan P. K., Krishnakumar M. A., 2017, MNRAS, 475, 2375
- Perera et al. (2019) Perera B. B., et al., 2019, MNRAS, 490, 4666
- Rankin (1993) Rankin J. M., 1993, ApJ, 405, 285
- Reddy et al. (2017) Reddy S. H., et al., 2017, Journal of Astronomical Instrumentation, 6, 1641011
- Shannon et al. (2016) Shannon R. M., et al., 2016, ApJ, 828, L1
- Singha et al. (2021) Singha J., et al., 2021, The Astronomer’s Telegram, 14667, 1
- Speagle (2020) Speagle J. S., 2020, MNRAS, 493, 3132
- Susobhanan et al. (2021) Susobhanan A., et al., 2021, Publ. Astron. Soc. Australia, 38, e017
- Taylor (1992) Taylor J. H., 1992, Phil. Trans. R. Soc. London, Ser. A, 341, 117
- Timokhin (2010) Timokhin A. N., 2010, MNRAS, 408, L41
- Trotta (2008) Trotta R., 2008, Contemporary Physics, 49, 71
- Wang et al. (2007) Wang N., Manchester R. N., Johnston S., 2007, MNRAS, 377, 1383
- Xu et al. (2021) Xu H., et al., 2021, The Astronomer’s Telegram, 14642, 1
- van Straten & Bailes (2011) van Straten W., Bailes M., 2011, Publ. Astron. Soc. Australia, 28, 1