Multimodal Icon Annotation For Mobile Applications
Abstract.
Annotating user interfaces (UIs) that involves localization and classification of meaningful UI elements on a screen is a critical step for many mobile applications such as screen readers and voice control of devices. Annotating object icons, such as menu, search, and arrow backward, is especially challenging due to the lack of explicit labels on screens, their similarity to pictures, and their diverse shapes. Existing studies either use view hierarchy or pixel based methods to tackle the task. Pixel based approaches are more popular as view hierarchy features on mobile platforms are often incomplete or inaccurate, however it leaves out instructional information in the view hierarchy such as resource-ids or content descriptions. We propose a novel deep learning based multi-modal approach that combines the benefits of both pixel and view hierarchy features as well as leverages the state-of-the-art object detection techniques. In order to demonstrate the utility provided, we create a high quality UI dataset by manually annotating the most commonly used 29 icons in Rico, a large scale mobile design dataset consisting of 72k UI screenshots. The experimental results indicate the effectiveness of our multi-modal approach. Our model not only outperforms a widely used object classification baseline but also pixel based object detection models. Our study sheds light on how to combine view hierarchy with pixel features for annotating UI elements.
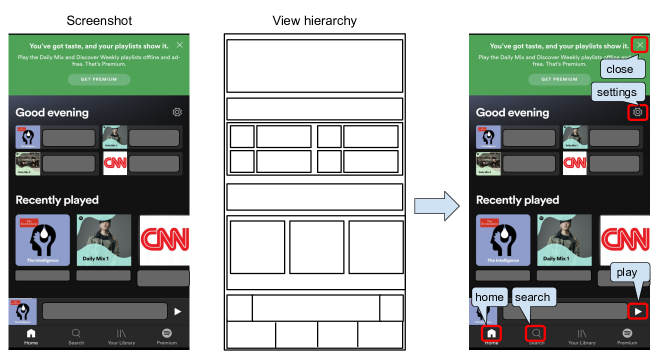
Three figures. First shows a screenshot of a music app. Second visualizes its corresponding view hierarchy. The third figure is the first screenshot annotated with icons.
1. Introduction
User interface (UI) element annotation is a task that localizes meaningful UI elements on a screen and classify their types. It is a critical task in mobile UI understanding and powers many accessibility applications such as TalkBack, a screen reader in Android, and Voice Access, which enables voice control of the phone (Li et al., 2020; Szpiro et al., 2016).
The act of annotating object icons, that are graphical symbols representing a function such as arrow forward, more, and menu, is especially challenging due to the lack of explicit textual labels of icons on screens, their similarity to pictures and variations in their appearance. Due to this variation, icons of the same class don’t necessarily have a unified appearance, and that similarly shaped icons aren’t semantically similar. An example is shown in Figure 2 where “X” shaped icon means differently (e.g. clear inputs, close the prompt, or multiplication) under different scenarios. All of the aforementioned challenges make simple image patch matching method infeasible for the icon annotation task.
Existing studies for UI element annotation either use view hierarchy based or pixel based methods. Figure 3 shows a UI with both pixel and view hierarchy features. Though pixel features reveal the shape of icons which plays an important role in determining their semantic types, view hierarchy attributes, such as class name, resource-id, and content descriptions, also contain useful information for the task. As shown in Figure 3, “resource-id” of thumbs down icon contains keywords “vote_down”, which serve as a useful signal implying its semantics. Thus, it is desirable to utilize both features to achieve better model performance.
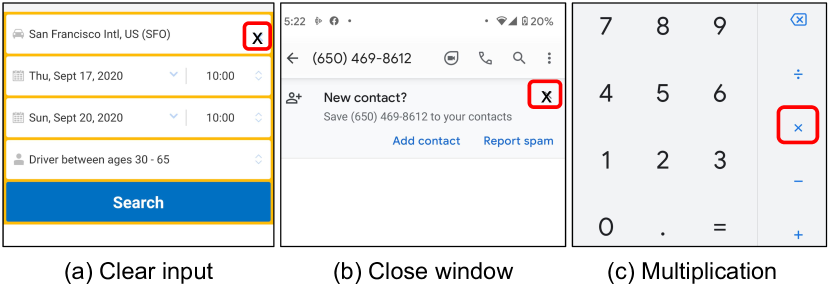
Three cropped UIs that have x-shaped icons. Their functions are respectively clearing input, closing window, and doing multiplication.
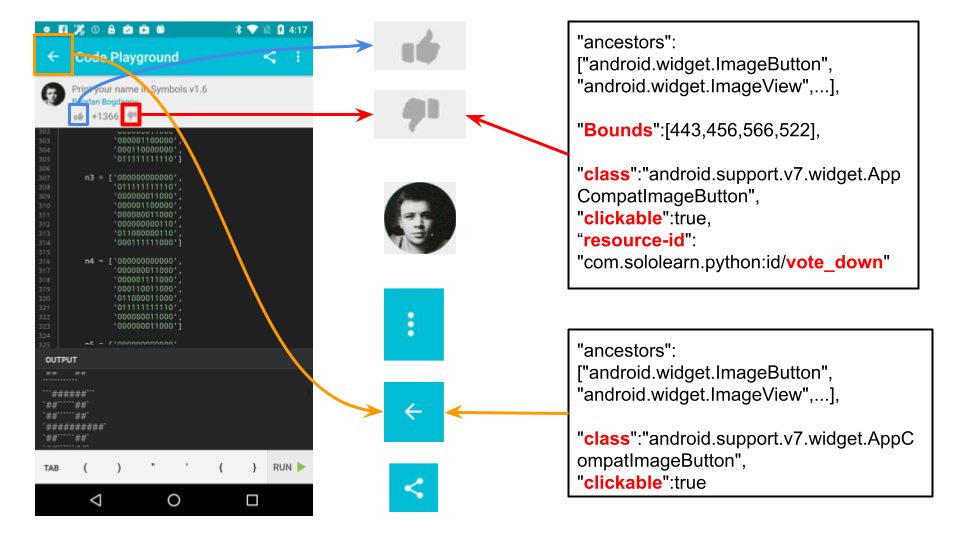
A screenshot that have some of its icon elements highlighted. A part of view hierarchy information that describes the thumb down and arrow back icons on the screenshot are also shown.
Moreover, prior work usually tackles the icon annotation task in two steps. For instance, Liu et al. (2018) first utilized the layout information in the view hierarchy to localize the icon elements and then adopted a pixel based object classification model to classify icon types. One problem of their approach is that view hierarchies may not precisely describe the UIs. The noise in view hierarchies leads to prediction errors of the model. Thus, Zhang et al. (2021) proposed a pixel based pipeline. They first used a pixel based object detection model to identify UI elements of different categories, such as icons, texts, pictures, and checkboxes. Then for UI elements that are identified as icons, another classification model is used to predict their fine-grained types. However, they also suffer from the issue that the errors in the first stage propagate to the second stage.
In this paper, we propose a multi-modal (image and text modality) single stage object detection model for icon annotation. It fuses pixel features and text attributes in view hierarchies such as resource-ids, content descriptions, and class names. Our model has several advantages over previous approaches. First, as an object detection model, it takes the whole UI screenshot as input, thus can leverage more contextual information compared with classification models. Taking Figure 2(c) as an example, if the “X” shaped icon co-occurs with numerical numbers, it’s more likely to mean multiplication than close or clear. However, such information is unavailable in the classification models as they only take the cropped UI element image as the input. Second, by fusing view hierarchy features with pixel features, the model is robust to noise in view hierarchies while taking advantage of the meaningful text features.
The performance of our model and baselines are evaluated on a large-scale mobile app design dataset Rico (Deka et al., 2017), which contains more than 72k unique UI screens and their view hierarchies. However, the locations of icons in the original Rico data are proposed by bounding boxes in the view hierarchy and their types are labeled automatically by an image classification model, which inevitably brings errors and systematic bias (Liu et al., 2018). A recent study also shows that roughly only 10% of the UIs can be deemed as high-quality design examples in Rico (Leiva et al., 2020). Thus, we create a new high quality dataset by manually relabelling the most common 29 icons on the UI screenshots in Rico. Our correction procedure adds 40% more icons which reveals the incomplete nature of view hierarchies. We conduct experiments to evaluate the proposed approaches and analyze the results quantitatively and qualitatively. Our proposed model achieves an F1 score of 83% while the best classification model, which has an architecture similar to (Liu et al., 2018), achieves an F1 score of 55%. By adding view hierarchy features to the model input, the model’s performance increases by 4% F1 score compared to the pixel only object detection model. We hope that our approach can provide insights to other UI related applications and inspire new UI design applications.
2. Related Work
2.1. Mobile UI Understanding
With the rapid development of mobile apps and deep learning techniques, there are an increasing number of researches utilizing machine learning to understand UI for a variety of data-driven applications, such as UI semantic analysis, sensitive data detection, and user perception prediction (Huang et al., 2015; Nan et al., 2015; Andow et al., 2017; Wu et al., 2019). We highlight some work about UI element analysis and clarify differences between our work and theirs.
Liu et al. (2018) proposed an automatic approach for generating semantic annotations for mobile app UIs. Though they mainly used code based heuristics, they failed to create one for distinguishing icons from the image component and trained a CNN classifier to classify them. The input to the CNN classifier is the icon image cropped from screenshot based on its bounding box denoted in the view hierarchy. Xiao et al. (2019) also adopted a pixel based approach to understand icons. They aimed to identify the sensitive icons that can potentially involve using or collecting users’ sensitive data. For icons that contain texts, they first proposed a set of keywords for each sensitive category and used the edit distance of OCR features detected from the icon with the keywords to classify them. For the other image icons that don’t contain text, they utilized a modified version of SIFT (Lowe, 2004), a state-of-the-art image feature engineering technique to identify their classes. As an extension of the previous model that classifies icons into sensitive classes for suspicious app detection (Xiao et al., 2019) , Xi et al. (2019) proposed a joint model for icon classification. They used CNN and LSTM to separately encode image features and text features which are extracted from source code and OCR. Then, a co-attention layer is used to combine them to predict the class.
Besides the above icon classification models, Chen et al. (2020) is another relevant work to us in that they also frame the UI element annotation task as a domain-specific object detection task. They conducted empirical study of seven representative computer vision-based object detection methods to study their capabilities and limitations. Compared to them, we propose a novel multimodal object detection model that leverages the resource-id and class name attributes of view hierarchies for understanding icons besides utilizing their visual features.
2.2. Website UI Understanding
In parallel with the mobile UI understanding, there are also other works that focus on UIs on the websites. For example, Kumar et al. (2013) built Webzeitgeist, a platform for large-scale design mining comprising a repository of over 100,000 web pages and 100 million design elements. Lim et al. (2 02) trained an Support Vector Machine model to classify web page elements into semantic categories such as menu, navigation bar, and title.
2.3. Object Detection
As the object detection technique is integral to our work, we briefly review the recent advances in the object detection field. Readers interested in an in-depth review are encouraged to refer to (Xiao et al., 2020).
The state-of-the-art object detection models in recent years can be categorized into two categories: anchor-based approaches and keypoint-based approaches. As the representative anchor-based model, SSD (Liu et al., 2016) defines a set of anchor boxes with different sizes and uses features extracted from different convolutional feature layers to classify and regress anchor boxes. On the contrary, CenterNet (Zhou et al., 2019) is a keypoint-based detector that utilizes CNN as a backbone to generate heatmaps, whose peaks correspond to object centers, object bounding box size, and its offsets. They have been widely used in detecting objects on natural images (Lin et al., 2014) and we propose a multi-modal approach based on them to detect artificial icons on mobile screenshots, which is, to the best of our knowledge, the first attempt to adapt multimodal object detection techniques to the UI element annotation task.

3. Dataset
We create a high quality UI dataset which contains annotations of the most commonly used icons across 29 classes based on a large-scale mobile design mining dataset - Rico. We refer to the created dataset as Ricoclean to distinguish from the original Rico dataset for future reference. In this section, we first illustrate the motivation of our data creation, then the creation process, and lastly, a detailed analysis of the created dataset.
3.1. Motivation
The first version of the Rico dataset was collected by Deka et al. (2017), it includes 72k screenshots and their view hierarchy. Then Liu et al. (2018) augmented the data by adding the icon semantic labels to the view hierarchy nodes. To create a taxonomy of icons, they first create a representative icon set by extracting examples based on view hierarchy classes and bounding boxes from Rico. They only kept the examples whose class is “ImageView” in view hierarchy, whose area is less than 5% of the total screen area, and whose aspect ratio is greater than 0.75 (smaller dimension divided by larger dimension). Then they hired annotators to annotate the extracted potential icon examples and trained a CNN-based classification model. The ultimate icon labels in Rico are annotated with this model.
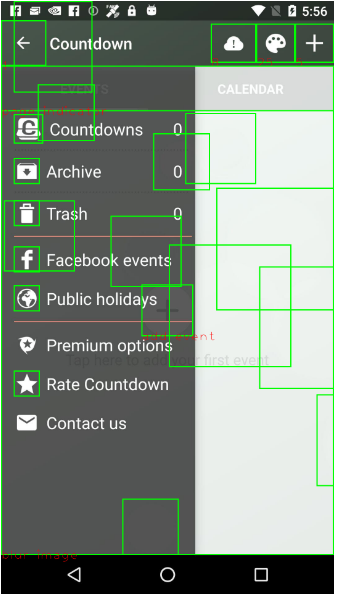
There are three problems with this process. First is that the prediction of the CNN model is not necessarily correct. Second is that the criteria they utilized to generate the icon examples for creating the taxonomy inevitably misses some potential icons and adds bias to the machine learning model trained on it. Third is that due to the inconsistency between the render-time of a UI and its view hierarchy, it’s possible that the screenshot and its view hierarchy are unsynchronized. It results in inaccurate view hierarchy with missing or excess UI elements. Figure 4 shows one such example, where view hierarchy missed icon menu, search, and refresh. According to an investigation by Li et al. (2020), only 25K out of the unique 72K screenshots in Rico have synchronized view hierarchy.
Though suffering from the above issues, Rico dataset is still very valuable as it is the largest mobile app design mining dataset and facilitates many data-driven applications in the HCI field. These motivate us to re-annotate the Rico data and our annotations are based on human perception of the screenshots instead of the view hierarchies.
3.2. Creation
We hire 40 in-house professional crowd workers and internal data annotation platform to annotate the most commonly used icons (both bounding boxes and labels) on all the unique 72k UI screenshots in Rico. Crowd workers are given detailed instructions with good and bad annotation examples before they initiate the annotation. They are presented with only the screenshot and required to annotate the bounding box of icons on the screenshot and select their labels from the 29 classes. Our definition of the icon class is based on both the daily app using experience and the definition in the Rico dataset. Note that we add two new common icon classes “end_call” and “take_photo” in addition to the 27 common icon classes that exist in Rico. On average, crowd workers spend 81 seconds annotating each screenshot.
After the initial annotation, we manually checked the quality of around 300 randomly sampled UIs and summarize the annotation errors. We refine our annotation instruction based on our findings and instruct the same group of the people to verify the annotations and re-annotate the unqualified ones. We repeat this procedure for another two rounds to achieve the final data.
Through our work, not only are the labels of the existing icons in the original Rico corrected but also new icons that are not captured in the view hierarchy are added. Overall, 51.4% of the UI elements that are of type icon in the original Rico dataset have their labels corrected and the number of icons after the correction is 40% more than that in the original Rico.
3.3. Analysis
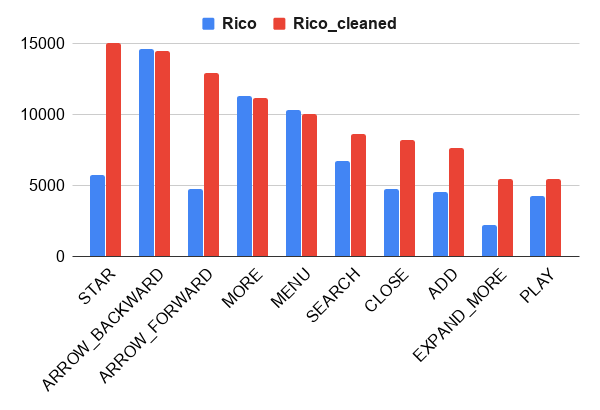
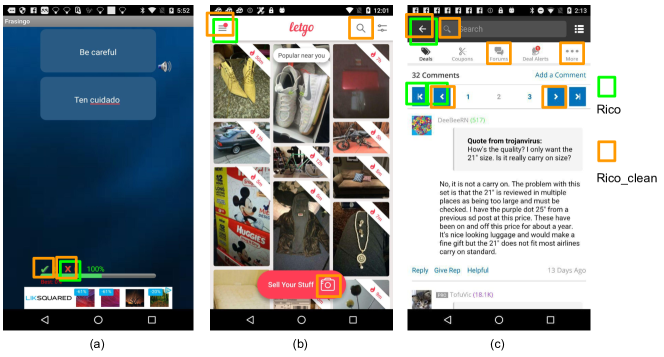
Table 1 shows the number of icons and in 29 classes and their examples. Figure 5 shows the number of the top 10 frequent icons in Ricoclean and Rico. We observe that approximately half of the star, arrow forward, and expand more icons missing in Rico are added in Ricoclean. Figure 6 shows the different annotations of the same screenshots in Rico and Ricoclean where bounding boxes in Rico is marked in green and bounding boxes in Ricoclean is marked in orange. We observe that in Rico, the label of check, search icons are missing (Figure 6(a), (b)) and one icon with shape similar to “” is mistakenly labelled as arrow backward (Figure 6(c)). Such errors are corrected in Ricoclean.
| Class | Num | Examples | Class | Num | Examples |
| star | 15,013 | home | 2,471 | ||
| arrow backward | 14,460 | refresh | 2,388 | ||
| arrow forward | 12,921 | time | 2,175 | ||
| more | 11,169 | emoji | 1,843 | ||
| menu | 10,019 | edit | 1,528 | ||
| search | 8,618 | notifications | 1,480 | ||
| close | 8,196 | call | 1,175 | ||
| add | 7,654 | pause | 654 | ||
| expand more | 5 463 | send | 643 | ||
| play | 5,444 | delete | 517 | ||
| check | 5,189 | video cam | 376 | ||
| share | 4,115 | launch | 335 | ||
| chat | 4,099 | end call | 31 | ||
| settings | 3,652 | take photo | 1,508 | ||
| info | 2,618 |
4. Modeling icon annotation
In this section, we first clarify the task definition, then introduce the baseline and the proposing approach in details.
4.1. Task Definition
The icon annotation task is defined as: given a user interface represented by a screenshot and view hierarchy pair, one is expected to detect all the icons that belong to a set of pre-defined classes on the UI. More specifically, the output contains both icon locations (i.e. coordinates of its bounding boxes) and its class label.
4.2. Baseline Classification Model
Similar to Liu et al. (2018), our baseline classification models first use the locations denoted in view hierarchies as the location of icons and then predict icon types with CNN classification models.
In the localization stage, we localize the candidates using the bounding boxes of every leaf nodes in the view hierarchies. In the classification stage, a machine learning model predicts the label of each candidate from the pre-defined icon set or OTHER if the candidate does not belong to any of the pre-defined classes. We experiment with two classification models, pixel only and multimodal. The pixel only model is similar to Liu et al. (2018) which is a CNN-based model taking pixel values as input. Our multimodal classification model is similar to Xi et al. (2019), which consists of three deep learning modules: image encoder, text encoder, and feature fusion layer. Its complete architecture is summarized in Figure 7.
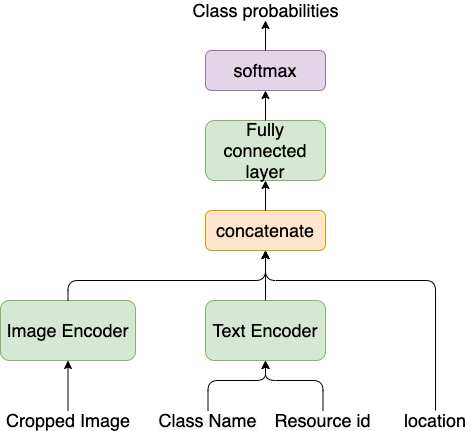
Our text feature comes from the last text component of class names and resource-ids of view hierarchies. A pre-trained text encoder is used to obtain text embeddings of text features. As this is a shared component with our proposing multimodal object detection model, we elaborate its details in Section 5.2. To obtain the image feature, we first crop the image based on candidate’s bounding boxes and rescale it to in RGB. We also try grayscale images but preliminary experiments doesn’t show any improvement in the result. We use the final layer of a pre-trained Inception V2 (Szegedy et al., 2016) to generate image embeddings of the rescaled images, which is followed by a two fully-connected layers with hidden dimensions of 1024 and 128. On top of it, the activation function is used to generate the image feature embeddings.
To combine the features, we first concatenate the image and text embeddings, along with the location features of the icon, and then run the joint embeddings through a fully connected layer of dimension 128, followed by a softmax function to predict the probability of every class. The choice of all dimension settings are based on the experimental results on the development set.
One problem of the classification model is that as it only predicts labels of the UI elements in a view hierarchy, if the view hierarchy and screenshot are unsynchronized, it experiences loss of recall. On the contrary, the object detection model doesn’t suffer from such issue.
4.3. Detection Model
Compared with the classification models, object detection models conduct localization and classification in one step. Our proposing object detection model is built upon two state-of-the-art object detection models: SSD (Liu et al., 2016) and CenterNet (Zhou et al., 2019) which are featured with good performance and fast inference speed. Both approaches first generate feature map by a certain CNN. SSD is an anchor-based model that regresses the location and classifies the category of a set of pre-defined anchor boxes to predict objects. On the other hand, CenterNet is anchor free that it predicts the heatmaps whose peaks represent centers, bounding box size, and offsets of the objects for each category from the feature map.
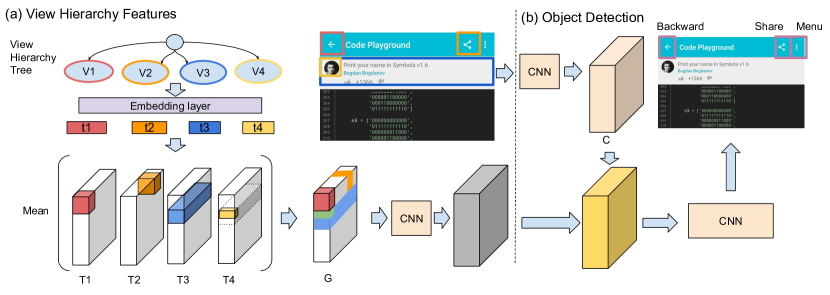
One of our main contributions is to augment the object detection approach to incorporate features from view hierarchy and associate useful information in the view hierarchy leaf nodes to the related image region. Specifically, inspired by the approach in (Wichers et al., 2018), we propose to build view hierarchy feature map which encodes both view hierarchy nodes’ location and textual features. The entire model architecture is illustrated in Figure 8.
Given a screenshot, let be all its view hierarchy leaf nodes, where is the number of view hierarchy nodes and consists of a textual attribute (i.e. texts in the “class name” and “resource-id” fields) and its normalized bounding box coordinate where and are the top-left and bottom-right coordinates. Let be an intermediate feature map of the object detection model that takes the UI screenshot as the input, where , , and . More concretely, in Figure 8(b), is represented by the cube after the square that is marked with “CNN” and follows the input image. Our next step is to generate a similar feature map for the view hierarchy so that it is easy to do computations to fuse the image and view hierarchy features. To achieve it, we use a text encoder to obtain text embedding for each view hierarchy leaf node from its textual attributes. Then, using , we create a new feature map which is of the same height and width as the image feature map as follows:
| (1) | ||||
where calcOverlay generates , which is a matrix with only 0 or 1 in each position by computing whether that position is overlayed by the bounding box . Specifically, when and , and otherwise 0. In equation 1, tile replicates over height and width dimensions to create a 3-dimensional feature map with the same shape as , and denotes the element-wise multiplication. In other words, is filled with the embedding wherever one of the locations overlaps with the bounding box, and is zero elsewhere. This is represented by the cubes at the bottom left of Figure 8(a) where the colored part denotes the tiled text embeddings. We then compute the average of all s to achieve the final feature map by:
| (2) | ||||
where is generated by stacking all the s by its last dimension and mean computes the average value along the last dimension of to generate a matrix of size . In this way, view hierarchy features are densely associated to its corresponding image region. Figure 8(a) provides an intuitive visualization of the implementation.
Then, the model converts the dimensionality of each individual vector in from to , which is the dimension of the image feature to combine with, by using two CNN layers. View hierarchy features and image features are combined by addition and this result replaces the original image feature layer in the original object detection model.
5. Experiments and Results
This section describes the evaluation, implementation details, quantitative and qualitative analysis of the model performance.
5.1. Evaluation Metrics
We use micro precision, recall, and F1 score as our evaluation metrics, as formulated below.
| (3) | |||
To compute F1 score for object detection models, we first discard all the detection bounding boxes whose confidence score is less than 0.2. Then each detection bounding box is optionally matched to a ground truth icon’s bounding box. A detection bounding box is matched if its center is inside the boundaries of the ground truth bounding box. When there are many matches, detection with the highest confidence score is picked. Note that all the matched and unmatched detection bounding boxes are used to compute the F1 score for a fair comparison with the classification model.
5.2. Implementation Details
Among the variety of properties view hierarchy contains as shown in Figure 3, we utilize the last text component of class names and resource-ids as text features because they provide meaningful hints relevant to the semantics of elements. We tokenize them using underscores and camel-case to obtain the text input to the models. For example, the class name “android.support.AppImageButton” and resource id “com.sololearn.python:id/vote_down” are respectively processed into “app image button” and “vote down”. In all our experiments, we use the pretrained TF Hub nnlm-128 module as the text encoder111https://tfhub.dev/google/nnlm-en-dim128/1. The model is a three hidden layer feed-forward Neural-Net Language Models (NN-LM) trained on English Google News 200 billion corpus. The model has around 124 million parameters and maps text to 128-dimensional embedding vectors.
During the training of the baseline, we found resource-id only occurs in 70% of the icon data in Rico, resulting in empty text feature inputs for many examples. To make full use of text features, we leverage icon labels in the training data as anchor points for aligning image and text feature. Then, we build a dictionary of resource-id text for every icon class. Whenever the resource-id is empty for an icon in the training data, we sample a resource-id from the dictionary of the class based on resource-ids’ frequency. Our hypothesis is that randomly sampling a fake resource-id increases the probability of a joint learning between two modalities and enhances the generalizability of the model, which helps to improve the model performance. It is proved by our experimental results in Table 2, which is discussed in the later section. For future reference, this technique is referred to as “sampling”.
We use stacked hourglass (Newell et al., 2016) as the backbone for the CenterNet that takes image of in RGB and use MobileNet V2 as the feature extractor (Sandler et al., 2018) for SSD that takes image of in RGB as the majority of images are landscape. For CenterNet, we use the final output of the backbone CNN model as the intermediate image feature map, i.e. in Figure 8. For SSD, we experiment with different intermediate feature layers and report the best result. We conduct an ablation study by removing the view hierarchy features in our proposing model architecture to evaluate the affect of using view hierarchy.
5.3. Quantitative evaluation
Table 2 shows our experimental results in precision, recall and F1 score. To evaluate the contribution of view hierarchy and compare with the prior vision-based approaches, we conduct experiments using only the visual features as input. Baseline (image only), SSD, and CenterNet use only image inputs, whereas the others use both image and view hierarchy.
Note that as Rico dataset greatly suffers from the unsynchronization issue between view hierarchy and image that view hierarchy doesn’t precisely describe the UI (Section 3.3), to only evaluate the approaches from the modeling perspective and remove the negative effect of this issue on the classification model as it depends on the view hierarchy for element localization, we only use the annotated icons that can be mapped back to a node in the view hierarchy as the ground truth icons when evaluating classification models. In other words, when computing the recall in Equation 3, we only use the icons which are captured in the view hierarchy as the denominator. It is smaller than the total number of annotated icons in Ricoclean. This setting is under the assumption of a precise view hierarchy. Results computed under this assumption are marked with star in Table 2. We also provide the number when the classification model is evaluated with the same ground truth as the object detection models, which is the fourth row in Table 2. We observe that no matter we remove the effect of the unsynchronization issue or not, the best object detection model (CenterNet+VH) greatly outperforms the classification models. Especially, Centernet + VH beats baseline (image + VH + sampling) in F1 score by 28.4% and in recall by 49.5%. However, in terms of precision, baseline (image + VH + sampling) performs slightly better than the best object detection model Centernet + VH by 3.9%. Depending on the task requirement, precision may outweigh other metrics and the baseline model may be preferred. One can also experiment with the confidence score threshold that decides which predictions to discard for the object detection models to achieve a higher precision, though at the expense of a lower recall.
| Models | Precision | Recall | F1 |
|---|---|---|---|
| baseline (image only)* | 0.780 | 0.580 | 0.665 |
| baseline (image + VH)* | 0.793 | 0.586 | 0.674 |
| baseline (image + VH + sampling)* | 0.804 | 0.604 | 0.690 |
| baseline (image + VH + sampling) | 0.804 | 0.416 | 0.548 |
| SSD | 0.446 | 0.873 | 0.590 |
| SSD + VH | 0.496 | 0.878 | 0.634 |
| CenterNet | 0.725 | 0.876 | 0.793 |
| CenterNet + VH | 0.765 | 0.911 | 0.832 |
Moreover, we observe that adding view hierarchy information improves the performance of both object detection and classification models on Ricoclean across all the metrics, proving the benefits of the multimodal approaches. For classification models, sampling technique is critical to take advantage of the view hierarchy. CenterNet+VH performs the best in terms of recall and F1. Compared to CenterNet, using view hierarchy by our proposed method helps to improve the precision, recall, F1 by 4%, 3.5%, and 3.9% respectively. CenterNet based model also beat SSD based models across all metrics, which aligns with the result reported by prior works (Zhou et al., 2019). To compare the localization ability between different object detection models, we also present the mean average precision (mAP) at IOU threshold 0.1 and 0.5 as in object detection (Everingham et al., 2015) in Table 3. As shown, the models with view hierarchy features consistently achieve better mAP than pure image-based models, indicating the effectiveness of our fusion techniques. CenterNet outperforms SSD in mAP@0.1IOU but not in mAP@0.5IOU. We observe that though CenterNet models usually predict the center correctly, they tend to predict bounding boxes of smaller size, which we suspect causes the comparatively low mAP@0.5IOU.
| Models | mAP@0.1IOU | mAP@0.5IOU |
|---|---|---|
| SSD | 0.787 | 0.650 |
| SSD + VH | 0.810 | 0.665 |
| CenterNet | 0.863 | 0.592 |
| CenterNet + VH | 0.903 | 0.602 |
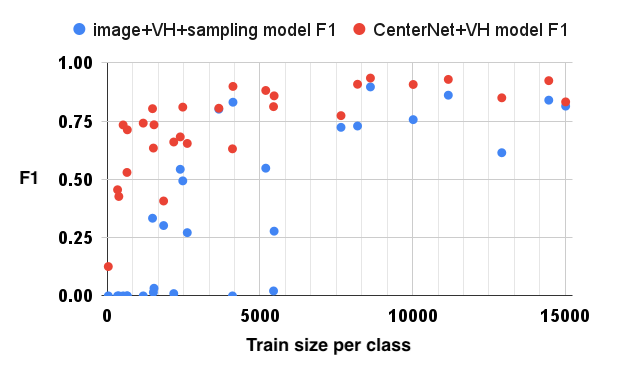
To understand the results better, for each individual class, we further analyze the relation between the number of instances in the training set with the F1 score evaluated on the test set for the best multimodal classification model (baseline(image+VH+sampling)) and the best object detection model (CenterNet+VH). Generally, icons with more training data performs better and CenterNet+VH performs better across different icon classes. It’s worth noticing that our proposed model CenterNet+VH outperforms the best classification model especially when a large number of the training data is unavailable.
5.4. Qualitative evaluation
We also qualitatively compared and analyzed the models performances. Figure 10 shows the predictions of the CenterNet+VH and CenterNet models on the same screenshot. Center+VH correctly predicts the share icon located at the bottom of the page even if part of it is occluded by other UI elements. It implies that CenterNet+VH model have effectively utilized the view hierarchy feature that contains the “share” keyword in the resource-id field, whereas a pure image-based model has less clue to make the correct prediction since part of its shape is hidden.
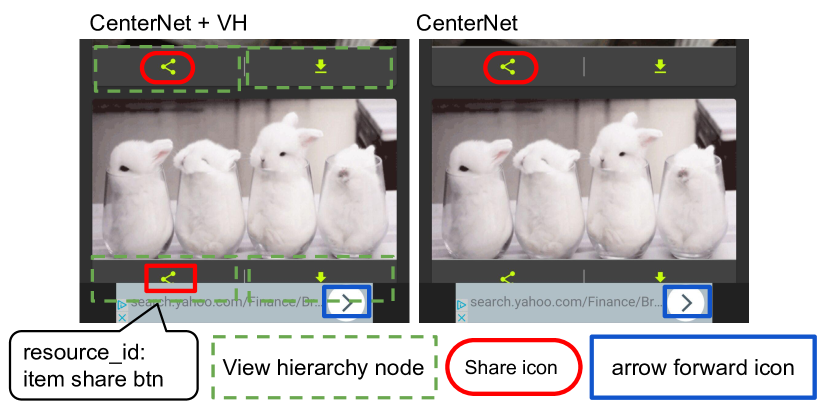
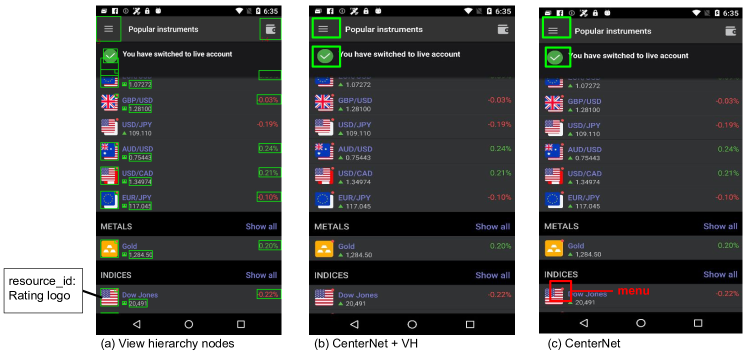
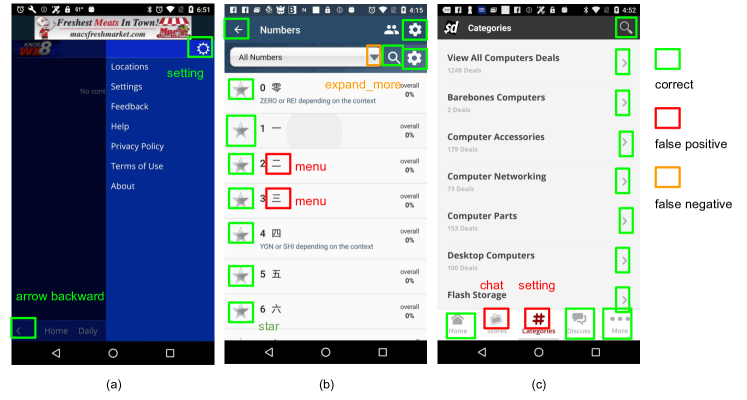
Figure 11 shows another example comparing the models using view hierarchy feature and not using view hierarchy feature. A visualization of all the leaf nodes in the view hierarchy is provided in Figure 11(a) with the prediction results of two models in (b) and (c). The proposed model (CenterNet+VH) is able to make correct predictions, whereas the pure image-based model (CenterNet) is misled by the shape of the logo and mistakenly predicts the logo with American flag as a menu icon. We analyze that the keyword “logo” in the resource-id of the view hierarchy feature probably have served as a useful hint to the proposed model and help it to make the correct prediction.
Figure 12 presents more predictions generated by CenterNet+VH model. We observe that though in most cases, our proposed model makes correct predictions, there are also cases where the model failed. In Figure 12(b), the model mistakenly predicts Chinese characters as menu icon and in Figure 12(c), “#” is predicted as setting icon, which indicates that though view hierarchy features help to prevent the model from being biased by the image, it still has trouble distinguishing objects of similar shapes.
6. Future work
Dataset:
Currently our dataset only includes commonly used icons. As future work, we will expand the annotations to cover more types of icons. As UI design evolves and the old design becomes outdated, the creation of both a new mobile UI dataset and a new taxonomy of UI elements will be required. However, the proposed deep learning based annotation approach is applicable across all datasets.
Modeling:
Our current classification baseline represents the state-of-the-art approach, however it only considers the image and text features of the focused UI element while ignoring the contextual information (e.g. entire screenshot and view hierarchy) that the object detection models have access to. A stronger baseline that takes the contextual information as input while maintaining a simple architecture is likely to achieve better performance. One proposal is to first encode the screenshot using a CNN then encode the view hierarchy using a graph neural network before feeding the encoding to the current baseline model. Implementing such a strong baseline to compare with our proposed approach can help demonstrate the benefits presented by the architecture versus just the input features.
Application:
It is easy to expand our proposed icon detection approach to other UI element annotations such as buttons or checkboxes. In addition to UI annotation tasks, we hope this model can provide insights to solve problems in a variety of different domains, such as sensitive icon detection (Xi et al., 2019), inferring the user interaction portion of a UI (Natarajan and Csallner, 2018), GUI component detection for automated GUI-prototyping (Moran et al., 2020), and tappability prediction (Swearngin and Li, 2019). Moreover, our approach is not limited to applications in Android platform and can be easily extended to other platforms (e.g. IOS and website). For example, in the case of websites, our model can take the rendered webpage screenshots along with DOM Trees as input, and output target UI elements. We leave this as another future work.
We expect our trained model to facilitate design based applications for UI designers as well. For example, for every predicted UI element of the trained model, one can obtain its corresponding embeddings from the intermediate layer (output of the backbone network for CenterNet or output of the Region Proposal Networks for SSD) and construct a UI database keyed with such embeddings for UI design search. In such way, given an example UI element on a screenshot, designers can obtain its embeddings and query with it to find similar ones for reference from the UI database. In addition to design search, the obtained embeddings can also be used to train a generator model that draws a UI from an arbitrary embedding using Generative Adversarial Network (GAN). The designer can possibly create new UI elements by first doing arithmetic operations on UI embeddings like add or minus and then run the obtained embeddings through a generator model. In this way, designers can easily merge the design essence of two or more UI elements and gain design inspirations.
7. Conclusion
UI semantic annotation is beneficial for a number of applications for building an intuitive and pleasant user interaction experience. However, among all types of the UI element, icon labels that represent its functionality are especially hard to achieve since it greatly depends on the visual appearance and can’t be automatically generated by heuristics. We created a high-quality dataset with icon annotations by manually re-annotating the most commonly used 29 class of icons in Rico. We built an innovative multimodal icon annotation model based on the state-of-the-art object detection techniques and leveraged both textual features in view hierarchy and image features to solve icon annotation task. Our experimental results on the cleaned dataset show that the proposed model outperforms all the baselines. A qualitative analysis also demonstrates the advantage of our approach over the pure vision-based ones.
Our proposed technology can be directly applied to the accessibility applications by labeling all the icons correctly, which enables the application to read them out and the users to mention them. It also enables querying the same type of icons from a repository of UI data for design mining. As our future work, we hope the proposed approach can also help to solve new tasks like generic UI element annotation, tappability prediction, tasks in other platforms and for design applications.
Acknowledgements.
The authors thank Nevan Wichers, Maria Wang, Gabriel Schubiner, and Lijuan Liu for their guidance and help on dataset creation and processing; Srinivas Sunkara for the assistance with model evaluation; James Stout and Pranav Khaitan for advice, guidance and encouragement; all the anonymous reviewers for reviewing the manuscript and providing valuable feedback.References
- (1)
- Andow et al. (2017) Benjamin Andow, Akhil Acharya, Dengfeng Li, William Enck, Kapil Singh, and Tao Xie. 2017. UiRef: Analysis of Sensitive User Inputs in Android Applications. In Proceedings of the 10th ACM Conference on Security and Privacy in Wireless and Mobile Networks (Boston, Massachusetts) (WiSec ’17). Association for Computing Machinery, New York, NY, USA, 23–34. https://doi.org/10.1145/3098243.3098247
- Chen et al. (2020) Jieshan Chen, Mulong Xie, Zhenchang Xing, Chunyang Chen, Xiwei Xu, Liming Zhu, and Guoqiang Li. 2020. Object Detection for Graphical User Interface: Old Fashioned or Deep Learning or a Combination? Association for Computing Machinery, New York, NY, USA, 1202–1214. https://doi.org/10.1145/3368089.3409691
- Deka et al. (2017) Biplab Deka, Zifeng Huang, Chad Franzen, Joshua Hibschman, Daniel Afergan, Yang Li, Jeffrey Nichols, and Ranjitha Kumar. 2017. Rico: A Mobile App Dataset for Building Data-Driven Design Applications. In Proceedings of the 30th Annual Symposium on User Interface Software and Technology (UIST ’17).
- Everingham et al. (2015) Mark Everingham, S. M. Eslami, Luc Gool, Christopher K. Williams, John Winn, and Andrew Zisserman. 2015. The Pascal Visual Object Classes Challenge: A Retrospective. Int. J. Comput. Vision 111, 1 (Jan. 2015), 98–136. https://doi.org/10.1007/s11263-014-0733-5
- Huang et al. (2015) Jianjun Huang, Zhichun Li, Xusheng Xiao, Zhenyu Wu, Kangjie Lu, Xiangyu Zhang, and Guofei Jiang. 2015. SUPOR: Precise and Scalable Sensitive User Input Detection for Android Apps. In 24th USENIX Security Symposium (USENIX Security 15). USENIX Association, Washington, D.C., 977–992. https://www.usenix.org/conference/usenixsecurity15/technical-sessions/presentation/huang
- Kumar et al. (2013) Ranjitha Kumar, Arvind Satyanarayan, Cesar Torres, Maxine Lim, Salman Ahmad, Scott R. Klemmer, and Jerry O. Talton. 2013. Webzeitgeist: Design Mining the Web (CHI ’13). Association for Computing Machinery, New York, NY, USA, 3083–3092. https://doi.org/10.1145/2470654.2466420
- Leiva et al. (2020) Luis A. Leiva, Asutosh Hota, and Antti Oulasvirta. 2020. Enrico: A Dataset for Topic Modeling of Mobile UI Designs. In 22nd International Conference on Human-Computer Interaction with Mobile Devices and Services (MobileHCI ’20). Association for Computing Machinery, Article 9, 4 pages.
- Li et al. (2020) Yang Li, Jiacong He, Xin Zhou, Yuan Zhang, and Jason Baldridge. 2020. Mapping Natural Language Instructions to Mobile UI Action Sequences. In Proceedings of the 58th Annual Meeting of the Association for Computational Linguistics. Association for Computational Linguistics, Online, 8198–8210.
- Lim et al. (2 02) Maxine Lim, Ranjitha Kumar, Arvind Satyanarayan, Cesar Torres, Jerry Talton, and Scott Klemmer. 2012-02. Learning Structural Semantics for the Web. http://vis.csail.mit.edu/pubs/web-structural-semantics
- Lin et al. (2014) Tsung-Yi Lin, Michael Maire, Serge Belongie, James Hays, Pietro Perona, Deva Ramanan, Piotr Dollár, and C. Lawrence Zitnick. 2014. Microsoft COCO: Common Objects in Context. Lecture Notes in Computer Science (2014), 740–755. https://doi.org/10.1007/978-3-319-10602-1_48
- Liu et al. (2018) Thomas F. Liu, Mark Craft, Jason Situ, Ersin Yumer, Radomir Mech, and Ranjitha Kumar. 2018. Learning Design Semantics for Mobile Apps. In The 31st Annual ACM Symposium on User Interface Software and Technology (Berlin, Germany) (UIST ’18). ACM, New York, NY, USA, 569–579. https://doi.org/10.1145/3242587.3242650
- Liu et al. (2016) Wei Liu, Dragomir Anguelov, Dumitru Erhan, Christian Szegedy, Scott Reed, Cheng-Yang Fu, and Alexander C. Berg. 2016. SSD: Single Shot MultiBox Detector. Lecture Notes in Computer Science (2016), 21–37. https://doi.org/10.1007/978-3-319-46448-0_2
- Lowe (2004) David Lowe. 2004. Distinctive Image Features from Scale-Invariant Keypoints. International Journal of Computer Vision 60 (11 2004), 91–110. https://doi.org/10.1023/B%3AVISI.0000029664.99615.94
- Moran et al. (2020) K. Moran, C. Bernal-Cárdenas, M. Curcio, R. Bonett, and D. Poshyvanyk. 2020. Machine Learning-Based Prototyping of Graphical User Interfaces for Mobile Apps. IEEE Transactions on Software Engineering 46, 2 (2020), 196–221.
- Nan et al. (2015) Yuhong Nan, Min Yang, Zhemin Yang, Shunfan Zhou, Guofei Gu, and XiaoFeng Wang. 2015. UIPicker: User-Input Privacy Identification in Mobile Applications. In 24th USENIX Security Symposium (USENIX Security 15). USENIX Association, Washington, D.C., 993–1008. https://www.usenix.org/conference/usenixsecurity15/technical-sessions/presentation/nan
- Natarajan and Csallner (2018) S. Natarajan and C. Csallner. 2018. P2A: A Tool for Converting Pixels to Animated Mobile Application User Interfaces. In 2018 IEEE/ACM 5th International Conference on Mobile Software Engineering and Systems (MOBILESoft). 224–235.
- Newell et al. (2016) Alejandro Newell, Kaiyu Yang, and Jia Deng. 2016. Stacked Hourglass Networks for Human Pose Estimation. Lecture Notes in Computer Science (2016), 483–499. https://doi.org/10.1007/978-3-319-46484-8_29
- Sandler et al. (2018) Mark Sandler, Andrew Howard, Menglong Zhu, Andrey Zhmoginov, and Liang-Chieh Chen. 2018. MobileNetV2: Inverted Residuals and Linear Bottlenecks. 2018 IEEE/CVF Conference on Computer Vision and Pattern Recognition (Jun 2018). https://doi.org/10.1109/cvpr.2018.00474
- Swearngin and Li (2019) Amanda Swearngin and Yang Li. 2019. Modeling Mobile Interface Tappability Using Crowdsourcing and Deep Learning. Proceedings of the 2019 CHI Conference on Human Factors in Computing Systems - CHI ’19 (2019).
- Szegedy et al. (2016) Christian Szegedy, Vincent Vanhoucke, Sergey Ioffe, Jon Shlens, and Zbigniew Wojna. 2016. Rethinking the Inception Architecture for Computer Vision. 2016 IEEE Conference on Computer Vision and Pattern Recognition (CVPR) (Jun 2016). https://doi.org/10.1109/cvpr.2016.308
- Szpiro et al. (2016) Sarit Felicia Anais Szpiro, Shafeka Hashash, Yuhang Zhao, and Shiri Azenkot. 2016. How people with low vision access computing devices: Understanding challenges and opportunities. In Proceedings of the 18th International ACM SIGACCESS Conference on Computers and Accessibility. 171–180.
- Wichers et al. (2018) Nevan Wichers, Dilek Hakkani-Tur, and Jindong Chen. 2018. Resolving Referring Expressions in Images with Labeled Elements. 2018 IEEE Spoken Language Technology Workshop (SLT) (Dec 2018). https://doi.org/10.1109/slt.2018.8639518
- Wu et al. (2019) Ziming Wu, Taewook Kim, Quan Li, and Xiaojuan Ma. 2019. Understanding and Modeling User-Perceived Brand Personality from Mobile Application UIs. In Proceedings of the 2019 CHI Conference on Human Factors in Computing Systems (CHI ’19). 1–12.
- Xi et al. (2019) Shengqu Xi, Shao Yang, Xusheng Xiao, Yuan Yao, Yayuan Xiong, Fengyuan Xu, Haoyu Wang, Peng Gao, Zhuotao Liu, Feng Xu, et al. 2019. DeepIntent: Deep icon-behavior learning for detecting intention-behavior discrepancy in mobile apps. In Proceedings of the 2019 ACM SIGSAC Conference on Computer and Communications Security. 2421–2436.
- Xiao et al. (2019) Xusheng Xiao, Xiaoyin Wang, Zhihao Cao, Hanlin Wang, and Peng Gao. 2019. IconIntent: Automatic Identification of Sensitive UI Widgets Based on Icon Classification for Android Apps. 257–268. https://doi.org/10.1109/ICSE.2019.00041
- Xiao et al. (2020) Youzi Xiao, Zhiqiang Tian, Jiachen Yu, Yinshu Zhang, Shuai Liu, Shaoyi Du, and Xuguang Lan. 2020. A review of object detection based on deep learning. Multimedia Tools and Applications 79, 33 (2020), 23729–23791.
- Zhang et al. (2021) Xiaoyi Zhang, Lilian de Greef, Amanda Swearngin, Samuel White, Kyle Murray, Lisa Yu, Qi Shan, Jeffrey Nichols, Jason Wu, Chris Fleizach, Aaron Everitt, and Jeffrey P. Bigham. 2021. Screen Recognition: Creating Accessibility Metadata for Mobile Applications from Pixels. arXiv:2101.04893 [cs.HC]
- Zhou et al. (2019) Xingyi Zhou, Dequan Wang, and Philipp Krähenbühl. 2019. Objects as Points. arXiv:1904.07850 [cs.CV]