X-ray Constraints on the Hot Gas Content of Early-type Galaxies in Virgo
Abstract
We present a systematic study of the diffuse hot gas around early-type galaxies (ETGs) residing in the Virgo cluster, based on archival Chandra observations. Our representative sample consists of 79 galaxies with low-to-intermediate stellar masses (), a mass range that has not been extensively explored with X-ray observations thus far. We detect diffuse X-ray emission in only eight galaxies and find that in five cases a substantial fraction of the detected emission can be unambiguously attributed to truly diffuse hot gas, based on their spatial distribution and spectral properties. For the individually non-detected galaxies, we constrain their average X-ray emission by performing a stacking analysis, finding a specific X-ray luminosity of , which is consistent with unresolved stellar populations. The apparent paucity of truly diffuse hot gas in these low- and intermediate-mass ETGs may be the result of efficient ram pressure stripping by the hot intra-cluster medium. However, we also find no significant diffuse hot gas in a comparison sample of 57 field ETGs of similar stellar masses, for which archival Chandra observations with similar sensitivity are available. This points to the alternative possibility that galactic winds evacuate the hot gas from the inner region of low- and intermediate-mass ETGs, regardless of the galactic environment. Nevertheless, we do find strong morphological evidence for on-going ram pressure stripping in two galaxies (NGC 4417 and NGC 4459). A better understanding of the roles of ram pressure stripping and galactic winds in regulating the hot gas content of ETGs, invites sensitive X-ray observations for a large galaxy sample.
1 Introduction
It has been established that X-ray emission from normal galaxies have two primary components, namely, discrete stellar sources and diffuse hot gas with temperatures of K (e.g., Trinchieri & Fabbiano, 1985; Sarazin et al., 2001; Revnivtsev et al., 2008). For massive early-type galaxies (ETGs), the X-ray emission is dominated by hot gas atmospheres accumulated from mass loss of old stellar populations (e.g., stellar winds from evolved stars, planetary nebulae, and Type Ia supernovae [SNe]), accretion of the intergalactic medium (IGM), as well as from mergers of small galaxies. In ETGs of low-to-intermediate masses, the X-ray emission is typically dominated by stellar sources, consisting of low-mass X-ray binaries (LMXBs), and to a less extent, cataclysmic variables (CVs) and coronally active binaries (ABs) (e.g., Revnivtsev et al., 2006). Hot gas may also exist in the shallow gravitational potential of these systems, likely in the form of a galactic-scale outflow driven by Type Ia SNe and/or an active galactic nucleus (AGN) (e.g., David et al., 2006; Li et al., 2011; Bogdán et al., 2012a). The hot gas is a crucial component of the galactic ecosystem, mediating the transport of energy, mass, and metals between the interstellar medium (ISM) and the IGM.
Given the expectation that the hot gas content has a dependency on the host galaxy properties, the correlation between diffuse X-ray luminosity () and stellar mass (; also often represented by the integrated stellar luminosity, e.g., ) has been extensively studied (e.g., O’Sullivan et al., 2001; Boroson et al., 2011; Su et al., 2015; Goulding et al., 2016). These studies generally found that the diffuse X-ray Luminosity (i.e., resolved X-ray sources subtracted) spans over two orders of magnitude for a given host stellar mass, especially in massive ETGs with . Several interpretations have been proposed for this large dispersion in : dependency on galaxy structures (e.g., Mathews et al., 2006; Sarzi et al., 2013; Su et al., 2015), energy feedback from AGN activity and/or supernova (SNe) heating (David et al., 2006), and environmental effects (e.g., White & Sarazin, 1991; Brown & Bregman, 2000; Sun et al., 2007; Jeltema et al., 2008; Mulchaey & Jeltema, 2010; Wagner et al., 2018). In particular, in a dense environment such as galaxy groups and clusters, ram pressure stripping can effectively remove hot gas coronae around individual galaxies, at a rate that depend on the galaxy’s position and relative velocity (e.g., Roediger et al., 2015; Vijayaraghavan & Ricker, 2015).
Thus far, most studies of the X-ray scaling relations have focused on massive ETGs (), while the hot gas content in low- to intermediate-mass ETGs () has received relatively little attention. This is partly owing to a selection effect, in the sense that in small galaxies the X-ray emission from discrete sources generally overwhelms that of the hot gas, rendering a robust detection of the latter difficult. Previous studies of low- to intermediate-mass ETGs are either based on small-size samples (e.g., Bogdán et al., 2012a) or case studies of particular interest (e.g., NGC 4435, Machacek et al., 2004, NGC 5102, Kraft et al., 2005). A systematic study of the hot gas content in a sizable sample of low-to-intermediate mass ETGs is still absent.
The Virgo cluster, the nearest galaxy cluster and the host of 1600 known member galaxies with more than half being ETGs (Kim et al., 2014), is a uniquely promising laboratory to study the environmental effects on the hot gas content in galaxies spanning a wide range of mass and size. Indeed, a disturbed X-ray morphology has been seen in a number of Virgo spirals (e.g., Tschöke et al., 2001; Machacek et al., 2004; Weżgowiec et al., 2012; Ehlert et al., 2013) and ellipticals (e.g., Biller et al., 2004; Randall et al., 2004; Machacek et al., 2006; Randall et al., 2008; Kraft et al., 2011, 2017; Paggi et al., 2017; Wood et al., 2017; Su et al., 2019), providing strong evidence for on-going ram-pressure stripping in these galaxies. Nevertheless, we still lack precise knowledge about the hot gas content in the majority of normal galaxies in Virgo.
We are thus motivated to carry out a systematic study of diffuse X-ray emission in a sample of low- to intermediate-mass ETGs in Virgo, based on archival Chandra observations. Chandra’s superb angular resolution and sensitivity for point source detection facilitate the removal of bright LMXBs in the vicinity of individual ETGs (Hou et al., 2017, hereafter Paper I), which is crucial to minimize stellar contamination in the faint unresolved X-ray emission and to reveal the truly diffuse hot gas. We show below that the available Chandra observations allow us to probe the diffuse X-ray emission in galaxies as small as . To evaluate the anticipated environmental effects on the hot gas content, we also extract a sample of field ETGs with comparable stellar masses from the Chandra archive, which provide a statistically meaningful comparison with the Virgo ETGs.
The rest of the paper is organized as follows. Section 2 describes our sample selection and data reduction. The analysis of diffuse X-ray emission in both the Virgo and field ETGs are presented in Section 3. The implications of our results are discussed in Section 4, followed by a summary in Section 5. Throughout this work, we adopt a uniform distance of 16.5 Mpc (1 corresponds to 80 pc; Mei et al., 2007) for all sources and galaxies in Virgo. The line-of-sight depth of Virgo introduces an uncertainty of 10% in the derived luminosities, which should have little effect on our results. Errors are quoted at a 1 confidence level, unless otherwise stated.
2 Data Preparation
2.1 Sample Selection and Galaxy Properties
Similar to Paper I, we started from a parent sample defined in a Chandra Large Program, AGN Multiwavelength Survey of Early-Type Galaxies in the Virgo Cluster (AMUSE–Virgo, Gallo et al., 2008, 2010), which consists of 100 ETGs spanning three orders of magnitude in stellar mass. In paper I, we analyzed 80/100 galaxies each with 5 ks snapshot exposures with the Advanced CCD Imaging Spectrometer (ACIS). The same exposure of 5 ks ensured a quasi-uniform limiting luminosity (0.5–8 keV) of for source detection, which was essential for studying the statistical properties (spatial distribution and luminosity function) of the X-ray point sources around the individual ETGs (Paper I). Here, we slightly modify the sample with the aim of studying the diffuse X-ray emission. First, we excluded the 10 most massive galaxies with a stellar mass , which have been extensively studied in the literature. We further discarded a few galaxies in the close vicinity of M87, M49 or M86, because these galaxies are severely contaminated by the extended hot gas halo of the nearby giant elliptical and thus have an exceptionally high local background. This removed 6 galaxies close to M87 (), 2 galaxies close to M49 () and 1 galaxy close to M86 (. We also excluded two galaxies observed in ACIS sub-array mode, the small field-of-view (FoV) of which is not suitable for studying the diffuse emission.
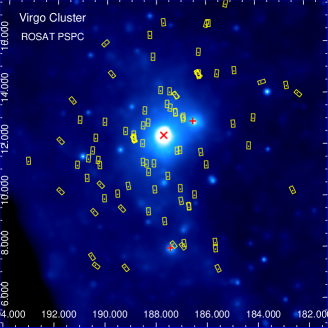
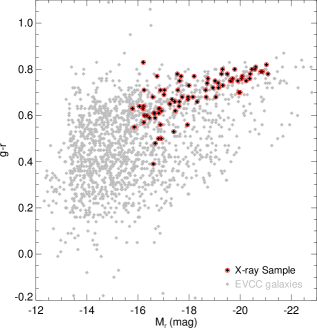
Our final sample thus consists of 79 low- to intermediate-mass ETGs in Virgo. Among them, ten galaxies have more than one ACIS observations, for which we incorporate all the available data to maximize the signal-to-noise ratio (S/N) for the unresolved emission. The total on-target exposure of these galaxies ranges between 9 – 132 ks. One galaxy, VCC 1231, has a single exposure of 30 ks, and the remaining 68 galaxies have a single exposure of 5 ks. A large set of galaxies with a quasi-uniform exposure is essential for a stacking analysis (see Section 3.2). The sky positions of these 79 ETGs, illustrated in the left panel of Figure 1, nicely sample the Virgo cluster. The right panel of Figure 1 plots the color-magnitude diagram of all ETGs compiled in the Extended Virgo Cluster Catalog (EVCC, Kim et al., 2014), highlighting the 79 ETGs studied here. Almost all of our targets lie along the red sequence of quiescent galaxies. Their basic information, including galaxy name, celestial coordinates and observation ID, are presented in Table 1.
To reveal the potential environmental effects on the diffuse X-ray emission, we employed a comparison sample of 57 field ETGs, which were originally defined by a Chandra large program, AMUSE-Field (Miller et al., 2012) and were also used in Paper I. Since the distances of these field ETGs span from 10.1 Mpc to 27.3 Mpc, the individual ACIS exposures were designed to vary in such a way that they reach a quasi-uniform limiting luminosity of for point sources, i.e., identical to that of the Virgo ETGs. It is noteworthy that none of these field ETGs has additional Chandra observations than what AMUSE-Field program provides.
The effective radius () of each Virgo ETG was adopted from the Hubble Space Telescope (HST)/Advance Camera for Surveys Virgo Cluster Survey (ACSVCS; Ferrarese et al., 2006), in which was derived from a fit to the -band surface brightness profile using a Sérsic model. For one galaxy, VCC 1030, a reliable fit was not possible due to the presence of a small dusty disk. Thus, we estimated its based on the mean scaling relation calibrated among the ACSVCS galaxies (Eq. 21 in Ferrarese et al., 2006), , where is the -band absolute magnitude of a given galaxy and is in units of arcsec. For VCC 1512, a dIrr/dE transition object, and VCC 575, which has a stellar disk or ring in its center, the surface brightness profile and related integrated quantities were deemed unreliable. Thus, we also estimated a new value for each of them based on the above empirical relation. The values of the Virgo ETGs range from to (0.3–4.6 kpc), with a median value of ( kpc). Due to the lack of HST imaging for most AMUSE-Field galaxies, we also applied the empirical scaling relations from the ACSVCS survey to determine a Sérsic profile, in particular the Sérsic index and effective radius, for each field galaxy, based on the -band magnitudes tabulated in (Miller et al., 2012). The resultant values of the field galaxies range from 0.6 to 1.4 kpc, with a median value of 0.8 kpc. We have also estimated values for the field ETGs using another empirical relation based on the -band absolute magnitude (Graham & Worley, 2008, Eq. 16 therein) and found consistent results. The stellar masses of the Virgo ETGs and field ETGs were taken from Gallo et al. (2010) and Miller et al. (2012), respectively.
2.2 X-ray Data Reduction
For all the selected ACIS fields, we downloaded and reprocessed the archival data using CIAO v4.8 and the calibration files CALDB v4.7.0, following the standard procedure111http://cxc.harvard.edu/ciao/. All relevant observations had the aimpoint placed on the S3 CCD, and we only included data from the S3 and S2 CCDs. We examined the light curve of each observation and found that the instrumental background was contaminated by significant particle flares in only a few cases, for which we filtered the affected time intervals. The cleaned exposure of each galaxy is listed in Table 1. For each observation, we produced counts and exposure maps on the natal pixel scale () in the 0.5–2, 2–8 and 0.5–8 keV bands. The exposure maps were weighted by a fiducial incident spectrum, which is an absorbed power-law with a photon-index of 1.7 and an absorption column density = , which is typical for X-ray point sources. We also generated the corresponding instrumental background maps from the “stowed background” data, after normalizing with the 10–12 keV count rate. For galaxies with more than one observations, we calibrated their relative astrometry by matching the centroid of commonly detected point sources, using the CIAO tool reproject_aspect. The count and exposure maps of individual observations were then reprojected to a common tangential point, i.e., the optical center of the galaxy, to produce combined images of enhanced S/N.
Following the procedures detailed in Paper I, we performed source detection across the FoV of each galaxy in each of the three energy bands. This results in a total of 1400 point-like sources detected in and around the 79 Virgo ETGs, which are composed of AGNs and active galaxies in the cosmic background, AGNs and LMXBs associated with the individual ETGs, as well as intra-cluster X-ray sources (Paper I). Similarly, we detected 1030 sources in and around the 57 field ETGs. To study the diffuse X-ray emission, we removed pixels falling within two times the 90% enclosed-energy radius (EER) around each detected point source. These pixels are consistently removed from the counts, exposure and instrumental background maps, and no artificial counts are introduced to fill these pixels in the following quantitative analysis.
3 Analysis and results
3.1 Detection of Diffuse X-ray Emission
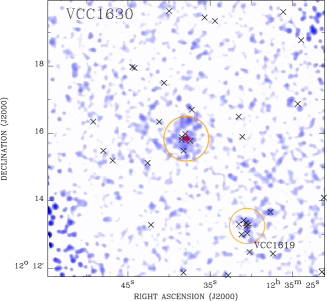
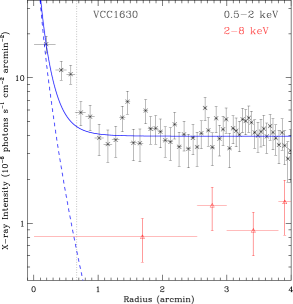
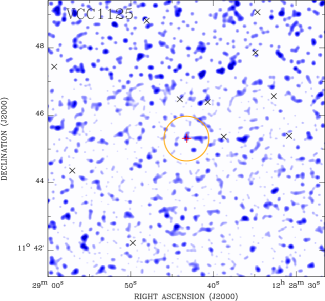
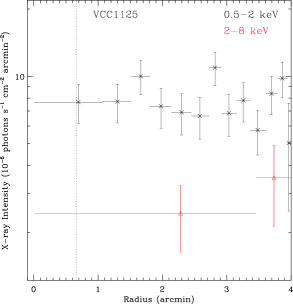
We first examine the flux maps of the 79 Virgo ETGs in the 0.5–2 keV band, which are produced by subtracting the corresponding instrumental background maps and divided by the exposures maps. Due to low surface brightness nature of most galaxies, these maps have been smoothed by a Gaussian kernel of 15 ACIS pixels () for a better visulization. From the flux maps, extended features are clearly visible around a few galaxies, while the rest, the majority of galaxies show no obvious diffuse emission. Figure 2 shows an example for each case: VCC 1630 exhibits extended emission out to at least three times its effective radius, whereas VCC 1125, a galaxy of similar stellar mass, shows no significant residual emission after source subtraction. We further construct the source-subtracted radial intensity profile in the 0.5–2 keV and 2–8 keV bands for each galaxy, out to a projected radius of (19.2 kpc) from the galactic center. This is the maximum radius at which the ACIS FoV provides full azimuthal coverage, and is sufficiently large compared to the typical angular size of our sample galaxies. The radial intensity profiles of VCC 1630 and VCC 1125 are again shown as examples in the right panels of Figure 2. Evidently, VCC 1630 shows a centrally enhanced 0.5–2 keV profile extending out to , whereas the profile of VCC 1125 is consistent with a flat, local background. For VCC 1630, we further compare its 0.5–2 keV radial intensity profile with the best-fit -band Sérsic profile. The latter, obtained from the ACSVCS survey (Ferrarese et al., 2006), represents the galaxy’s starlight distribution. It can be seen that the 0.5–2 keV profile is significantly more extended than the starlight, suggesting the presence of truly diffuse hot gas. The little bump in the X-ray intensity profile at is likely due to another Virgo ETG VCC 1619 located southwest of VCC 1630. Due to the limited S/N, both galaxies show no significant signals in the 2–8 keV band above the local background. This is generally true for the relatively shallow observations used in this work, hence we shall not further discuss the 2–8 keV band.
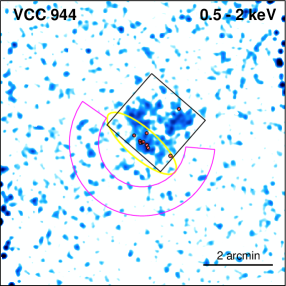
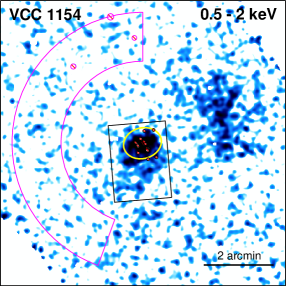
We uniformly quantify the S/N of the 0.5–2 keV diffuse emission for each galaxy, as follows. The region of diffuse emission is defined as a circle with a radius of 3, masking the detected point sources within two times of the 90% EER. The corresponding local background region is defined as an annulus with an inner radius of 5 and an outer radius of 8. For the few largest galaxies, this outer radius slightly exceeds , in which case the area of the incomplete annulus is taken into account. While this choice of source and background regions works well for the majority of galaxies, two cases demand extra care, which are illustrated in Figure 3. VCC 944, with , exhibits significant diffuse emission extending well beyond 3 to the north/northwest. A similar situation is found in VCC 1154 () with significant diffuse emission extending beyond 3 to the south. Besides, another prominent feature of diffuse emission is seen well beyond 3 to the northwest. This feature appears detached from the diffuse emission within 3. We have examined the SDSS and HST images of these two galaxies but found no obvious optical counterparts to the extended X-ray features. The nature of these two cases will be further discussed in Section 4. Thus we adjust the source and background regions of VCC 944 and VCC 1154 to accommodate their irregular morphology, as illustrated in Figure 3.
Next, for a given galaxy, we employ the CIAO tool aprate, which applies the Bayesian approach for Poisson statistics at the low-count regime, to calculate the net photon flux and bounds. In this calculation the local background, effective exposure and enclosed energy fraction are taken into account. A galaxy is regarded as a firm detection of diffuse emission, if the 3 lower limit of its net photon flux given by aprate is greater than zero. In such a case the 1 errors of the net photon flux and the S/N of the signal are reported (Table 1). For those galaxies regarded as non-detections, we report the 3 upper limit of the net photon flux.
A total of 8 galaxies are found to have S/N . Indeed all these 8 galaxies (VCC 759, VCC 778, VCC 944, VCC 1030, VCC 1062, VCC 1154, VCC 1231, VCC 1630) clearly show diffuse signals in their 0.5–2 keV flux maps. Notably, they all have a stellar mass . A further examination of the radial intensity profiles of these galaxies finds that in five cases (VCC 944, VCC 1030, VCC 1154, VCC 1231, VCC 1630) the 0.5–2 keV emission is more extended than the starlight, suggesting the presence of truly diffuse hot gas. The morphology of VCC 944, VCC 1154, and VCC 1630 are shown in Figure 3 and Figure 2. In VCC 1030, the extended X-ray emission is lopsided to the northeast, suggesting possible interactions with the nearby massive spiral galaxy NGC 4438 (Machacek et al., 2004). In VCC 1231, the diffuse X-ray emission shows a more symmetric morphology out to . Among these eight galaxies, five have multiple observations, which certainly help provide an enhanced S/N. Diffuse emission remains undetected in the other five galaxies with multiple observations, which notably all have .
We note that additional Virgo member galaxies may fall within the ACIS FoV of our target galaxies (Paper I). For completeness, we also search for significant diffuse X-ray emission from such galaxies, provided that they are classified as an ETG in the EVCC (Kim et al., 2014) and are brighter than 16 mag in the -band, which is roughly the limiting magnitude of the AMUSE-Virgo galaxies. We thus identify 3 fields with two additional EVCC ETGs and 21 fields with one additional EVCC ETG. It turns out that the majority of these additional ETGs are located far from the target ETGs and show no obvious diffuse X-ray emission. Thus their presence will not affect the measurement of diffuse emission for the target ETGs. Only three fields deserve further attention. NGC 4309 is located at south of the target ETG VCC 538, but neither galaxy has significant diffuse emission. NGC 4461 is located at southeast of the target ETG VCC 1146. Extended emission is clearly seen from the 0.5–2 keV flux map and there is a bright nuclear source in NGC 4461. However, our spectral analysis (Section 3.4) indicates that this apparently diffuse emission is totally dominated by the unresolved stellar population and requires no truly diffuse hot gas. Lastly, a lenticular galaxy NGC 4477 is located at southeast of the target ETG VCC 1283 and is close to the edge of the FoV. Diffuse X-ray emission is clearly seen from the flux map of this galaxy, which has been studied in detail by Li et al. (2018), who found a pair of symmetric cavities around the galactic center, possibly due to AGN activity.
3.2 Stacking Non-detections
Based on the X-ray photometric results (Section 3.1), the majority of our sample ETGs, especially the low-mass ones, do not have detectable diffuse X-ray emission. Thus, we perform a stacking analysis for the non-detected galaxies. Among the 71 non-detected Virgo ETGs, one galaxy, VCC 2019 (= IC 3735), shows two notable diffuse X-ray features at around 3 to the south and southwest. A visual examination of the SDSS image indicates possible optical counterparts of these X-ray features, which have a photo- 0.3–0.4, thus they are more likely in the background (e.g., arising from a background galaxy cluster) rather than physically associated with VCC 2019. Hence we remove this galaxy from the following stacking analysis. Moreover, if a galaxy had more than one observation, we only include the one with 5 ks exposure to ensure that the stacked signal is not dominated by any single galaxy. The 27 additional member ETGs falling within the ACIS FoV (Section 3.1) have a projected location far away from the target ETGs and have no significant diffuse X-ray emission, thus they will not affect the stacking results.
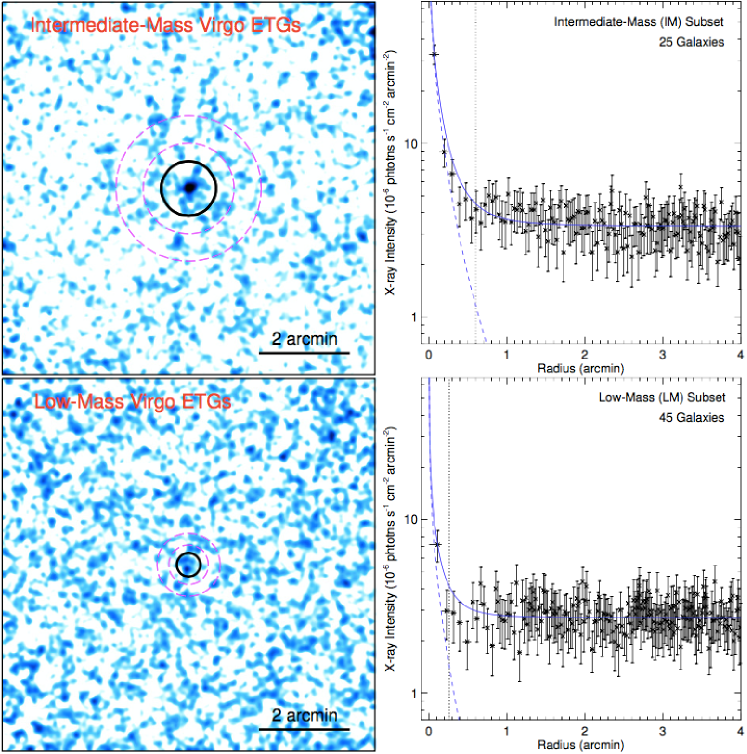
To probe the potential dependence of diffuse X-ray emission on the stellar mass, we divide the remaining 70 non-detected ETGs into two subsets according to their stellar masses: an intermediate-mass (IM) subset containing 25 galaxies that have , and a low-mass (LM) subset containing 45 galaxies with . The cut between the two mass bins is somewhat arbitrary, but we have verified that a slightly different mass cut does not affect our conclusion below. We then produce stacked counts maps for these two mass bins, in which each galaxy is reprojected to the center of the map, again with the detected point sources masked. The exposure maps and instrumental background maps are stacked in a similar way. The 0.5–2 keV flux map of the two mass bins are presented in Figure 4 (left panels). Significant signals are evident near the center of these maps, especially in the IM bin. This is confirmed by the stacked radial intensity profile of each mass bin, shown in the right panels of Figure 4. We also compare the X-ray intensity profile with an average starlight distribution, which is obtained by summing up the best-fit Sérsic profiles of individual galaxies in a given mass bin. No significant excess is seen over this average starlight distribution, indicating that the stacked 0.5–2 keV signals in both mass bins are dominated by the stellar contribution.
Similar to what is done for the individual galaxies, we quantify the S/N of the stacked signal by extracting 0.5–2 keV counts from a circular region (marked in Figure 4), the radius of which (06 for IM bin and 026 for LM bin) is guided by the radial intensity profile to enclose the bulk signal. We have verified that the resultant net flux is insensitive to the exact choice of this radius. The local background is calculated from an annulus (also marked in Figure 4) with an area 4 times of the source region. Aprate reports S/N for the IM bin and S/N for the LM bin. Results of the stacking analysis are summarized in Table 2.
3.3 Diffuse X-ray Emission in the Field ETGs
For the comparison sample of field ETGs, we employ the same procedure to study their diffuse X-ray emission. First, we produce the 0.5–2 keV flux map for each galaxy and construct the radial intensity profile. Next, the S/N of each field galaxy is evaluated using aprate, for which we adopt the same criteria to define the source and background regions.
Based on the flux maps, radial intensity profiles, and S/N from aprate, we find that 7 (NGC 1426, NGC 1439, NGC 3193, NGC 3928, NGC 4648, NGC 5582, NGC 5638) of the 57 field ETGs have a firm detection of diffuse X-ray emission, while the remaining 50 are non-detections (i.e., with S/N ). Similar to the case of the Virgo ETGs, those 7 field ETGs with detectable diffuse emission all have a stellar mass . However, only one galaxy, NGC 3193, has a more extended X-ray intensity profile than the starlight. In another case, NGC 3928, the diffuse emission is compact and concentrated within around a detected nuclear source, which might be the sign of an AGN-driven outflow, but the limited number of counts () prevents us from drawing a firm conclusion. The other five detected field ETGs have a very moderate S/N, preventing a reliable assessment of their intrinsic morphology.
After visual examination of each case, we find that one galaxy, ESO 540-014, is contaminated by a nearby bright point source. Therefore, we remove this galaxy from the subsequent stacking analysis. We divide the remaining 49 field ETGs into three subsets according to their stellar masses: an intermediate-mass (IM) subset containing 7 galaxies that have , a low-mass (LM) subset containing 15 galaxies with , and a very low-mass (VLM) subset containing 27 galaxies with . The first two subsets are meant to cover the same mass ranges as in the Virgo ETGs (Section 3.2). The VLM subset, on the other hand, has no counterpart in the Virgo ETGs. Nevertheless, it is valuable to examine the X-ray emission from these very low mass ETGs, which have received little attention in the literature.
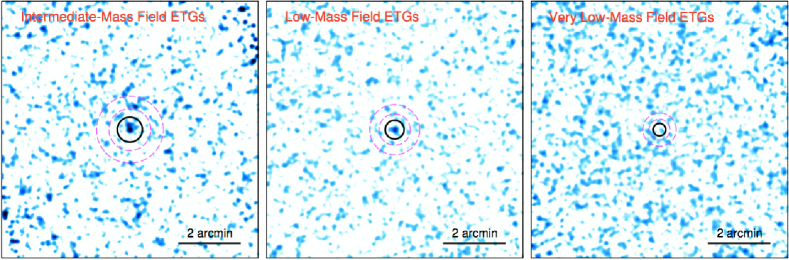
We then produce the stacked 0.5–2 keV flux maps for these three mass bins, as shown in Figure 5. In both the IM and LM bins, signals are evident near the center of the flux map, but no significant emission can be seen in the map of the VLM bin. Using a similar approach for the Virgo ETGs, we quantify the S/N for these three mass bins, finding a S/N of 3.6, 3.1 and 0.3 for the IM, LM and VLM bin (extracted from a circular region with radius of 04, 03 and 02), respectively.
3.4 Spectral Analysis
Five (VCC 944, VCC 1030, VCC 1154, VCC 1231, VCC 1630) of the eight Virgo ETGs with detected diffuse X-ray emission have sufficient net counts () for a meaningful spectral analysis. We note that all these five galaxies exhibit a 0.5–2 keV radial intensity profile more extended than the starlight (Section 3.1). Using the CIAO tool specextract, we extract spectra from the same source region as defined in Section 3.1 for each observation of these five galaxies, along with the Response Matrix File, Ancillary Response File and the corresponding background spectrum from the aforementioned background region.
As discussed in Section 3.1, the apparently diffuse X-ray emission from these galaxies may contain two physical components, one from a collection of unresolved stellar populations, namely, LMXBs, CVs and ABs, and the other from truly diffuse hot gas. In particular, CVs and ABs with typical X-ray luminosities of cannot be individually resolved outside the Milky Way, but their total number and collective X-ray luminosity have been inferred to be linearly proportional to stellar mass in normal stellar environments (Revnivtsev et al., 2007; Ge et al., 2015).
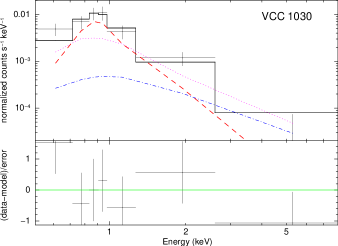
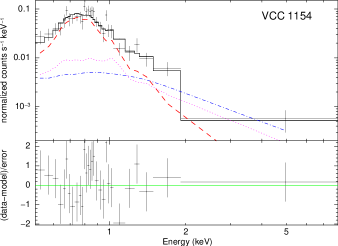
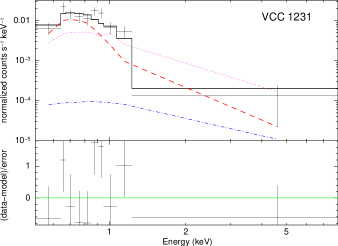
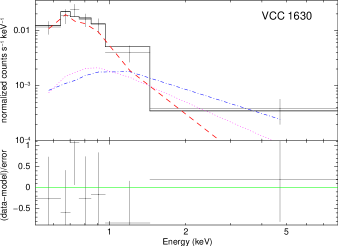
Hence, we apply a composite model to fit the spectra. For CVs and ABs, we adopt a phenomenological model that provides a reasonable fit to the unresolved X-ray spectra of M32 and three dwarf elliptical galaxies around M31 (Revnivtsev et al., 2007; Ge et al., 2015), which are thought to be dominated by CVs and ABs. Specifically, the CV+AB component assumes a log-normal plasma temperature distribution model () used in Ge et al. (2015), for which we adopt the best-fit values for M32, i.e., peak temperature of keV, dispersion (in log-normal space) of , fixed abundance at solar, and a fixed normalization equivalent to a 0.5–2 keV emissivity of (Ge et al., 2015). We check the systematic uncertainty of this component by artificially increasing/decreasing the stellar emissivity by 30%, a value estimated from Ge et al. (2015). It is found that the related systematic uncertainty is small and has little effect in the best-fit hot gas temperature (see below) and the total flux. For the unresolved LMXBs, we adopt a power-law model with a photon-index fixed at 1.7 and set the normalization as a free parameter. Finally, an apec model is adopted to account for the truly diffuse hot gas. The abundance parameter is fixed at solar, and all spectral components are subject to the Galactic foreground absorption column of . For each galaxy, the spectra from individual observations are jointly fitted. We have adaptively binned the individual spectra to achieve a S/N greater than 3 per bin. VCC 1630 has four available observations, but we neglect ObsID 8050, which provides only 15 net counts and only one effective bin. We also neglect ObsID 8042 for VCC 1030 for the same reason and fit the spectrum from the remaining single observation (ObsID 2883).
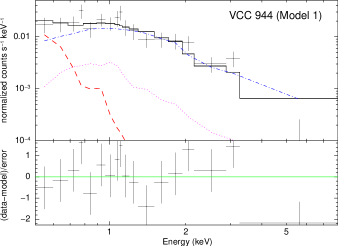
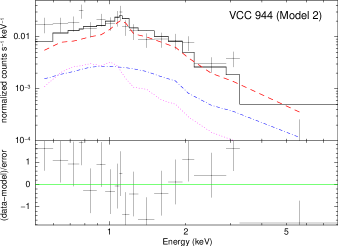
The composite model provides a reasonably good fit to all the spectra, as shown in Figure 6. In all five galaxies, a significant contribution arises from the apec component, indicating that truly diffuse hot gas exist in these galaxies. The best-fit temperature of the hot gas is found to be , , , and keV (90% errors), for VCC 1030, VCC 1154, VCC 1231 and VCC 1630, respectively. Empirically, these values are reasonable for the hot gas corona around intermediate-mass ETGs (e.g., Boroson et al., 2011; Kim & Fabbiano, 2015; Su et al., 2015). The case of VCC 944 deserves some remarks. In the default model, the best-fit temperature of the hot gas is keV, whereas the power-law component dominates over almost the entire spectral range. However, the normalization of the power-law appears too high compared to the expected contribution from unresolved LMXBs, and a small contribution from the hot gas is also at odds with the very extended morphology of this galaxy (Figure 3). Therefore we also try an alternative model in which the normalization of the power-law component is fixed at the expected level of unresolved LMXBs, based on the stellar mass and source detection limit of VCC 944. This second model results in an acceptable fit, in which the gas component dominates the spectrum, consistent with the observed morphology. However, the best-fit gas temperature is found to be keV, which is significantly higher than the typical temperature of the ICM in Virgo (2 keV, Urban et al., 2011). If this relatively high temperature were real, it would imply a very high orbital velocity of VCC 944. A better understanding of the case of VCC 944 would require deeper X-ray observations. For VCC 1030 and VCC 1231, the power-law component has a negligible contribution compared to the other components. The spectral fit results of the five Virgo ETGs are listed in Table 3.
None of the seven field ETGs with detected diffuse X-ray emission have sufficient net counts for a reliable spectral analysis.
4 Discussion
Based on the above results, we now investigate the diffuse X-ray emission from our sample ETGs in the context of host galaxy mass and environment. A diagram is instrumental for this purpose, which has been extensively examined in the literature. Our sample ETGs now allow us to extend such a diagram to the low-mass regime. To this end, we first convert the 0.5–2 keV photon fluxes (or 3 upper limits) into an unabsorbed luminosity (). For the five galaxies with good quality spectra (Section 3.4), we derive the 0.5–2 keV luminosity based on the best-fit spectral model, including both the stellar and gas components. For the other galaxies, since their X-ray emission is most likely dominated by unresolved stellar populations, we convert the 0.5–2 keV photon flux into intrinsic X-ray luminosity using a scaling factor of , where is the distance of a given galaxy in units of Mpc, assuming an incident power-law spectrum with a photon-index of 1.7 (Section 2.2). The derived 0.5–2 keV luminosity or upper limit of the Virgo ETGs are listed in Table 1. The mean 0.5–2 keV luminosity or upper limit of each stacked galaxy bin is derived in the same way and listed in Table 2. For the stacked field ETGs, the converted luminosity assumes the median distance of a given mass bin. We have also compared a conversion factor assuming an optically-thin thermal model with a temperature of 0.3 keV and found that the resultant 0.5–2 keV luminosities are consistent to within .
Figure 7 shows the specific X-ray luminosity (i.e., ) versus stellar mass for our sample ETGs. Both individually-detected galaxies and the stacked galaxy bins are plotted, with the Virgo ETGs in black and the AMUSE-Field ETGs in red. The VLM bin of the field ETGs is plotted in 3 upper limits, due to its low S/N. For comparison, we also plot (in blue symbols) several samples of typically massive ETGs in the literature, which include ETGs in nearby galaxy clusters from Sun et al. (2007), ETGs in nearby galaxy groups from Jeltema et al. (2008), massive field ETGs from Mulchaey & Jeltema (2010). When the -band luminosity instead of stellar mass was given in the original study, we have converted the -band luminosity into a stellar mass according to Bell et al. (2003) by assuming a typical of 0.7 for ETGs, which yields a mass-to-light ratio of . We note that the stellar contribution has been subtracted from the 0.5–2 keV luminosity of these massive ETGs, i.e., the plotted values or upper limits are for diffuse hot gas only. It can be seen that with our Virgo and field samples, we have significantly increased the number of individual X-ray measurements of ETGs with and are able to probe the regime of . To our knowledge, so far only four dwarf elliptical galaxies with such a low stellar mass, which include M32 (Revnivtsev et al., 2007), NGC 147, NGC 185 and NGC 205 (Ge et al., 2015), have been closely examined with X-ray observations. We also plot these four dwarf ellipticals in Figure 7 (grey symbols), noting that their X-ray luminosities are dominated by CVs and ABs. The mean 0.5–2 keV emissivity of these four dwarf ellipticals, , is shown by the horizontal dotted line and, as expected, defines a floor for our X-ray measurements.
In addition, we use a horizontal dashed line to indicate the potential contribution from unresolved LMXBs, which has a 0.5–2 keV emissivity of . This value is obtained by adopting the LMXB luminosity function of Zhang et al. (2012) and a power-law spectrum with a photon-index of 1.7 to convert the 0.5–8 keV luminosity used in that work into the 0.5–2 keV band. We have subtracted the contribution from LMXBs with a 0.5–8 keV luminosity above , given the source detection limit for most of our sample ETGs. For the few ETGs with deeper exposures, the contribution from unresolved LMXBs is expected to be much lower.
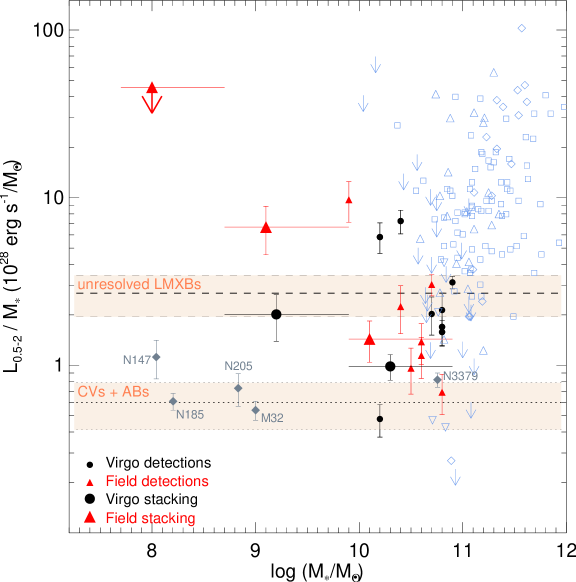
In Figure 7, the massive () ETGs show the familiar trend of an increasing X-ray luminosity with increasing stellar mass, albeit with large scatter. Except for a few non-detections, these massive ETGs must host substantial hot gas coronae. Our eight Virgo ETGs with detected diffuse X-ray emission appear to follow this general trend according to their stellar masses, although two galaxies, VCC 944 and VCC 1630, show a systematically higher emissivity than the other six galaxies. However, most intermediate-mass Virgo ETGs show no detectable diffuse X-ray emission. Their average X-ray emissivity, represented by the stacked IM signal, is consistent with being completely dominated by stellar populations, which is further supported by the radial intensity profile of the Virgo IM bin (Figure 4). The same is true for the low-mass Virgo ETGs. The stacked signals thus imply an upper limit of for the X-ray luminosity of truly diffuse hot gas in these galaxies, which is at least a factor of 10 lower than that of the massive ETGs. The apparent paucity of diffuse hot gas might be taken as a hint that most low- and intermediate-mass ETGs in Virgo have been stripped off of their hot gas content by ram pressure.
However, our comparison sample of field ETGs also shows little evidence of diffuse X-ray emission. Indeed, all but 7 intermediate-mass field ETGs are also non-detections, and their stacked signal is consistent with a pure stellar contribution and is comparable to that of the Virgo ETGs with similar stellar masses. Even among the 7 galaxies with detected diffuse X-ray emission, only two (NGC 3193 and NGC 3928) may harbor truly diffuse hot gas (Section 3.3). All field ETGs with are also non-detections. At face value, the stacked LM bin does show a mean specific X-ray luminosity () marginally above the expected stellar contribution (LMXBs+CVs+ABs). However, the stacked signal of the field LM bin is weak and spatially concentrated (Figure 5), and we find it premature to conclude in favor of the presence of truly diffuse hot gas in these galaxies. Therefore, we find no clear evidence that the Virgo ETGs have a systematically lower amount of diffuse hot gas compared to the field ETGs of similar stellar masses, as one would have naively expected if ram pressure stripping is effectively removing the hot gas in the former. The deficiency of diffuse hot gas in the low- and intermediate-mass ETGs, both in Virgo and the field, may instead be due to their relatively shallow gravitational potentials, which are unable to hold much hot gas. Galactic winds launched by an AGN and/or Type Ia supernovae can expel the hot gas from these galaxies, or at least from their inner regions probed by the current X-ray observations. Thus, it is possible that in a large fraction of Virgo ETGs, ram pressure stripping is not required to keep the hot gas content at a low level.
Nevertheless, ram pressure stripping must have played a role in regulating the hot gas around the Virgo ETGs. M89 (Machacek et al., 2006), M86 (Randall et al., 2008), M49 (Kraft et al., 2011), M60 (Wood et al., 2017) and NGC 4342 (Bogdán et al., 2012b) are known examples of Virgo ETGs with on-going ram pressure stripping. Notably, with the exception of NGC 4342, these are among the most massive galaxies in Virgo, thus their gravity is likely strong enough to compete with ram pressure and galactic wind in retaining a hot gas corona for a sufficiently long time. Among the 79 galaxies in our sample, VCC 944 (= NGC 4417) and VCC 1154 (= NGC 4459) stand out as good candidates of on-going ram pressure stripping (Figure 3), thanks to the relatively deep ACIS exposures of both galaxies. Located at a projected radius of (830 kpc, or about 80% of the virial radius of Virgo) from M87 to the southwest, NGC 4417 is an S0 galaxy with . A broad tail-like feature is present to the northwest side of the highly-inclined galactic disk, with an extent of at least (8 kpc), whereas there is no detectable diffuse emission on the southeast side. This extended and strongly lopsided morphology can only be understood as the presence of truly diffuse hot gas. The broad tail appears to emanate from the galactic disk, reminiscent of HI tails in ram pressure stripping spiral galaxies, but here the host galaxy is an S0 that should not contain much cold gas. In fact, our inspection of archival HST/CFHT/2MASS images finds no obvious optical/near-infrared counterpart for the X-ray tails, nor did we find clear evidence of cold gas or dust within the disk.
A similar morphology is witnessed in NGC 4459, which is also an S0 galaxy and one of the largest galaxies () in our sample, located at a projected radius of (480 kpc, or about 45% of the virial radius of Virgo) from M87 to the northwest. The diffuse emission extends towards the south of the galaxy, where a tail-like feature slightly swings to the southeast, reaching to a projected distance of . Juráňová et al. (2020) also presented evidence for this tail-like feature with XMM-Newton observations, albeit at a lower resolution. An even more puzzling diffuse feature is seen away from NGC 4459 to the northwest, which has the shape of a wide filament, with a size of (Figure 3). We find no obvious optical counterpart at the position of this feature. The spectrum of this feature can be well described by an optically-thin plasma model, but requiring a none-zero redshift of and a gas temperature of keV (90% errors). These values, together with the substantial extent, suggest that this feature might be a background galaxy cluster. Deeper X-ray/optical observations are needed to determine the nature of this diffuse feature.
It has been suggested that ram pressure may help to halt galactic outflows and temporarily produce pressure-confined coronae with enhanced gas density and diffuse X-ray luminosity (e.g., Brown & Bregman, 2000). Such an effect has been studied with hydrodynamic simulations by Lu & Wang (2011), who took into account stellar mass loss and energy input from Type Ia SNe in a simulated galaxy with moving through the ICM of representative conditions. They found that a sizable hot gas corona can be maintained under the combined effects of ram pressure and stellar feedback. The X-ray luminosities of their simulated hot gas coronae range between a few to a few . For smaller galaxies similar to our sample, the X-ray luminosity of a pressure-confined corona would be even lower. Unfortunately, the sensitivity of our current observations is not sufficient to probe such ram pressure-confined coronae except for the most luminous ones. We point out that one such case might have been found with NGC 4342, an intermediate-mass () S0 galaxy lying at the southwest outskirt of Virgo. The X-ray morphology of NGC 4342 exhibits a sharp cold front and a trailing tail, both characteristic of on-going ram pressure stripping (Bogdán et al., 2012b). The measured diffuse X-ray luminosity of NGC 4342, , is exceptionally high for its current stellar mass, but may be understood in the sense of a semi-confined corona studied by Lu & Wang (2011). We note that the morphology of NGC 4459 may also be interpreted as having a semi-confined corona (to the north), although a sharp cold front is not unambiguously seen due to the limited S/N.
Lastly, we note that the stacked Virgo IM bin has a specific X-ray luminosity of , which is significantly lower than the expected contribution from unresolved LMXBs and also lower than that of the stacked field IM bin (Figure 7). This deviation deserves some remarks. A simple explanation is that in the Virgo intermediate-mass ETGs, the specific number of low-luminosity LMXBs is lower than the standard luminosity function of Zhang et al. (2012) predicts. LMXBs are generally thought to have two main origins: LMXBs formed in the field following binary evolution in isolation, and LMXBs dynamically formed in high stellar density environments, especially in globular clusters (GCs; Clark, 1975; Fabbiano, 2006). Zhang et al. (2012) found that the specific number of LMXBs in ETGs depends on both galaxy age and the specific frequency of GCs, which can vary by a factor of up to 2 from the mean value. An example of low specific number of LMXBs is found with NGC 3379, which is highlighted in Figure 7. This relatively massive elliptical galaxy has one of the lowest specific X-ray luminosities for its mass, which was suggested to be dominated by unresolved stars (Revnivtsev et al., 2008). Zhang et al. (2012) found that NGC 3379 has a specific number of LXMBs about two times lower than the mean, which may be related to its low GC specific frequency, defined as , where is the -band absolute magnitude and is the total number of GCs. We cross-correlate the Harris et al. (2013) catalog of local galaxies with published GC properties to derive the GC specific frequency for our sample ETGs. Indeed, 59 Virgo intermediate-mass ETGs listed in Harris et al. (2013) have , lower than the mean value of the Zhang et al. (2012) sample. Hence this may be the cause of the low specific X-ray luminosity of the Virgo IM bin.
5 Summary
We have presented a systematic study of diffuse hot gas around 79 low-to-intermediate stellar mass () ETGs in the Virgo cluster as well as a comparison sample of 57 ETGs in the field, using archival Chandra observations. The main results are as follows:
-
•
We detect 0.5–2 keV diffuse X-ray emission in only eight Virgo ETGs (all with stellar mass ), and in only five cases can a substantial fraction of the detected signals be unambiguously attributed to truly diffuse hot gas, based on their spatial distributions and spectral properties. The remaining 71 low-to-intermediate mass ETGs do not have significant diffuse X-ray emission (S/N 3).
-
•
For the individually non-detected ETGs, we constrain their average X-ray emission with a stacking analysis. The specific X-ray luminosity of is consistent with the expected contribution from unresolved stellar populations (LMXBs, CVs and ABs). The apparent paucity of truly diffuse hot gas in these low- and intermediate-mass ETGs may be understood as efficient ram-pressure stripping by the hot intra-cluster medium.
-
•
We find strong morphological evidence for on-going ram pressure stripping in two galaxies (NGC 4417 and NGC 4459) in the Virgo cluster.
-
•
As for the field ETGs with a similar detection sensitivity, both the individually-detected and stacked signals of diffuse X-ray emission are comparable to that of the Virgo ETGs of similar stellar masses and are consistent with an unresolved stellar origin. Since field galaxies are not expected to suffer from strong ram pressure stripping, the paucity of hot gas in the field ETGs may be regarded as evidence that a galactic wind driven by nuclear activities and/or Type Ia supernovae is the primary mechanism of evacuating hot gas from the inner region of low- and intermediate-mass ETGs. Galactic winds may also play a partial role in reducing the hot gas content of the Virgo ETGs.
The on-going eROSITA all-sky survey may help significantly advance our understanding of the roles of ram pressure stripping and galactic winds in regulating the hot gas content of ETGs in the local universe.
| Galaxy name | Other name | ObsID | R.A. | Dec. | Exp. | log | ||
|---|---|---|---|---|---|---|---|---|
| VCC 9 | IC 3019 | 8072 | 182.34275 | 13.99243 | 5.3 | 29.62 | 9.7 | 14.0 |
| VCC 21 | IC 3025 | 8089 | 182.59621 | 10.18854 | 5.1 | 9.76 | 9.0 | 3.1 |
| VCC 33 | IC 3032 | 8086 | 182.78234 | 14.27481 | 4.5 | 9.10 | 8.9 | 4.7 |
| VCC 140 | IC 3065 | 8076 | 183.80234 | 14.43288 | 5.1 | 9.24 | 9.4 | 3.2 |
| VCC 200 | … | 8087 | 184.14044 | 13.03157 | 5.1 | 12.80 | 9.2 | 4.5 |
| VCC 230 | IC 3101 | 8100 | 184.33188 | 11.94347 | 5.1 | 9.71 | 8.9 | 3.7 |
| VCC 355 | NGC 4262 | 8049 | 184.87740 | 14.87766 | 3.1 | 9.78 | 10.3 | 7.6 |
| VCC 369 | NGC 4267 | 8039 | 184.93848 | 12.79828 | 5.1 | 7.93 | 10.4 | 6.6 |
| VCC 437 | UGC 7399A | 8085 | 185.20341 | 17.48707 | 5.1 | 25.02 | 9.6 | 12.8 |
| VCC 538 | NGC 4309A | 7122 8105 | 185.56143 | 7.16715 | 8.6 | 4.82 | 8.9 | 2.6 |
| VCC 543 | UGC 7436 | 8080 | 185.58137 | 14.76078 | 5.3 | 17.14 | 9.4 | 8.0 |
| VCC 571 | … | 8088 | 185.67149 | 7.95035 | 5.1 | 13.26 | 9.4 | 4.2 |
| VCC 575 | NGC 4318 | 8073 | 185.68039 | 8.19828 | 5.1 | 17.85 | 10.8 | 6.2 |
| VCC 654 | NGC 4340 | 8045 | 185.89703 | 16.72236 | 5.1 | 21.63 | 10.4 | 13.3 |
| VCC 685 | NGC 4350 | 4015 | 185.99111 | 16.69341 | 3.3 | 11.91 | 10.6 | 9.0 |
| VCC 698 | NGC 4352 | 8068 | 186.02094 | 11.21807 | 5.1 | 16.01 | 10.0 | 4.5 |
| VCC 751 | IC 3292 | 8103 | 186.20150 | 18.19512 | 5.1 | 9.95 | 9.4 | 4.6 |
| VCC 759 | NGC 4371 | 8040 | 186.23096 | 11.70421 | 4.9 | 26.18 | 10.8 | |
| VCC 778* | NGC 4377 | 8055 13295 15783 16476 | 186.30140 | 14.76216 | 132.4 | 5.90 | 10.2 | |
| 16477 17558 17559 | ||||||||
| VCC 784 | NGC 4379 | 8053 | 186.31142 | 15.60747 | 5.1 | 14.24 | 10.3 | 4.7 |
| VCC 856 | IC 3328 | 8128 | 186.49136 | 10.05377 | 5.1 | 14.72 | 9.5 | 5.7 |
| VCC 944* | NGC 4417 | 8125 14902 | 186.71088 | 9.58426 | 34.8 | 12.57 | 10.4 | |
| VCC 1025 | NGC 4434 | 8060 | 186.90285 | 8.15434 | 5.1 | 11.13 | 10.4 | 10.0 |
| VCC 1030* | NGC 4435 | 2883 8042 | 186.91870 | 13.07894 | 26.7 | 16.42 | 10.8 | |
| VCC 1049 | UGC 7580 | 8075 | 186.97847 | 8.09040 | 5.5 | 9.94 | 9.0 | 5.1 |
| VCC 1062 | NGC 4442 | 8037 | 187.01618 | 9.80371 | 5.3 | 16.92 | 10.7 | |
| VCC 1075 | IC 3383 | 8096 | 187.05134 | 10.29766 | 5.1 | 14.57 | 9.2 | 3.8 |
| VCC 1087 | IC 3381 | 8078 | 187.06202 | 11.78983 | 5.1 | 18.87 | 9.6 | 8.9 |
| VCC 1125 | NGC 4452 | 8064 | 187.18045 | 11.75503 | 5.1 | 13.26 | 9.9 | 6.1 |
| VCC 1146 | NGC 4458 | 8059 14905 | 187.23986 | 13.24189 | 34.1 | 18.60 | 10.0 | 10.9 |
| VCC 1154* | NGC 4459 | 2927 11784 | 187.25004 | 13.97837 | 39.6 | 28.15 | 10.9 | |
| VCC 1178 | NGC 4464 | 8127 | 187.33872 | 8.15662 | 5.1 | 6.58 | 9.9 | 6.2 |
| VCC 1231† | NGC 4473 | 4688 | 187.45363 | 13.42936 | 29.6 | 16.89 | 10.8 | |
| VCC 1242 | NGC 4474 | 8052 | 187.47311 | 14.06859 | 5.1 | 16.88 | 10.3 | 11.1 |
| VCC 1261 | NGC 4482 | 8067 | 187.54303 | 10.77948 | 5.1 | 20.95 | 9.8 | 5.0 |
| VCC 1283 | NGC 4479 | 8066 | 187.57655 | 13.57764 | 5.1 | 19.28 | 10.1 | 7.4 |
| VCC 1303 | NGC 4483 | 8061 | 187.66936 | 9.01568 | 5.1 | 15.18 | 10.1 | 5.3 |
| VCC 1321 | NGC 4489 | 8126 | 187.71771 | 16.75885 | 5.1 | 37.07 | 10.1 | 13.2 |
| VCC 1355 | IC 3442 | 8077 | 187.83414 | 14.11520 | 4.8 | 24.55 | 9.4 | 8.5 |
| VCC 1422 | IC 3468 | 8069 | 188.05922 | 10.25146 | 5.1 | 19.29 | 9.6 | 6.7 |
| VCC 1431 | IC 3470 | 8081 | 188.09745 | 11.26297 | 5.1 | 9.86 | 9.5 | 5.5 |
| VCC 1440 | IC 798 | 8099 | 188.13919 | 15.41539 | 5.5 | 7.75 | 9.2 | 3.5 |
| VCC 1475 | NGC 4515 | 8065 | 188.27073 | 16.26553 | 5.1 | 9.49 | 9.9 | 4.7 |
| VCC 1488 | IC 3487 | 8090 | 188.30598 | 9.39735 | 5.1 | 9.31 | 9.0 | 4.0 |
| VCC 1489 | IC 3490 | 8113 | 188.30793 | 10.92854 | 5.1 | 10.40 | 8.7 | 5.4 |
| VCC 1499 | IC 3492 | 8093 | 188.33241 | 12.85343 | 5.1 | 5.50 | 8.8 | 4.7 |
| VCC 1512 | … | 8112 | 188.39440 | 11.26196 | 5.1 | 12.79 | 9.2 | 3.6 |
| VCC 1528 | IC 3501 | 8082 | 188.46508 | 13.32244 | 4.8 | 9.90 | 9.3 | 5.0 |
| VCC 1537 | NGC 4528 | 8054 | 188.52531 | 11.32126 | 5.1 | 8.01 | 10.1 | 8.4 |
| VCC 1539 | IC 3506 | 8109 | 188.52808 | 12.74160 | 5.1 | 26.30 | 8.9 | 21.2 |
| VCC 1545 | IC 3509 | 8094 | 188.54806 | 12.04896 | 5.1 | 11.24 | 9.2 | 4.8 |
| VCC 1619 | NGC 4550 | 8050 8058 16032 16033 | 188.87743 | 12.22082 | 50.1 | 10.43 | 10.2 | 5.2 |
| VCC 1627 | … | 8058 8098 16033 | 188.90521 | 12.38203 | 31.6 | 3.73 | 9.1 | 1.6 |
| VCC 1630* | NGC 4551 | 8050 8058 16032 16033 | 188.90814 | 12.26398 | 50.1 | 13.29 | 10.2 | |
| VCC 1661 | … | 8044 | 189.10327 | 10.38466 | 4.9 | 58.07 | 9.0 | 28.9 |
| VCC 1692 | NGC 4570 | 8041 | 189.22250 | 7.24664 | 5.1 | 9.50 | 10.6 | 9.2 |
| VCC 1695 | IC 3586 | 8083 | 189.22853 | 12.52007 | 5.1 | 20.21 | 9.5 | 9.7 |
| VCC 1720 | NGC 4578 | 8048 | 189.37734 | 9.55507 | 5.1 | 32.52 | 10.4 | 19.2 |
| VCC 1743 | … | 8108 | 189.52830 | 10.08235 | 5.1 | 10.41 | 8.9 | 3.7 |
| VCC 1779 | IC 3612 | 8091 | 189.76960 | 14.73113 | 5.1 | 10.77 | 9.0 | 5.0 |
| VCC 1826 | IC 3633 | 8111 | 190.04688 | 9.89613 | 5.1 | 7.06 | 8.8 | 6.1 |
| VCC 1828 | IC 3635 | 8104 | 190.05573 | 12.87477 | 5.1 | 14.55 | 9.1 | 4.6 |
| VCC 1833 | … | 8084 | 190.08199 | 15.93528 | 5.2 | 7.38 | 9.3 | 3.9 |
| VCC 1857 | IC 3647 | 8130 | 190.22131 | 10.47536 | 5.1 | 20.82 | 9.0 | 11.3 |
| VCC 1861 | IC 3652 | 8079 | 190.24400 | 11.18449 | 5.1 | 15.14 | 9.5 | 6.5 |
| VCC 1871 | IC 3653 | 8071 | 190.31556 | 11.38725 | 5.1 | 6.82 | 9.5 | 3.2 |
| VCC 1883 | NGC 4612 | 8051 | 190.38646 | 7.31488 | 5.1 | 24.99 | 10.4 | 10.5 |
| VCC 1886 | IC 3663 | 8106 | 190.41422 | 12.24739 | 5.1 | 12.61 | 8.8 | 4.3 |
| VCC 1895 | UGC 7854 | 8092 | 190.46658 | 9.40289 | 5.1 | 10.07 | 9.0 | 4.0 |
| VCC 1910 | IC 809 | 2068 8074 | 190.53610 | 11.75429 | 30.1 | 12.52 | 9.5 | 4.2 |
| VCC 1913 | NGC 4623 | 8062 | 190.54454 | 7.67694 | 5.3 | 14.67 | 10.1 | 4.0 |
| VCC 1938 | NGC 4638 | 8046 | 190.69760 | 11.44251 | 5.3 | 14.79 | 10.5 | 11.1 |
| VCC 1948 | IC 3693 | 8097 | 190.74175 | 10.68181 | 5.1 | 10.94 | 8.8 | 4.5 |
| VCC 1993 | … | 8102 | 191.05011 | 12.94184 | 4.8 | 8.58 | 9.0 | 4.9 |
| VCC 2000 | NGC 4660 | 8043 | 191.13327 | 11.19053 | 5.1 | 10.45 | 10.4 | 8.6 |
| VCC 2019 | IC 3735 | 8129 | 191.33510 | 13.69266 | 3.5 | 15.25 | 9.4 | 8.5 |
| VCC 2048 | IC 3773 | 8070 | 191.81375 | 10.20359 | 5.3 | 11.90 | 9.6 | 4.6 |
| VCC 2050 | IC 3779 | 8101 | 191.83598 | 12.16643 | 5.1 | 10.80 | 9.0 | 4.9 |
| VCC 2092 | NGC 4754 | 8038 | 193.07290 | 11.31389 | 3.4 | 24.13 | 10.9 | 22.1 |
Note. — (1) Name of Virgo galaxies (* denotes galaxies with multiple observations which result in detection of diffuse X-ray emission, † denotes the only one galaxy VCC 1231 with single longer observation); (2) Other name of the target galaxies; (3) Chandra observation ID. For galaxies with multiple observations, all observation ID are listed, and the 5-ks observation used in stacking analysis is marked in italic; (4)-(5): Celestial coordinates of the galactic center (J2000); (6) Chandra effective exposure, in units of ks; (7) Effective radius of the target galaxies, in units of arc-second; (8) Logarithmic stellar mass of host galaxies, in unit of , adopted from Gallo et al. (2010); (9) 0.5-2 keV luminosity of detected diffuse X-ray emission and upper limit of non-detections, in units of .
| Subset | # of ETGs | Mass Range | Median | S/N | Photon Flux | ||
|---|---|---|---|---|---|---|---|
| Intermediate-mass Virgo ETGs | 25 | 10.3 | 5.7 | ||||
| Low-mass Virgo ETGs | 45 | 9.2 | 3.2 | ||||
| Intermediate-mass field ETGs | 7 | 10.1 | 3.6 | ||||
| Low-mass field ETGs | 15 | 9.1 | 3.1 | ||||
| Very low-mass field ETGs | 27 | 8.0 | 0.3 | 0.4 | 0.5 | 45.6 |
Note. — (1) Subsets of stacked galaxies; (2) Number of stacked galaxies; (3) Logarithmic stellar mass range of stacked galaxies; (4) Median stellar mass of stacked galaxies; (5) Signal-to-noise ratio of the stacked signal; (6) Net photon flux per stacked galaxy, in units of ; (7) Mean 0.5–2 keV luminosity of the stacked signal in units of , converted from column 6 by adopting the median distance of a given bin; (8) Specific 0.5–2 keV luminosity of the stacked signal, in units of . The upper limits are of 3.
| Name | d.o.f. | Total flux | ||||
|---|---|---|---|---|---|---|
| VCC 944∗ | 21.9/16 | |||||
| 25.8/17 | ||||||
| VCC 1030 | 4.4/4 | |||||
| VCC 1154 | 31.0/31 | |||||
| VCC 1231 | 10.4/7 | |||||
| VCC 1630 | 4.7/7 |
Note. — (1) Galaxy name; (2) Best-fit temperature of hot gas; (3) over degree-of-freedom; (4)-(6) 0.5–2 keV flux of different components derived from best-fit spectral model, in units of ; (7) Total 0.5–2 keV flux, including all three components, in units of . Quoted errors are at 90% confidence level. ∗This galaxy is fitted with two models, in the first case the flux of the LMXB component is set free, while in the second case the flux of the LMXB component is fixed at the expected level.
References
- Bell et al. (2003) Bell, E. F., McIntosh, D. H., Katz, N., & Weinberg, M. D. 2003, ApJS, 149, 289, doi: 10.1086/378847
- Biller et al. (2004) Biller, B. A., Jones, C., Forman, W. R., Kraft, R., & Ensslin, T. 2004, ApJ, 613, 238, doi: 10.1086/423020
- Bogdán et al. (2012a) Bogdán, Á., David, L. P., Jones, C., Forman, W. R., & Kraft, R. P. 2012a, ApJ, 758, 65, doi: 10.1088/0004-637X/758/1/65
- Bogdán et al. (2012b) Bogdán, Á., Forman, W. R., Kraft, R. P., et al. 2012b, ApJ, 755, 25, doi: 10.1088/0004-637X/755/1/25
- Böhringer et al. (1994) Böhringer, H., Briel, U. G., Schwarz, R. A., et al. 1994, Nature, 368, 828, doi: 10.1038/368828a0
- Boroson et al. (2011) Boroson, B., Kim, D.-W., & Fabbiano, G. 2011, ApJ, 729, 12, doi: 10.1088/0004-637X/729/1/12
- Brown & Bregman (2000) Brown, B. A., & Bregman, J. N. 2000, ApJ, 539, 592, doi: 10.1086/309240
- Clark (1975) Clark, G. W. 1975, ApJ, 199, L143, doi: 10.1086/181869
- David et al. (2006) David, L. P., Jones, C., Forman, W., Vargas, I. M., & Nulsen, P. 2006, ApJ, 653, 207, doi: 10.1086/508623
- Ehlert et al. (2013) Ehlert, S., Werner, N., Simionescu, A., et al. 2013, MNRAS, 430, 2401, doi: 10.1093/mnras/stt060
- Fabbiano (2006) Fabbiano, G. 2006, ARA&A, 44, 323, doi: 10.1146/annurev.astro.44.051905.092519
- Ferrarese et al. (2006) Ferrarese, L., Côté, P., Jordán, A., et al. 2006, ApJS, 164, 334, doi: 10.1086/501350
- Gallo et al. (2008) Gallo, E., Treu, T., Jacob, J., et al. 2008, ApJ, 680, 154, doi: 10.1086/588012
- Gallo et al. (2010) Gallo, E., Treu, T., Marshall, P. J., et al. 2010, ApJ, 714, 25, doi: 10.1088/0004-637X/714/1/25
- Ge et al. (2015) Ge, C., Li, Z., Xu, X., et al. 2015, ApJ, 812, 130, doi: 10.1088/0004-637X/812/2/130
- Goulding et al. (2016) Goulding, A. D., Greene, J. E., Ma, C.-P., et al. 2016, ApJ, 826, 167, doi: 10.3847/0004-637X/826/2/167
- Graham & Worley (2008) Graham, A. W., & Worley, C. C. 2008, MNRAS, 388, 1708, doi: 10.1111/j.1365-2966.2008.13506.x
- Harris et al. (2013) Harris, W. E., Harris, G. L. H., & Alessi, M. 2013, ApJ, 772, 82, doi: 10.1088/0004-637X/772/2/82
- Hou et al. (2017) Hou, M., Li, Z., Peng, E. W., & Liu, C. 2017, ApJ, 846, 126, doi: 10.3847/1538-4357/aa8635
- Jeltema et al. (2008) Jeltema, T. E., Binder, B., & Mulchaey, J. S. 2008, ApJ, 679, 1162, doi: 10.1086/587508
- Juráňová et al. (2020) Juráňová, A., Werner, N., Nulsen, P. E. J., et al. 2020, MNRAS, 499, 5163, doi: 10.1093/mnras/staa3182
- Kim & Fabbiano (2015) Kim, D.-W., & Fabbiano, G. 2015, ApJ, 812, 127, doi: 10.1088/0004-637X/812/2/127
- Kim et al. (2014) Kim, S., Rey, S.-C., Jerjen, H., et al. 2014, ApJS, 215, 22, doi: 10.1088/0067-0049/215/2/22
- Kraft et al. (2005) Kraft, R. P., Nolan, L. A., Ponman, T. J., Jones, C., & Raychaudhury, S. 2005, ApJ, 625, 785, doi: 10.1086/429982
- Kraft et al. (2011) Kraft, R. P., Forman, W. R., Jones, C., et al. 2011, ApJ, 727, 41, doi: 10.1088/0004-637X/727/1/41
- Kraft et al. (2017) Kraft, R. P., Roediger, E., Machacek, M., et al. 2017, ApJ, 848, 27, doi: 10.3847/1538-4357/aa8a6e
- Li et al. (2018) Li, Y., Su, Y., & Jones, C. 2018, MNRAS, 480, 4279, doi: 10.1093/mnras/sty2125
- Li et al. (2011) Li, Z., Jones, C., Forman, W. R., et al. 2011, ApJ, 730, 84, doi: 10.1088/0004-637X/730/2/84
- Lu & Wang (2011) Lu, Z., & Wang, Q. D. 2011, MNRAS, 413, 347, doi: 10.1111/j.1365-2966.2010.18136.x
- Machacek et al. (2006) Machacek, M., Nulsen, P. E. J., Jones, C., & Forman, W. R. 2006, ApJ, 648, 947, doi: 10.1086/505963
- Machacek et al. (2004) Machacek, M. E., Jones, C., & Forman, W. R. 2004, ApJ, 610, 183, doi: 10.1086/421448
- Mathews et al. (2006) Mathews, W. G., Brighenti, F., Faltenbacher, A., et al. 2006, ApJ, 652, L17, doi: 10.1086/509915
- Mei et al. (2007) Mei, S., Blakeslee, J. P., Côté, P., et al. 2007, ApJ, 655, 144, doi: 10.1086/509598
- Miller et al. (2012) Miller, B., Gallo, E., Treu, T., & Woo, J.-H. 2012, ApJ, 747, 57, doi: 10.1088/0004-637X/747/1/57
- Mulchaey & Jeltema (2010) Mulchaey, J. S., & Jeltema, T. E. 2010, ApJ, 715, L1, doi: 10.1088/2041-8205/715/1/L1
- O’Sullivan et al. (2001) O’Sullivan, E., Forbes, D. A., & Ponman, T. J. 2001, MNRAS, 328, 461, doi: 10.1046/j.1365-8711.2001.04890.x
- Paggi et al. (2017) Paggi, A., Kim, D.-W., Anderson, C., et al. 2017, ApJ, 844, 5, doi: 10.3847/1538-4357/aa7897
- Randall et al. (2008) Randall, S., Nulsen, P., Forman, W. R., et al. 2008, ApJ, 688, 208, doi: 10.1086/592324
- Randall et al. (2004) Randall, S. W., Sarazin, C. L., & Irwin, J. A. 2004, ApJ, 600, 729, doi: 10.1086/380109
- Revnivtsev et al. (2007) Revnivtsev, M., Churazov, E., Sazonov, S., Forman, W., & Jones, C. 2007, A&A, 473, 783, doi: 10.1051/0004-6361:20077336
- Revnivtsev et al. (2008) —. 2008, A&A, 490, 37, doi: 10.1051/0004-6361:200809889
- Revnivtsev et al. (2006) Revnivtsev, M., Sazonov, S., Gilfanov, M., Churazov, E., & Sunyaev, R. 2006, A&A, 452, 169, doi: 10.1051/0004-6361:20054268
- Roediger et al. (2015) Roediger, E., Kraft, R. P., Nulsen, P. E. J., et al. 2015, ApJ, 806, 103, doi: 10.1088/0004-637X/806/1/103
- Sarazin et al. (2001) Sarazin, C. L., Irwin, J. A., & Bregman, J. N. 2001, ApJ, 556, 533, doi: 10.1086/321618
- Sarzi et al. (2013) Sarzi, M., Alatalo, K., Blitz, L., et al. 2013, MNRAS, 432, 1845, doi: 10.1093/mnras/stt062
- Su et al. (2015) Su, Y., Irwin, J. A., White, Raymond E., I., & Cooper, M. C. 2015, ApJ, 806, 156, doi: 10.1088/0004-637X/806/2/156
- Su et al. (2019) Su, Y., Kraft, R. P., Nulsen, P. E. J., et al. 2019, AJ, 158, 6, doi: 10.3847/1538-3881/ab1d51
- Sun et al. (2007) Sun, M., Jones, C., Forman, W., et al. 2007, ApJ, 657, 197, doi: 10.1086/510895
- Trinchieri & Fabbiano (1985) Trinchieri, G., & Fabbiano, G. 1985, ApJ, 296, 447, doi: 10.1086/163463
- Tschöke et al. (2001) Tschöke, D., Bomans, D. J., Hensler, G., & Junkes, N. 2001, A&A, 380, 40, doi: 10.1051/0004-6361:20011354
- Urban et al. (2011) Urban, O., Werner, N., Simionescu, A., Allen, S. W., & Böhringer, H. 2011, MNRAS, 414, 2101, doi: 10.1111/j.1365-2966.2011.18526.x
- Vijayaraghavan & Ricker (2015) Vijayaraghavan, R., & Ricker, P. M. 2015, MNRAS, 449, 2312, doi: 10.1093/mnras/stv476
- Wagner et al. (2018) Wagner, C. R., McDonald, M., & Courteau, S. 2018, ApJ, 867, 14, doi: 10.3847/1538-4357/aae37c
- Weżgowiec et al. (2012) Weżgowiec, M., Bomans, D. J., Ehle, M., et al. 2012, A&A, 544, A99, doi: 10.1051/0004-6361/201117652
- White & Sarazin (1991) White, Raymond E., I., & Sarazin, C. L. 1991, ApJ, 367, 476, doi: 10.1086/169644
- Wood et al. (2017) Wood, R. A., Jones, C., Machacek, M. E., et al. 2017, ApJ, 847, 79, doi: 10.3847/1538-4357/aa8723
- Zhang et al. (2012) Zhang, Z., Gilfanov, M., & Bogdán, Á. 2012, A&A, 546, A36, doi: 10.1051/0004-6361/201219015