The W mass and width measurement challenge at FCC-ee
Abstract
The FCC-ee physics program will deliver two complementary top-notch precision determinations of the W boson mass, and width. The first and main measurement relies on the rapid rise of the W-pair production cross section near its kinematic threshold. This method is extremely simple and clean, involving only the selection and counting of events, in all different decay channels. An optimal threshold-scan strategy with a total integrated luminosity of shared on energy points between 157 and 163 GeV will provide a statistical uncertainty on the W mass of 0.5 MeV and on the W width of 1.2 MeV. For these measurements, the goal of keeping the impact of systematic uncertainties below the statistical precision will be demanding, but feasible. The second method exploits the W-pair final state reconstruction and kinematic fit, making use of events with either four jets or two jets, one lepton and missing energy. The projected statistical precision of the second method is similar to the first method’s, with uncertainties of () MeV for the W mass (width), employing W-pair data collected at the production threshold and at 240-365 GeV. For the kinematic reconstruction method, the final impact of systematic uncertainties is currently less clear, in particular uncertainties connected to the modelling of the W hadronic decays. The use and interplay of Z and ZZ events, reconstructed and fitted with the same techniques as the WW events, will be important for the extraction of W mass measurements with data at the higher 240 and 365 GeV energies.
pacs:
13.66.Jn Precision measurements in interactions and 13.66.FgGauge and Higgs boson production in interactions and 14.70.FmW bosons1 Introduction
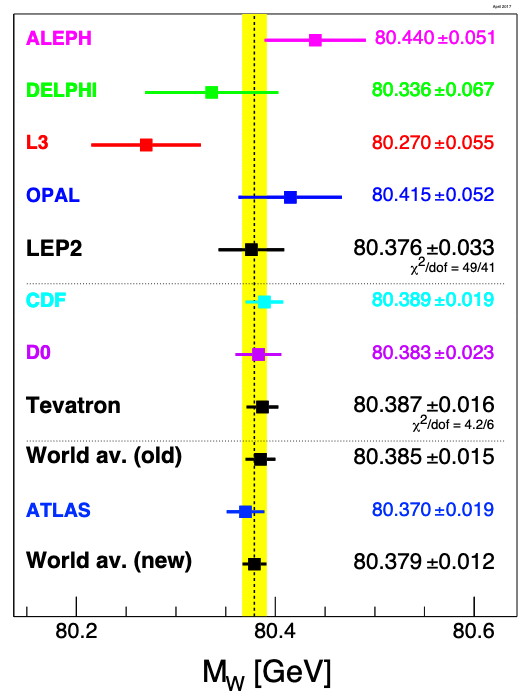
The W mass is a fundamental parameter of the standard model (SM) of particle physics, currently measured with a precision of 12 MeV Zyla:2020zbs , from a combination of LEP, Tevatron and LHC measurements shown in Fig. 1. In the context of precision electroweak tests the precision of the measurement of the W mass is currently limiting the sensitivity to possible effects of new physics Baak:2014ora .
A precise direct determination of the W mass can be achieved by observing the rapid rise of the W-pair production cross section near its kinematic threshold. This method essentially only involves counting events, in all decay channels, and is therefore extremely clean and straightforward. In 1996 the LEP collider delivered collisions at a single energy point near 161 GeV, with a total integrated luminosity of about 10 pb-1 at each of the four interaction points. The data was used to measure the W-pair cross section () at 161 GeV, and extract the W mass with a precision of 200 MeV Barate:1997mn ; Abreu:1997sn ; Acciarri:1997xc ; Ackerstaff:1996nk . The W mass and width have further been measured, with better precision, making use of the full kinematic reconstruction of all decay channels at LEP Schael:2013ita , and the partial reconstruction of leptonic decays at the Tevatron Aaltonen:2013iut and LHC Aaboud:2017svj ; LHCb:2021bjt hadron colliders.
Estimates of the W mass and width precision achievable with the FCC-ee physics program are outlined in Ref. Abada:2019lih . Further details and insight are given in the following.
2 The W-pair cross section lineshape
The determination of the W mass and width from the W-pair threshold cross section lineshape is presented here. For a basic understanding of the statistical and systematic uncertainties, the W mass extraction from a single cross section energy point is illustrated first.
Performing a W-pair cross section measurement at a single energy point the statistical sensitivity to the W mass is given by
| (1) |
where is the data integrated luminosity, the signal event selection efficiency and the selection purity, alternatively expressed in terms of , the total selected background cross section.
A systematic uncertainty on the background cross section will propagate to the W mass uncertainty as
| (2) |
Other systematic uncertainties as on the acceptance () and luminosity () will propagate as
| (3) |
while theoretical uncertainties on the cross section () propagate directly as
| (4) |
Finally the uncertainty on the center of mass energy will propagate to the W mass uncertainty as
| (5) |
that can be shown to be limited as , and in fact for near the threshold it is , so it is the beam energy uncertainty that propagates directly to the W mass uncertainty.
In the case of ab-1 accumulated by the FCC-ee data taking in the W-pair threshold energy region, and assuming an event selection with fb and , similar to what was achieved at LEP Barate:1997mn , a statistical precision of MeV is achievable as from Eq. 1. The impact of systematic uncertainties can be kept below the statistical uncertainty by satisfying the following conditions:
| (6) | |||
| (7) | |||
| (8) | |||
| (9) |
corresponding to precision levels of on the background, on acceptance and luminosity, on the theoretical cross section, and on the beam energy. All of these conditions appear to be challenging yet should be attainable on the side of experimental systematics, as also discussed later in this essay. The challenge to reach the required theoretical precision is discussed in Ref. Heinemeyer:2021rgq , where it is clear that substantial improvements over the current state of the art Denner:2005es ; Denner:2005fg ; Beneke:2007zg ; Actis:2008rb will be necessary to reach the precision level.
W mass and width measurements at two or more energy points
In the SM the W width is linked to the W mass, and the Fermi constant, with a QCD correction due to the hadronic decay contributions. The W width is currently measured to a precision of 42 MeV Zyla:2020zbs . The first calculations of the W boson width effects in reactions have been performed in Ref. Muta:1986is , and revealed the substantial effects of the width on the cross section lineshape, in particular at energies below the nominal threshold.
From the determination of at a minimum of two energy points near the kinematic threshold both the W mass and width can be extracted Azzi:2017iih .
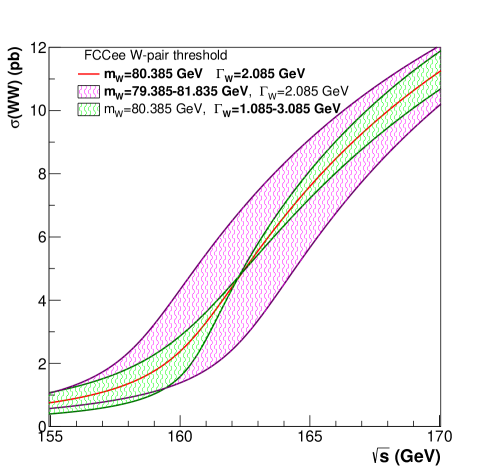
In the following the YFSWW3 version 1.18 Jadach:2001uu program has been used to calculate as a function of the energy (), W mass () and width (). Figure 1 shows the W-pair cross section as a function of the collision energy with W mass and width values set at the central values GeV and GeV, and with large 1 GeV variation bands around the mass and width central values. It is to be noted that these does not represent a full state of the art precision on the cross section values, but deliver a precision that is fully comfortable for all results and conclusions presented in this paper. In fact the same conclusions in terms of methodology, optimal data taking planning, and projected precision of the measurements are also reached when making use of the leading order analytical formulae in Ref. Muta:1986is for the cross section dependencies.
It can be noted that while a variation of the W mass roughly corresponds to a shift of the cross section lineshape along the energy axis, a variation of the W width has the effect of changing the slope of the cross section lineshape rise. It can also be noted that the W width dependence shows a crossing point at GeV, where the cross section is insensitive to the W width.
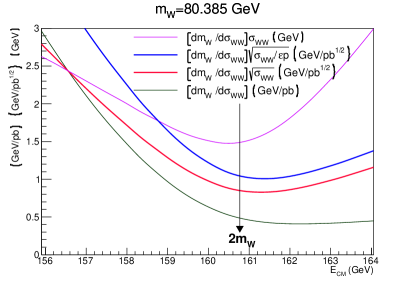
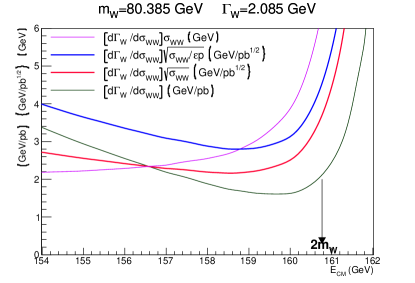
Figure 2 shows the differential functions introduced in Eq. 1 2 3 4, and relevant to the statistical and systematical uncertainties for a measurement of the W mass and width from the W-pair cross section near the kinematic threshold, similarly as discussed for the single energy point W mass extraction. For the statistical terms the efficiency and purities are evaluated assuming an event selection quality with fb and .
The minima of the mass differential curves plotted in Fig. 2 left indicate the optimal points to take data for a W mass measurement, in particular minimum statistical uncertainty is achieved with GeV GeV.
The maximum sensitivity to the W width can be determined from the minima of the curves displayed in Fig. 2 right. Note that these curves all diverge at GeV, where . The minima of the width differential curves are spread over a larger area, with the term decreasing at lower energies due to the vanishing . This is relevant in the context of an optimal data-taking strategy, if systematic uncertainties become limiting factors, as discussed later.
If two cross section measurements are performed at two energy points , both the W mass and width can be extracted with a fit to the cross section lineshape. The uncertainty propagation is given by
| (10) | |||
| (11) |
The resulting uncertainty on the W mass and width is
| (12) |
| (13) |
If the uncertainties on the cross section measurements are uncorrelated, e.g. only statistical, the linear correlation between the derived mass and width uncertainties is
| (14) |
Optimal data taking configurations
When planning data taking at two different energy points near the W-pair threshold in order to extract both and , it is useful to figure out which energy points values and , would be optimally suited to obtain the best measurements, also as a function of the data luminosity fraction delivered at the higher energy point. For this a full 3-dimensional scan of possible , and values, has been performed, and the configurations that minimize a given combination of the expected statistical uncertainties on the mass and the width are found.
For example, in order to minimize the simple sum of the statistical uncertainties , the optimal data taking configuration would be with
| (15) |
With this configuration, and assuming a total luminosity of ab-1, the projected statistical uncertainties would be
| (16) |
Varying the definition of used in the optimization does not significantly affect the results. The optimal upper energy is always at the -independent GeV point, while the optimal lower energy is at units below the nominal threshold, with the precise value depending on the degree to which the definition of is focused on the W-width measurement. In a similar way the optimal data fraction to be taken at the lower off-shell energy point varies according to the chosen precision targets, with larger fractions more to the benefit of the W width precision. If a small fraction of data (e.g. 0.05) is taken off-shell a statistical precision MeV is obtainable both with a single- () and the two-parameter () fit of the lineshape.
Considering that the beam energies that can surely be calibrated with resonant depolarization are such that the spin tune is a half integer, that is
| (17) |
where is an integer, the scan of energy points can be limited to a grid with . Taking this grid constraint into account the optimal higher energy point for data taking becomes the GeV for . The corresponding minimum statistical precisions attainable are increased by 5-10% with respect to the values reported above. For the case of minimizing , would be with taking data with GeV, GeV, and yielding statistical uncertainties MeV and MeV assuming a total integrated luminosity ab-1.
The effects of the beam energy spread effects have also been considered, and impact mostly the W width extraction. A 10%-level control on the energy spread will be sufficient to make the corresponding systematic uncertainties negligible Blondel:2019jmp .
Data taking at additional energy points
In the case of limiting correlated systematics uncertainties, it can be useful to take data and measure both signal and background cross section at more than two points, in order to reduce background and acceptance uncertainties.
In particular, for the simultaneous measurement of and just described, taking data at energy points where the differential factors , , and , are equal, can help cancelling the effect of correlated systematic uncertainties of background and acceptance. Initial investigations in this direction have been carried out Shen:2018afo , supporting the presumption that taking data at more than two energy points improves the robustness of the measurement against correlated systematic uncertainties.
Measuring the W-pair cross section at additional points can also serve to disentangle possible new physics effects, as for example anomalous triple gauge coupling (TGC) contributions. The SM-expected steep W-pair cross section rise with energy is proportional to the produced W boson velocity ( ) and is driven by the -channel neutrino exchange process. The contribution of processes with TGCs follow a different dependence, with expected cancellation effects. Anomalous TGC contributions would therefore lead to distinctive differences in the W-pair cross section lineshape also in the threshold region.
3 W mass and width from the W pair decay kinematics
In addition to the W mass and width measurements achievable through the W-pair cross sections near the production energy threshold, the W mass and width can also be determined from the kinematic reconstruction of the W-pair decay products. This was the primary method to measure the W mass and width with LEP2 data Schael:2013ita .
In the kinematic reconstruction of the W mass from W-pair decays the fully hadronic () and semi-leptonic () final states are exploited, making use of events with either four jets or two jets, one lepton and missing energy. In both cases the reconstructed W mass values are obtained by imposing the constraint that the total four momentum in the event should be equal to the known initial centre-of-mass energy and zero momentum. The four momentum constraints (4C) are implemented by means of a kinematic fit where the measured parameters of the jets and leptons are adjusted, taking account of their measurement uncertainties in such a way as to satisfy the constraints of energy and momentum conservation. The 4C implementation allows to overcome the limitations of jet energy resolution on the W mass reconstruction, and improve the mass resolution from 10 GeV to 2 GeV. The kinematic fit of final states with four-momentum conservation constraints can also be applied to other di-boson productions at GeV, like Z-pairs and Z events. In the case of Z final states, also known as radiative returns to the Z-peak, the fit can be shown to lead to a reconstructed Z boson mass as Schael:2006mz ,
| (18) |
where is the angle of the two leptons or jets from the Z decay, with respect to the photon direction, and are the leptons or jets velocities. The formula in Eq. 18 is based on fixing the jet directions and velocities to their measured values but rescaling their energies to conserve four-momentum, that follows closely what is done in a kinematic fit.
Equation 18 also shows the direct interplay between the reconstructed Z mass and the centre-of-mass energy (). In practice the Z mass is reconstructed primarily through the decay products direction, and their velocities in the case of hadronic jets, while the energy scale is set by the known collision energy. The same happens with the 4C kinematic reconstruction of W-pairs, where again the energy scale of jets is given by the event and the angular openings of jets and leptons carry the primary information to determine the W mass, with the jets velocities as the further important ingredient.
On the other hand, by making use of the value of precisely measured at the Z pole, the collision energy can be treated as the parameter to be measured in Eq. 18, so that the kinematic fit of radiative decays can be used to determine . This interpretation was used with LEP2 data to cross-check the values determined by the accelerator Schael:2013ita .
In general a kinematic fit of either Z, ZZ, or WW decays can be equivalently employed either to determine the boson (W or Z) mass assuming a given centre-of-mass energy or, alternatively, the average centre-of-mass energy assuming a fixed boson mass.
W-pair reconstruction at FCC-ee data taking energies
The prospects of the kinematic reconstruction of W-pairs with FCC-ee data can be estimated taking as a reference existing LEP measurements Schael:2006mz . In a kinematic reconstruction data analysis W-pair decay products are typically forced into four jets using the DURHAM Catani:1991hj algorithm in the hadronic channel, and into two jets and a lepton in the semi-leptonic channel.
The reconstructed W mass peak resolution can be remarkably improved with a four-momentum conservation fit (4C) described above, and eventually with the additional constraint of equal mass for both W in each event (5C). Maximum likelihood template fits of the reconstructed W mass distributions are then used to extract the value of . With this methodology, used with LEP2 data, it can be estimated that the combined statistical precision of all FCC-ee data would deliver a final precision of around 1 MeV for the W width, and below 0.5 MeV for the W mass, matching the precision delivered by the threshold cross section lineshape.
Systematic uncertainties
The limitations of systematic uncertainties to the precision of the W mass kinematic reconstruction with FCC-ee data are not easy to establish with certainty. As for the threshold cross section method, the beam energy uncertainty is reflected directly to the W mass reconstruction, in this case through the kinematic fit. Beam energy calibration through resonant depolarisation will ensure that this uncertainty will not be a limiting factor for the W mass reconstruction with the data taken at 162.6 GeV. For the data taken at 240 GeV and 350-365 GeV the analysis and kinematic fit of Z and ZZ events can allow to determine the data with high precision, as can be inferred from Eq. 18 and done with LEP2 data Schael:2013ita . Extrapolating the LEP2 measurements to the projected FCC-ee data, a statistical precision of around 1 MeV for would be achievable. This would propagate to a 0.5 MeV systematic uncertainty on the W mass, that matches the projected final statistical uncertainty, and would therefore not be negligible.
A number of other systematic uncertainties that were relevant for the LEP2 measurements appear to make this measurement overall more challenging with respect to the more simple threshold determinations. The most challenging uncertainties are likely to be related to non-perturbative QCD modelling of the W-pair decays fragmentation, that relates directly to the hadronic jets boost, i.e. the factors in Eq. 18. Precise measurements of fragmentation properties of Z boson hadronic decays, collected at teh Z peak, will be instrumental to build control on the fragmentation properties of weak bosons.
Finally a simultaneous analysis and kinematic fit of WW, ZZ and Z events, can lead to a determination of the ratio where many systematic uncertainties common to the three channels can cancel, and the W mass can be derived given the independent precision on the Z mass ( KeV) from the Z peak data.
4 Conclusions
Among the primary parameters of the standard model, the W mass and width are those where a improvement of the experimental determination is most desirable. These measurements are extremely difficult at high energy hadron colliders, and the foreseen precision achievable with LHC data is around 10 MeV for the W mass.
The FCC-ee program will offer the opportunity for a full exploration of the W-pair production at the kinematic threshold that will deliver a clean and straightforward determination of the W mass and width, with respective accuracies of 0.5 MeV and 1.2 MeV.
Complementary and more challenging determinations of the W mass and width with FCC-ee data can be obtained through the reconstruction of W-pair decay products, from data in the full range from the production threshold to GeV. The projected statistical precision from these other measurements are similar to those of the threshold determinations, but the impact of systematic uncertainties are more difficult to predict, in particular those arising from the beam energy knowledge and the modelling of non-perturbative QCD effects in the W boson hadronic decays. The ultimate way forward to exploit the kinematic reconstruction method could be in the simultaneous analysis of WW, ZZ and Z events, making use of the much higher precision of the Z mass from the peak scan, and allowing to reduce the impact of correlated systematic effects.
References
- (1) Particle Data Group, P. Zyla et al., Review of Particle Physics, PTEP 2020 no. 8, (2020) 083C01.
- (2) GFitter Group, M. Baak, J. Cúth, J. Haller, A. Hoecker, R. Kogler, K. Mönig, M. Schott, and J. Stelzer, The global electroweak fit at NNLO and prospects for the LHC and ILC, Eur. Phys. J. C 74 (2014) 3046, arXiv:1407.3792 [hep-ph].
- (3) ALEPH, R. Barate et al., Measurement of the mass in collisions at production threshold, Phys. Lett. B 401 (1997) 347–362.
- (4) DELPHI, P. Abreu et al., Measurement and interpretation of the pair cross-section in interactions at 161-GeV, Phys. Lett. B 397 (1997) 158–170.
- (5) L3, M. Acciarri et al., Pair production of bosons in interactions at = 161-GeV, Phys. Lett. B 398 (1997) 223–238.
- (6) OPAL, K. Ackerstaff et al., Measurement of the mass of the boson in collisions at = 161-GeV, Phys. Lett. B 389 (1996) 416–428.
- (7) ALEPH, DELPHI, L3, OPAL, and LEP Electroweak Working Group, S. Schael et al., Electroweak Measurements in Electron-Positron Collisions at W-Boson-Pair Energies at LEP, Phys. Rept. 532 (2013) 119–244, arXiv:1302.3415 [hep-ex].
- (8) CDF and D0, T. A. Aaltonen et al., Combination of CDF and D0 -Boson Mass Measurements, Phys. Rev. D 88 no. 5, (2013) 052018, arXiv:1307.7627 [hep-ex].
- (9) ATLAS, M. Aaboud et al., Measurement of the -boson mass in pp collisions at TeV with the ATLAS detector, Eur. Phys. J. C 78 no. 2, (2018) 110, arXiv:1701.07240 [hep-ex]. [Erratum: Eur.Phys.J.C 78, 898 (2018)].
- (10) LHCb, R. Aaij et al., Measurement of the boson mass, arXiv:2109.01113 [hep-ex].
- (11) FCC, A. Abada et al., FCC Physics Opportunities: Future Circular Collider Conceptual Design Report Volume 1, Eur. Phys. J. C 79 no. 6, (2019) 474.
- (12) S. Jadach, W. Placzek, M. Skrzypek, B. F. L. Ward, and Z. Was, The Monte Carlo event generator YFSWW3 version 1.16 for W pair production and decay at LEP-2 / LC energies, Comput. Phys. Commun. 140 (2001) 432–474, arXiv:hep-ph/0103163.
- (13) S. Heinemeyer, S. Jadach, and J. Reuter, Theory requirements for SM Higgs and EW precision physics at the FCC-ee, Eur. Phys. J. Plus 136 no. 9, (2021) 911, arXiv:2106.11802 [hep-ph].
- (14) A. Denner, S. Dittmaier, M. Roth, and L. H. Wieders, Complete electroweak O(alpha) corrections to charged-current e+e- — 4 fermion processes, Phys. Lett. B 612 (2005) 223–232, arXiv:hep-ph/0502063. [Erratum: Phys.Lett.B 704, 667–668 (2011)].
- (15) A. Denner, S. Dittmaier, M. Roth, and L. H. Wieders, Electroweak corrections to charged-current e+ e- — 4 fermion processes: Technical details and further results, Nucl. Phys. B 724 (2005) 247–294, arXiv:hep-ph/0505042. [Erratum: Nucl.Phys.B 854, 504–507 (2012)].
- (16) M. Beneke, P. Falgari, C. Schwinn, A. Signer, and G. Zanderighi, Four-fermion production near the W pair production threshold, Nucl. Phys. B 792 (2008) 89–135, arXiv:0707.0773 [hep-ph].
- (17) S. Actis, M. Beneke, P. Falgari, and C. Schwinn, Dominant NNLO corrections to four-fermion production near the W-pair production threshold, Nucl. Phys. B 807 (2009) 1–32, arXiv:0807.0102 [hep-ph].
- (18) T. Muta, R. Najima, and S. Wakaizumi, Effects of the Boson Width in Reactions, Mod. Phys. Lett. A 1 (1986) 203.
- (19) P. Azzurri et al., Physics Behind Precision, arXiv:1703.01626 [hep-ph].
- (20) A. Blondel et al., Polarization and Centre-of-mass Energy Calibration at FCC-ee, arXiv:1909.12245 [physics.acc-ph].
- (21) P. X. Shen et al., Data-taking strategy for the precise measurement of the boson mass with a threshold scan at circular electron positron colliders, Eur. Phys. J. C 80 no. 1, (2020) 66, arXiv:1812.09855 [hep-ex].
- (22) ALEPH, S. Schael et al., Measurement of the boson mass and width in collisions at LEP, Eur. Phys. J. C 47 (2006) 309–335, arXiv:hep-ex/0605011.
- (23) S. Catani, Y. L. Dokshitzer, M. Olsson, G. Turnock, and B. R. Webber, New clustering algorithm for multi - jet cross-sections in annihilation, Phys. Lett. B 269 (1991) 432–438.