Collision of Dynamic Jamming Fronts in a Dense Suspension
Abstract
Dynamic jamming is a phenomenon whereby a dense suspension switches from a fluid-like to a solid-like state when subjected to sufficient stress and deformation. Large enough systems show that this transition is accompanied by a distinct jamming front. We present an experimental study where two jamming fronts are created simultaneously using two cylinders moving in parallel. We focus our observations on the collision of the jammed regions when the two fronts meet. Surprisingly, our measurements, combining surface texture visualization and time-resolved particle image velocimetry, show the formation of an unjammed region contained within the otherwise jammed suspension.
I Introduction
Densely packed suspensions of solid particles exhibit phenomena such as discontinuous shear thickening [1, 2, 3], dilating particle structure [4] and the ability to jam [5, 6, 7], that is, switch to a solid-like state. In some systems, the transition from a fluid-like to a solid-like state is observed to give rise to the phenomena of dynamic shear jamming fronts [8, 9, 10, 11, 12, 13, 14]. A region of high shear rate, initiated from a perturbing body, propagates through the suspension and leaves a jammed state in its wake. Although there has been recent progress in macro scale continuum modeling capturing dynamic shear jamming fronts [15, 16], studies of this phenomena have typically been limited to relatively simple flows and geometries. More specifically, previous experimental configurations generated jamming fronts from a single perturbing body, and thus the idea of jamming fronts interacting has not been previously investigated. What happens when jamming fronts collide is an open question.
A well known example of a suspension capable of dynamic jamming is a mixture of cornstarch and water [17, 18, 11]. Such a suspension flows when subjected to low stress, but shear thickens or jams at high stress. Once the stress is released, the suspension relaxes back to a fluid-like state [7, 4, 19]. Physically, the underlying mechanism causing discontinuous shear thickening and dynamic jamming is understood as a transition from viscous to frictional interaction between particles, which changes the effective jamming volume fraction and subsequently the viscosity at a given volume fraction [1, 20, 21]. Repulsive forces between particles establish an onset stress [22, 23], below which the particles are separated by a lubrication layer. However, when the suspension is subjected to a sufficiently high stress, capable of overcoming the repulsive force, the particles are brought into a friction dominated contact network [1, 24], which greatly increases the resistance to flow. It has been shown that particle surface chemistry [22], shape [25, 26] and poly dispersity [27] affect this behaviour. The framework presented by Wyart & Cates [1] identifies that a dynamically jammed state is accessible in the range of volume fractions where flow is possible for viscous, but not for frictional interactions [23, 11, 14].
A finite amount of strain as well as stress is required to build a frictional contact network capable of resisting flow [16, 15]. As a consequence, large systems do not homogeneously turn into a jammed state, but transition locally once the suspension has strained sufficiently. This is observed as a front of high shear rate originating from the perturbing source that propagates through the suspension, leaving a jammed region in its wake [13, 8, 9, 10, 11, 12, 14]. The stress is applied by the local acceleration of the suspension [16], while an intrinsic onset strain is observed to accompany the liquid-solid transition [28, 14], depending on volume fraction [9, 12, 16]. For cornstarch suspensions, this transient phenomenon has been observed in domains ranging from mm [10] to mm [13], where the transition into the jammed state can propagate unimpeded through the suspension before confinement effects from solid boundaries influence the behaviour [4, 7]. It is worth noting that the jamming front phenomena has also been observed at a geological (kilometer) scale [29]. These examples are larger than typical milimeter sized rheometer configurations, as it is necessary to have a domain large enough to observe the front propagation. In summary, dynamic shear jamming fronts are observed in large systems when the suspension has a high enough volume fraction and is subjected to a sufficient amount of stress and strain to establish a force bearing contact network.
As mentioned above, the local stress is an important factor in determining if the suspension jams. Though Han et al. [16] have demonstrated how the stress is related to speed of the jamming front in the case of simple shear, we have no rigorous way of determining the local stresses in the general case. Instead, the dilating property of dense suspensions will be utilized here. Dilatancy is the ability of dense granular structures to increase in volume when sheared. In a suspension, the expansion of the solid phase causes a suction in the liquid phase [4, 7, 28, 30, 17]. This can be observed at the free surface as a change in surface texture from reflective to matte as the liquid phase is sucked into the voids in the expanding granular structure [31, 25, 32, 33]. A connection between free surface texture change, dilation and jamming in dense suspensions has been previously observed [33, 4, 28, 30, 25, 31], even showing solid-like behaviour such as cracking [33, 34, 32, 35], followed by a relaxation back to a fluid-like state [33, 34]. This visual change has also been shown to correlate with the stress response [4, 31]. Thus, observing the surface texture directly can be a means of characterizing different regions of the flow that do not appear obvious from velocity field data alone.
While earlier studies on dynamic shear jamming fronts have been limited to a single propagating front and its interaction with a solid boundary, this study presents the first observations of colliding jamming fronts. The jamming fronts are generated by two cylinders moving in parallel. We show that after collision, a diamond-shaped region between the cylinders is formed that relaxes back to its quiescent state, while still being surrounded by jammed material.
II Experimental procedure
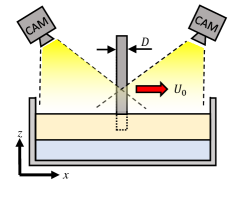
Our experimental set-up, shown in Fig. 1, is similar to that described in [14]. Experiments were conducted in a m m tank with two mm diameter () cylinders submerged into a mm thick suspension consisting of cornstarch and a sucrose-water solution. The suspension floated atop a mm layer of Fluorinert (FC-74). Fluorinert is a high density ( g/ml), low viscosity ( cSt) oil. This results in a close to stress free bottom boundary, such that the jamming front propagates in a 2D manner [13, 12, 14]. Microscopically, the jamming mechanism is fully three-dimensional as the suspension layer thickness used in these experiments is several order of magnitude larger than the particle size. However, macroscopically, the jamming front propagation is approximately 2D in the suspension layer [13, 12, 14]. Earlier lab scale observations of the jamming front phenomenon have been observed in domains up to mm [13]. The present configuration is more than three times larger than this, making it one of the physically largest lab scale experiments targeted at measuring shear jamming fronts, in order to reduce confinement effects.
[figure]style=plain,subcapbesideposition=top
[] \sidesubfloat[]
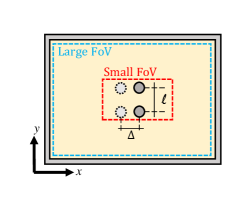 \sidesubfloat[]
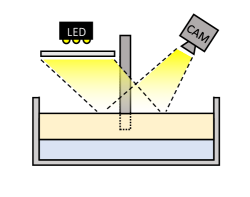
The cylinder velocity () and the volume fraction () are chosen to ensure that we reach the dynamic shear jamming regime. The volume fraction is defined as
| (1) |
where and are the starch and suspending fluid mass, respectively. g/ml and g/ml are the starch and water densities, respectively. The suspending liquid is a % wt. sucrose solution with density g/ml and viscosity Pa s. The sucrose is added to the water in order to reduce the impact of settling [14]. Due to the difficulty in precisely determining the nominal value of the volume fraction of cornstarch suspensions, earlier studies have used measured quantities such as onset strain rate [19] or front propagation [13] as the control parameter rather than the volume fraction. We use the same approach here, as the behaviour was highly consistent within a batch of suspension. The discrepancy in the volume fractions was accounted for by a % variation in the starch water content, , and was nominally . Thus, the reported here reflect the trend in the front propagation. At sufficiently low no propagating jamming front is observed [9, 14]. At sufficiently high perturbing speeds or stresses, yielding and buckling of the suspension have been reported [13, 16]. The results presented here are for m/s where the suspension is known to jam and the front propagation factor is independent of the [14]. Ancillary tests at and m/s confirm this.
The suspension is mixed for a minimum of two hours before it is poured onto the Fluorinert in the tank. It is then pre-sheared before any measurements are performed. The surface is seeded with black pepper and for every batch, the measurements are repeated 12 times. The time from when the suspension is poured until the experiment is complete and the suspension is discarded is approximately 15 min, which results in an estimated settling distance on the order of the particle diameter, and is thus negligible [36, 37]. Two high speed cameras (Photron FASTCAM Mini WX100) view the suspension surface in front and behind the traversing cylinders (figure 1). Particle image velocimetry (PIV) is used to converted the image series to velocity fields with LaVision DaVis 8.4.0. An initial pass was performed with pixels pixels square interrogation windows, followed by two passes with circular interrogation windows with decreasing size ending at pixels pixels. For all passes, the interrogation windows have a % overlap. The final velocity fields are made-up of the two fields, one from each camera, stitched together, to provide a complete view around the cylinders. PIV measurements were conducted at two magnifications using different lenses. A 50 mm lens was used to image the entire flow field around the pair of cylinders, and in a separate experiment a 180 mm lens was used to specifically focus on the area between the two cylinders. The resulting PIV fields of view are represented schematically in figure 1.
Only minor adjustments to the set-up were needed to enhance the visibility of the surface texture. The surface texture measurement campaign was performed in order to provide a second method for identifying jammed regions in the flow. Here, an LED array covered by a semi transparent acrylic sheet served as the light source. The camera was positioned such that it captured the direct reflection of the light source in the suspension surface [31]. A rough surface, caused by dilation, diffuses the light reflected off the suspension surface and thus changes the observed intensity. As such a matte surface indicates that the suspension is jammed while a reflective surface indicates that the suspension is in a quiecent unjammed state [4, 7, 30, 31]. The size of the acrylic sheet ensured that the reflection in the suspension surface covered the field of view of the camera (Figure 1). In order to get as clear a view of the surface as possible, we did not seed the sample with tracer particles for this experiment.
III Results
Both the cylinders and the suspension start at rest. The cylinders are initially located at . Once cylinder movement is initiated, large velocity gradients are observed at the surface of each cylinder, which propagate into the surrounding suspension. At some point, depending on the speed of the front and the distance between the cylinders, , the fronts collide. By the end of an experimental run, the region between the two cylinders moves at approximately the perturbing speed. In addition to the velocity field (), we also present the strain rate magnitude () and the accumulated strain (). The strain rate magnitude is calculated as
| (2) |
The accumulated strain () is calculated as the norm of the Eulerian logarithmic strain tensor [38, 14]. This is estimated from the velocity field by first calculating the movement of the material points as , from which the deformation gradient tensor is acquired as . Here, is the position of the material points at . A polar decomposition of the deformation gradient () gives the left stretch tensor , which has eigenvalues and eigenvectors, and , respectively. The strain tensor has the spectral representation [38]
| (3) |
where we order eigenvalues , such that the direction of stretch and compression is denoted and , respectively. and are orthogonal. The norm of the strain tensor is used as a scalar measure of the accumulated strain.
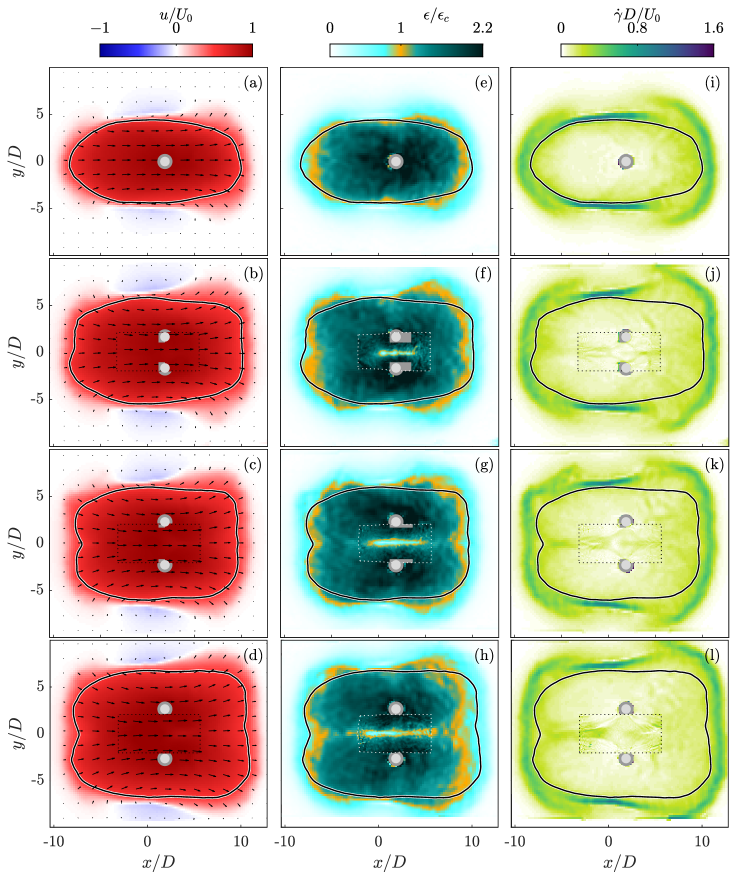
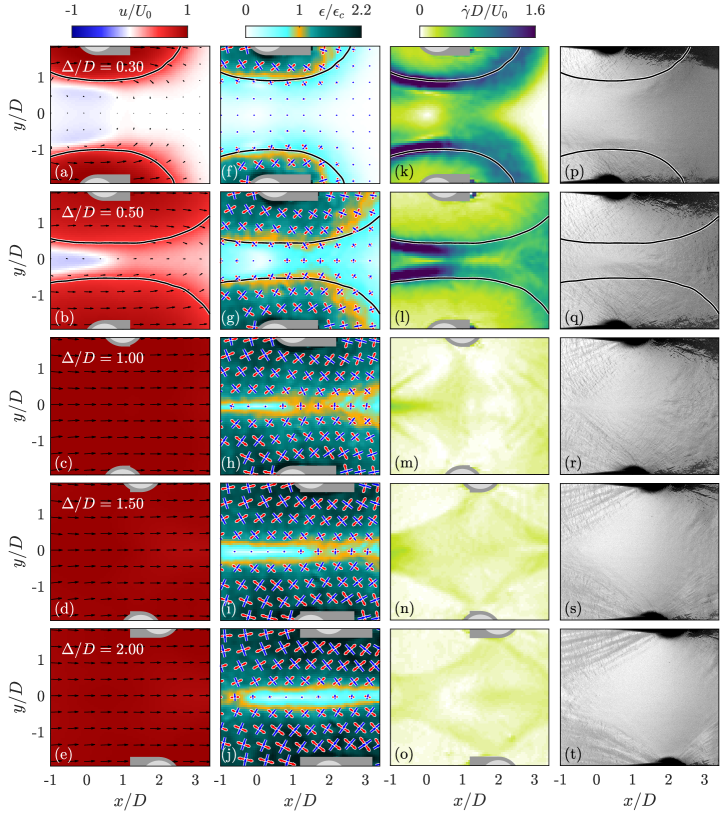
PIV results are presented in Fig. 2 which shows both the large and small fields of view at , which is close to the end of an experimental run. In particular we look at different cylinder separations () with the single cylinder case as a reference. The velocity vectors are plotted in figure 2a-2d, and the contour, typically used to identify the jamming front [8, 13, 11, 9, 12, 10, 16], is indicated by the black line in all fields. Some aspects of the system behaviour are independent of both the number of cylinders and their separation. Relative to the perturbing body, the front has propagated twice as fast in the longitudinal direction compared to the transverse direction. This 1:2 propagation relationship is a direct consequence of an underlying onset strain [9, 14], and does not change by introducing a second cylinder. A notable difference with the reference case, however, occurs in the collision region between the two cylinders. A uniform velocity field has in previous studies been used to indicate the jammed region [13, 9]. Here, the velocity fields in Figs. 2b-2d (seen in more detail in figure 3c-3e) might suggest a uniformly jammed suspension after the fronts have collided. Though the velocity is relatively uniform, the strain rate represented as in Figs. 2j-2l, show traces of a diamond-like structure in the collision region. The accumulated strain () reveals a slightly different picture. As seen in figures 2f-2h, indicates the presence of a slit of material that has not sufficiently deformed to transition into the jammed state. This suggests that there is a region between the two cylinders that is unjammed while the surrounding suspension is jammed.
Fig. 3 compares PIV data with the high speed imaging of the suspension surface texture. The texture measurements have no direct information about the velocity field. However, as the example shown here is at the same volume fraction, cylinder configuration and speed, the contour from the PIV data is superimposed on both PIV and texture images. At later stages in an experimental run (here, ), the contour lies outside of the field of view shown in figure 3. In the fields it can be seen that the contour corresponds to a strong shear front propagating away from the cylinders as the flow evolves. After the two fronts collide, the suspension moves with the cylinders as indicated by the uniform velocity field (Fig 3c-3e). The accumulated stain (figure 3f-3j) shows the development of the undeformed slit. Interestingly, the region between the two cylinders is populated by a diamond-like shape visible in both the shear rate magnitude (figure 3m-3o) and the surface texture images (figure 3r-3t). Based on the surface texture, we infer that the suspension between the cylinders, which appears to be reflective, has relaxed back to a quiescent, unstressed state. Thus confirming that indeed the region between the cylinders is unjammed.
From previous studies where the front propagates freely through the suspension, it has been shown that the accumulated strain can be used to quantify when the suspension transitions into a solid-like state. However, in the collision region, the strain does not account for the subsequent relaxation of the suspension revealed by the texture images. As a consequence, there is a discrepancy between the shape of the unjammed region revealed by the accumulated strain and the texture images. Traces of the diamond shape observed in the texture image exist in the strain rate. This is presented in figure 3. Though the accumulated strain () does not show a diamond shape as observed in the texture images, the eigenvectors of the strain tensor reveal an interesting feature. These eigenvector seem to roughly align with the boundary of the diamond shape (see figure 3f-3j).
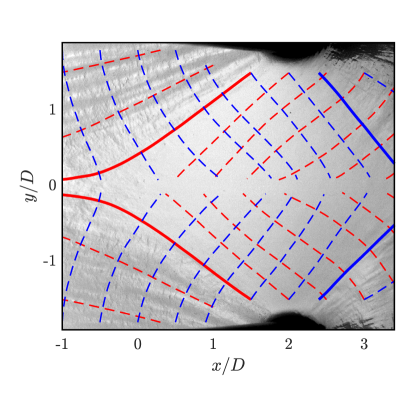
We further investigate the apparent discrepancy by plotting the lines of principle strain [14] superimposed on a texture image in figure 4. For an instantaneous strain field the principle strain lines are acquired numerically by solving for principle stretch and for principle compression, which ensures that the lines and are tangential to the eigenvectors and , respectively. is an arbitrary parametrization of the lines. Solving for and for multiple initial positions is presented in figure 4. We avoid the center slit when calculating and , as the accumulated strain is small in this region. Here we have highlighted the lines that roughly correspond to the diamond shape revealed by the texture image. Note that in the fore half plane, it is the compression line, , that outlines the diamond boundary, while in the aft half it is the stretch line, .
As discussed in the introduction, both the stress and the accumulated strain need to be sufficiently high to achieve (or remain in) a jammed state [15, 16]. The slit in the center revealed by the accumulated strain never transitions into a jammed state as the strain level is not sufficiently high. The subsequent relaxation of the surrounding diamond-shaped follows, as stresses are no longer transmitted through this region, revealed by the texture images.
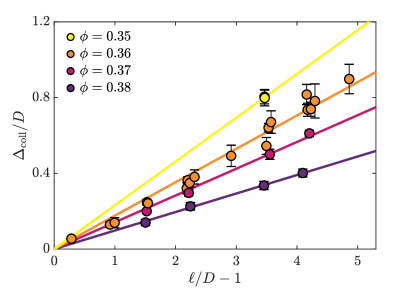
Additional PIV measurements at different volume fractions within the dynamic jamming range confirm the same qualitative behaviour. A slit of material between the two cylinders does not deform the amount expected for jamming to occur even though the velocity field appears uniform. With increasing volume fraction, the accumulated strain needed for the jamming transition to occur decreases, while the front propagates faster through the suspension [13, 11, 12]. This is summarized in Fig. 5 showing how the moment of collision of the jamming fronts varies with volume fraction () and cylinder separation (). We define the collision as the event when the jamming front transitions from separate contours around each cylinder to one contour enveloping both cylinders. This is quantified by the distance the cylinder has traveled from its starting point to when collision occurs (). The lines are a guide for the eye, but a linear trend is evident. The points are expected to fall onto a straight line as long as the relation between front and cylinder movement is constant, which Fig. 5 confirms.
IV Conclusions
We have presented the first observations of colliding jamming fronts. These fronts were generated by two cylinders moving in unison, and PIV has been used to calculate the velocity and deformation fields. The suspension between the cylinders moves uniformly after front collision. High speed observations of the free surface texture show that after collision a diamond-like region is formed between the cylinders which relaxes back to its quiescent, unjammed state. The accumulated strain does not portray this diamond shaped region. However, we show that the edges of the diamond shape revealed by the texture images align with the direction of principle strain. We attribute this apparent discrepancy between the two approaches to the fact that the accumulated strain does not account for the relaxation of the suspension.
Although the region between the cylinders appears unjammed, there still must be a force-bearing structure connected to the two cylinders to drive the jamming front that continues to propagate through the suspension away from the bodies. This structure would effectively be protecting the region between the cylinders, allowing it to remain unjammed, and has a diamond-shape in the present configuration. By utilizing a combination of PIV and surface texture measurements we have thus identified the phenomena associated with colliding jamming fronts. Surprisingly, our results reveal that colliding jamming fronts unjam a region between the perturbing bodies, providing a new way geometry can be used to control where jamming occurs and where it does not.
Acknowledgements.
RJH acknowledges the financial support of the Research Council of Norway (Grant No. 288046). IRP acknowledges financial support from the Royal Society (Grant No. RG160089). Data supporting this study are openly available from the University of Southampton repository (DOI to be provided).References
- Wyart and Cates [2014] M. Wyart and M. E. Cates, Discontinuous shear thickening without inertia in dense non-brownian suspensions, Phys. Rev. Lett. 112, 098302 (2014).
- Barnes [1989] H. A. Barnes, Shear‐thickening (“dilatancy”) in suspensions of nonaggregating solid particles dispersed in newtonian liquids, Journal of Rheology 33, 329 (1989), https://doi.org/10.1122/1.550017 .
- Seto et al. [2013] R. Seto, R. Mari, J. F. Morris, and M. M. Denn, Discontinuous shear thickening of frictional hard-sphere suspensions, Phys. Rev. Lett. 111, 218301 (2013).
- Brown and Jaeger [2012] E. Brown and H. M. Jaeger, The role of dilation and confining stresses in shear thickening of dense suspensions, Journal of Rheology 56, 875 (2012), https://doi.org/10.1122/1.4709423 .
- Liu and Nagel [1998] A. J. Liu and S. R. Nagel, Jamming is not just cool any more, Nature (London) 396, 21 (1998).
- Liu and Nagel [2010] A. J. Liu and S. R. Nagel, The jamming transition and the marginally jammed solid, Annual Review of Condensed Matter Physics 1, 347 (2010), https://doi.org/10.1146/annurev-conmatphys-070909-104045 .
- Brown and Jaeger [2014] E. Brown and H. M. Jaeger, Shear thickening in concentrated suspensions: phenomenology, mechanisms and relations to jamming, Reports on Progress in Physics 77, 046602 (2014).
- Waitukaitis and Jaeger [2012] S. R. Waitukaitis and H. M. Jaeger, Impact-activated solidification of dense suspensions via dynamic jamming fronts, Nature 487, 205 (2012).
- Han et al. [2016] E. Han, I. R. Peters, and H. M. Jaeger, High-speed ultrasound imaging in dense suspensions reveals impact-activated solidification due to dynamic shear jamming, Nature Communications 7, 10.1038/ncomms12243 (2016).
- Han et al. [2019a] E. Han, L. Zhao, N. Van Ha, S. T. Hsieh, D. B. Szyld, and H. M. Jaeger, Dynamic jamming of dense suspensions under tilted impact, Phys. Rev. Fluids 4, 063304 (2019a).
- Peters et al. [2016] I. R. Peters, S. Majumdar, and H. M. Jaeger, Direct observation of dynamic shear jamming in dense suspensions., Nature 532, 214 (2016).
- Han et al. [2018] E. Han, M. Wyart, I. R. Peters, and H. M. Jaeger, Shear fronts in shear-thickening suspensions, Phys. Rev. Fluids 3, 073301 (2018).
- Peters and Jaeger [2014] I. R. Peters and H. M. Jaeger, Quasi-2d dynamic jamming in cornstarch suspensions: visualization and force measurements, Soft Matter 10, 6564 (2014).
- Rømcke et al. [2021] O. Rømcke, I. R. Peters, and R. J. Hearst, Getting jammed in all directions: Dynamic shear jamming around a cylinder towed through a dense suspension (2021), arXiv:2004.01576 .
- Baumgarten and Kamrin [2019] A. S. Baumgarten and K. Kamrin, A general constitutive model for dense, fine-particle suspensions validated in many geometries, Proceedings of the National Academy of Sciences 116, 20828 (2019), https://www.pnas.org/content/116/42/20828.full.pdf .
- Han et al. [2019b] E. Han, N. M. James, and H. M. Jaeger, Stress controlled rheology of dense suspensions using transient flows, Phys. Rev. Lett. 123, 248002 (2019b).
- Fall et al. [2012] A. Fall, F. Bertrand, G. Ovarlez, and D. Bonn, Shear thickening of cornstarch suspensions, Journal of Rheology 56, 575 (2012), https://doi.org/10.1122/1.3696875 .
- Hermes et al. [2016] M. Hermes, M. Guy, W. C. K. Poon, G. Poy, M. E. Cates, and M. Wyart, Unsteady flow and particle migration in dense, non-brownian suspensions, J. Rheol 60, https://doi.org/10.17863/CAM.225 (2016).
- Maharjan and Brown [2017] R. Maharjan and E. Brown, Giant deviation of a relaxation time from generalized newtonian theory in discontinuous shear thickening suspensions, Phys. Rev. Fluids 2, 123301 (2017).
- Mari et al. [2014] R. Mari, R. Seto, J. F. Morris, and M. M. Denn, Shear thickening, frictionless and frictional rheologies in non-brownian suspensions, Journal of Rheology 58, 1693 (2014), https://doi.org/10.1122/1.4890747 .
- Pan et al. [2015] Z. Pan, H. de Cagny, B. Weber, and D. Bonn, -shaped flow curves of shear thickening suspensions: Direct observation of frictional rheology, Phys. Rev. E 92, 032202 (2015).
- James et al. [2018] N. M. James, E. Han, R. A. L. de la Cruz, J. Jureller, and H. M. Jaeger, Interparticle hydrogen bonding can elicit shear jamming in dense suspensions, Nature materials 17, 965 (2018).
- Guy et al. [2015] B. M. Guy, M. Hermes, and W. C. K. Poon, Towards a unified description of the rheology of hard-particle suspensions, Phys. Rev. Lett. 115, 088304 (2015).
- Singh et al. [2018] A. Singh, R. Mari, M. M. Denn, and J. F. Morris, A constitutive model for simple shear of dense frictional suspensions, Journal of Rheology 62, 457 (2018), https://doi.org/10.1122/1.4999237 .
- Brown et al. [2011] E. Brown, H. Zhang, N. A. Forman, B. W. Maynor, D. E. Betts, J. M. DeSimone, and H. M. Jaeger, Shear thickening and jamming in densely packed suspensions of different particle shapes, Phys. Rev. E 84, 031408 (2011).
- James et al. [2019] N. M. James, H. Xue, M. Goyal, and H. M. Jaeger, Controlling shear jamming in dense suspensions via the particle aspect ratio, Soft Matter 15, 3649 (2019).
- Guy et al. [2020] B. M. Guy, C. Ness, M. Hermes, L. J. Sawiak, J. Sun, and W. C. K. Poon, Testing the wyart–cates model for non-brownian shear thickening using bidisperse suspensions, Soft Matter 16, 229 (2020).
- Majumdar et al. [2017] S. Majumdar, I. R. Peters, E. Han, and H. M. Jaeger, Dynamic shear jamming in dense granular suspensions under extension, Phys. Rev. E 95, 012603 (2017).
- Peters et al. [2015] I. R. Peters, J. M. Amundson, R. Cassotto, M. Fahnestock, K. N. Darnell, M. Truffer, and W. W. Zhang, Dynamic jamming of iceberg-choked fjords, Geophysical Research Letters 42, 1122 (2015), https://agupubs.onlinelibrary.wiley.com/doi/pdf/10.1002/2014GL062715 .
- Jerome et al. [2016] J. J. S. Jerome, N. Vandenberghe, and Y. Forterre, Unifying impacts in granular matter from quicksand to cornstarch, Phys. Rev. Lett. 117, 098003 (2016).
- Maharjan et al. [2021] R. Maharjan, E. O’Reilly, T. Postiglione, N. Klimenko, and E. Brown, Relation between dilation and stress fluctuations in discontinuous shear thickening suspensions, Phys. Rev. E 103, 012603 (2021).
- Bischoff White et al. [2010] E. E. Bischoff White, M. Chellamuthu, and J. P. Rothstein, Extensional rheology of a shear-thickening cornstarch and water suspension, Rheologica acta 49, 119 (2010).
- Smith et al. [2010] M. Smith, R. Besseling, M. Cates, and V. Bertola, Dilatancy in the flow and fracture of stretched colloidal suspensions, Nature communications 1, 114 (2010).
- Roché et al. [2013] M. Roché, E. Myftiu, M. C. Johnston, P. Kim, and H. A. Stone, Dynamic fracture of nonglassy suspensions, Phys. Rev. Lett. 110, 148304 (2013).
- Allen et al. [2018] B. Allen, B. Sokol, S. Mukhopadhyay, R. Maharjan, and E. Brown, System-spanning dynamically jammed region in response to impact of cornstarch and water suspensions, Phys. Rev. E 97, 052603 (2018).
- Garside and Al-Dibouni [1977] J. Garside and M. R. Al-Dibouni, Velocity-voidage relationships for fluidization and sedimentation in solid-liquid systems, Industrial & Engineering Chemistry Process Design and Development 16, 206 (1977), https://doi.org/10.1021/i260062a008 .
- Richardson and Zaki [1997] J. Richardson and W. Zaki, Sedimentation and fluidisation: part 1, Chemical Engineering Research & Design 75, S82 (1997).
- Nemat-Nasser [2004] S. Nemat-Nasser, Plasticity : a treatise on finite deformation of heterogeneous inelastic materials (2004).