Rapid interrogation of special nuclear materials by combining scattering and transmission nuclear resonance fluorescence spectroscopy
Abstract
The smuggling of special nuclear materials (SNMs) across national borders is becoming a serious threat to nuclear nonproliferation. This paper presents a feasibility study on the rapid interrogation of concealed SNMs by combining scattering and transmission nuclear resonance fluorescence (sNRF and tNRF) spectroscopy. In sNRF spectroscopy, SNMs such as 235,238U are excited by a wide-band photon beam of appropriate energy and exhibit unique NRF signatures. Monte Carlo simulations show that one-dimensional scans can realize isotopic identification of concealed 235,238U when the detector array used for interrogation has sufficiently high energy resolution. The simulated isotopic ratio is in good agreement with the theoretical value when the SNMs are enclosed in relatively thin iron. This interrogation is followed by tNRF spectroscopy using a narrow-band photon beam with the goal of obtaining tomographic images of the concealed SNMs. The reconstructed image clearly reveals the position of the isotope 235U inside an iron rod. It is shown that the interrogation time of sNRF and tNRF spectroscopy is one order of magnitude lower than that when only tNRF spectroscopy is used and results in a missed-detection rate of 10-3. The proposed method can also be applied for isotopic imaging of other SNMs such as 239,240Pu and 237Np.
I Introduction
The smuggling of special nuclear materials (SNMs) across borders and through ports of entry is one of the greatest threats to global security. The Incident Trafficking Database, which was developed by the International Atomic Energy Agency to record incidents of illicit trafficking in nuclear and other radioactive materials, was notified of several hundred incidents that involved the deliberate trafficking or malicious use of certain nuclear and radioactive materials iaeainicdents . Previous studies have illustrated how these materials, if obtained in sufficient quantities by actors such as terrorist groups, could cause significant death, destruction, and disruption ferguson2005four . To reduce this threat to homeland security, efforts have been made to develop accurate, effective, and practical ways to interrogate SNMs, especially uranium and plutonium.
Passive detection systems, which exploit the rays and/or neutrons naturally emitted from radioactive isotopes, can be easily deployed to identify SNMs by delivering a low radiation dose to the inspected target kouzes2008passive ; cester2012special . However, this detection method may be inapplicable when the interrogated object is shielded, because the intensity and energy of the spontaneous radiation are fairly low in most cases. Therefore, the inspection of SNMs requires active detection techniques that utilize external radiation sources such as muons thomay2013binned ; guardincerri2015detecting ; baesso2012high ; pan2019experimental , neutrons slaughter2003detection ; norman2003signatures ; huang2019study ; paff2014gamma ; huang2019element , and photons mueller2014novel ; zier2014high ; henderson2018experimental . However, active interrogation systems using cosmic-ray muons generally require long data acquisition times and large detection systems, and those using photon-/neutron-induced fission face measurement challenges arising from the high background of intense interrogating radiation.
Recently, nondestructive detection methods based on nuclear resonance fluorescence (NRF) have been proposed in the context of industrial applications Lan2021 ; Beck1998 ; Hajima2009 ; Habs2011 ; yu2019ultrafast ; hayakawa2009nondestructive ; toyokawa2011nondestructive as well as nuclear safeguards zkproof1 ; zkproof2 . NRF is the process of resonant excitation of nuclear levels of an isotope of interest by the absorption of electromagnetic radiation and subsequent decay of these levels by photon emission. Because the resonant energies are unique to an isotope, the emitted photons can be used as signatures for isotope identification. In addition, -ray beams generated by laser Compton scattering (LCS), which have been used for research on nuclear physics Utsunomiya2019 ; Ur2016 and nuclear astrophysics Lan2018 as well as industrial and medical applications Zhu2016 ; Irani2014 ; luo2016estimates ; luo2016data ; luo2016production ; artun2018investigation , have excellent characteristics such as good directivity, a narrow-band spectrum, energy tunability, and moderate/high intensity. Owing to these unique features, the LCS -ray beam is regarded as a good candidate to excite NRF and thus to interrogate SNMs. Previous studies daito2016simulation ; SULIMAN2016 ; zen2019demonstration ; ali2020selective have proposed an effective method, namely, transmission-NRF-based computed tomography (tNRF-CT), for tomographic imaging of high-density and high- objects.
However, tNRF-CT relies on a narrow-band beam with suitable energy for accurate evaluation of the attenuation factors associated with both atomic processes and NRF interactions. Without prior isotope identification, it seems difficult and time-consuming to interrogate SNMs with multiple nuclei and isotopes by scanning the beam energy and thus checking for every suspicious nuclear species.
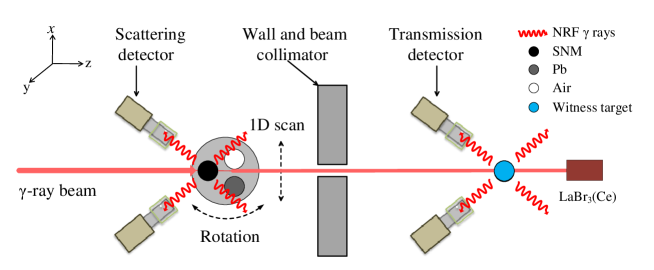
In this paper, we propose combining scattering NRF (sNRF) and tNRF spectroscopy to rapidly realize isotope identification and tomographic imaging of SNMs such as 235,238U. A schematic illustration of the proposed method is shown in Fig. 1. In sNRF spectroscopy, a one-dimensional (1D) scan is performed using a wide-band -ray beam that covers exactly the principal resonant energies of 235,238U. From the sNRF spectra, one can determine whether 235U and/or 238U is present in the interrogated object. Moreover, the sNRF yields can be used to deduce the isotopic ratio of 235U to 238U. We then perform tNRF spectroscopy on the isotope of interest (235U or 238U), acquiring a CT image of the interrogated object using a narrow-band -ray beam covering exactly the resonant energy of a specific isotope. Simulations show that the presence of the 235,238U isotopes and the ratio are readily revealed by sNRF spectroscopy with high significance in a reasonable time. The tNRF-CT technique provides a tomographic image of a 235U rod, lead rod, and air column wrapped in an iron shield. The combination of sNRF and tNRF spectroscopy can provide knowledge of not only the isotopic composition but also the spatial distribution of SNMs. The results show that it can shorten the interrogation time by one order of magnitude owing to the strong response of SNMs to sNRF spectroscopy. In addition, the feasibility of isotopic imaging of other SNMs (239,240Pu and 237Np) is discussed considering the attenuation factor of the on-resonance photon beam.
II Methods
II.1 NRF principle
| SNM | (keV) | (meV) | (meV) | (eVb) | Zilges zilges1995strong | Kwan kwan2011discrete |
|---|---|---|---|---|---|---|
| 235U | 1734 | N/A | 17(3) | 21.7(38) | N/A | 22(4) |
| 235U | 1815 | N/A | 7.7(9) | 8.9(11) | N/A | 8.9(11) |
| 238U | 1782 | 13.8(17) | N/A | 20.9(25) | 21.9(25) | N/A |
| 238U | 1793 | 5.7(14) | N/A | 4.6(12) | 5.1(10) | N/A |
| 238U | 1846 | 14.7(19) | N/A | 21.8(28) | 23.0(26) | N/A |
The NRF cross section for absorption via the resonant energy level can be expressed by the Breit–Wigner distribution Franz1959 :
| (1) |
where is the width of the level at , is the partial width for transitions between and the ground state, is the Planck constant, and is speed of light.
In practice, the NRF cross section should be calculated taking into account Doppler broadening. If the true Voigt profile is approximated as a Gaussian profile, Eq. 1 then becomes ogawa2016development
| (2) |
Here = is the Doppler width, is the Boltzmann constant, is the absolute temperature, and is the mass number of the nucleus. According to Eq. 2, one can calculate the integrated NRF cross section for 235U and 238U. As shown in Table 1, the values are consistent with experimental data for 235U and 238U zilges1995strong ; kwan2011discrete . The NRF lines at 1734 keV (235U) and 1782 keV (238U) have NRF cross sections of 22.0 and 21.9 eVb, respectively. Considering their relatively large values, these two separate NRF lines are priorities for the identification of uranium, which is selected as a typical SNM here.
Because of conservation of energy and momentum, a free nucleus undergoing NRF will recoil with kinetic energy , which is determined by the Compton-like formula
| (3) |
where is the scattering angle of the photon relative to its incident direction.
NRF is generally considered to occur only between states that differ by two or fewer units of angular momentum. The angular distribution of NRF rays is analogous to that of -ray cascades. For an NRF interaction of transitions , where and are the multipole orders of excitation and de-excitation, respectively, the angular distribution can be written as Fagg1959
| (4) |
where is the Legendre polynomial expansion, and is given by
| (5) |
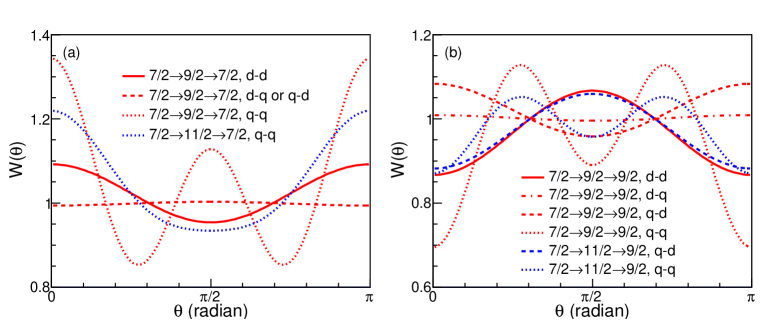
where and are constants that depend on the spin states of the transitions and photon multipolarities Siegbahn1965 . For the resonant state at 1782 keV (238U), the NRF follows a transition sequence of 0 1 0, whose angular correlation can be expressed as . By contrast, at 1734 keV (235U), depends on the spin, = 9/2 or 11/2. Because this state can de-excite to the first excited state and ground state of 235U, several multipolarity combinations are obtained according to the spin selection rule (see Fig. 2). However, it is still impossible to obtain an exact expression of because their mixing ratios remain unknown. For simplicity, we employ an isotropic for NRF -ray emissions in the simulations. In fact, a non-isotropic angular distribution would contribute at most a 10% fluctuation to the NRF yields in our configuration (see Fig. 1). More details are given in Sec. IV.
II.2 Scattering NRF spectroscopy
To realize SNM identification and isotope ratio prediction, 1D sNRF spectroscopy is applied. As shown in Fig. 1, a quasi-monochromatic -ray beam impinges on the target to be interrogated, causing resonant (NRF) and non-resonant (Compton scattering, pair production, and photoelectric absorption) interactions. The backscattered NRF rays are measured by four high-purity germanium (HPGe) detectors (scattering detectors) located at 135∘ from the beam direction in order to take advantage of the decreasing intensity of non-resonantly backscattered radiation. The horizontal position () is varied from -15 to 15 mm in eight steps of 3.75 mm each. A total of eight sNRF -ray spectra are obtained.
In sNRF spectroscopy, one can use the NRF cross section and angular distribution to construct a semi-analytical expression for the expected NRF counts. For a photon beam of incident flux interacting with the target, a small part of the photon flux near the resonant energy will undergo resonant (NRF) and non-resonant (atomic) interactions. The resulting NRF yield then produces a double-differential rate of NRF detections in the infinitesimal solid angle ,
| (6) |
where and are the energy of the incident photons and scattered NRF photons, respectively; is the thickness of the irradiated target; is the intrinsic photopeak detection efficiency; denotes the linear attenuation coefficient, with being the number density of interrogated isotopes; and is the effective attenuation coefficient, which is given by
| (7) |
Here and are the non-resonant attenuation coefficients of the incident photons and NRF photons, respectively.
II.3 Transmission NRF spectroscopy
After sNRF spectroscopy is performed, a tNRF-CT technique is applied to perform tomographic imaging (see Fig. 1). The flux of the -ray beam transmitted through the target is preferentially attenuated (notched Pruet2006Detecting ) around the resonant energy because the NRF cross section is much larger than those of the non-resonant interactions. This notched -ray beam further impinges on a witness target composed of suspicious isotopes so that the remaining rays may undergo NRF in the witness target. Another array of four HPGe detectors (transmission detectors) are located at 135∘ to record the NRF photons produced at this stage. The resonant attenuation inside the interrogated object is then evaluated. The rays transmitted through the witness target are diagnosed by a LaBr3(Ce) detector to evaluate the non-resonant attenuation. To obtain the CT images, the interrogated object is translated horizontally () from -15 to 15 mm (with a step length of 3.75 mm) and rotated (by ) from 0 to 180∘ (with a step length of 22.5∘); consequently, a total of 64 sets of spectra are obtained. In addition, a set of spectra without the interrogated object is obtained.
| (mm) | 235U | 238U | ||||
|---|---|---|---|---|---|---|
| 1.8 | 920 30 | 1518 50 | 510 23 | 281 12 | 1798 52 | 1825 43 |
| -1.8 | 918 30 | 1514 50 | 507 23 | 279 12 | 1793 51 | 1821 43 |
| (mm) | |||||
|---|---|---|---|---|---|
| 0.43 | 1.8 | 376 19 | 1634 40 | 1500 39 | 0.43 0.09 |
| -1.8 | 378 19 | 1656 41 | 1424 38 | 0.42 0.09 | |
| 1.00 | 1.8 | 604 25 | 1345 37 | 1573 40 | 0.83 0.18 |
| -1.8 | 579 24 | 1278 36 | 1626 40 | 0.84 0.19 | |
| 4.00 | 1.8 | 920 30 | 510 23 | 1825 43 | 3.28 0.73 |
| -1.8 | 918 30 | 507 23 | 1821 43 | 3.27 0.73 |
The attenuation factor of on-resonance rays at (, ) can be expressed as
| (8) |
where is the average mass attenuation coefficient of the CT target (i.e., the interrogated target) on the incident beam path, and is the diameter of the CT target. is the NRF reaction cross section of the isotope of interest, and is the isotope number density on the -ray incident path. For the off-resonance rays, is negligible; thus, the attenuation factor of the off-resonance rays is
| (9) |
The NRF resonant attenuation factor at (,) can be derived as follows zen2019demonstration :
| (10) |
where ) and ) are the attenuation factors of the on-resonance and off-resonance rays, respectively. and denote the NRF yields recorded by the transmission detectors with and without the CT target, respectively. and are the integration yields of the spectral region of interest (ROI) recorded by the LaBr3(Ce) detector with and without the CT target, respectively. Note that is an approximate estimate of the atomic attenuation effect of on-resonance rays in Eq. 10 when a narrow-band -ray beam is used. Consequently, the NRF attenuation factor depends only on , which is required to reconstruct the CT images of SNMs.
II.4 Simulation algorithm
To model the NRF process in this study, we developed a new class, G4NRF, in the Geant4 toolkit G41 ; Luo2017 . The pure virtual method G4VUserPhysicslist::ConstructProcess() was implemented in the simulation, and the method AddDiscreteProcess() was used to register the NRF process. Introducing a customized NRF process into the simulation requires the implementation of two features. First, the cross sections for the interaction must be provided; second, the final state resulting from the interaction must be determined. A series of NRF cross sections was calculated using Eq. 2. Information on the final states was obtained using Eq. 4. The transitions to the ground states and first excited states of 235,238U are considered. The HPGe detectors have an energy resolution of 0.1% (RMS), which can be achieved using present detector technology. The Ge crystals are 10 cm in diameter and 10 cm in length. The full-energy peak efficiency of each HPGe detector was also simulated with the Geant4 toolkit.
III Results
III.1 Isotope identification by sNRF signature
In sNRF spectroscopy, the target is irradiated by a photon beam with a Gaussian energy distribution [centroid energy of 1.76 MeV and energy spread of 3% in standard deviation (SD)] and a photon intensity of 1010 photons per second, which can be readily delivered by a state-of-the-art LCS -ray source Weller2015 ; tanaka2020current . Among the eight energy spectra obtained in the 1D scan, the sNRF signatures at 1687 keV (235U), 1734 keV (235U), 1737 keV (238U), and 1782 keV (238U) appear only in the spectra obtained at = 1.8 and -1.8 mm. The presence of these sNRF signatures gives a preliminary estimate of the SNM isotopic composition of the interrogated target. This result can potentially reveal a 1D map of SNM isotopes, as reported in the literature kikuzawa2009nondestructive ; toyokawa2011two . Moreover, these sNRF signatures can potentially be used for the tomographic imaging of multiple isotopes, which is an interesting issue to study.
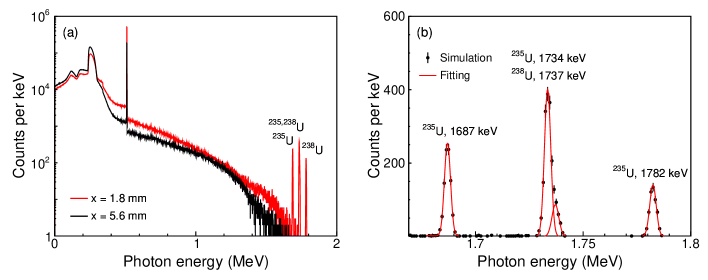
Fig. 3 shows typical energy spectra of rays recorded by the scattering detectors at scan points of = 1.8 and 5.6 mm. The NRF signals are simultaneously observed in the former and disappear in the latter. The NRF -ray peak at 1687 keV is caused by the transition from the resonant state of 235U at 1734 keV to the 9/2- excited state at 46 keV. The peak near 1734 keV is caused by the transition from the 1734 keV level in 235U to the ground state and the transition from the 1782 keV state in 238U to the first excited state at 45 keV (with photon emission at 1737 keV). Note that these two closely spaced NRF lines cannot be well discriminated owing to spectral broadening resulting from imperfect detector resolution. The NRF peaks at 1687, 1734 (or 1737), and 1782 keV are then fitted with four Gaussian distributions on top of an exponentially decaying continuum background. The fitting function for these NRF peaks is written as
| (11) |
where and describe the shape of the background, and , , and are the area, mean, and SD fit parameters of the peak. The fitting curve is shown in Fig. 3 (b). The corresponding NRF yields, , , and , were obtained. Because the branching ratio (denoted as ) of the 1734 keV transition to the 1687 keV transition is 100:60(20), the NRF yield for the 1734 keV transition was further deduced as . Similarly, the yield for the 1737 keV transition, , was also deduced. Moreover, the NRF yield for the overlapping peak near 1734 keV was estimated as =, as shown in Table 2. The extracted values agree well with , indicating that the effect of branching ratios was implemented appropriately in our simulations. The significance of the sNRF signals of 235U can be expressed in units of as = , where is the NRF peak yield, and is the corresponding statistical error. The result shows that a peak significance of = 48.9 can be obtained within an sNRF scan time of = 8 s.
The isotope ratio of 235U to 238U, , is related to the NRF yield ratio, , by the following equation:
| (12) |
where is the peak yield ratio, and is the ratio of the incident -ray intensity. is the detection efficiency ratio of the HPGe detector calculated using the MCLCSS code luo20114d in Geant4. is the ratio of the absolute branching ratios. is given by Eq. 2. is the angular momentum ratio of 238U and 235U NRF emission Fagg1959 . According to Eq. 12, the abundance ratios of at = 1.8 and -1.8 mm for three 235U enrichments were calculated on the basis of the NRF yields at 1687 and 1782 keV, as shown in Table 3. The predicted isotope ratios are consistent with the theoretical values within the uncertainty. Note, however, that the attenuation of rays with different energies as they penetrate the wrapping materials should be considered in Eq. 12 to improve the effectiveness of the isotope ratio prediction for thicker shielding.
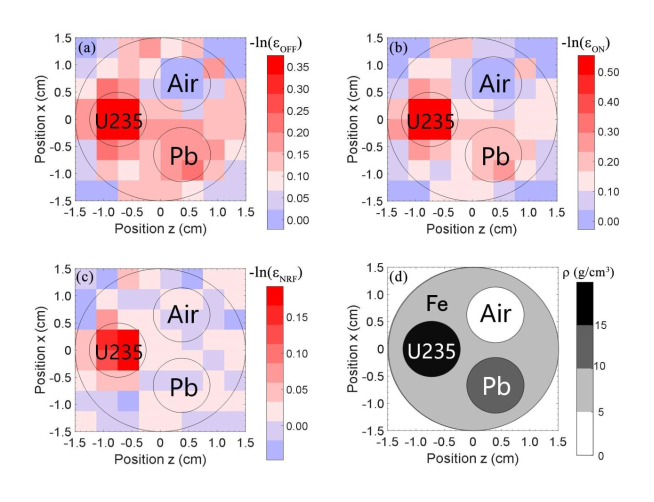
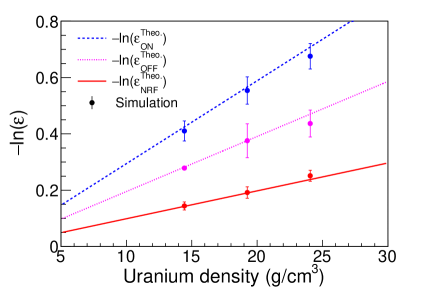
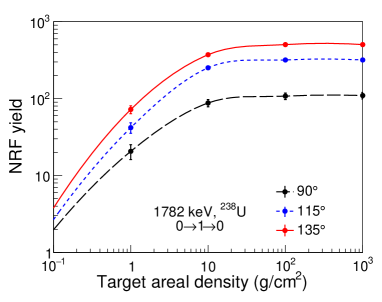
Fig. 4 shows the simulated NRF yields of the 1782 keV line when the HPGe detectors are located at angles of 90∘, 115∘, and 135∘. It is shown that the NRF yields increase with detection angle because the value for the 1782 keV line at 135∘ is larger than those at the other two angles. Consequently, a detection angle of 135∘ is employed in our study (see Fig. 1).
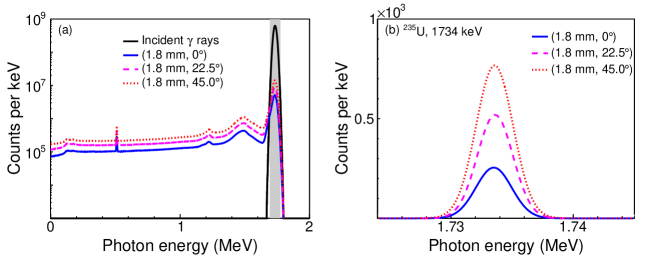
III.2 Tomographic imaging using tNRF signature
In tNRF imaging, the uranium rod is ideally assumed to be composed of pure 235U, and its default density is set to 19 g/cm3 to reduce the computational requirements. The interrogating -ray beam has a Gaussian distribution (a centroid energy of 1734 keV and an energy spread of 1% in SD) and a photon intensity of 1010 photons per second. Fig. 5 shows typical spectra obtained by the transmission detectors and LaBr3(Ce) detectors at measurement points of (1.8 mm, 0∘), (1.8 mm, 22.5∘), and (1.8 mm, 45∘), where the uranium rod, lead rod, and air rod, respectively, are in the path of the interrogating -ray beam. As shown in Fig. 5 (a), the energy spectra recorded by the LaBr3(Ce) detector are different because they depend on the atomic attenuation coefficients of the penetrated materials. The 1734 keV peak intensity recorded by the HPGe detectors at the scan point (1.8 mm, 0∘) is significantly lower than those at the other two scan points. The reason is that the intensity of the -ray beam transmitted through the CT target decreases with owing to strong resonant absorption.
As mentioned above, 65 sets of spectra were obtained. On the basis of the NRF peak yields at 1687 and 1734 keV, the values for these scan points are obtained. Similarly, the values of are obtained on the basis of the integration of the spectral ROI recorded by the LaBr3(Ce) detector [see Fig. 5 (a)]. These extracted values are further incorporated into the simultaneous algebraic reconstruction techniques (SART) algorithm andersen1984simultaneous , which is suitable for the reconstruction of high-quality images with limited observation angles. Fig. 6 shows images of , , and reconstructed by SART. The values decrease with the density of the materials; this behavior is similar to that of a conventional X-ray CT image. In addition, the signal of the uranium rod is clearly enhanced in the image, although the lead rod and air rod are still visible. In the image, the signals produced by the air and lead rod do not appear, and the contrast of the uranium rod is higher than that in the image. These results demonstrate that the tNRF imaging method can be used to spatially discriminate a suspicious SNM isotope. The significance of the tNRF signals of 235U can be expressed in units of as = , where and are the average value of four pixels in the uranium rod region and that of the remaining pixels, respectively. A tNRF imaging time of 65 s is expected to yield a significance of = 8.0. This relatively long time is correlated with the photon flux, SNM concentration, and weak response of tNRF imaging to SNMs.
| Isotope | (keV) | (keV) | (%) | (eVb) | Ratio | Imaging Feasibility | |||||
|---|---|---|---|---|---|---|---|---|---|---|---|
| 235U | 1734 |
|
|
21.7 | 1.88 | 1.0 | feasible | ||||
| 238U | 2468 | 2468 | 100 | 90.9 | 5.59 | 3.0 | feasible | ||||
| 239Pu | 2040 | 2040 | 100 | 8.0 | 0.60 | 0.3 | questionable | ||||
| 240Pu | 2152 | 2152 | 100 | 34.4 | 2.46 | 1.3 | feasible | ||||
| 237Np | 1729 | 1729 | 100 | 10.6 | 0.92 | 0.5 | questionable |
To evaluate the dependence of the attenuation factors on SNM density, we reconstructed CT images of 235U at artificial target densities of 14, 19, and 24 cm3. Reconstructed images similar to those in Fig. 6 were obtained. The average , , and values over the uranium rod region were then extracted, as shown in Fig. 7. One can see that the extracted values increase with increasing 235U density, which is consistent with the theoretical predictions. Subsequently, using Eq. 10, we also calculated the values of tNRF images of the SNMs 238U, 239,240Pu, and 237Np (see Table LABEL:t1). The expected values for 238U (2468 keV) and 240Pu (2152 keV) are significantly larger than that for 235U (1734 keV), indicating excellent potential for the use of tNRF-CT for these SNMs. However, the values for 239Pu and 237Np are smaller than that for 235U. This result suggests that the interrogations of both 239Pu and 237Np are questionable; a higher beam flux or longer imaging time would be required to obtain better results.
IV Discussion
In SNM interrogation, two errors can occur: a false alarm, where the test indicates that the SNM is present when in fact the “all clear” hypothesis is correct, and a missed detection, where the test shows “all clear” but the SNM is in fact present. We attempt to demonstrate the scientific justification of our proposed method by comparing it with the use of the tNRF method alone in the context of balancing the measurement time and the missed-detection rate in an SNM interrogation.
as a function of sNRF scan time can be expressed as = , considering only the statistical fluctuation because the background is negligible. Similarly, for a tNRF imaging time can be given as = . To determine whether an interrogated object contains 235U, the decision rule is to alarm if or exceeds a test threshold . The missed-detection rates are easily obtained using and as = and = . Here is the cumulative distribution function of a normal distribution centered at zero with variance unity zkproof1 . Here, because the sNRF and tNRF methods are both used, the missed-detection rate can be bounded as
| (13) |
where is the total interrogation time for both sNRF scanning and tNRF imaging. In addition, is given by = + .
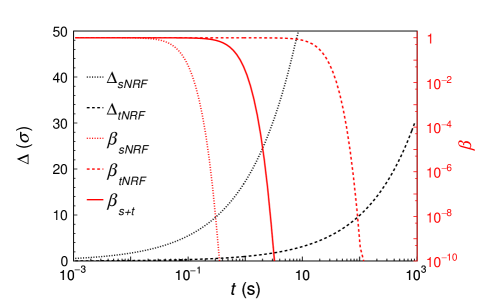
Fig. 8 shows the expected as a function of time when the tNRF method alone, the sNRF method alone, and sNRF plus tNRF are used. When only tNRF is used, an interrogation time of 53 s is required to reach = 10-3. This result indicates that all objects containing 235U can be detected with greater than 99.9% probability in a 53 s interrogation. In practice, an important issue would be to achieve a low missed-detection rate with a shorter interrogation time. In addition, although the use of the sNRF method alone does not afford imaging capability, it requires much less time to reach the same value. Thus, the combination of sNRF scanning and tNRF imaging is considered in our study to address this shortcoming. This combination yields a missed-detection rate of 10-3 within an interrogation time of 1.5 s, which is one order of magnitude lower than that when only tNRF imaging is used.
We performed additional simulations to evaluate the influence of on the sNRF yields because the excitation and de-excitation of the 1734 keV state of 235U are affected by spin selection uncertainty and mixing ratio unavailability. In the simulations, the non-uniform distributions of obtained from the transition sequences 7/2 9/2 7/2, q-q and 7/2 9/2 9/2, q-q (see Fig. 2) are applied. It is found that the NRF yield increases by a factor of 1.1, and decreases by a factor of 0.9. Thus, the extracted NRF yields do not differ significantly from those obtained considering an isotropic .
V Conclusion
The interrogation of SNMs is an essential technique to prevent global nuclear proliferation. In this work, we combined sNRF and tNRF spectroscopy to achieve the rapid identification and tomographic imaging of SNMs. It was shown that the isotopic composition of 235,238U and their isotope ratio can be determined from the photon emission of the resonant states at 1734 and 1782 keV using sNRF scanning. The spatial distribution of 235U concealed in a 3-cm-diameter iron rod can be well visualized using tNRF imaging. We conclude that the combination of sNRF scanning with tNRF imaging has the advantage of achieving a significantly lower missed-detection rate within a realistic interrogation time compared to that obtained using only tNRF spectroscopy.
References
- (1) IAEA, Inicdents and Trafficking Database (ITDB) Incidents of nuclear and other radioactive material out of regulatory control, in 2020 Fact Sheet. International Atomic Energy Agency Vienna, Austria, 2020.
- (2) C. D. Ferguson, W. C. Potter, A. Sands, The four faces of nuclear terrorism. Routledge, 2005.
- (3) R. T. Kouzes, E. R. Siciliano, J. H. Ely et al., Passive neutron detection for interdiction of nuclear material at borders. Nucl. Instrum. Methods A 584, 383–400 (2008) . https://doi.org/10.1016/j.nima.2007.10.026.
- (4) D. Cester, G. Nebbia, L. Stevanato et al., Special nuclear material detection with a mobile multi-detector system. Nucl. Instrum. Methods A 663, 55–63 (2012). https://doi.org/10.1016/j.nima.2011.10.011.
- (5) C. Thomay, J. Velthuis, P. Baesso et al., A binned clustering algorithm to detect high-Z material using cosmic muons. J. Instrum. 8, P10013 (2013). https://doi.org/10.1088/1748-0221/8/10/P10013.
- (6) E. Guardincerri, J. Bacon, K. Borozdin et al., Detecting special nuclear material using muon-induced neutron emission. Nucl. Instrum. Methods A 789, 109–113 (2015). https://doi.org/10.1016/j.nima.2015.03.070.
- (7) P. Baesso, D. Cussans, J. Davies et al., High resolution muon tracking with resistive plate chambers. J. Instrum. 7, P11018 (2012). https://doi.org/10.1088/1748-0221/7/11/P11018.
- (8) X. Y. Pan, Y. F. Zheng, Z. Zeng et al., Experimental validation of material discrimination ability of muon scattering tomography at the TUMUTY facility. Nucl. Sci. Tech. 30, 1–9 (2019). https://doi.org/10.1007/s41365-019-0649-4.
- (9) D. Slaughter, M. Accatino, A. Bernstein et al., Detection of special nuclear material in cargo containers using neutron interrogation. Tech. Rep., Lawrence Livermore National Lab., CA (US) (2003). https://doi.org/10.2172/15005260.
-
(10)
E. B. Norman, S. G. Prussin, R. M. Larimer et al.,
Signatures of special nuclear
material: High-energy gamma rays following fission. Nucl. Instrum. Methods A 21 (LBNL-52806).
URL https://www.osti.gov/biblio/837730 - (11) M. Huang, J. Y. Zhu, J. Wu, Study of spatial resolution of the associated alpha particle imaging–time-of-flight method. Nucl. Sci. Tech. 30, 1–9 (2019). https://doi.org/10.1007/s41365-019-0580-8
- (12) M. G. Paff, M. Monterial, P. Marleau et al., Gamma/neutron time-correlation for special nuclear material detection–active stimulation of highly enriched uranium. Ann. Nucl. Energy 72, 358–366 (2014). https://doi.org/10.1016/j.anucene.2014.06.004.
- (13) M. Huang, J. Y. Zhu, J. Wu et al., Element analysis method of concealed explosive based on TNA, Nucl. Sci. Tech. 30, 6 (2019). https://doi.org/10.1007/s41365-018-0527-5.
- (14) J. Mueller, M. Ahmed, H. Weller, A novel method to assay special nuclear materials by measuring prompt neutrons from polarized photofission. Nucl. Instrum. Methods A 754, 57–62 (2014). https://doi.org/10.1016/j.nima.2014.03.042.
- (15) J. Zier, D. Mosher, R. Allen et al., High-power, photofission-inducing bremsstrahlung source for intense pulsed active detection of fissile material. Phys. Rev. Spec. Top. 17, 060401 (2014). https://doi.org/10.1103/PhysRevSTAB.17.060401.
- (16) B. S. Henderson, H. Y. Lee, T. D. MacDonald et al., Experimental demonstration of multiple monoenergetic gamma radiography for effective atomic number identification in cargo inspection, J. Appl. Phys. 123, 164901 (2018). https://doi.org/10.1063/1.5025805.
- (17) H. Y. Lan, T. Song, X. D. Huang et al., Nuclear resonance fluorescence drug inspection. Sci. Rep. 11, 1–9 (2021). https://doi.org/10.1038/s41598-020-80079-6.
- (18) O. Beck, T. Ruf, Y. Finkelstein et al., Nondestructive determination of the 13C content in isotopic diamond by nuclear resonance fluorescence. J. Appl. Phys. 83, 5484–5488 (1998). https://doi.org/10.1063/1.367378.
- (19) R. Hajima, N. Kikuzawa, N. Nishimori et al., Detection of radioactive isotopes by using laser Compton scattered -ray beams. Nucl. Instrum. Methods A 608, S57–S61 (2009). https://doi.org/10.1016/j.nima.2009.05.063.
- (20) D. Habs, U. Köster, Production of medical radioisotopes with high specific activity in photonuclear reactions with -beams of high intensity and large brilliance, Appl. Phys. B 103, 501–519 (2011). https://doi.org/10.1007/s00340-010-4278-1.
- (21) Y. Yu, B. F. Shen, Ultrafast measurements of ion temperature in high-energy-density plasmas by nuclear resonance fluorescence, Phys. Plasmas 26, 062708 (2019). https://doi.org/10.1063/1.5097641.
- (22) T. Hayakawa, H. Ohgaki, T. Shizuma et al., Nondestructive detection of hidden chemical compounds with laser compton-scattering gamma rays, Rev. Sci. Instrum. 80 045110 (2009). https://doi.org/10.1063/1.3125022.
- (23) H. Toyokawa, T. Hayakawa, T. Shizuma et al., Nondestructive inspection of explosive materials using linearly polarized two-colored photon beam, Nucl. Instrum. Methods A 652, 21–24 (2011). https://doi.org/10.1016/j.nima.2011.01.158.
- (24) R. S. Kemp, A. Danagoulian, R. R. Macdonald et al., Physical cryptographic verification of nuclear warheads, Proc. Natl. Acad. Sci. 113, 8618–8623 (2016). https://doi.org/10.1073/pnas.1603916113.
- (25) J. R. Vavrek, B. S. Henderson, A. Danagoulian, Experimental demonstration of an isotope-sensitive warhead verification technique using nuclear resonance fluorescence, Proc. Natl. Acad. Sci. 115 (17) (2018) 4363–4368. https://doi.org/10.1073/pnas.1721278115.
- (26) H. Utsunomiya, T. Renstrøm, G. Tveten et al., -ray strength function for thallium isotopes relevant to the 205Pb-205Tl chronometry. Phys. Rev. C 99, 024609 (2019). https://doi.org/10.1103/PhysRevC.99.024609.
- (27) C. Ur, A. Zilges, N. Pietralla et al., Nuclear resonance fluorescence experiments at ELI-NP, Rom. Rep. Phys. 68, S483–S538 (2016).
- (28) H. Y. Lan, Y. Xu, W. Luo et al., Determination of the photodisintegration reaction rates involving charged particles: Systematic calculations and proposed measurements based on the facility for Extreme Light Infrastructure–Nuclear Physics. Phys. Rev. C 98, 054601 (2018). https://doi.org/10.1103/PhysRevC.98.054601.
- (29) Z. C. Zhu, W. Luo, Z. C. Li et al., Photo-transmutation of long-lived nuclear waste 135Cs by intense Compton -ray source. Ann. Nucl. Energy 89, 109–114 (2016). https://doi.org/10.1016/j.anucene.2015.11.017.
- (30) E. Irani, H. Omidvar, R. Sadighi-Bonabi, Gamma rays transmutation of Palladium by bremsstrahlung and laser inverse Compton scattering. Energy Convers. Manage. 77, 558–563 (2014). https://doi.org/10.1016/j.enconman.2013.09.029.
- (31) W. Luo, M. Bobeica, I. Gheorghe et al., Estimates for production of radioisotopes of medical interest at Extreme Light Infrastructure–Nuclear Physics facility. Appl. Phys. B 122, 8 (2016). https://doi.org/10.1007/s00340-015-6292-9.
- (32) W. Luo, D. L. Balabanski, D. Filipescu, A data-based photonuclear simulation algorithm for determining specific activity of medical radioisotopes. Nucl. Sci. Tech. 27, 1–8 (2016). https://doi.org/10.1007/s41365-016-0111-9.
- (33) W. Luo, Production of medical radioisotope 64Cu by photoneutron reaction using ELI-NP -ray beam. Nucl. Sci. Tech. 27, 1–5 (2016). https://doi.org/10.1007/s41365-016-0094-6.
- (34) O. Artun, Investigation of production of medical 82Sr and 68Ge for 82Sr/82Rb and 68Ge/68Ga generators via proton accelerator. Nucl. Sci. Tech. 29, 1–11 (2018). https://doi.org/10.1007/s41365-018-0474-1.
- (35) I. Daito, H. Ohgaki, G. Suliman et al., Simulation study on computer tomography imaging of nuclear distribution by quasi monoenergetic gamma rays with nuclear resonance fluorescence: Case study for ELI-NP application. Energy Procedia 89, 389–394 (2016). https://doi.org/10.1016/j.egypro.2016.05.051.
- (36) G. Suliman, V. Iancu, C. Ur et al., Gamma-beam industrial applications at ELI-NP. Rom. Rep. Phys. 68, S799–S845 (2016).
- (37) H. Zen, H. Ohgaki, Y. Taira et al., Demonstration of tomographic imaging of isotope distribution by nuclear resonance fluorescence. AIP Adv. 9, 035101 (2019). https://doi.org/10.1063/1.5064866.
- (38) K. Ali, H. Ohgaki, H. Zen et al., Selective isotope CT imaging based on nuclear resonance fluorescence transmission method. IEEE Trans. Nucl. Sci. 67, 1976–1984 (2020). https://doi.org/10.1109/TNS.2020.3004565.
- (39) A. Zilges, P. Von Brentano, R.-D. Herzberg et al., Strong dipole excitations around 1.8 MeV in 238U. Phys. Rev. C 52, R468 (1995). https://doi.org/10.1103/PhysRevC.52.R468.
- (40) E. Kwan, G. Rusev, A. Adekola, et al., Discrete deexcitations in 235U below 3 MeV from nuclear resonance fluorescence. Phys. Rev. C 83, 041601 (2011). https://doi.org/10.1103/PhysRevC.83.041601.
- (41) F. R. Metzger, Resonance fluorescence in nuclei. Prog. in Nuc. Phys. 7 54 (1959).
- (42) T. Ogawa, S. Hashimoto, T. Sato, Development of general nuclear resonance fluorescence model. J. Nucl. Sci. Techonl. 53, 1766–1773 (2016). https://doi.org/10.1080/00223131.2016.1159148.
- (43) L. W. Fagg, S. S. Hanna, Polarization measurements on nuclear gamma rays. Rev. Mod. Phys. 31, 711 (1959). https://doi.org/10.1103/RevModPhys.31.711.
- (44) K. Siegbahn, Alpha-, beta- and gamma-ray spectroscopy. Vol. 2, North-Holland Amsterdam, Netherlands, 1965.
- (45) J. Pruet, D. P. Mcnabb, C. A. Hagmann et al., Detecting clandestine material with nuclear resonance fluorescence. J. Appl. Phys. 99, p.123102.1–123102.11 (2006). https://doi.org/10.1063/1.2202005.
- (46) S. Agostinelli, J. Allison, K. a. Amako et al., GEANT4- a simulation toolkit. Nucl. Instrum. Methods A 506, 250–303 (2003). https://doi.org/10.1016/S0168-9002(03)01368-8.
- (47) W. Luo, H. Y. Lan, Y. Xu et al., Implementation of the n-body Monte-Carlo event generator into the Geant4 toolkit for photonuclear studies. Nucl. Instrum. Methods A 849, 49–54 (2017). https://doi.org/10.1016/j.nima.2017.01.010.
- (48) H. R. Weller, M. Ahmed, Y. Wu, Nuclear physics research at the High Intensity Gamma-Ray Source (HIS). Nucl. Phys. News 25, 19–24 (2015). https://doi.org/10.1080/10619127.2015.1035932.
- (49) K. Tanaka, K. Spohr, D. L. Balabanski et al., Current status and highlights of the ELI-NP research program. Matter Radiat. Extrem. 5, 024402 (2020). https://doi.org/10.1063/1.5093535.
- (50) N. Kikuzawa, R. Hajima, N. Nishimori et al., Nondestructive detection of heavily shielded materials by using nuclear resonance fluorescence with a laser-Compton scattering -ray source. Appl. Phys. Express 2, 036502 (2009). https://doi.org/10.1143/APEX.2.036502.
- (51) H. Toyokawa, H. Ohgaki, T. Hayakawa et al., Two-dimensional isotope imaging of radiation shielded materials using nuclear resonance fluorescence. Jpn. J. Appl. Phys. 50, 100209 (2011). https://doi.org/10.1143/JJAP.50.100209.
- (52) W. Luo, W. Xu, Q. Y. Pan et al., A 4D Monte Carlo laser-Compton scattering simulation code for the characterization of the future energy-tunable SLEGS. Nucl. Instrum. Methods A 660, 108–115 (2011). https://doi.org/10.1016/j.nima.2011.09.035.
- (53) A. H. Andersen, A. C. Kak, Simultaneous algebraic reconstruction technique (SART): a superior implementation of the art algorithm. Ultrasonic imaging 6, 81–94 (1984). https://doi.org/10.1016/0161-7346(84)90008-7.