Evaluation of the 35K(,)36Ca reaction rate using the 37Ca(,)36Ca transfer reaction
Abstract
- Background
-
A recent sensitivity study has shown that the 35KCa reaction is one of the ten reaction rates that could significantly impact the shape of the calculated X-ray burst light curve. Its reaction rate used up to now in type I X-ray burst calculations was estimated using an old measurement for the mass of 36Ca and theoretical predictions for the partial decay widths of the first 2+ resonance with arbitrary uncertainties.
- Purpose
-
In this work, we propose to reinvestigate the 35KCa reaction rate, as well as related uncertainties, by determining the energies and decay branching ratios of 36Ca levels, within the Gamow window of X-ray burst, in the 0.5 to 2 GK temperature range.
- Method
-
These properties were studied by means of the one neutron pick-up transfer reaction 37CaCa in inverse kinematics using a radioactive beam of 37Ca at 48 nucleon-1. The experiment was performed at the GANIL facility using the liquid Hydrogen target CRYPTA, the MUST2 charged particle detector array for the detection of the light charged particles and a zero degree detection system for the outgoing heavy recoil nuclei.
- Results
-
The atomic mass of 36Ca is confirmed and new resonances have been proposed together with their proton decay branching ratios. This spectroscopic information, used in combination with very recent theoretical predictions for the -decay width, were used to calculate the 35KCa reaction rate. The recommended rate of the present work was obtain within a uncertainty factor of 2 at 1 sigma. This is consistent, with the previous estimate in the X-ray burst temperature range. A large increase of the reaction rate was found at higher temperatures due to two newly discovered resonances.
- Conclusions
-
The 35KCa thermonuclear reaction rate is now well constrained by the present work in a broad range of temperatures covering those relevant to type I X-ray bursts. Our results show that the 35KCa reaction does not affect the shape of the X-ray burst light curve, and that it can be removed from the list of the few influential proton radiative captures reactions having a strong impact on the light curve.
I Introduction
Type-I X-ray bursts are among the most energetic events known, which occur in binary systems consisting of a neutron star accreting H/He-rich material from its companion star Schatz and Rehm (2006). As the accreted material builds up on the surface of the neutron star, high temperatures and densities (T 0.9109 and 106 g cm-3) are reached. A thermonuclear runaway occurs, leading to a sharp increase of X-ray emission from the star that lasts approximately 10-100 . One of the most important challenges in studying X-ray bursts is understanding the observed luminosity profile, which is directly related to the energy released by the nuclear reactions occurring during the thermonuclear explosion. The comparison of the observed light curves to the X-ray burst model predictions may be used to constrain the composition of the neutron star’s crust as well as its properties (mass, radius) Zamfir et al. (2012). X-ray burst models are sensitive to the nuclear reaction rate inputs and recent sensitivity studies Cyburt et al. (2016); Parikh et al. (2013) have shown that among the thousands of reactions involved, only the ones participating in the breakout of the hot-CNO cycle and a few tens of and p reactions have a strong impact on the energy generation of the burst and the final abundances.
The most important reactions to be studied are usually those involving waiting point nuclei Cyburt et al. (2016), where the nuclear reaction flow stalls due to a equilibrium. This implies to await the decay, unless the (,) reaction is fast enough to bypass the waiting point and reach higher Z nuclei. The 34Ar nucleus is such a waiting point and the reaction flow is expected to escape it through an ( reaction, unless a series of two proton captures leading to 36Ca can compete. The 35K)36Ca reaction rate, studied in the present work, has been found to have a significant influence on this reaction pathway, as well as the predicted X-ray burst light curve, when its nominal value is increased by a factor of one hundred Cyburt et al. (2016).
At the typical temperature of an X-ray burst, = 0.5-2 Iliadis (2007), the Gamow window for the 35K(,)36Ca reaction lies between =0.37 and =1.93 (Sp=2599.6(61) ). It corresponds to excitation energies in the 36Ca compound nucleus between 2.97 and 4.53 . Considering the ground state (g.s.) spin value of 35K and the fact that the most relevant proton captures will mostly occur through an s-wave ( = 0), the resonances of interest in 36Ca have =1+,2+.
Historically, owing to the lack of experimental spectroscopic information on 36Ca, several studies Herndl et al. (1995); Rauscher and Thielemann (2000); Iliadis et al. (2001); van Wormer et al. (1994) have estimated the 35K)36Ca reaction rate using theoretical predictions for partial widths and a energy either calculated or adopted from that of the mirror nucleus 36S (3.291 MeV). The contribution from the 1+ resonance, identified in the mirror nucleus to be at 4.523 MeV, was not considered in these works. The reaction -value was derived from the experimental atomic masses of 36Ca and 35K, known at that time from the 40Ca(4He,8He)36Ca Tribble et al. (1977) and 40Ca(3He,8Li)35K Benenson et al. (1976) transfer reactions, respectively.
Since then, the excitation energy of the 2+ first-excited state in 36Ca was measured at GANIL Bürger et al. (2007), GSI Doornenbal et al. (2007) and NSCL A.M.Amthor (2009) by means of one-neutron knockout reactions from a 37Ca secondary beam. Taking the most precise measurement, its energy is found to be 3045.0 2.4 A.M.Amthor (2009). Moreover, the mass of 35K was precisely measured using a Penning trap mass spectrometer at ISOLDE Yazidjian et al. (2007). Therefore, the major uncertainty on the reaction -value, and thereby the resonance energy (2, came from the uncertainty on the atomic mass of 36Ca (Ca)= -6440 40 Tribble et al. (1977)). The most recent estimate of the reaction rate was made by Iliadis et al. Iliadis et al. (2010) by taking into account a 2+ state located at 3015 16 keV Doornenbal et al. (2007) corresponding to a resonance energy of (2=459 43 . The presence of this 2+ state at relatively low energy induces an enhanced resonant capture component in the reaction rate, as compared to what was estimated in Fig. 7 of Ref. Herndl et al. (1995), using (2=700 .
While writing the present paper, a more precise mass excess of Ca)= -6483.6 (56) has been obtained using a Time of Flight - Ion Cyclotron Resonance measurement in a Penning trap Surbrook et al. (2020). This leads to a reaction -value of 2599.6(61) and (2=445 7 , combining the precise mass measurements of 36Ca Surbrook et al. (2020) and 35K Yazidjian et al. (2007).
In this paper, we report the spectroscopy of 36Ca through the one neutron pick-up reaction 37Ca()36Ca in inverse kinematics. Excitation energies and proton branching ratios of the excited states in or near the Gamow window were obtained. Moreover, the mass excess Ca), presently obtained using the reaction -value of the p,d transfer reaction and well-known atomic mass of 37Ca Ringle et al. (2007) was compared to the values of Ref. Tribble et al. (1977); Surbrook et al. (2020). These relevant pieces of information are used to better constrain the 35K(,)36Ca reaction rate at X-ray burst temperatures and above.
II Description of the experiment
II.1 Secondary beam production
The 37Ca nuclei were produced at GANIL in fragmentation reactions of a 95 MeV nucleon-1 40Ca20+ beam, with an average intensity of 2 Ae, on a 2 mm 9Be target. They were separated from other reaction products by the LISE3 spectrometer Anne et al. (1987). A 546 m wedge-shaped Be degrader was inserted at the intermediate focal plane to induce a B - E - B selection among the nuclei transmitted after the first magnetic rigidity selection. The Wien filter, located at the end of the spectrometer, was operated at 2400 kV m-1 in order to induce an additional velocity selection among the transmitted nuclei. The 37Ca nuclei were produced at 48 MeV nucleon-1 with a mean rate of 3500 pps and a purity of 20%.
II.2 Experimental setup
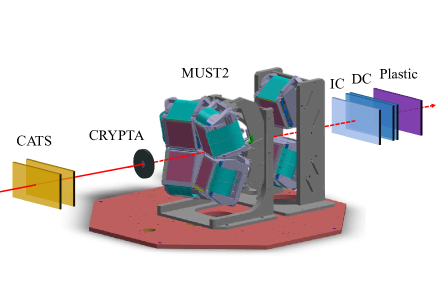
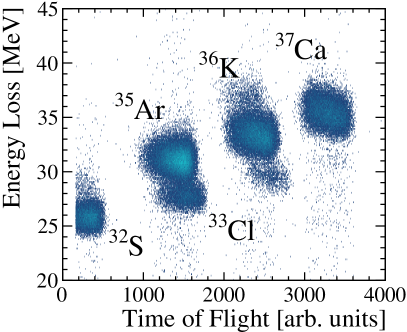
Two low-pressure multi-wire devices, CATS Ottini-Hustache et al. (1999), were placed 67.8 and 118.8 upstream of the liquid Hydrogen target CRYPTA Koyama et al. (2020), in order to track the incident ions and determine their interaction point on the target. A schematic layout of the set-up is shown in Fig. 1. As shown in the left part of Fig. 2, the incoming nuclei were identified through their time-of-flight (TOF) measurement, between the CATS detectors and the cyclotron radio-frequency, and their energy loss in an ionization chamber placed at the LISE spectrometer’s image focal plane. The main nuclei transmitted along with 37Ca were 36K, 35Ar and 32S. Another setting of the spectrometer (not shown here) was used to select a cocktail of secondary beam nuclei, shifted by one unit of mass closer to stability, among which the 38Ca and 33S nuclei were produced. These nuclei, along with 35Ar and 32S, were used to calibrate the detectors with the deuterons emitted in the p,d reaction, as described in Sect. II.3. As the 37Ca nucleus is separated in TOF from the other nuclei, the focal plane ionization chamber was only inserted at the beginning and end of each run to control the incoming beam content.
The liquid Hydrogen ( 18 K) of the CRYPTA target was contained, at a pressure of 0.9 bar, in a 7.6 diameter Al cell with circular apertures of 20 at both ends, closed by 6.47 m thick Havar foils. To reach the liquefaction point of the H2 gas (20 K at 1 bar), the vacuum inside the reaction chamber had to be maintained below 210-6 . Due to the important difference in pressure between the target cell and the reaction chamber, the filling of the target with liquid H2 introduced a significant deformation of the Havar foils. This deformation has been parametrized, using a 10 m precision position measurement from a laser system, in order to correct from the energy loss of the particles inside the target event by event. The target thickness spanned from 0.5 mm (at the edges) to 1.5 (at the center), the latter corresponding to an effective thickness of 9.7 mg cm-2. The target cell was surrounded by a heat shield made of 0.2 m aluminized Mylar foils to protect the target cell from radiations. During the experiment, gas contaminants were condensing on the heat shield, forming a layer of ice of unknown thickness and composition (estimated to be less than 10 m equivalent H2O) crossed by the light ejectiles. To minimize this effect and keep the H2 in a liquid phase, the target was warmed-up and cooled down three times during the 12 days of experiment in order to evaporate the ice layer.
After interaction with the target nuclei, the trajectories of the transfer-like nuclei, their atomic number and their time-of-flight (referenced to the CATS detectors) were determined by means of a Zero Degree Detection (ZDD) setup, composed of an ionization chamber, a set of two XY drift chambers located at 85 and 103 from the target, followed by a 1 thick plastic scintillator. The angular acceptance of the ZDD does not induce kinematical cuts on the detection of the recoil nuclei. Their identification in was performed through the measurement of their energy losses in the ionization chamber, as shown in the right part of Fig. 2.
The energy and angle of the light ejectiles were measured by a set of 6 MUST2 telescopes Pollacco et al. (2005) arranged in the forward direction to cover angles from 3 to 37∘ in the laboratory frame. Four of them, placed at 22 from the target, were covering angles from 5 to 37∘ and two more were placed 57 behind them to cover smaller angles from 3 to 5∘. For the 37Cap,dCa reaction, this corresponds to center-of-mass angles between 2∘ and 160∘.
Each telescope consisted of a 300 m thick Double-sided Silicon Stripped Detector (DSSD) with 128 strips on each side, backed by sixteen 4 thick CsI detectors, read out by photodiodes which provide energy-loss () and residual energy () measurements, respectively. Light particles identification was obtained from a matrix for punching through particles. Their total kinetic energy was obtained from the sum of their energy loss in the DSSD and their residual energy in the CsI crystals, after being corrected by the calculated energy losses in the cryogenic target, its windows and heat shields. The emission angle of the light ejectiles is deduced from the information on the impact point of the incident beam on target reconstructed from CATS detector information, and the position measurement of the ejectile in a given strip of the DSSD, with a precision better than 1∘.
II.3 Energy Calibrations of the MUST2 detectors
Even if the atomic mass of 36Ca has now been measured with a good accuracy Surbrook et al. (2020), it is interesting to determine its value with another method, based on transfer reactions. Even though less precise, this method is more generic and can also be applied to the determination of masses of unbound nuclei. In the present work, the atomic mass and the energy of the excited states of 36Ca have been determined through the measurement of the energies and angles of the deuterons produced in the 37Ca)36Ca transfer reaction. Moreover, when populating unbound states in 36Ca, protons are also emitted and their kinematics can be used as well to determine the energy of the resonant states. Thus a precise energy calibration of both deuterons and protons is required in the DSSD as well as in the CsI crystals, in which they are stopped.
The DSSDs were calibrated strip by strip using a mixed alpha source (239Pu, 241Am, 244Cm) placed at the target position, leading to a global energy resolution of about 40 keV (FWHM) at 5.5 MeV for each telescope.
The first step for the energy calibration of the CsI crystals relies on the correlation of the light particles. The incident energy of each light particle is deduced from its measured energy loss in the DSSD. The residual energy in the CsI crystals is subsequently calculated from the measured energy loss in the silicon detector and used to calibrate the CsI crystals. Dead layers are accounted for in this procedure. The correlation between the calculated residual energy (in MeV) and its experimental channel number in the ADC was fitted with a second order polynomial function to determine the calibrated CsI energy . Given that the CsI crystals show surface and volume inhomogeneities in the light collection (of about 5%) caused by their aging, each CsI crystal was virtually divided into 64 pixels using the position information from the DSSD. The energy calibration of the CsI crystals was then done pixel by pixel, eventually covering their full surface. Since the amount of scintillation light produced in a CsI crystal depends on the type of particle, this calibration procedure was performed for the deuterons and the protons independently.
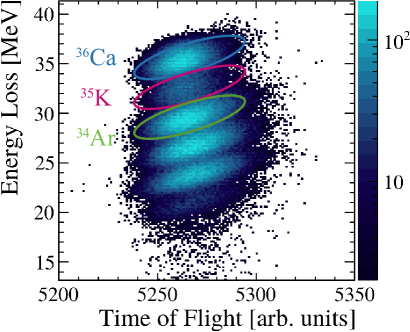
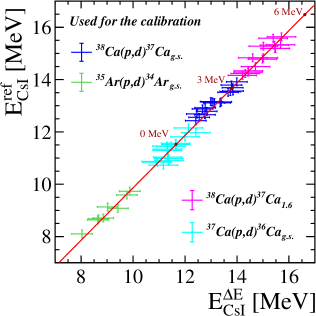
The second step of the energy calibration of the CsI crystals aimed at correcting the effects of the deformation uncertainties of the target’s windows and the non-homogeneity of the dead layers. For this purpose, reference transfer reactions with well known -values (with less than 2 keV uncertainty) such as 38CaCa and 35ArAr were measured during the experiment and used for a refined energy calibration in the energy range of the deuterons resulting from the 37CaCa transfer reactions to the ground and excited states up to 6 MeV (see blue, magenta and green crosses in Fig. 3). The reference energy , calculated event by event, is the expected energy, at the angle where the deuteron was measured, to reconstruct the known mass of the reference nuclei. The error on arises from the propagation of the uncertainties on the measured angle. Due to the lack of statistics this second step calibration could only be applied to the CsI crystal and not to each pixel as in the first step. The calibrated values of Fig. 3 display a linear relationship between and over a large range of deuteron energy. Data points corresponding to the population of the 36Ca g.s. (cyan) are enclosed between the three reference reactions. Due to the lack of reference reactions giving rise to a precise determination of the proton energy, the above procedure could only be applied to deuterons. This second step calibration allows to improve the resolution on the excitation energy by 20 and to reduce the uncertainty on the mass measurement by a factor 3.
III Experimental results
III.1 Mass excess of 36Ca
The mass excesses of 37Ca, 34Ar, and 36Ca, given in Table 1, have been determined from the invariant mass value of their ground state population through p,d reactions. The error bars obtained for reference nuclei show the best reachable precision on mass excess measurement with this method, since they are the nuclei used for the calibration. The mass excess of 36Ca , keV, measured in this work, is in good agreement with the recent measurement, keV of Ref. Surbrook et al. (2020). As expected, our uncertainty on the 36Ca mass is larger than the one obtained from the penning trap measurement Surbrook et al. (2020), but similar to that obtained in another transfer reaction Tribble et al. (1977). This uncertainty is dominated by systematic errors arising from multiple effects such as the propagation of errors on the measured angle and energy of the deuteron and on the energy calibration of the CsI. They have been estimated combining the standard deviation of independent measurements performed using the 4 MUST2 telescopes, located at the closest distance from the target. Taking the most precise atomic mass values of 36Ca and 35K, the proton separation energy of 36Ca is deduced to be = 2599.6(61) keV.
| Nucleus | (keV) | (keV) | ||
| this work | literature | |||
| 36Ca | -6480(40) |
|
||
| 37Ca | -13141(13) | -13136.1(6) Ringle et al. (2007) | ||
| 34Ar | -18403(25) | -18378.29(8) Herfurth et al. (2001) |
III.2 Excited states in 36Ca
The missing mass method has been applied in inverse kinematics to determine the excitation energy () of the states produced in 36Ca. After gating on an incoming 37Ca the excitation energy is reconstructed from the total kinetic energy and the angle of the deuterons produced in the reaction. Figures 4a) and 4b) display the spectra gated on the outgoing Ca or K nuclei in the ZDD (as shown in the right part of Fig.2), respectively. The fit of the excitation energy spectrum has been performed using multiple Gaussian function, assuming that the natural width of the states is much smaller than the experimental resolution. The red lines in Figures 4a) and 4b) show the best total fits obtained and the colored dashed lines are the individual state contributions used for each fit. All the parameters of the fit are free except the resolution. The energy-dependence of the peak widths was estimated using the package Matta et al. (2016), in which the whole set-up was simulated. The resolution was then strongly constrained in the fit, using the reference width of the known and isolated ground state and the simulated energy-dependence. The number of contributions used in the fit was guided by the number of levels populated in the mirror reaction Gray et al. (1970) and by the statistical test of the p-value.
The peaks corresponding to the feeding of the ground and first 2+ excited states in 36Ca are well identified in Fig. 4a). As expected, the peak corresponding to the g.s. disappears when gated on K nuclei. The energy of the 2+ state is measured at 3059 (30) keV in Fig. 4a) and 2982 (120) keV in Fig. 4b) (blue curve), in agreement with the value of 3045 (2.4) keV A.M.Amthor (2009), within the error bars. The relatively large uncertainties arise from a nearby resonance, as will be discussed below. As the 2+ state is unbound with respect to one and two proton emissions, a certain fraction of its decay occurs to the ground state of 35K, bound by only 83.6 (5) keV Wang et al. (2017), with the emission of a proton. This is discussed in the following.
In Fig. 4c), the one-proton energy spectrum has been reconstructed in the 36Ca center-of-mass from the measured energy and angle of the proton in coincidence with the deuteron of the reaction and the outgoing K nuclei. For convenience, the one-proton separation energy ((36Ca ) = 2599.6(61) keV) has been added in Fig. 4c) to the proton energies to ease the comparison with the excitation energy spectra of Figs. 4a,b). The resulting excitation energy resolution is 2 to 4 times better when reconstructed with the protons than with the deuterons: 130 keV at = 3 MeV and 300 keV at 5 MeV with the protons and an almost constant value around 550 keV with the deuterons. This effect arises from the more forward focused kinematics of the protons, as compared to deuterons. In addition, as the proton energy spectrum is constructed with less than half of the CsI crystals, the systematic uncertainty caused by their inhomogeneities is smaller in the spectrum.
Thus, the peak corresponding to the 2 state is better separated from the others in the spectrum of Fig. 4c), as compared to the excitation energy peak shown in Fig. 4b). Note also that the triple coincidence (deuteron, proton and K nucleus) cleans the spectrum from all type of background. The fit of the spectrum has been performed using multiple Gaussian functions, whose energy-dependent widths have been constrained from simulations, assuming again that their natural width is much smaller than the experimental resolution. The energy of the 2 state is found at 3057 (20) keV. Its uncertainty comes from the moderate statistics. The presently determined 2 energy agrees well with the ones of 3036(11) Bürger et al. (2007) and 3045(2.4)A.M.Amthor (2009) keV, determined by -decay, as well as the value of 3059 (30) keV derived from our fit of the excitation energy spectrum of Fig. 4a).
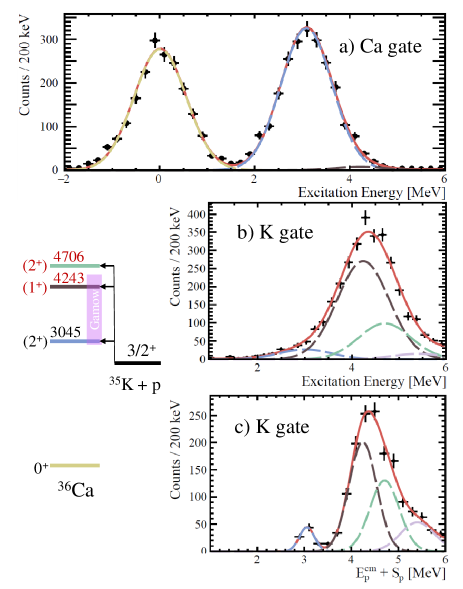
As shown in Fig. 4c), several states are identified up to 6 MeV. One of them at MeV lies inside the Gamow window of the 35K)36Ca reaction. This state is also visible at a compatible energy in the excitation energy spectrum of Fig. 4b). According to the selection rules of the transfer reaction, =1+ and 2+ states are populated with a configuration in the removal of an =0 neutron from the orbital. This assumption is confirmed by the fact that one =1+ and two 2+ states are populated in the same energy range in 36S by means of the mirror reaction 37Cl(,3He)36S Gray et al. (1970). The isobaric analogue 1 state was measured at = 4523.0 (6) keV. Therefore we tentatively assign a spin-parity of 1+ for the excited state of 36Ca at 4.243(40) MeV. Two shell model calculation was performed, one in the valence space with USDB interaction and the other using the full valence space with sdpfu-mix plus Coulomb interaction. Calculation in valence space predicts the position of this 1 state in 36Ca at keV and while calculations in valence space predicts keV.
Given that the energy resolution of the proton spectrum is accurately determined from simulations, two states are needed between 4 and 5 MeV to achieve the best fit of the spectrum. Besides the 1+ state at 4.24 MeV discussed above, a (2) state has been identified at Ex = 4.706 (100) MeV in 36Ca , close to the upper border of the Gamow window. The identification of two states (tentatively 1+ and 2) in this energy range is reinforced by a similar observation in the mirror nucleus 36S, with a (1+, 2) doublet at 4.523 and 4.572 MeV, fed within similar relative intensities in the 37Cl(,3He)36S reaction. The energy and feeding of these states, obtained from Fig. 4c), are compatible with those obtained independently in the excitation energy spectrum of Fig. 4b) from the detection of deuterons.
Other states are observed between 5 and 8 MeV, but since they are well outside of the Gamow window, they will have no impact on the reaction rate and will not be discussed here. As a last remark, despite the fact that all states discussed here (2,1+,2) are unbound by two-proton emission ( 2683 keV), no peak is observed at the corresponding resonance energy in the Ar-gated spectrum (not shown here). Therefore, we shall neglect their decay contribution to determine their proton to decay branches in the following section.
| Present work | Herndl Herndl et al. (1995) | ||||||||||||||||
| Exp. | shell | shells | |||||||||||||||
| Jπ | Ex | ||||||||||||||||
| (2) | 3045(2.4) | 0.165(10) | 0.5 | 0.009 | 0.87 | 0.64 | 0.99111from Valiente-Dobón et al. (2018) | 0.009 | 0.84 | 0.46 | 0.4 | 0.009 | 0.94 | 0.70 | |||
| (1+) | 4243(40) | 0.96 | 37.1 | 0.0009 | 2.8104 | 65.4 | 0.002 | 6.3104 | 1 | ||||||||
| (2) | 4706(100) | 0.97 | 0.2 | 7.4 | 0.003 | 3.3105 | 1 | ||||||||||
III.3 Experimental proton branching ratios
The first 2+ excited state of 36Ca at MeV has been identified both in the excitation energy spectra gated by Ca and K, meaning that it decays through -ray and proton emission with respective partial widths and . We propose here to determine its experimental proton branching ratio Bp=/, with =+, using two methods. As for the and states, no counts are observed in the decay branch, we shall determine minimum values of Bp, based on the fit of the K-gated and Ca-gated excitation energy spectra.
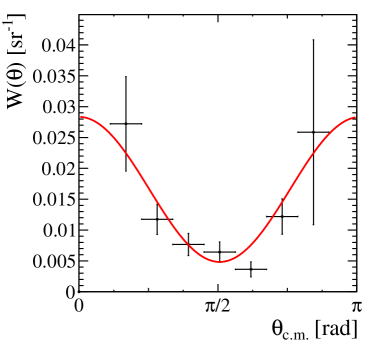
First method- The experimental proton-deuteron angular correlation is shown in Fig. 5 as a function of the proton center-of-mass emission angle in the 36Ca frame. This correlation function is obtained after normalisation of the number of decaying protons per angle by the total number of counts observed in the excitation energy peak and correction of the relative geometrical efficiency between protons and deuterons (which have significantly different angular distributions). The geometrical efficiency was computed using the nptool simulation package where the 37Ca(,)36Ca transfer reaction and the subsequent proton emission were both simulated with an isotropic angular distribution. It has been restricted to events corresponding to proton center-of-mass energies ranging from 2.5 to 3.5 MeV to focus on the study of the 2 decay. Errors for each point of the angular correlation are dominated by statistical uncertainties.
This correlation function can be described by a sum of even Legendre polynomials, Pronko and Lindgren (1972):
| (1) |
where are coefficients obtained from a fit to the experimental angular correlation. The sum is truncated at a maximum value of , where and are the possible proton orbital angular momenta, and is the spin of the decaying state. The value of =2, which results from the best fit shown in Fig. 5, can then be used to constrain the spin assignment of the decaying 36Ca state. Given the fact that the ground state of 35K has , this implies that the first excited state in 36Ca has either or assignment. This is in agreement with the value expected from the mirror nucleus and shell model calculations.
By integrating the angular correlation function over the full solid angle, a proton branching ratio of (2) is determined. The uncertainty results from the error propagation of the fitted parameters.
Second method- By counting the number of events associated to the feeding of the first 2+ excited state in the K-gated and Ca-gated excitation energy spectra, a (3) ratio is found. Using the fact that:
| (2) |
a branching ratio of (2) is obtained. The uncertainty is due to the fitting of the peaks in the excitation energy spectrum, as well as in the choice of the gates in Ca and K in the ZDD spectrum of Fig. 2. The proton branching ratio values for the 2+ state derived with the two methods are in excellent agreement.
The second method was applied to compute the following lower limits: 0.96 for the 1+ state and 0.97 for the 2 at one confidence level. The fit of the Ca-gated excitation energy spectrum of Fig. 4a) was used to estimate their maximum contributions to the -decay channel, such as the small one to the 1+ state, displayed in brown color.
As shown in Table 2, the weighted average value (10) for the 2+ state is found to be significantly weaker than all theoretical predictions, while the deduced lower limits for the higher 1+ and 2 states are consistent with the predictions.
III.4 Calculated gamma widths
The predicted partial widths of Table 2, expressed in meV, were computed using the following relation Iliadis (2007):
| (3) |
where names the nature of the transition (Electric or Magnetic) and its multipolarity. is the reduced transition probability for the decay of the resonant state (in unit of for E2 transitions and for M1 transitions) and the energy of the -ray transition. Shell model calculations usually predict and values, from which is calculated. However, as the experimental excitation energy of the 2 state is known and differs from the calculated ones, the predicted partial widths listed in Table 2 are obtained from Eq. 3 using experimental energies and calculated values.
Two different shell model calculations have been performed in the present work, one restricted to the orbitals and USDB interaction, the other using the full valence space with sdpfu-mix plus Coulomb interaction. The reduced transition probabilities, which contribute the most to the -ray width of each state, obtained in valence space are: , , , , . Values obtained in shell are , , , , .
The major difference between the shell model calculations presented here or in Ref. Herndl et al. (1995), resides in the size of their valence spaces: when restricted to shells the proton core is closed, while the use of a broader valence space allows proton excitations. When using the valence space, the 2 state in 36Ca (36S) is of pure neutron (proton) origin. It follows that the values of the two mirror nuclei can simply be derived from their squared neutron to proton effective charges ratio, Ca)= e/e B(E2)(36S), where en (ep) are the neutron (proton) effectives charges usually adopted to be 0.5 (1.5).
As the 2 state in 36Ca is certainly not totally of pure neutron origin, the calculated using a valence space ( 0.4 meV) represents a lower limit. At the other extreme, a maximum of about 3.7 meV is obtained for 36Ca when assuming the same value as in the mirror nucleus 36S, after correcting from their different 2 energies. This latter assumption would imply that the 2+ state has a very mixed (and similar) structure in both nuclei. This is very unlikely for two reasons. First, the two nuclei are likely doubly magic, at least based on the high excitation energy of their first excited states. Second, the 2 state in 36S is very well populated by the 37Cl(,3He)36S proton removal reaction, with spectroscopic factors values for the 2 and 1 states (0.86 and 0.75 respectively Gray et al. (1970)) that are close to the single particle values, meaning it has a strong proton component rather than a mixed proton and neutron one.
III.5 Calculated proton widths
The proton widths of the states listed in Table 2 are obtained by multiplying their single-particle width with the spectroscopic factor :
| (4) |
The values are obtained from shell model calculations, while are calculated by scattering phase shifts in a Woods-Saxon potential Brown (2011) whose depths are adjusted to match the experimental resonance energies. The Wood-Saxon potential parameters used for calculation can be found in page 239 of Ref. Bohr and Mottelson (1998). In the present work, the widths of the 2 state obtained in the and shell model calculations agree very well with each other, while those for the 1+ state differ by more than a factor two.
It is important to note that the values are obtained by multiplying a very small number (of the order of 10-3) by large barrier penetrability factors for the protons, especially for those having . Despite this, the values obtained with the two calculations agree reasonably well. The values are small as they correspond to the emission of a proton from an almost pure neutron state, selectively populated here by the p,d transfer reaction.
IV The 35K(,)36Ca reaction rate
The thermonuclear reaction rate per particle pair is given by Longland et al. (2010):
| (5) |
where is the reduced mass of the two interacting nuclei, is the Maxwell-Boltzmann constant, is the temperature in Kelvin, is the center-of-mass energy in MeV and is the nuclear reaction cross section in barn.
The 35KCa reaction rate depends on resonant capture (RC) and direct capture (DC) contributions, that we shall discuss in the following.
IV.1 Resonant capture
In the presence of narrow resonances, the reaction rate can be expressed as:
| (6) |
where
| (7) |
is the resonance strength of the resonance with , and its partial -ray, proton and total width in MeV, respectively, the resonance energy in MeV, the spin of the resonance, and are the proton spin (1/2) and the g.s. spin of 35K (3/2), respectively. is the temperature in GK and is the reduced mass. This assumption of narrow resonance is valid as the resonant states considered here have a total width far below their resonance energies.
As shown in Eq. 6, the resonance energy, the spin, as well as the total and partial widths of all resonances are needed to compute the reaction rate. The resonance energy for the 2 state has been determined from the excitation energy of Ref. A.M.Amthor (2009) (being the most precise measurement performed by -ray spectroscopy) and the recent mass measurement of Ref. Surbrook et al. (2020). For the 1+ and 2 states, excitation energies are the one determined in the present work. The spin values used for the computation are the ones proposed in Sect. III.2.
As we could only determine precisely the proton branching ratio in the present work (and only a lower limit for the 1+ and 2 states), we choose to fix the partial widths using the shell model calculation which makes use of the broadest valence space and correctly reproduces the energy of the first 2+ state. Once is fixed, and can be derived for the 2 state using the experimental value as the proton and decays are the only open channels.
As for the 1+ and the 2 resonances, the proton partial width dominates the total width. It follows that the resonance strength of the Eq. 7 can be approximated by , with the spin of the resonance. All the resonance parameters needed to compute the reaction rate are listed in Table. 3
The reaction rate has been computed using the Monte-Carlo code RatesMC Longland et al. (2010), allowing a statistically meaningful evaluation of the reaction rate based on experimental and/or theoretical uncertainties. A Gaussian probability density function is assumed for the resonance energies and a log-normal distribution is used as a probability density function for -width and proton-width values.
A central value of 0.99 meV was used for the 2 state with an uncertainty factor of 1.7, which corresponds to values between 0.58 and 1.7 meV at one sigma. This way, we accept the lower (0.4 meV) and upper limit (3.7 meV) of , discussed in Sect. III.4, at about 2. The same uncertainty factor is assumed for the widths of the 1+ and the 2 states. The uncertainty on of the 2 is deduced from that on and on the experimental value, following Eq. 2.
| [keV] | [meV] | [meV] | [meV] | |
|---|---|---|---|---|
| (2+) | 445 (7) | 0.99111with a uncertainty factor 1.7 | 0.20 | 0.102(50) |
| (1+) | 1643 (41) | 65.4111with a uncertainty factor 1.7 | 25 (14) | |
| (2) | 2106 (100) | 7.4111with a uncertainty factor 1.7 | 4.6 (25) |
IV.2 Direct capture
The DC component mostly occurs through an =2 proton capture between the ground state of 35K and that of 36Ca, which have = 3/2+ and 0+, respectively. In a simplified picture, 3 protons are occupying the orbital in the g.s. of 35K and one more can occupy it by the direct capture process to the ground state of 36Ca . The calculations of Ref. Herndl et al. (1995) predict a proton spectroscopic factor for 36Ca of 3.649, while the shell model calculation predicts a slightly smaller value of 3.37. We propose the use of the mean value between the two (3.5) and an uncertainty of 0.15 to agree, within one sigma, with the two calculations.
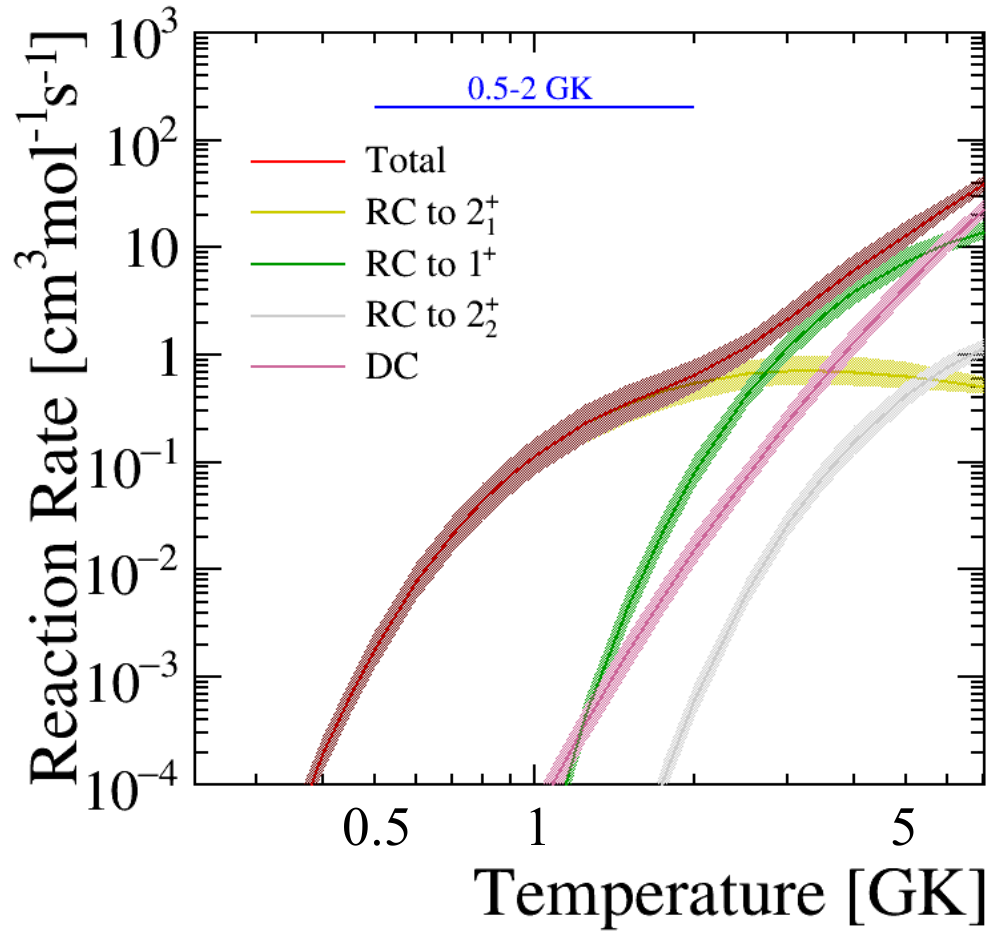
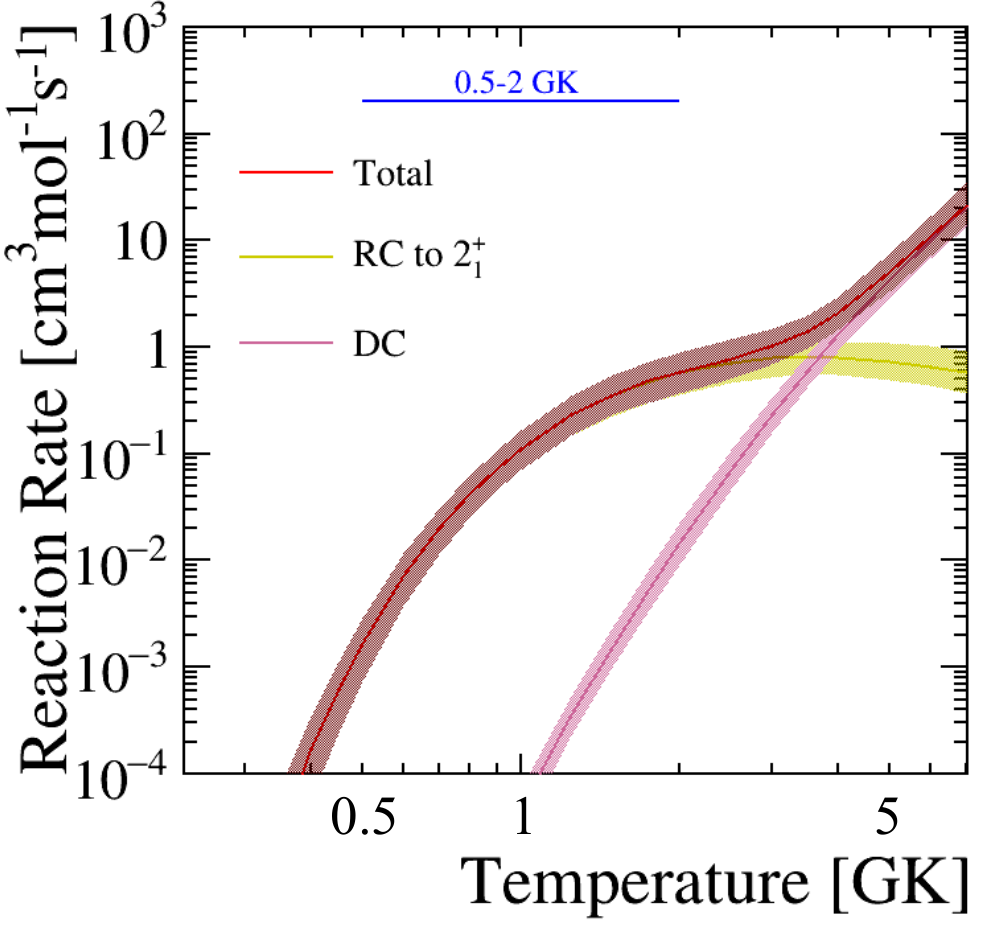
IV.3 Discussion
The evolution of the calculated rates with temperature for the 35K(,)36Ca reaction is shown in Fig 6. The top part displays the results obtained when using the presently discussed resonances and corresponding widths, while the bottom part shows the results obtained from the work of Iliadis et al. Iliadis et al. (2010), in which only the resonance was considered (with the following parameters: keV, meV and meV) in addition to the DC part. In the X-ray burst temperature range (0.5-2 GK), the reaction rate is dominated by this resonance. Therefore the major differences between our work and the one of Ref. Iliadis et al. (2010) reside in the values used for the partial -width (to be discussed in the next paragraph), the partial proton-width, the resonance energy of the 2+ state and their associated uncertainties.
For the partial width, an arbitrary value of 50% was assumed in Iliadis et al. (2010) with a central value of 0.4 meV for the 2+ state. It corresponds to a log-normal confidence interval for the widths of [0.25-0.64] meV at one sigma, which partly overlaps with our current determination of the -ray partial width. The uncertainty on the 2+ resonance energy considered in the present work was reduced using the very recent precise measurement of the mass of 36Ca from Surbrook et al. (2020) and the excitation energy from A.M.Amthor (2009). As shown in Fig. 6, the contributions of the 1+ and 2 resonances to the total reaction rate, not taken into account in Iliadis et al. (2010), start to be significant at temperatures above GK.
The ratio of the calculated reaction rate by Iliadis et al. Iliadis et al. (2010) to our recommended value (given numerically in Tab. 4) is shown in Fig. 7. The colored areas outlined by the thick/thin black lines show the uncertainty on the recommended reaction rate calculated in this work with a coverage probability of 68% and 95% respectively. The thick and dashed blue lines correspond to the reaction rate given in Iliadis et al. (2010) with the associated 68% uncertainties respectively, normalized to our recommended reaction rate. For the temperature range of interest, the results are similar. We have also estimated that the contributions to the 0 ( proton capture) and 3- () states, not identified here but present in the mirror nucleus, are negligible in the Gamow window. At temperatures higher than 2 GK, our recommended reaction rate is systematically higher due to the contributions of the 1+ and 2 resonances, not included in Iliadis et al. (2010). This reaction rate should, however, be considered as a lower limit, as higher-energy resonances may additionally contribute to the reaction rate beyond 2 GK.
| T [GK] | Low | Recommended | High |
|---|---|---|---|
| 0.010 | 3.191 | 3.350 | 3.516 |
| 0.011 | 2.345 | 2.461 | 2.591 |
| 0.012 | 1.051 | 1.104 | 1.160 |
| 0.013 | 3.151 | 3.316 | 3.487 |
| 0.014 | 6.785 | 7.123 | 7.487 |
| 0.015 | 1.100 | 1.157 | 1.218 |
| 0.016 | 1.407 | 1.478 | 1.555 |
| 0.018 | 1.281 | 1.346 | 1.414 |
| 0.020 | 6.238 | 6.547 | 6.886 |
| 0.025 | 1.498 | 1.573 | 1.654 |
| 0.030 | 5.656 | 5.950 | 6.257 |
| 0.040 | 3.229 | 3.393 | 3.565 |
| 0.050 | 1.507 | 1.585 | 1.665 |
| 0.060 | 1.633 | 1.719 | 1.808 |
| 0.070 | 6.881 | 7.243 | 7.612 |
| 0.080 | 1.503 | 1.581 | 1.663 |
| 0.090 | 2.050 | 2.152 | 2.262 |
| 0.100 | 2.112 | 2.274 | 2.501 |
| 0.110 | 2.632 | 3.680 | 5.509 |
| 0.120 | 6.334 | 1.066 | 1.794 |
| 0.130 | 1.416 | 2.425 | 4.077 |
| 0.140 | 2.174 | 3.653 | 6.068 |
| 0.150 | 2.322 | 3.847 | 6.272 |
| 0.160 | 1.837 | 3.007 | 4.807 |
| 0.180 | 5.706 | 9.077 | 1.426 |
| 0.200 | 8.717 | 1.370 | 2.113 |
| 0.250 | 1.116 | 1.720 | 2.577 |
| 0.300 | 2.683 | 4.073 | 6.069 |
| 0.350 | 2.502 | 3.786 | 5.595 |
| 0.400 | 1.298 | 1.955 | 2.894 |
| 0.450 | 4.570 | 6.891 | 1.018 |
| 0.500 | 1.227 | 1.856 | 2.738 |
| 0.600 | 5.214 | 7.901 | 1.163 |
| 0.700 | 1.413 | 2.145 | 3.173 |
| 0.800 | 2.911 | 4.418 | 6.535 |
| 0.900 | 4.983 | 7.581 | 1.125 |
| 1.000 | 7.534 | 1.150 | 1.712 |
| 1.250 | 1.518 | 2.313 | 3.445 |
| 1.500 | 2.356 | 3.564 | 5.288 |
| 1.750 | 3.295 | 4.886 | 7.116 |
| 2.000 | 4.551 | 6.538 | 9.253 |
| 2.500 | 8.745 | 1.197 | 1.653 |
| 3.000 | 1.618 | 2.196 | 3.118 |
| 3.500 | 2.790 | 3.810 | 5.535 |
| 4.000 | 4.507 | 6.124 | 8.876 |
| 5.000 | 9.892 | 1.291 | 1.811 |
| 6.000 | 1.872 | 2.316 | 3.048 |
| 7.000 | 3.204 | 3.773 | 4.696 |
| 8.000 | 5.114 | 5.785 | 6.893 |
| 9.000 | 7.719 | 8.471 | 9.723 |
| 10.000 | 1.104 | 1.196 | 1.330 |
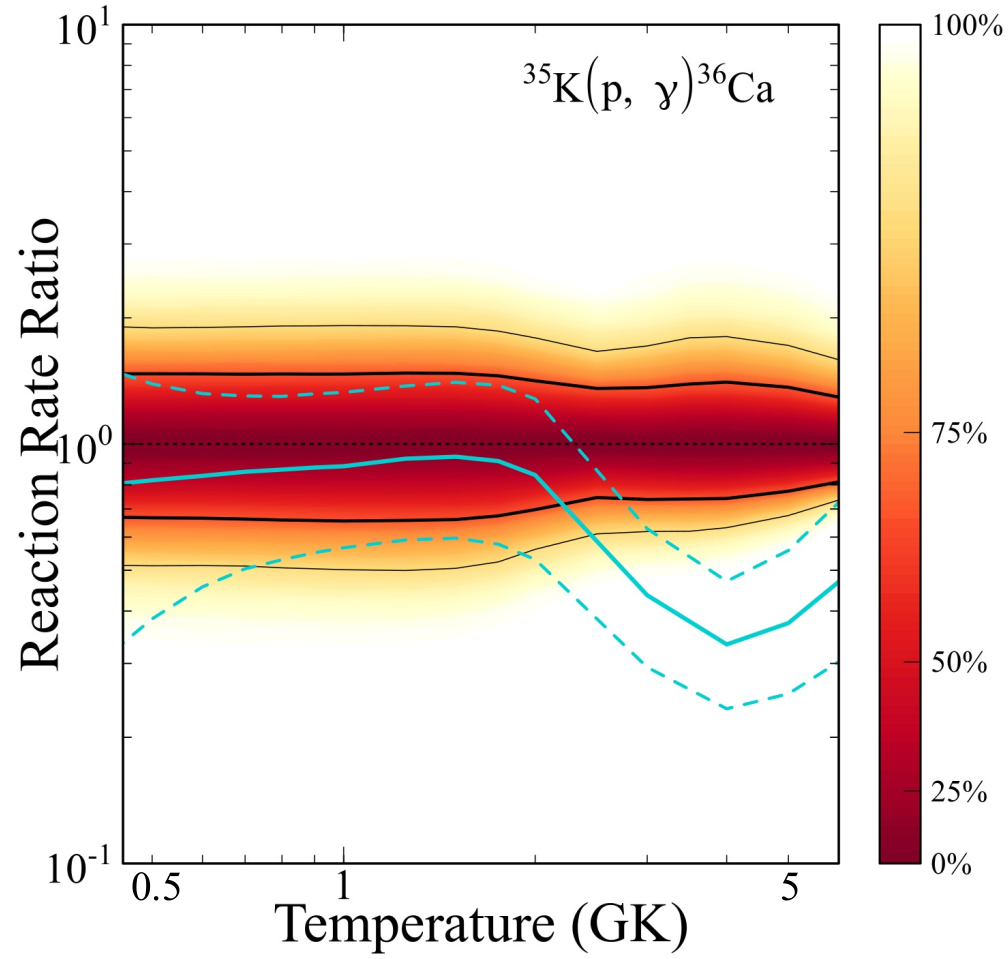
The sensitivity study of Cyburt et al. Cyburt et al. (2016) concluded that the 35K(,)36Ca reaction would lead to a significant modification of the X-ray burst light curve if the reaction rate was a factor of one hundred higher than that of Iliadis et al. Iliadis et al. (2010). Such an increase is absolutely ruled out by our study for which a factor of 3 difference is found at maximum for the reaction rate between 0.5 and 2 GK.
V Conclusion
The spectroscopy of 36Ca was investigated via the one neutron pick-up reaction 37CaCa in inverse kinematics, in view of determining useful information for the 35K,)36Ca reaction rate and compare it to earlier works such as Iliadis et al. (2010). The 36Ca atomic mass was measured and matches very well with previous values Tribble et al. (1977); Surbrook et al. (2020). The energy of the first 2+ excited state was confirmed and new resonances have been reported in the vicinity of the Gamow window, at excitation energies and MeV. Based on shell model calculations in the valence space and the comparison to the mirror nucleus (36S), spins and parities 1+ and 2+ were proposed for these two new observed states, respectively. The proton branching ratio of the first 2+ state was measured with two independent methods and lower limits, and were estimated for the two other resonant states.
A Monte Carlo procedure Longland et al. (2010), which consistently takes into account the uncertainties on the energy, spin parity, partial and total widths of the 36Ca states, was then used to calculate the 35K(,)36Ca reaction rate between 0.01 and 10 GK with its corresponding uncertainty. Shell model predictions of were used to compute the only non experimentally-constrained parameter for the resonant states: . The factor 1.7 uncertainty associated to this prediction dominates the total uncertainty of the reaction rate in the X-ray burst temperature range of interest. Therefore, the determination of the gamma width (or lifetime) of the 2 state is still desirable, as it would provide an almost fully experimentally-constrained reaction rate.
The present work provides constrains in a broad range of temperatures for the 35K(,)36Ca reaction rate. It should be noted, however, that some additional contributions (not studied in this work) may further increase the reaction rate above 2 GK. Up to 4 GK, our recommended value is consistent, within one sigma, with the one of Iliadis et al. (2010), previously used in X-ray burst models. Based on the reaction sensitivity tests of Cyburt et al. Cyburt et al. (2016), our measured reaction rate is not sufficiently different from previous estimation to modify significantly the luminosity profile of X-ray burst. Therefore, the 35K(,)36Ca reaction can be removed from the list of the proton radiative captures reactions having a strong impact on the light curve.
Acknowledgements.
The continued support of the staff of the GANIL facility is gratefully acknowledged. We thank Richard Longland and Phil Adsley for their help with the use of the RatesMC code. We acknowledge significant support from NFS grant PHY-1811855.References
- Schatz and Rehm (2006) H. Schatz and K. Rehm, Nuclear Physics A 777, 601 (2006), special Issue on Nuclear Astrophysics.
- Zamfir et al. (2012) M. Zamfir, A. Cumming, and D. K. Galloway, The Astrophysical Journal 749, 69 (2012).
- Cyburt et al. (2016) R. H. Cyburt, A. M. Amthor, A. Heger, E. Johnson, L. Keek, Z. Meisel, H. Schatz, and K. Smith, The Astrophysical Journal 830, 55 (2016), arXiv: 1607.03416.
- Parikh et al. (2013) A. Parikh, J. José, G. Sala, and C. Iliadis, Progress in Particle and Nuclear Physics 69, 225 (2013), arXiv: 1211.5900.
- Iliadis (2007) C. Iliadis, Nuclear Physics of Stars, edited by Wiley-VCH (2007).
- Herndl et al. (1995) H. Herndl, J. Gorres, M. Wiescher, B. A. Brown, and L. Van Wormer, Physical Review C 52, 1078 (1995).
- Rauscher and Thielemann (2000) T. Rauscher and F.-K. Thielemann, Atomic Data and Nuclear Data Tables 75, 1 (2000).
- Iliadis et al. (2001) C. Iliadis, J. M. D’Auria, S. Starrfield, W. J. Thompson, and M. Wiescher, The Astrophysical Journal Supplement Series 134, 151 (2001).
- van Wormer et al. (1994) L. van Wormer, J. Goerres, C. Iliadis, M. Wiescher, and F.-K. Thielemann, The Astrophysical Journal 432, 326 (1994).
- Tribble et al. (1977) R. E. Tribble, J. D. Cossairt, and R. A. Kenefick, Physical Review C 15, 2028 (1977).
- Benenson et al. (1976) W. Benenson, A. Guichard, E. Kashy, D. Mueller, and H. Nann, Phys. Rev. C 13, 1479 (1976).
- Bürger et al. (2007) A. Bürger, F. Azaiez , M. Stanoiu , Zs. Dombrádi , A. Algora, A. Al-Khatib , B. Bastin , G. Benzoni , R. Borcea, Ch. Bourgeois , P. Bringel , E. Clément , J.-C. Dalouzy, Z. Dlouhý , A. Drouart , C. Engelhardt , S. Franchoo, Zs. Fülöp , A. Görgen , S. Grévy , H. Hübel, F. Ibrahim, W. Korten , J. Mrázek, A. Navin, F. Rotaru, P. Roussel-Chomaz , M.-G. Saint-Laurent , G. Sletten , and D. Sohler , O. Sorlin , Ch. Theisen , C. Timis , D. Verney, Physics Letters B 647, 237 (2007).
- Doornenbal et al. (2007) P. Doornenbal, P. Reiter, H. Grawe, T. Otsuka, A. Al-Khatib, A. Banu, T. Beck, F. Becker, P. Bednarczyk, G. Benzoni, A. Bracco, A. Bürger, L. Caceres, F. Camera, S. Chmel, F. Crespi, H. Geissel, J. Gerl, M. Górska, J. Grebosz, H. Hübel, M. Kavatsyuk, O. Kavatsyuk, M. Kmiecik, I. Kojouharov, N. Kurz, R. Lozeva, A. Maj, S. Mandal, W. Meczynski, B. Million, Z. Podolyák, A. Richard, N. Saito, T. Saito, H. Schaffner, M. Seidlitz, T. Striepling, Y. Utsuno, J. Walker, N. Warr, H. Weick, O. Wieland, M. Winkler, and H. Wollersheim, Physics Letters B 647, 237 (2007).
- A.M.Amthor (2009) A.M.Amthor, Experimental and theoretical study of nuclear reaction rates in the rp-proces, Ph.D. thesis, Michigan State University (2009).
- Yazidjian et al. (2007) C. Yazidjian, G. Audi, D. Beck, K. Blaum, S. George, C. Guenaut, F. Herfurth, A. Herlert, A. Kellerbauer, H.-J. Kluge, D. Lunney, and L. Schweikhard, Physical Review C 76, 024308 (2007).
- Iliadis et al. (2010) C. Iliadis, R. Longland, A. Champagne, A. Coc, and R. Fitzgerald, Nuclear Physics A 841, 31 (2010), arXiv: 1004.4517.
- Surbrook et al. (2020) J. Surbrook, G. Bollen, M. Brodeur, A. Hamaker, D. Pérez-Loureiro, D. Puentes, C. Nicoloff, M. Redshaw, R. Ringle, S. Schwarz, C. S. Sumithrarachchi, L. J. Sun, A. A. Valverde, A. C. C. Villari, C. Wrede, and I. T. Yandow, “First penning trap mass measurement of 36Ca,” (2020), arXiv:2005.03103 [nucl-ex] .
- Ringle et al. (2007) R. Ringle, T. Sun, G. Bollen, D. Davies, M. Facina, J. Huikari, E. Kwan, D. Morrissey, A. Prinke, J. Savory, et al., Physical Review C 75, 055503 (2007).
- Anne et al. (1987) R. Anne, D. Bazin, A. Mueller, J. Jacmart, and M. Langevin, Nuclear Instruments and Methods in Physics Research Section A: Accelerators, Spectrometers, Detectors and Associated Equipment 257, 215 (1987).
- Ottini-Hustache et al. (1999) S. Ottini-Hustache, C. Mazur, F. Auger, A. Musumarra, N. Alamanos, B. Cahan, A. Gillibert, A. Lagoyannis, O. Maillard, E. Pollacco, J. Sida, and M. Riallot, Nuclear Instruments and Methods in Physics Research Section A: Accelerators, Spectrometers, Detectors and Associated Equipment 431, 476 (1999).
- Koyama et al. (2020) S. Koyama, D. Suzuki, M. Assié, N. Kitamura, L. Lalanne, M. Niikura, H. Otsu, T. K. Saito, and O. Sorlin, to be submitted to NIM A (2020).
- Pollacco et al. (2005) E. Pollacco, D. Beaumel, P. Roussel-Chomaz, E. Atkin, P. Baron, J. Baronick, E. Becheva, Y. Blumenfeld, A. Boujrad, A. Drouart, et al., in The 4th International Conference on Exotic Nuclei and Atomic Masses (Springer, 2005) pp. 287–288.
- Wang et al. (2017) M. Wang, G. Audi, F. G. Kondev, W. Huang, S. Naimi, and X. Xu, Chinese Physics C 41, 030003 (2017).
- Herfurth et al. (2001) F. Herfurth, J. Dilling, A. Kellerbauer, G. Audi, D. Beck, G. Bollen, H.-J. Kluge, D. Lunney, R. B. Moore, C. Scheidenberger, S. Schwarz, G. Sikler, J. Szerypo, and I. Collaboration, Phys. Rev. Lett. 87, 142501 (2001).
- Matta et al. (2016) A. Matta, P. Morfouace, N. de Séréville, F. Flavigny, M. Labiche, and R. Shearman, Journal of Physics G: Nuclear and Particle Physics 43, 045113 (2016).
- Gray et al. (1970) W. Gray, P. Ellis, T. Wei, R. Polichar, and J. Jänecke, Nuclear Physics A 140, 494 (1970).
- Valiente-Dobón et al. (2018) J. J. Valiente-Dobón, A. Poves, A. Gadea, and B. Fernández-Dominguez, Physical Review C 98, 011302 (2018).
- Pronko and Lindgren (1972) J. Pronko and R. Lindgren, Nuclear Instruments and Methods 98, 445 (1972).
- Brown (2011) A. Brown, “https://people.nscl.msu.edu/brown/reaction-codes/wspot.for,” (2011).
- Bohr and Mottelson (1998) A. Bohr and B. Mottelson, Nuclear Structure, Nuclear Structure, Vol. 1 (World Scientific, 1998).
- Longland et al. (2010) R. Longland, C. Iliadis, A. Champagne, J. Newton, C. Ugalde, A. Coc, and R. Fitzgerald, Nuclear Physics A 841, 1 (2010), the 2010 Evaluation of Monte Carlo based Thermonuclear Reaction Rates.