The Changing Lightcurve of the Double-Mode RR Lyrae Variable Star V338 Boo
Abstract
We present an analysis of the lightcurve extracted from Transiting Exoplanet Survey Satellite Full Frame Images of the double-mode RR Lyrae V338 Boo. We find that the fundamental mode pulsation is changing in amplitude across the 54 days of observations. The first overtone mode pulsation also changes, but on a much smaller scale. Harmonics and combinations of the primary pulsation modes also exhibit unusual behavior. Possible connections with other changes in RR Lyrae pulsations are discussed, but a full understanding of the cause of the changes seen in V338 Boo should shed light on some of the most difficult and unanswered questions in stellar pulsation theory, and astrophysics more generally.
1 Introduction
V338 Boo was first reported as a double-mode RR Lyrae star (RRd) by Oaster et al. (2006) using the Northern Sky Variability Survey (NSVS, Woźniak et al., 2004) data. Although the period ratio of the two modes of pulsation fell within the normal range ( = 0.743), the ratio of the amplitudes of the two pulsations was found to be strange - the fundamental mode amplitude was twice as large as the first overtone mode. Follow-up observations were published in 2010 (Hurdis & Krajci, 2010) and 2012 (Hurdis & Krajci, 2012) which showed that the amplitude ratio was changing over the course of several years.
Given the ID 5222076 in the NSVS and the name V338 Boo by the General Catalog of Variable Stars (GCVS, Samus et al., 2017), the Transiting Exoplanet Survey Satellite (TESS, Ricker et al., 2015) observed this star with a TESS input catalog (TIC) ID of 282941520 in Sectors 23 (camera 3) and 24 (camera 2), which covered the dates March 18 - April 16, 2020 and April 16 - May 13, 2020, respectively. These observations provide two major advantages over ground-based observations obtained previously. The most obvious is the increased precision of the photometric measurements. Arguably more important, however, is the continuous monitoring of the star for almost two months.
In this Letter we present an analysis of TESS Full Frame Images (FFIs) of V338 Boo showing the changing amplitude ratio is still ongoing, and we provide a more detailed description of its behavior.
2 Analysis
Initial data analysis was performed with the python package
A TESS Archive RR Lyrae Classifier
(ATARRI, Carrell, 2021). This graphical user
interface (GUI) uses the search_tesscut functionality
(Brasseur et al., 2019) provided by the lightkurve python package
(Lightkurve Collaboration et al., 2018) to download cutouts of the TESS FFIs and present
the data and preliminary analysis for quick visual inspection.
ATARRI is listed on the Astrophysics Source
Code Library (ASCL) website and provides the user with the ability
to verify the quality of the cutout image and eliminate bad data
points from the presented lightcurve. It also has the Fourier
analysis of the lightcurve visible, as well as a folded
lightcurve. This GUI is meant to quickly and easily present
information to the user in order to classify the RR Lyrae star into
a type, and to look for behavior that would require a more detailed
follow-up analysis. More information about the ATARRI
package is available in the ASCL and in the GitHub repository
hosting the code.
The initial inspection of V338 Boo indicated
a detailed follow-up was warranted.
The full analysis of V338 Boo used the same python packages as
ATARRI to download FFI data. A threshold mask was used to
determine the correct aperture and background from the cutouts and to
extract lightcurves from the data. We convert the background
subtracted flux to a magnitude using the value provided in the
TIC of Tmag = 12.5954.
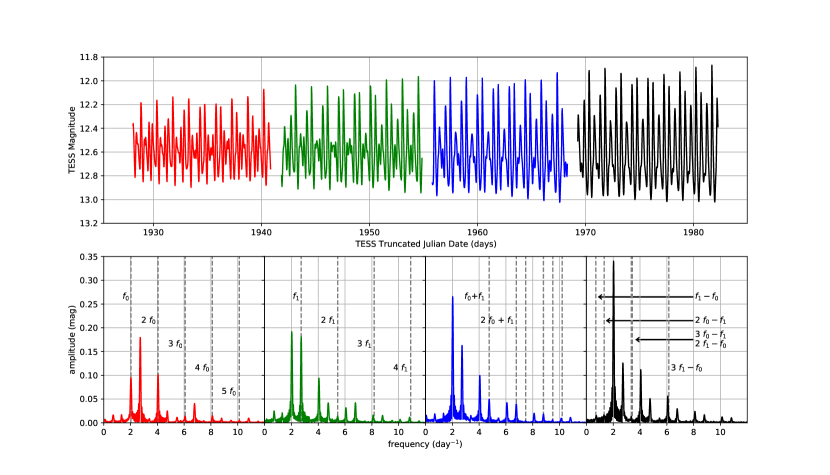
The top panel of Figure 1 shows the full lightcurve
of V338 Boo from TESS Sectors 23 and 24. There is a
definite change in both the pulsation amplitude and shape of the lightcurve
across the 54 days it was observed.
In the bottom panels of Figure 1 we
show a frequency analysis of the data using Period04
(Lenz & Breger, 2005). The data
has been segmented and is color-coded between the upper and lower
plots. The changing pulsation cycles in the upper plot can be more
clearly seen in the frequency analysis of the segments. In particular,
the fundamental mode amplitude peak at frequency 2.02464 d-1 more
than doubles between the first and last segments, and changes from a
secondary peak to the dominant one compared to the first overtone mode
peak at 2.72454 d-1.
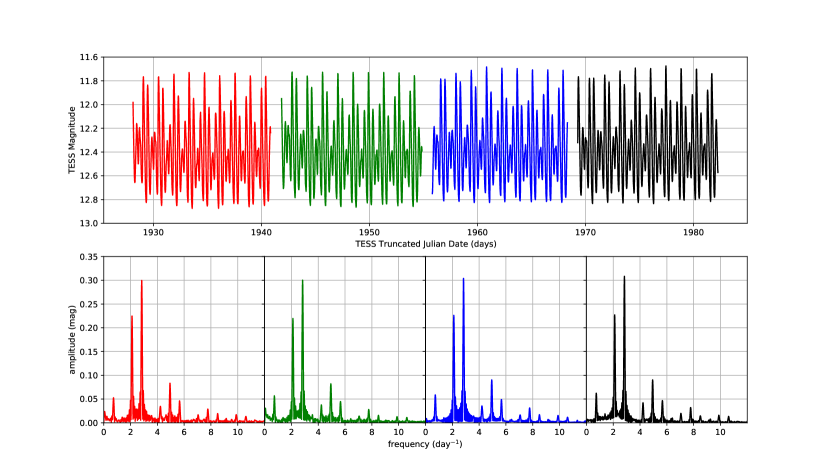
As a comparison, we performed the same analysis on the RRd star NN Boo, which has a similar TESS magnitude (12.387) and was observed in the same sectors as V338 Boo (but in different cameras - 2 and 1 respectively for Sectors 23 and 24). Figure 2 shows the analysis for NN Boo. The behavior of NN Boo is typical of a normal RRd variable - the first overtone pulsation is dominant in the frequency analysis, and the roughly 3:4 ratio of the frequencies of the pulsation modes is evident in the pulsation pattern of the stable lightcurve. Most importantly for this analysis, the peak amplitudes for both the fundamental and first overtone modes are constant.
To examine the change in the lightcurve of V338 Boo in more detail, we performed a frequency analysis of samples of five day increments, shifting by 2.5 days. In Figure 3 we show how the amplitudes of the primary frequencies (top left) and next three harmonics change over time.
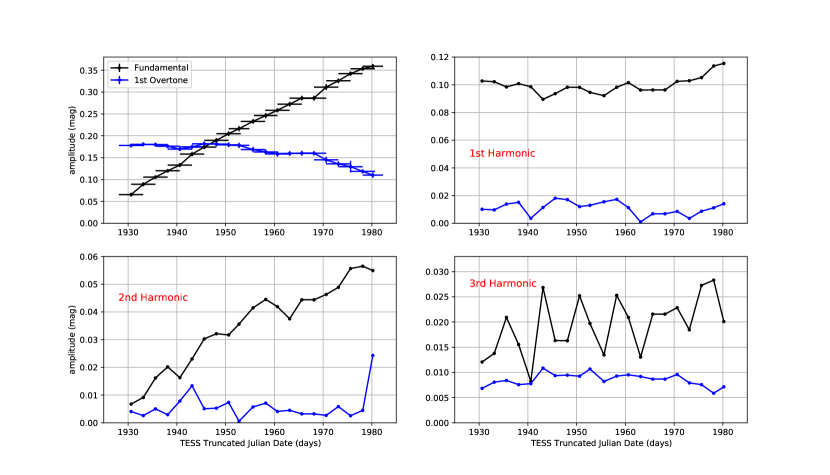
The change of the fundamental mode from a secondary peak to the primary peak is clearly evident. The fundamental mode peak changes from a value of 0.07 mag in the first five days of observations to a value of 0.36 mag in the last five days. This factor of five increase is much larger than the decrease experienced by the first overtone mode peak, which starts with a value of 0.18 mag and ends with a value of 0.11 mag.
The harmonics of the fundamental mode display peculiar trends. The first harmonic does not change in amplitude during these observations. The second harmonic, however, changes by almost a factor of ten - it goes from 0.006 to 0.055 mag.
Additionally, the peak amplitude of the first harmonic of the fundamental mode is larger than the amplitude of the fundamental mode peak itself for an extended period in the beginning of the observations. This can also be seen in the frequency analysis of the first segment of data in Figure 1.
An analysis of the frequency of the primary peaks in the five day samples shows that there is small variations but no obvious trends in the data similar to those seen in Figure 3. Furthermore, our frequencies of = 2.02464 0.00008 d-1 and = 2.72454 0.00018 d-1 agree well with the results of Oaster et al. (2006) - our = 0.4939 d and = 0.3670 d compared to their = 0.4940 d and = 0.3668 d.
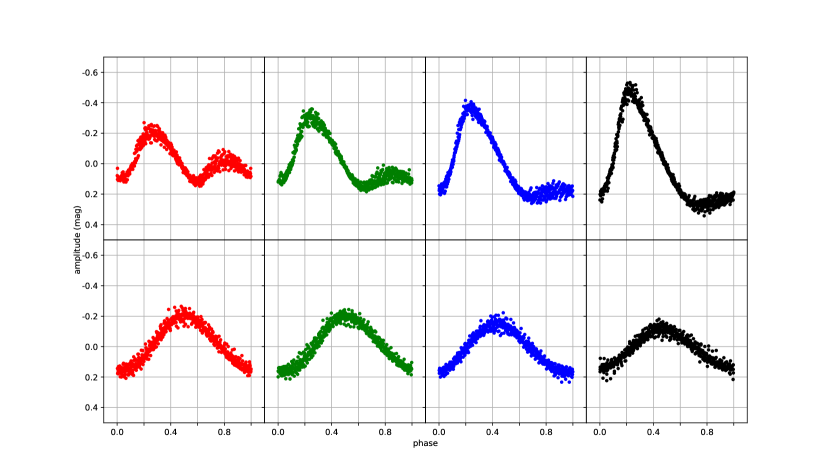
As a further analysis, we examine the separated, folded lightcurves of each segment of the V338 Boo TESS data. For each segment, we fit each pulsation mode and the next four harmonics for each, and combinations of the two modes for those with frequencies less than approximately 8 d-1. In the top row of Figure 4 is the fundamental mode folded lightcurve obtained by subtracting out the first overtone mode, its next four harmonics, and the combined frequencies. The phase has been shifted by the same constant offset for each segment for clarity. The bottom row shows the first overtone mode obtained after subtracting the fundamental mode, its next four harmonics, and the combined frequencies. The phase for these have been shifted by the same constant offset for each segment for clarity as well, although with a different offset than the fundamental mode. The fundamental mode lightcurve grows in amplitude going from left to right, which is what is seen in the Fourier analysis presented above. Also, the first segment of data (top left plot of Figure 4) has a pronounced bump at a phase of 0.8. As the amplitude grows, this bump decreases. The presence of the bump is what causes the first harmonic peak of the fundamental mode to be large in the first segment, and as the bump disappears, the growing amplitude of the fundamental mode pulsation balances out this peak in the Fourier analysis. The folded lightcurves for the first overtone mode have very slight changes in comparison, again matching what is seen above. There is a small decrease in the amplitude, and there appears to be a small phase shift of the peak.
The changes in the lightcurve of V338 Boo in some ways resemble changes seen by Chadid et al. (2014) in the lightcurve of the RRab variable S Arae. They saw the amplitude of a bump in the lightcurve and the overall shape of the lightcurve change as a function of the Blazhko phase for the star. The changes seen here are similar, and are also in the fundamental mode pulsation, which could mean we are seeing the same phenomenon in the RRd star V338 Boo. Follow-up observations and further analysis are required to confirm this.
Because of the large pixel size of TESS, contamination from other sources can be a major concern. The contamination ratio calculated for V338 Boo in the TIC is 0.1109609 and there are three objects within one arcminute of the star. Two of the three are much fainter than V338 Boo: one at 14.6 arcseconds with a TESS magnitude of 17.68, and one at 57.6 arcseconds with a TESS magnitude of 17.74. The star 24.0 arcseconds away has a TESS magnitude of 14.08, which is about one and a half magnitudes fainter than V338 Boo. The next closest star with a TESS magnitude brighter than 15 is over two arcminutes away. Contamination from non-variable sources will contribute extra flux and affect amplitude changes. However, they will not change the frequency analysis or overall properties of its changes. If there were a nearby variable source contributing significantly to the lightcurve of V338 Boo, we would see additional peaks in the Fourier analysis. However, the fundamental and first overtone pulsation peaks we find agree with previous results, and we find no other significant peaks in the Fourier analysis that are not associated with these two modes, their harmonics, and their combinations, which gives us confidence that contamination from nearby sources does not significantly affect our results.
3 Discussion
3.1 Is this new?
An obvious question arises in light of this new data: Is the behavior new or was V338 Boo changing this way in previous data as well?
As an attempt to answer this question, we randomly sampled the TESS data in a manner that would be similar to ground-based observations. Since observing from the ground only allows for roughly half day windows, we randomly selected 20 days from the full data set and took the first half day of observations for each day. A frequency analysis was performed on these random 20 half-day samples and the amplitude ratio of the fundamental mode to first overtone mode peaks are given in Table 1. This table also provides the same ratio measured by previous studies. We note that our 20 “night” sample is more than the follow-up observations of Oaster et al. (2006) (16 nights), Hurdis & Krajci (2010) (13 and 4 nights), and Hurdis & Krajci (2012) (10 and 12 nights), and that the window of observations of TESS (54 days) is shorter than those taken previously (between 66 and 108 days). With the integration time of TESS FFIs (30 mins) being much longer than these previous results, however, we increased the number of days in our random samples to give more points for the frequency analysis. Table 1 compares the amplitude ratios of the previous results with those from our random samples. The full range of amplitude ratios is reproduced in our random samples, but we generally find lower ratios than those reported previously. The lightcurves of RR Lyrae can exhibit differences in different passbands, notably in the infrared (Jurcsik et al., 2018), but the TESS passband encompasses the I band (and extends both bluer and redder), which makes comparison between those amplitude ratios and the TESS ones in Table 1 more meaningful. We therefore suggest that V338 Boo has been exhibiting transient, fast (tens or hundreds of days) changes in the fundamental mode amplitude since detailed observations of it began in 2005 at the very least. It is also likely that we are not seeing the full range of change in our sample of two TESS sectors. The higher amplitude ratios of previous results suggest that either we are not seeing the maximum amplitude ratio in these observations, and/or that the change of the fundamental mode peak amplitude spends more time at the higher values than the lower.
| previous results | random samples from TESS | |
| V band values | Tmag values | |
| Oaster et al. (2006) | 1.93 | 1.21 |
| Hurdis & Krajci (2010) | 1.76 0.03 (2008) | 1.24 |
| 1.48 0.01 (2009) | 1.25 | |
| Hurdis & Krajci (2012) | 1.40 0.02 (2010) | 1.28 |
| 1.82 0.02 (2011) | 1.36 | |
| I band values | 1.38 | |
| Hurdis & Krajci (2010) | 1.56 0.06 (2008) | 1.43 |
| 1.52 0.03 (2009) | 1.45 | |
| Hurdis & Krajci (2012) | 1.38 0.03 (2010) | 1.69 |
| 1.81 0.03 (2011) | 1.88 | |
3.2 Possible interpretations
We have shown that what was previously believed to be slow changes in the lightcurve of V338 Boo over the course of years is actually changes on the timescale of several tens of days. Obviously, interpretations of physical mechanisms behind this behavior must now be revisited.
Although there are few examples, RR Lyrae have been found to switch their pulsation modes in the past. The variable V79 in M3 was seen to change modes in 1992 (Kaluzny et al., 1998) and then change back to its original mode in 2007 (Goranskij et al., 2010). The Optical Gravitational Lensing Experiment (OGLE) has found four examples of RR Lyrae changing modes (Soszyński et al., 2014a, b; Poleski, 2014) and the Catalina Sky Survey (CSS) found six (Drake et al., 2014). The commonality found between all of these mode-switching RR Lyrae is they all appear to change from a double-mode pulsation (RRd) to a fundamental mode only pulsation (RRab) or vice versa. It is tempting to attribute the behavior we see to mode-switching, or an intermediate state of it. However, V338 Boo has always been observed to have both pulsation modes present, and in previous cases of mode-switching the time of fundamental mode only pulsations showed no signs of first overtone pulsations. Our window of observations from TESS ends with the fundamental mode still increasing in amplitude, so we cannot rule out the possibility that there was a full mode-switch to an RRab type after these observations. Given the fact that it appears the change in fundamental mode peak amplitude has been ongoing since 2005, we find it unlikely that this set of observations occurred just before a complete change in that behavior. If V338 Boo is experiencing changes in its pulsation due to evolutionary effects (e.g. Buchler & Kolláth, 2002), the timescale for that change is much longer than both what was seen in previous mode-switching stars and in the thermal timescale. Follow-up observations are necessary to determine the physical properties of this star in order to compare with the narrow range of parameter space seen in stable double-mode pulsations from hydrodynamic simulations (Szabó et al., 2004) and what that means for its evolutionary stage.
Some double-mode RR Lyrae have been labeled as “anomalous” by some authors for a variety of reasons. Soszyński et al. (2016) find 22 examples of RRd stars in the Magellanic Clouds with properties different than those of “regular” RRd type. Specifically, they find period ratios of the first overtone to fundamental mode below what is typically found, fundamental mode peak amplitudes larger than the first overtone mode, and long-term changes of the amplitudes of the pulsation modes. While V338 Boo has a period ratio in the “normal” range for RRd, the fundamental mode peak is larger than the first overtone in previous results and in most of the TESS observation window. Additionally, analysis of the TESS lightcurve shows both a changing fundamental and first overtone mode pulsation amplitude. It is important to note that Soszyński et al. (2016) find changes in amplitude by looking for sidebands to the radial mode frequencies, which are indicative of the Blazhko effect (Blažko, 1907) since the sidebands are formed from the combination of the pulsation and Blazhko peaks. Of their sample of 22 anomalous RRd, 18 have radial mode frequencies with sidebands, and 11 of those were found to have modulations in the fundamental mode exclusively. Even though the TESS observation window for V338 Boo is too short to make a clear determination of sidebands, as previously discussed, the peak amplitude of the fundamental mode changes significantly during the TESS observations. If V338 Boo were a single-mode pulsator (RRab or RRc) it would undoubtedly be classified as a Blazhko type. Additionally, the behavior reported here is in some ways similar to the modulation effects seen by Smolec et al. (2015). However, as in Soszyński et al. (2016), their sample has lower period ratios than typical RRd variables and is from a specific population (the Galactic bulge).
A few facts about this dataset are obvious. First, although the primary peak of the fundamental mode pulsation is dramatically changing and the second harmonic of the peak also changes, the first harmonic of the fundamental mode changes very little. Second, the combination peak increases in a similar fashion to the primary fundamental mode peak. Also, the peak at a frequency of 6.77 d-1 is quite large - it is the fourth highest peak in the first segment of data in Figure 1. Strangely, however, this combination peak does not increase in amplitude with the fundamental mode change, and it actually decreases in the last segment of data when the fundamental mode is the largest. There is also a peak at a frequency of 3.4 d-1 that corresponds to the combination , although it has a low S/N. In Soszyński et al. (2016), it was claimed that the anomalous behavior of RRd stars in the Magellanic Clouds could be due to a resonance with the second overtone radial pulsation mode. In this scenario, the resonance . This gives , which corresponds to the peak we see at 3.4 d-1, and the first harmonic of this peak () would be approximately at our peak at 6.77 d-1. Therefore, the constant peak at 6.77 d-1 could potentially be caused by an increasing contribution of the fundamental mode coupled with a decreasing contribution of the second overtone mode.
4 Conclusion
We have presented the lightcurve of V338 Boo from TESS FFI data. A Fourier analysis of this RRd star shows several peculiar behaviors.
-
•
The fundamental mode pulsation peak changes dramatically over the course of these observations - starting as a secondary peak and becoming the dominant peak. To our knowledge, this is the first time a change of this magnitude and on this timescale has been reported, and the first time there has been a change reported in the dominant pulsation mode of an RRd with a normal period ratio.
-
•
The change seen here in the fundamental mode can explain changes in the ratio of the amplitudes of the fundamental to first overtone modes seen over several years in previous studies.
-
•
Despite the large change in the fundamental mode peak, its first harmonic remains relatively constant during the same period.
-
•
Some combination peaks of the fundamental and first overtone modes also display changing amplitudes, but there are notably some that do not, including the peak at .
The relative brightness of V338 Boo makes it a perfect star for follow-up observations necessary to more fully describe the behavior seen here and to explore possible explanations. Photometry is needed to ensure that a full mode-switch from RRd to RRab did not occur after these observations. TESS will reobserve this star in Cycle 4, which can be used to verify and extend these results or determine that a full mode-switch has occurred. Spectroscopy will aid by showing how the outer layers of this star are physically moving, and if there is any anomalous behavior in that motion. Caution must be taken in any follow-up observations, however, because as was seen with previous results, the period of pulsations and the change seen in the fundamental mode peak amplitude will affect the results.
An explanation for the strange behavior exhibited by V338 Boo could potentially shed light on some of the longest and most difficult unanswered questions in all of astrophysics. In particular, these changes could be related to the Blazhko effect, which would provide a new window into how this effect behaves. On the other hand, if V338 Boo is a mode-switching variable, its apparent transient behavior could set physical constraints on the manner and timescale of the mode-switching phenomenon. Whichever the case, V338 Boo is an unusual and exciting star for future observations.
References
- Blažko (1907) Blažko, S. 1907, Astronomische Nachrichten, 175, 325
- Brasseur et al. (2019) Brasseur, C. E., Phillip, C., Fleming, S. W., Mullally, S. E., & White, R. L. 2019, Astrocut: Tools for creating cutouts of TESS images, , , ascl:1905.007
- Buchler & Kolláth (2002) Buchler, J. R., & Kolláth, Z. 2002, ApJ, 573, 324
- Carrell (2021) Carrell, K. W. 2021, ATARRI: A TESS Archive RR Lyrae Classifier, , , ascl:2105.003
- Chadid et al. (2014) Chadid, M., Vernin, J., Preston, G., et al. 2014, AJ, 148, 88
- Drake et al. (2014) Drake, A. J., Graham, M. J., Djorgovski, S. G., et al. 2014, ApJS, 213, 9
- Goranskij et al. (2010) Goranskij, V., Clement, C. M., & Thompson, M. 2010, in Variable Stars, the Galactic halo and Galaxy Formation, ed. C. Sterken, N. Samus, & L. Szabados, 115
- Hurdis & Krajci (2010) Hurdis, D. A., & Krajci, T. 2010, Journal of the American Association of Variable Star Observers (JAAVSO), 38, 1
- Hurdis & Krajci (2012) —. 2012, Journal of the American Association of Variable Star Observers (JAAVSO), 40, 268
- Jurcsik et al. (2018) Jurcsik, J., Hajdu, G., Dékány, I., et al. 2018, MNRAS, 475, 4208
- Kaluzny et al. (1998) Kaluzny, J., Hilditch, R. W., Clement, C., & Rucinski, S. M. 1998, MNRAS, 296, 347
- Lenz & Breger (2005) Lenz, P., & Breger, M. 2005, Communications in Asteroseismology, 146, 53
- Lightkurve Collaboration et al. (2018) Lightkurve Collaboration, Cardoso, J. V. d. M., Hedges, C., et al. 2018, Lightkurve: Kepler and TESS time series analysis in Python, Astrophysics Source Code Library, , , ascl:1812.013
- Oaster et al. (2006) Oaster, L., Smith, H. A., & Kinemuchi, K. 2006, PASP, 118, 405
- Poleski (2014) Poleski, R. 2014, PASP, 126, 509
- Ricker et al. (2015) Ricker, G. R., Winn, J. N., Vanderspek, R., et al. 2015, Journal of Astronomical Telescopes, Instruments, and Systems, 1, 014003
- Samus et al. (2017) Samus, N. N., Kazarovets, E. V., Durlevich, O. V., Kireeva, N. N., & Pastukhova, E. N. 2017, Astronomy Reports, 61, 80
- Smolec et al. (2015) Smolec, R., Soszyński, I., Udalski, A., et al. 2015, MNRAS, 447, 3756
- Soszyński et al. (2014a) Soszyński, I., Dziembowski, W. A., Udalski, A., et al. 2014a, Acta Astron., 64, 1
- Soszyński et al. (2014b) Soszyński, I., Udalski, A., Szymański, M. K., et al. 2014b, Acta Astron., 64, 177
- Soszyński et al. (2016) Soszyński, I., Smolec, R., Dziembowski, W. A., et al. 2016, MNRAS, 463, 1332
- Szabó et al. (2004) Szabó, R., Kolláth, Z., & Buchler, J. R. 2004, A&A, 425, 627
- Woźniak et al. (2004) Woźniak, P. R., Vestrand, W. T., Akerlof, C. W., et al. 2004, AJ, 127, 2436