Network and Sequence-Based Prediction of Protein-Protein Interactions
Abstract
Background: Typically, proteins perform key biological functions by interacting with each other. As a consequence, predicting which protein pairs interact is a fundamental problem. Experimental methods are slow, expensive, and may be error prone. Many computational methods have been proposed to identify candidate interacting pairs. When accurate, they can serve as an inexpensive, preliminary filtering stage, to be followed by downstream experimental validation. Among such methods, sequence-based ones are very promising.
Results: We present, a new algorithm that leverages both topological and biological information to predict protein-protein interactions. We comprehensively compare our Framework with state-of-the-art approaches on reliable PPIs datasets, showing that they have competitive or higher accuracy on biologically validated test sets.
Conclusion: We shown that topological plus sequence-based computational methods can effectively predict the entire human interactome compared with methods that leverage only one source of biological information.
1 Introduction
Protein-Protein Interactions (PPIs) play a crucial role in several biological processes since, in many cases, proteins perform vital functions by interacting with each other in the formation of protein complexes. The identification of new Protein-Protein interactions is thus crucial in understanding cells’ biological mechanisms. Furthermore, knowledge of the interactions can be exploited for applications such as drug repurposing , which leverages network topology to predict drug-disease associations, or network-based approaches to disease-gene prioritization , which leverage the PPI network to find new candidate disease genes. Consequently, charting protein-protein interaction maps remains a fundamental goal in biological research.
Protein-protein interactions can be most readily identified by protein affinity chromatography or pull-down experiments, yeast two-hybrid screens, or purifying protein complexes that have been tagged in vivo. These methods are all labor and time consuming and have a high cost associated with them. Each of them has inherent advantages and disadvantages. For instance, the yeast two-hybrid system has the advantage of identifying the direct interaction between protein pairs. However, data gathered using this method may contain a high (as much as 50%) rate of false positives. Therefore, in the absence of other lines of evidence, this data alone cannot be considered biologically significant. The high cost and the technical limitations associated with such biochemical approaches have resulted in a growing need for the development of computational tools capable of identifying prospective protein-protein interactions.
Several tools have been designed for this purpose over the past few years. Some of these approaches predict protein interactions using the primary structure of proteins themselves. In this line of research, SPRINT[1] and PIPE[2] are two well-known algorithms that rely on the same underlying hypothesis: a pair of proteins similar to a pair of interacting proteins have a higher chance to interact. In this line of thought, some very promising approaches, like L3 and SIM, leverage network topology to define the notion as mentioned earlier of similarity.
We propose a new framework that can exploit topological and biological information to predict protein-protein interactions. The algorithm relies on the underlying hypothesis that two proteins interact in proportion to the structural similarity that one has with the most similar of the interactors of the other. From a topological perspective, the structural similarity between two proteins is proportional to the number of common neighbors. Instead, from a biological perspective, the structural similarity between two proteins is proportional to the similarity of their primary sequences.
We compare our framework with the state-of-art approaches on several synthetic and Human PPI networks. We show that it outperforms many heuristics in predicting protein interactions. Moreover, candidate protein pairs prioritized by our algorithm are involved in the same biological processes, molecular functions, and cellular components. Finally, a subset of the candidate protein pairs predicted by our framework has been experimentally validated by Xu-Wen Wang et al.
2 Materials and Methods
2.1 Scoring Protein Interaction
One way to detect protein-protein interaction consists of look at each interactor’s tertiary structure to find complementary binding sites. However, compared to topological and protein’s primary structure, the protein’s shape information (tertiary and quaternary structure) is scarce. This lack of information is consequence of the expensive cost to discover the tertiary structure of proteins using new technologies. Network-based approaches, that score the likelihood to have a direct interaction between a protein pair, do not need any protein’s structure information, but they can infer it leveraging network topology. Furthermore, the increasing coverage of the interactome has inspired the development of network-based algorithms, which exploit the patterns characterizing already mapped interactions to identify missing interactions. The problem of identifying new links in the interactome is known as link prediction problem . To predict new links in the network several types of measures have been studies and proposed. The most promising measures used in link prediction problem relies on two different hypothesis: the hypothesis that nodes topological similar to each others (i.e nodes that shares several neighbours ) and the hypothesis that a node should be linked a candidate if it is similar to the known interactors. Figure 1 shows the different between measures that leverage the former hypothesis and those ones that exploit the latter idea.
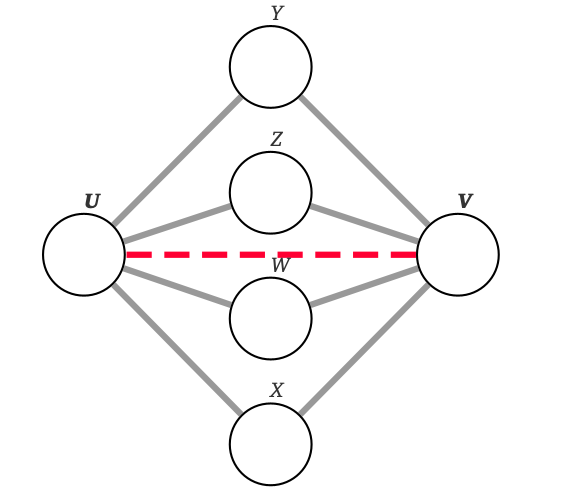
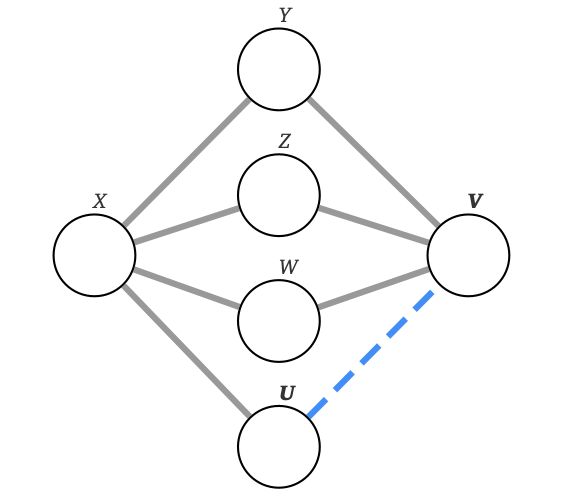
More precisely, figure 1 a) shows measures that scores a possible interaction between node and computing the number of neighbours and shares. Metrics that use this information are Jaccard Index, Common Neighbours, Adamich Adar, and . While figure 1 b) shows groups metrics that link and if is similar to ’s partner and vice-versa. Furthermore, metrics that leverage common neighbours have been widely used in link prediction problem on social network, while, metrics that leverage partner similarity are more biological driven and they are based on the hypothesis that if is similar to an ’s interactor, then and are likely to interact (i.e they shares complementary binding sites).
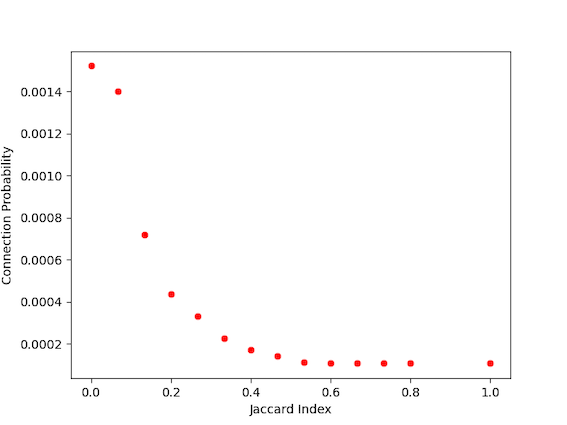
To compare these two approaches that relies on different ideas, we computed the probability of a pair to be connected in the Protein-Protein Interaction (PPI) network when Jaccard Index (figure 2 a)) and the number of three path length between (figure 2 b)) are increasing. To estimate this probability, we first computed the Jaccard Index and the number of three path length of each pair of nodes in the PPI Network G(V,E). We estimated the probability of connection in the following way:
| (1) |

Where is 1 if and 0 otherwise, while S is the set that contains all pairs with a score .
Figure 2 demonstrate that, if we use as score the Jaccard Similarity fig. 2 a) and the number of three path length fig.2 b), protein pairs with high Jaccard Similarity do not tend to interact if we compare them with (i.e. the number of 3 path length between and ). This pattern is visible on several Human and not Human PPI Network as shown in Supp. Fig. 10
2.1.1 Jaccard Index as a Measure of Protein Interface Similarity
As discussed so far, protein pairs with high jaccard similarity do not tend to interact. This could be due to the fact that proteins that shares several neighbours should have similar binding sites (i.e similar tertiary structure). To assert the validity of this hypothesis, we considered the correlation between sequence similarity and the Jaccard Index of a pair . More formally, we define the Protein sequence Similarity of as the distance between the longest sequence and the global alignment of their protein primary structures computed using the Needleman–Wunsch algorithm .
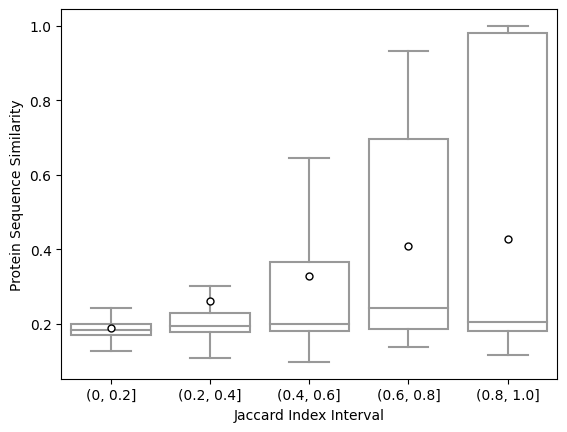
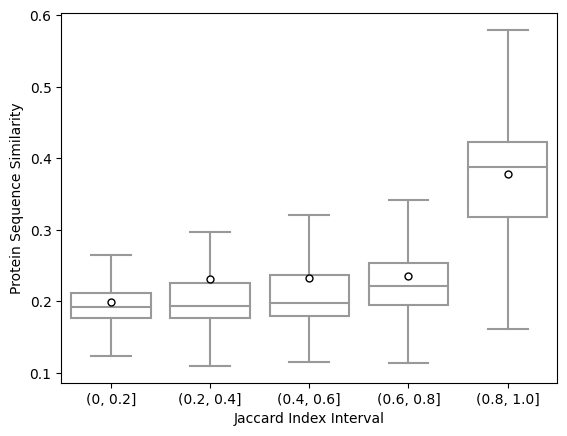
Figure 3 a) shows the correlation between Jaccard Similarity and Protein sequence similarity. To better understand the correlation between the score induced by the global alignment and the Jaccard Similarity of a protein pair, we grouped each pairs by their Jaccard Index creating four different buckets as shown in the X axes of fig. 3 a) . For each bucket, we drawn the box plot representing the overall distribution of the global alignment score of protein pairs with similar Jaccard Index. As illustrated in fig. 3 a), when the Jaccard Similarity is in the interval , protein pairs shares similar sequences. Finally, fig 3 b) illustrates the number of samples belonging to each bucket. Every bucket, with the exception of the bucket with interval , has a similar number of samples.
2.1.2 Jaccard Index as a Measure of Gene Duplication Phenomena
Jaccard Index, not only is useful to find proteins with similar structures, but it can be applied to identify proteins originated by the process of gene duplication. Indeed, in the process of evolution, genes may produce new proteins, which may retain many of the biological functions of the original ones. As we know, the structure of a proteins is related to its biological functions and thus, proteins born from the process of gene duplication should share similar interactors. To statistically quantify if proteins created by this evolutionary process show this behaviour, we downloaded from [3] a data set consisting of groups of protein products generated by the gene duplication process. Firstly, we filtered out the smallest groups, keeping only groups consisting of a large number of proteins (i.e number of proteins ) that appear in the PPI network. Secondly, for each group , we defined the Mean Jaccard Index of group () as:
| (2) |
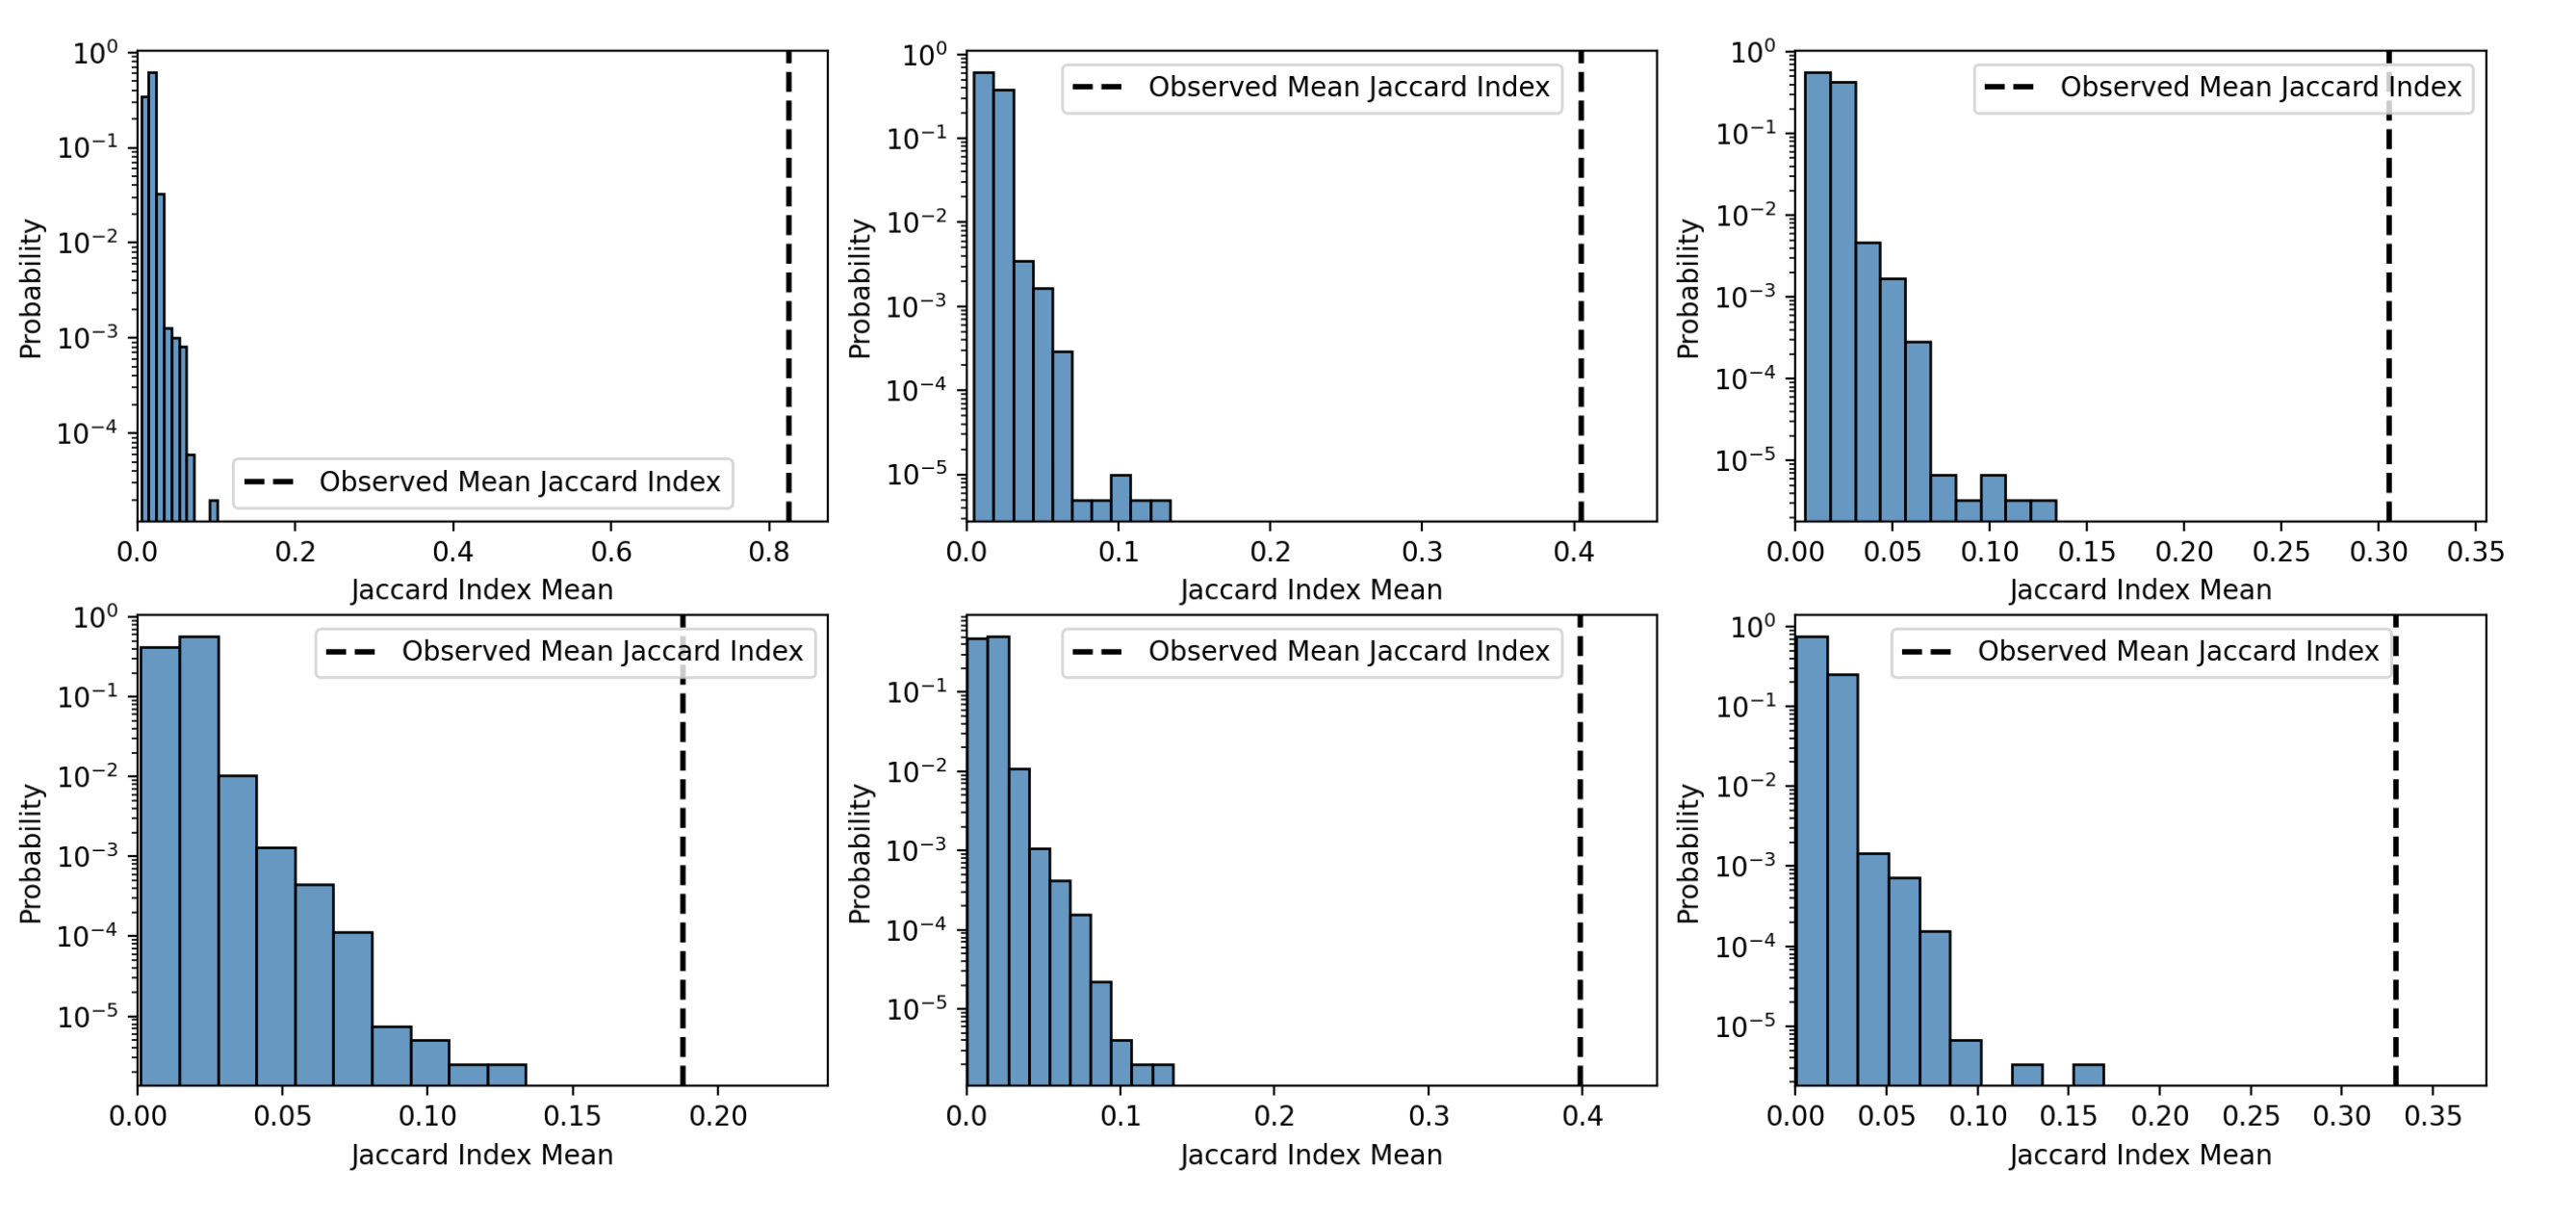
Where is the size of . Finally, we compared the value of each group’s Mean Jaccard Index with a random distribution of the score computed using random set of proteins with the same size of the original group .
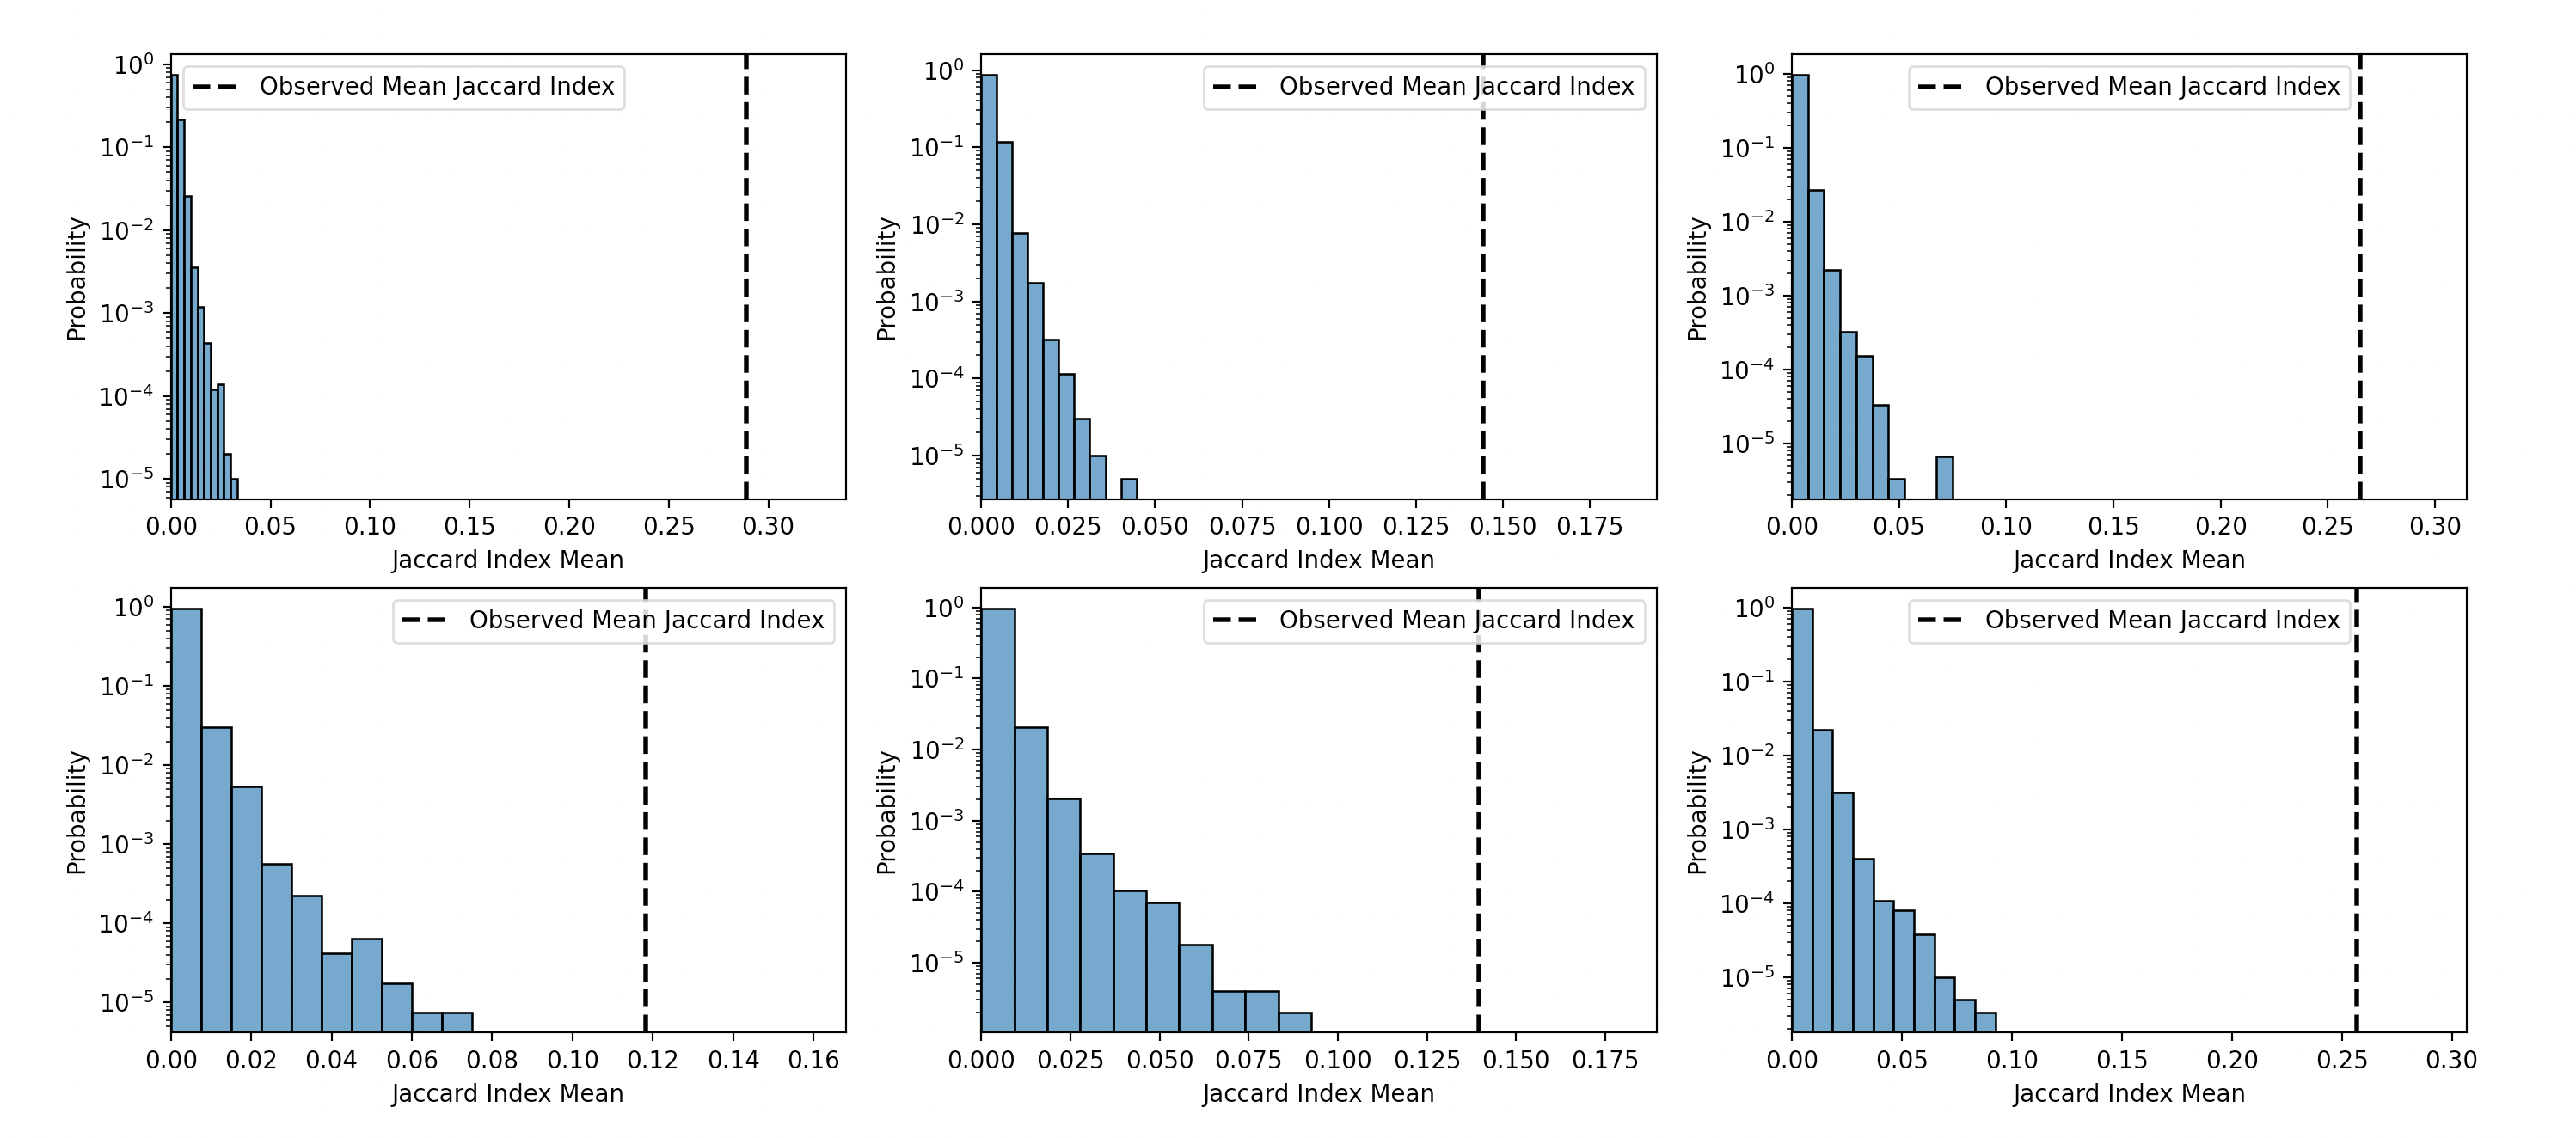
Figure 4 shows the scores of Mean Jaccard Index of the original groups and compare them with a random distribution. As illustrated by each plot, the value of the of each group is very large if we compare with the associated random distribution. Indeed, each vertical line, representing the score of each group is in the tail of each distribution. As, discussed before, each group consists of a number of proteins in the interval .
2.1.3 Jaccard Index to Model Evolutionary and Functional Similarity
The relationship between protein sequences and structures has long been a widely accepted tenet of biochemistry[4, 5]. Indeed, one of the foundations of molecular biology is that a protein’s sequence determines its structure, which determines how the protein functions.
Protein sequence–structure-function relationships have been investigated and quantified in various ways. Several studies[6, 7] have established the correlation between structural similarity and sequence similarity. Other ones[8, 9] have studied the level of sequence similarity at which structural similarity is likely to be observed. Consequently, protein primary sequence similarity indices have been widely used to capture evolutionary relationships between paralogs (i.e., homologous proteins related to a gene duplication phenomena)[10].
Consequently, we modeled a protein pairwise similarity function, named Biological Jaccard Index, that leverages the primary sequence to score the resemblance of a protein pair. In more detail, given two protein and and their associated protein sequences and , we first identify the set of k-mers 111K-mers are substrings of length contained within a general biological sequence. of each sequence and and we define the Jaccard Similarity between sets of k-mers as:
| (3) |
To statistically validate if this index was able to keep evolutionary relationships among set of proteins (Gene Duplication Phenomena), we followed the same approach discussed in Section 2.1.2. As shown in supplementary figure 11, duplicated gene sets have mean jaccard similarity grater than random expectation. Furthermore, the mean of pairwise similarities of each group is greater if Biological Jaccard Index is considered instead of the topological index. This finding might be related to the incompleteness of the interactome.
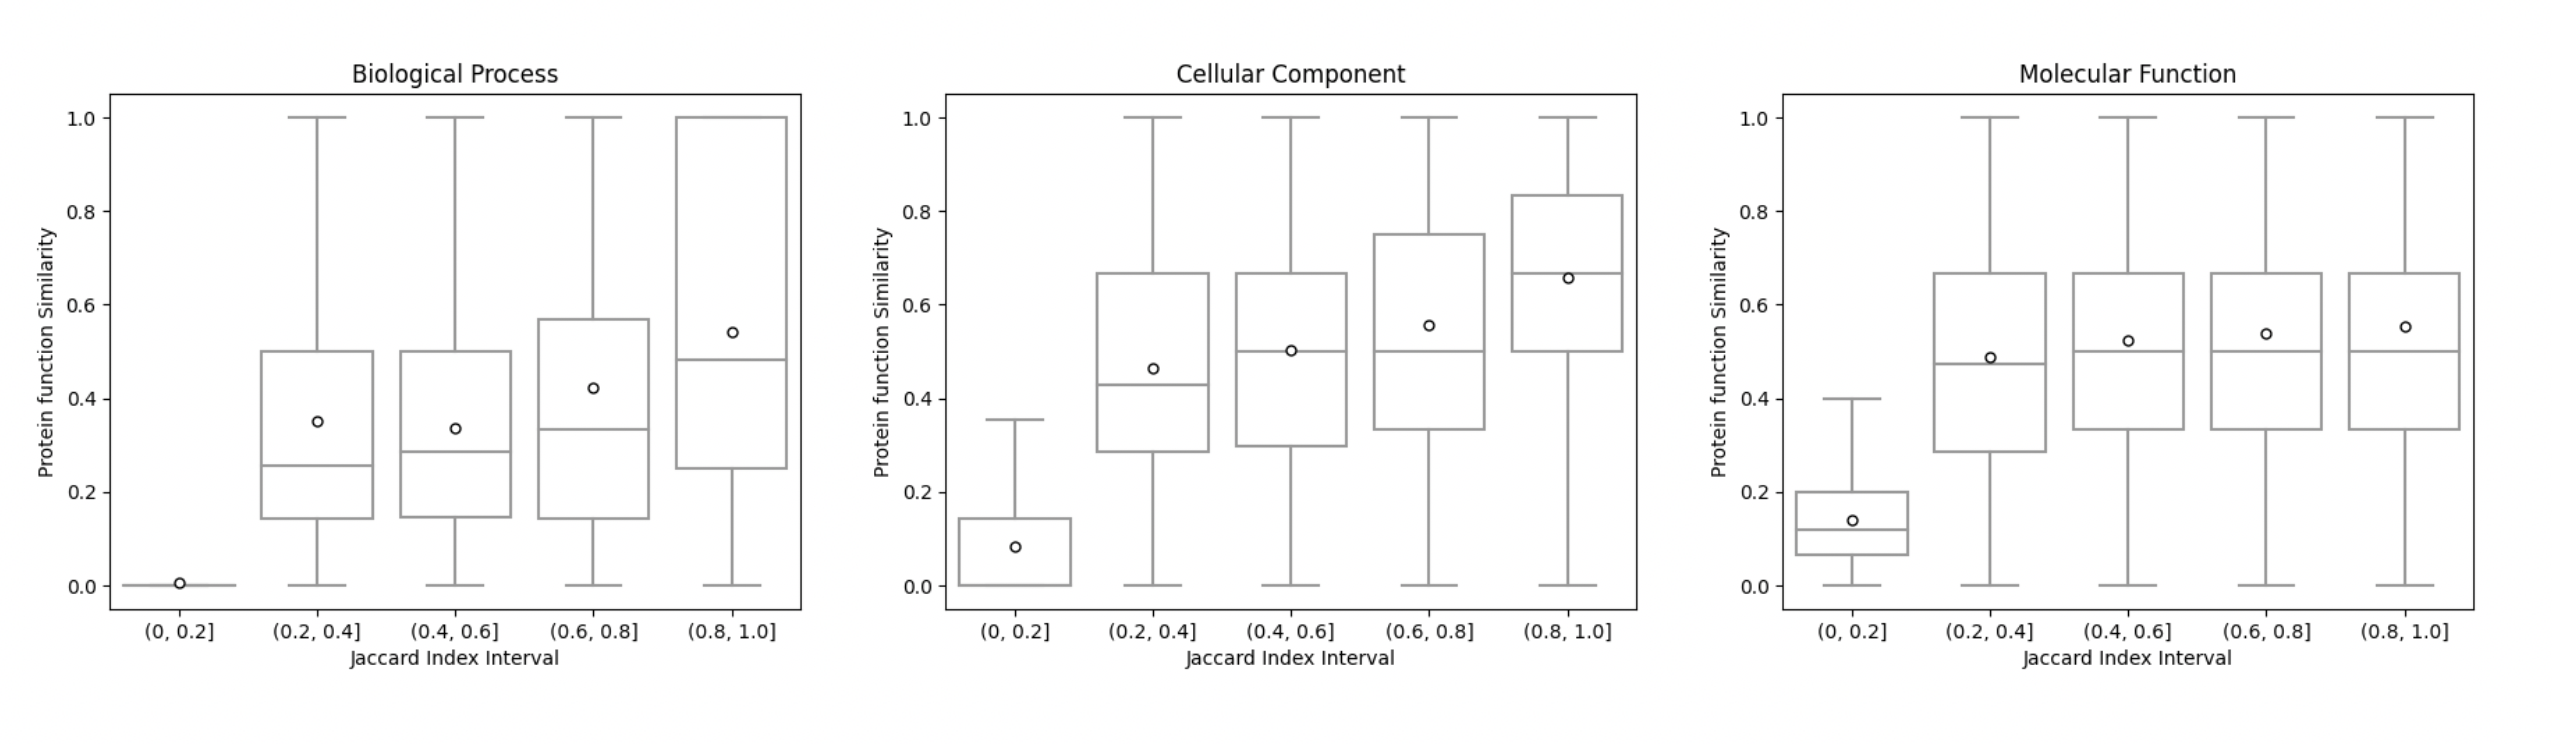
Finally, as shown by several studies[11, 12, 13], protein pairs with higher sequence similarity tend to be more functionally similar than dissimilar proteins. Indeed, Figure 5 shows the correlation between the Biological Jaccard Index and the functional similarity of a protein pair. We considered Gene Ontologies (Biological Process, Cellular Component and Molecular Function) downloaded from the Gene Ontology Consortium and we plotted the distribution of pairwise Gene Ontology similarity over the interval of the Biological Jaccard Index. All protein pairs with a Jaccard Index in the interval have several Gene Ontologies in Common if compared with pairs with low JI.
2.1.4 Model Definition
From the discussion introduced in sections 2.1.1, 2.1.2 and 2.1.3, the Similarity between a protein pairs can be used to measure the interface similarity, paralogy and functional similarity. In other words, given a protein pair , we can use the Jaccard functions to compute the similarity between and ’s neighbors. If is highly topologically or biologically similar to at least one neighbour of , then there is a good chance that shares the same binding sites (i.e has complementary binding site of ) or that it is involved in the same function of a neighbour of . Thus, we can model the probability of connection between and in two different ways: using the topological Jaccard Index or the Jaccard Index defined in equation 3.
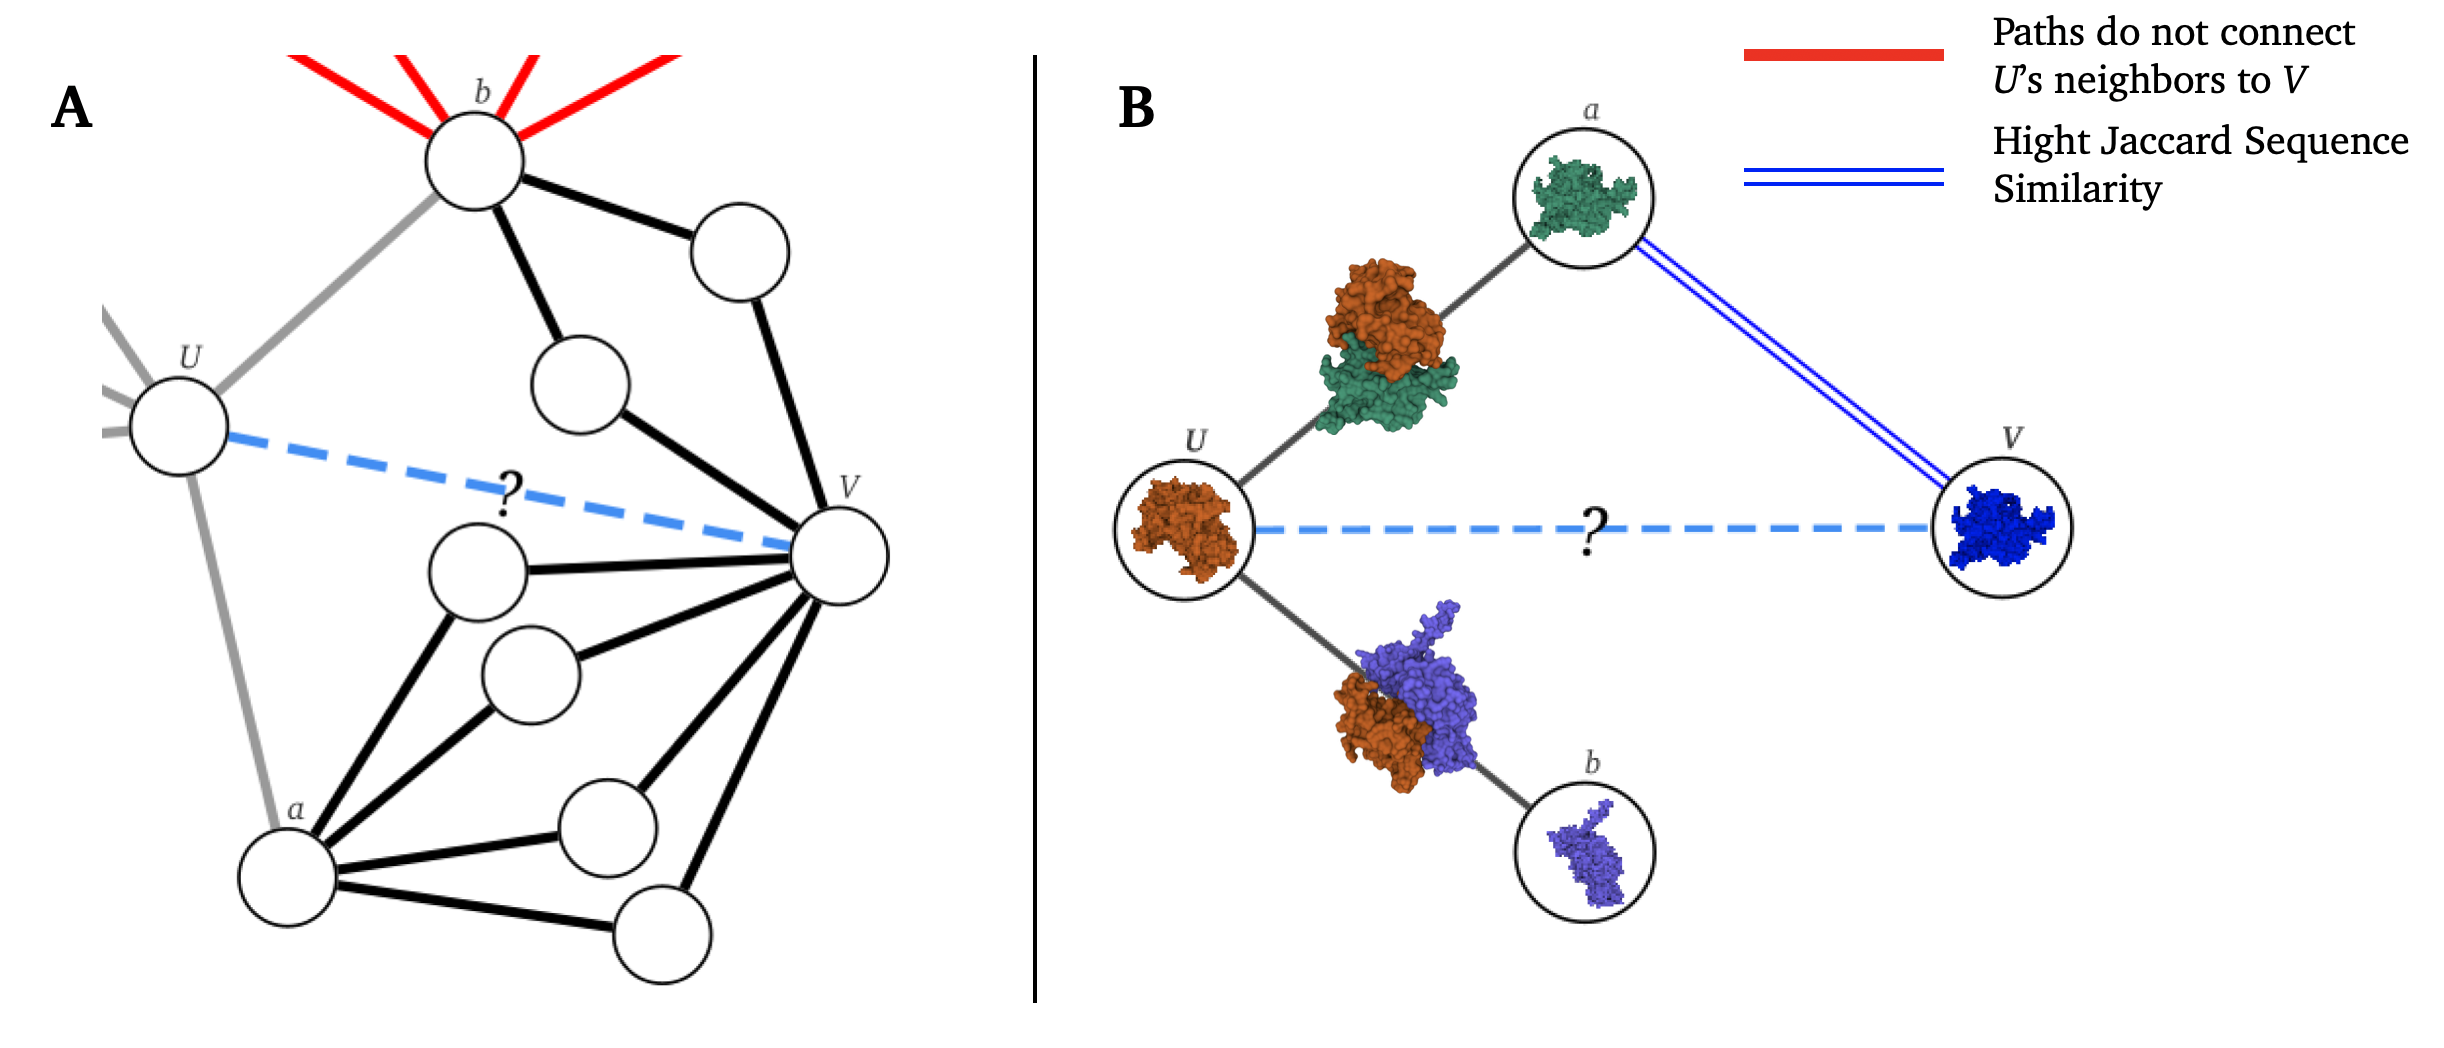
Figure 6 shows how we score the likelihood of interaction between and . Figure 6 A) illustrate the model from a topological point of view in which protein is very similar to protein (i.e. ’s neighbor) and consequently, as discussed previously, may share complementary binding site with . On the other side, figure 6 B) shows the model from a biological point of view in which, instead of considering the topological Jaccard Similarity, Jaccard Sequence similarity is used to understand if is functionally similar to at least a neighbor of .
Indeed, as shown in figure 6 B), has similar tertiary structure to , but not with . In conclusion, we can formalize the model in the following way:
| (4) |
Where is the set of direct neighbors of i and we can replace the Jaccard Index J, with the one analyzed in section 2.1.3. Surprisingly, the protein pair scoring function that leverages protein’s primary structures is not linked to the topology of the PPI network. Indeed, it is able to rank candidate interacting pair that are not close (i.e Shortest path length greater than 3) in the network. Thus, is not affected by the bias induced by network topology and by the network incompleteness (i.e missing data).
3 Results
3.1 Evaluation-Scheme and Accuracy-Measures
To evaluate the prediction of our frameworks and comparing it with other algorithms, we selected several Protein-Protein Interaction Networks:
-
•
From STRING[14] we downloaded PPI networks of different organism (Yeast, C. Elegans, Arabidopsis and Humo Sapiens) and we selected only experimental validated physical interactions. In other words, we removed those protein - protein interactions with an overall score lower than 900.
-
•
We downloaded a Human Interactome from from [15], that consists of experimental validated PPIs using Yeast to Hybrid screening. From BioGRID, we downloaded another Human Interactome only considered ”physical” and proteins assigned to the specific to the studied species. Finally, we also included the Interactome3D dataset, summarizing currently available interactions with structural evidence
Finally, for each protein in each Interactome, we downloaded its associated protein sequence from Uniprot Knowledge Based, and in each network, we removed those proteins associated with more than one protein sequence (i.e. those proteins not manually curated by Swiss Prot. Institute). The complete list of PPI Networks used in this manuscript is visible in Supp. Table 2. To assess accuracy in predicting protein interactions, we performed 10-fold cross validation on each dataset, picking a portion of edges at random to create the Training Graph (90%) and using the remaining edges (10%) to Test algorithm’s performances. To assess accuracy, we considered four standard prediction indices in Data Mining. For a given set of truly interacting pairs (Test Set), and an algorithm ranking protein pairs with respect to their interaction likelihood:
-
•
Precision@500: this is the fraction of the test set that is successfully retrieved in the top positions of the ranking computed by the algorithm.
-
•
nDCG[16]: The normalized Discounted Cumulative Gain (nDCG) is proven to be able to select the better ranking between any two, substantially different rankings. For binary classification the nDCG is given by:
Where summation in the numerator runs over all positive instances, while summation in the denominator quantifies the ideal case, in which positive instances appear in the top positions of the algorithm’s ranked list.
For the seek of completeness, we also compare all the algorithms with the AUROC and AUPRC, that are widely used to compare algorithm’s performances, even if it is well established that AUROC measure overestimates algorithm’s performances.
3.2 Competing Methods
Network-based approaches leverage network topology to estimate the likelihood of protein interactions. The advantages of network-based methods are high efficiency, easy access to input data (only network topology is needed), and good generalization schemes. Table 1 collects all PPIs prediction methods that have been implemented and tested.
| PPIs Prediction Methods | |||
|---|---|---|---|
| Method | Reference | Index | Path Length |
| Common Neighbor | Newman (2001) [17] | l = 2 | |
| Jaccard Index | Jaccard (1912) [18] | l = 2 | |
| Adamich Adar | Adamic and Adar (2003) [19] | l = 2 | |
| Resource Allocation | Zhou et al. (2009) [20] | l = 2 | |
| CH1_L2 | Cannistraci et al. (2018) [21] | l = 2 | |
| CH2_L2 | Cannistraci et al. (2018) [21] | l = 2 | |
| A3 | Barabâsi et al. (2019) [22] | l = 3 | |
| L3 | Barabâsi et al. (2019) [22] | l = 3 | |
| L3E | Yuen. (2020) [23] | l = 3 | |
| CH1_L3 | Cannistraci et al. (2018) [21] | l = 3 | |
| CH2_L3 | Cannistraci et al. (2018) [21] | l = 3 | |
| SIM | Chen et al. (2020) [24] | l = 3 | |
| Preferencial Attachment | Barabâsi et al. (2002) [25] | any | |
| MPS(B) | Wang et al. (2002) [26] | None | any |
| SPRINT | Li, et al. (2020) [1] | None | any |
The Preferential Attachment method:
The basic premise is that the probability that a new link has node i as an endpoint is proportional to , the current number of neighbors of i.
Methods Based on Paths of Length 2:
These heuristics leverage the idea, very popular in social network mining, that two nodes and that share many common neighbors are more likely to interact. The most relevant metrics that are based on this hypothesis are: Common Neighbor (CN), defined as the number of common interacting nodes between and , Jaccard Index[18](JC), a commonly used similarity. Intuitively, it measures the probability that a feature that either or possess is actually shared by both. In our case, a feature is an interacting protein. Resource Allocation [20], a similarity index that indicates how well a node can transmits information to node using its neighborhood. Finally, Cannistraci et al.[21] designed a family of metrics ( and ), based on Resource Allocation, in which a node is associated an internal degree that is the number of links that common neighbors and share between them, and an external degree that is defined as the number of links that shares with nodes that are not common neighbors of and .
Methods Based on Paths of Length 3:
These methods are based on the hypothesis that proteins should have complementary binding sites to be able to interact with each other. Following this idea, Barabasi et al.[22] showed that nodes that share a large number of paths of length share complementary tertiary structures and are more likely to interact. This idea, i.e., the L3 principle, is at the basis of several heuristiscs proposed since Barabasi et al.’s work. Indeed, Chen et al.[24] proposed a network-based link prediction method, named Sim, for PPI networks. This index is designed from two perspectives: the complementarity of protein interaction interfaces and gene duplication. Cannistraci et al.[21] designed a family of metrics ( and ) that plug in the concept of Local Community Paradigm in the L3 formula designed by Barabasi et al. (2019). Finally, Yuen et al. [23] designed a metrics based on the L3 principle and uses Jaccard Index as a penalty to score a candidate interaction.
Methods Based on Protein Primary Structure:
SPRINT is a well know method to predict protein’s interactions using their amino-acid sequence. It relies on the idea that proteins similar with interacting proteins are likely to interact as well. In a way or another, this is essentially the idea behind the brute force calculation of PIPE as well as the machine learning algorithms of Martin, Shen, and Guo. Since, all these methods relies on the same concept, we decided to take in consideration SPRINT that has been shown to have a better prediction power and to be faster than the other algorithms.
Methods Implemented for Protein Interaction prediction Challenge:
The proposed Methods has been implemented to participate to the Protein Interaction prediction Challenge organized by the Network Medicine Consortium 222https://www.network-medicine.org/. At the challenge, we also proposed a biological score, named MPS(B), to estimate the likelihood of protein interaction that leverages protein sequence in a different way from what we have discussed so far. We took inspiration from PIPE[2] and we designed a simplified and faster framework in which we don’t directly consider all co-occurrences of two sub sequence pairs , but we use them to define a protein similarity measure.
3.3 Algorithm Comparison
This section presents the overall comparison of sixteen different methods using several Human and Not-Human Protein-Protein Interaction networks.
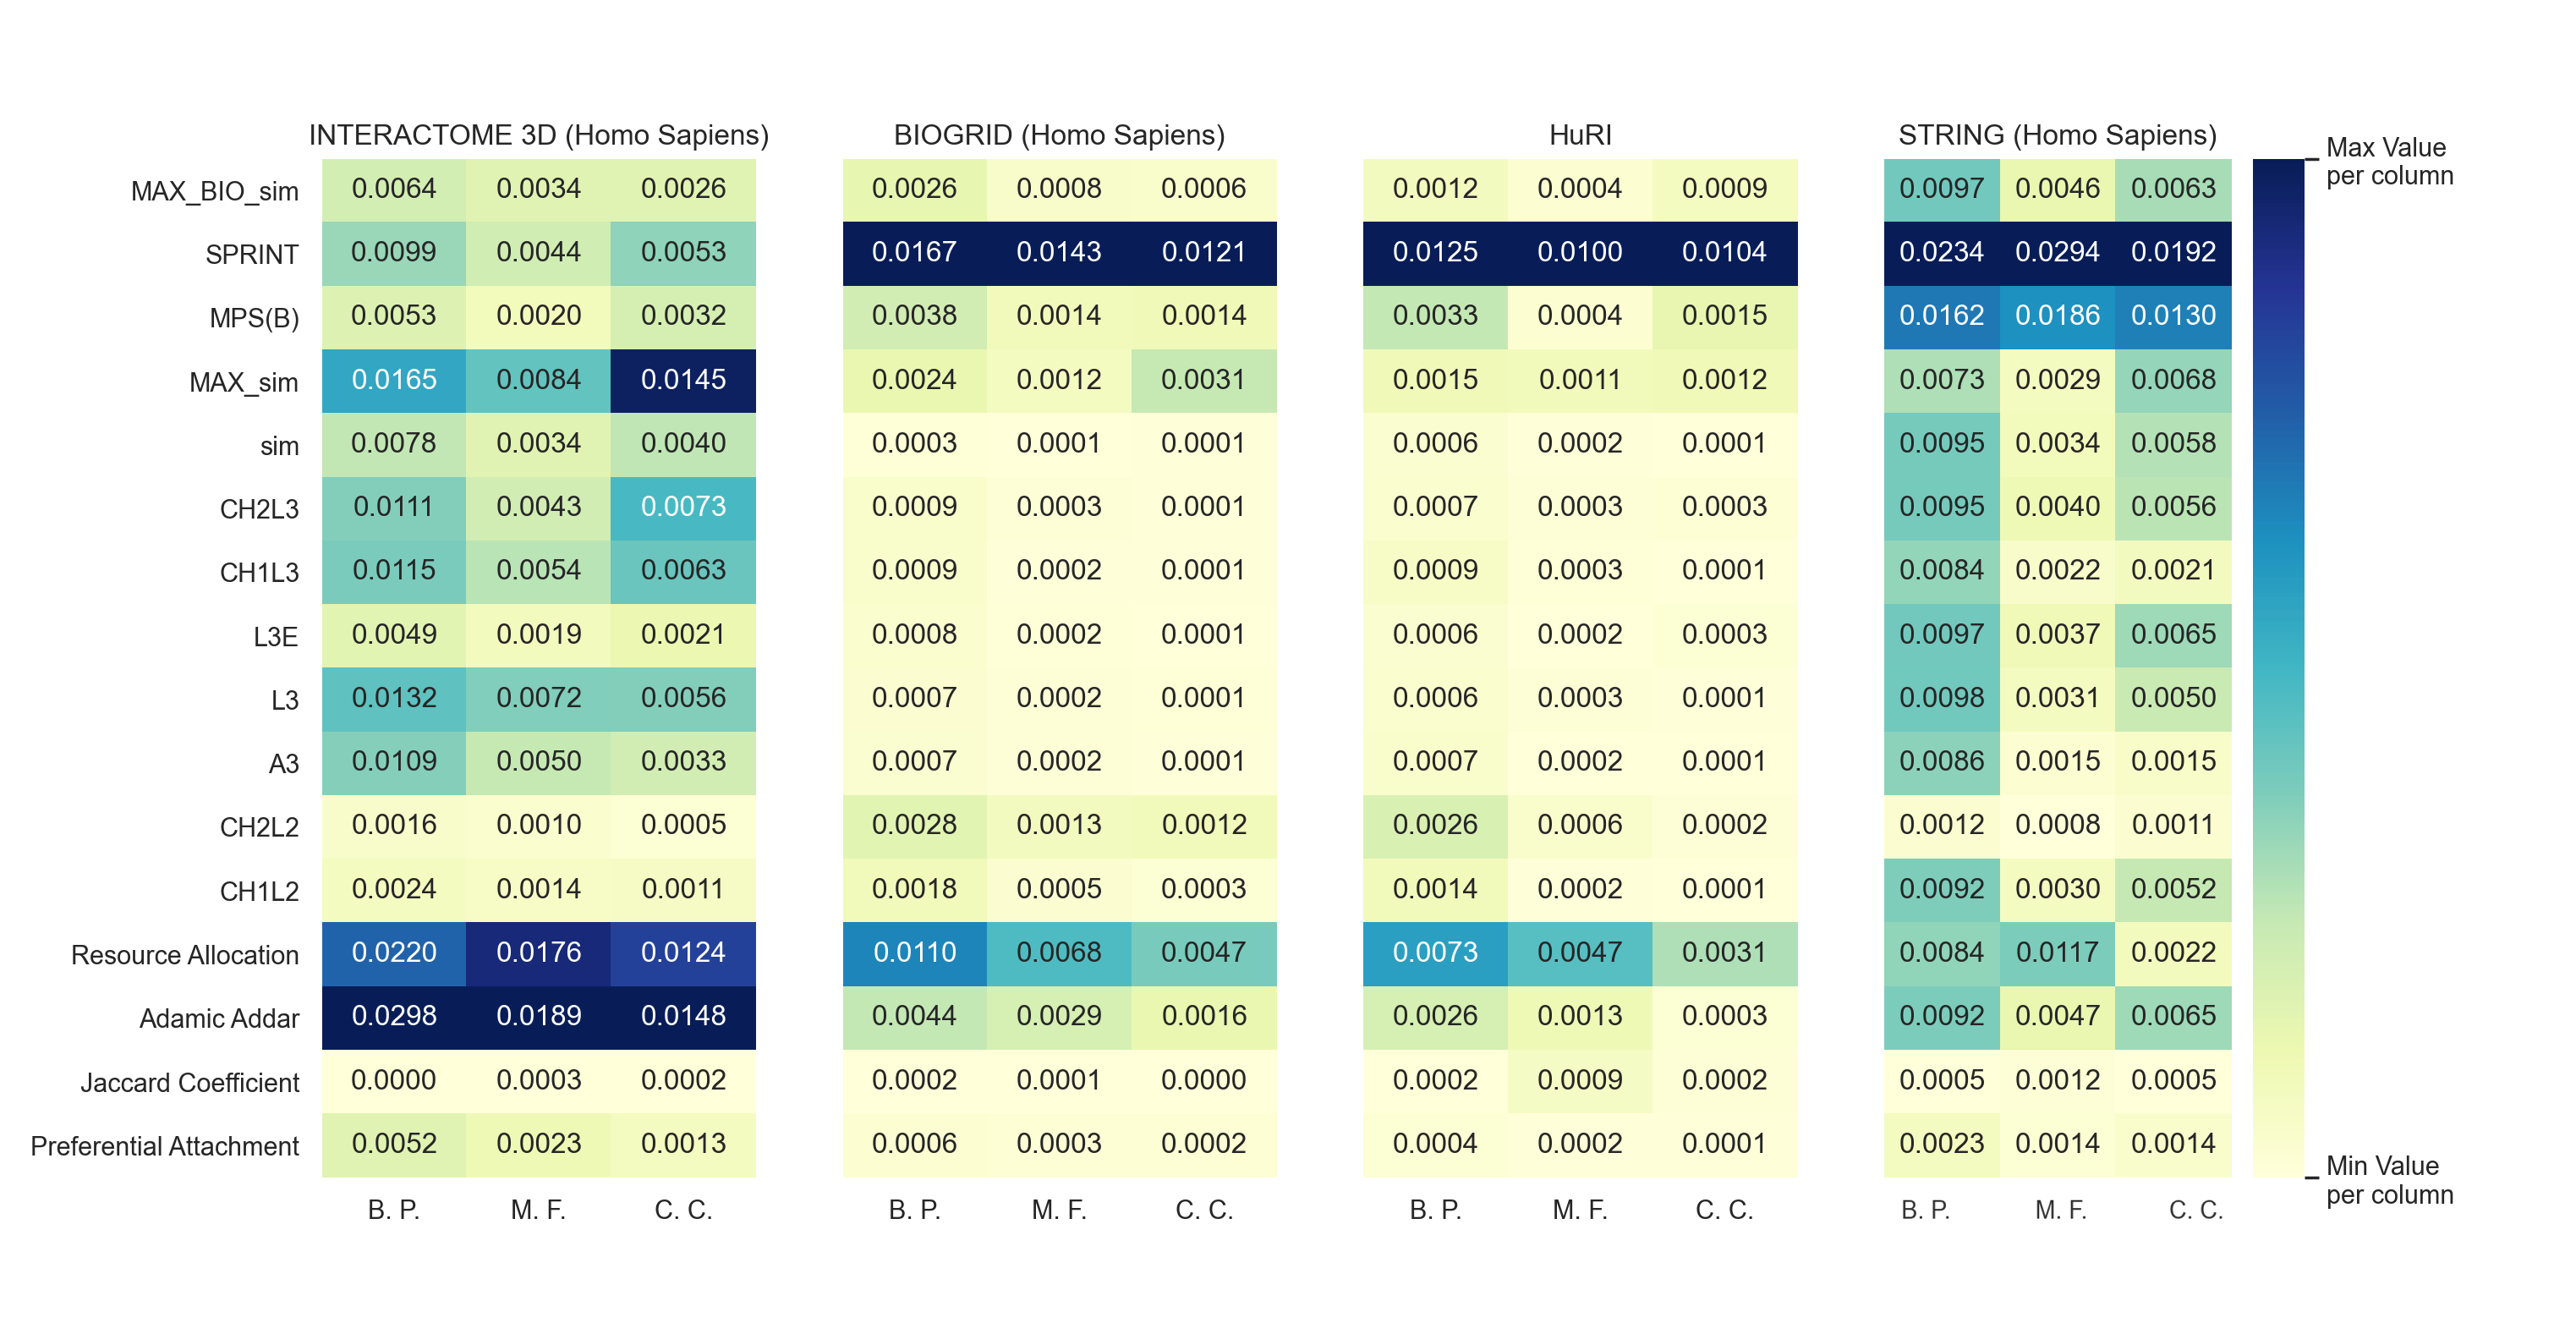
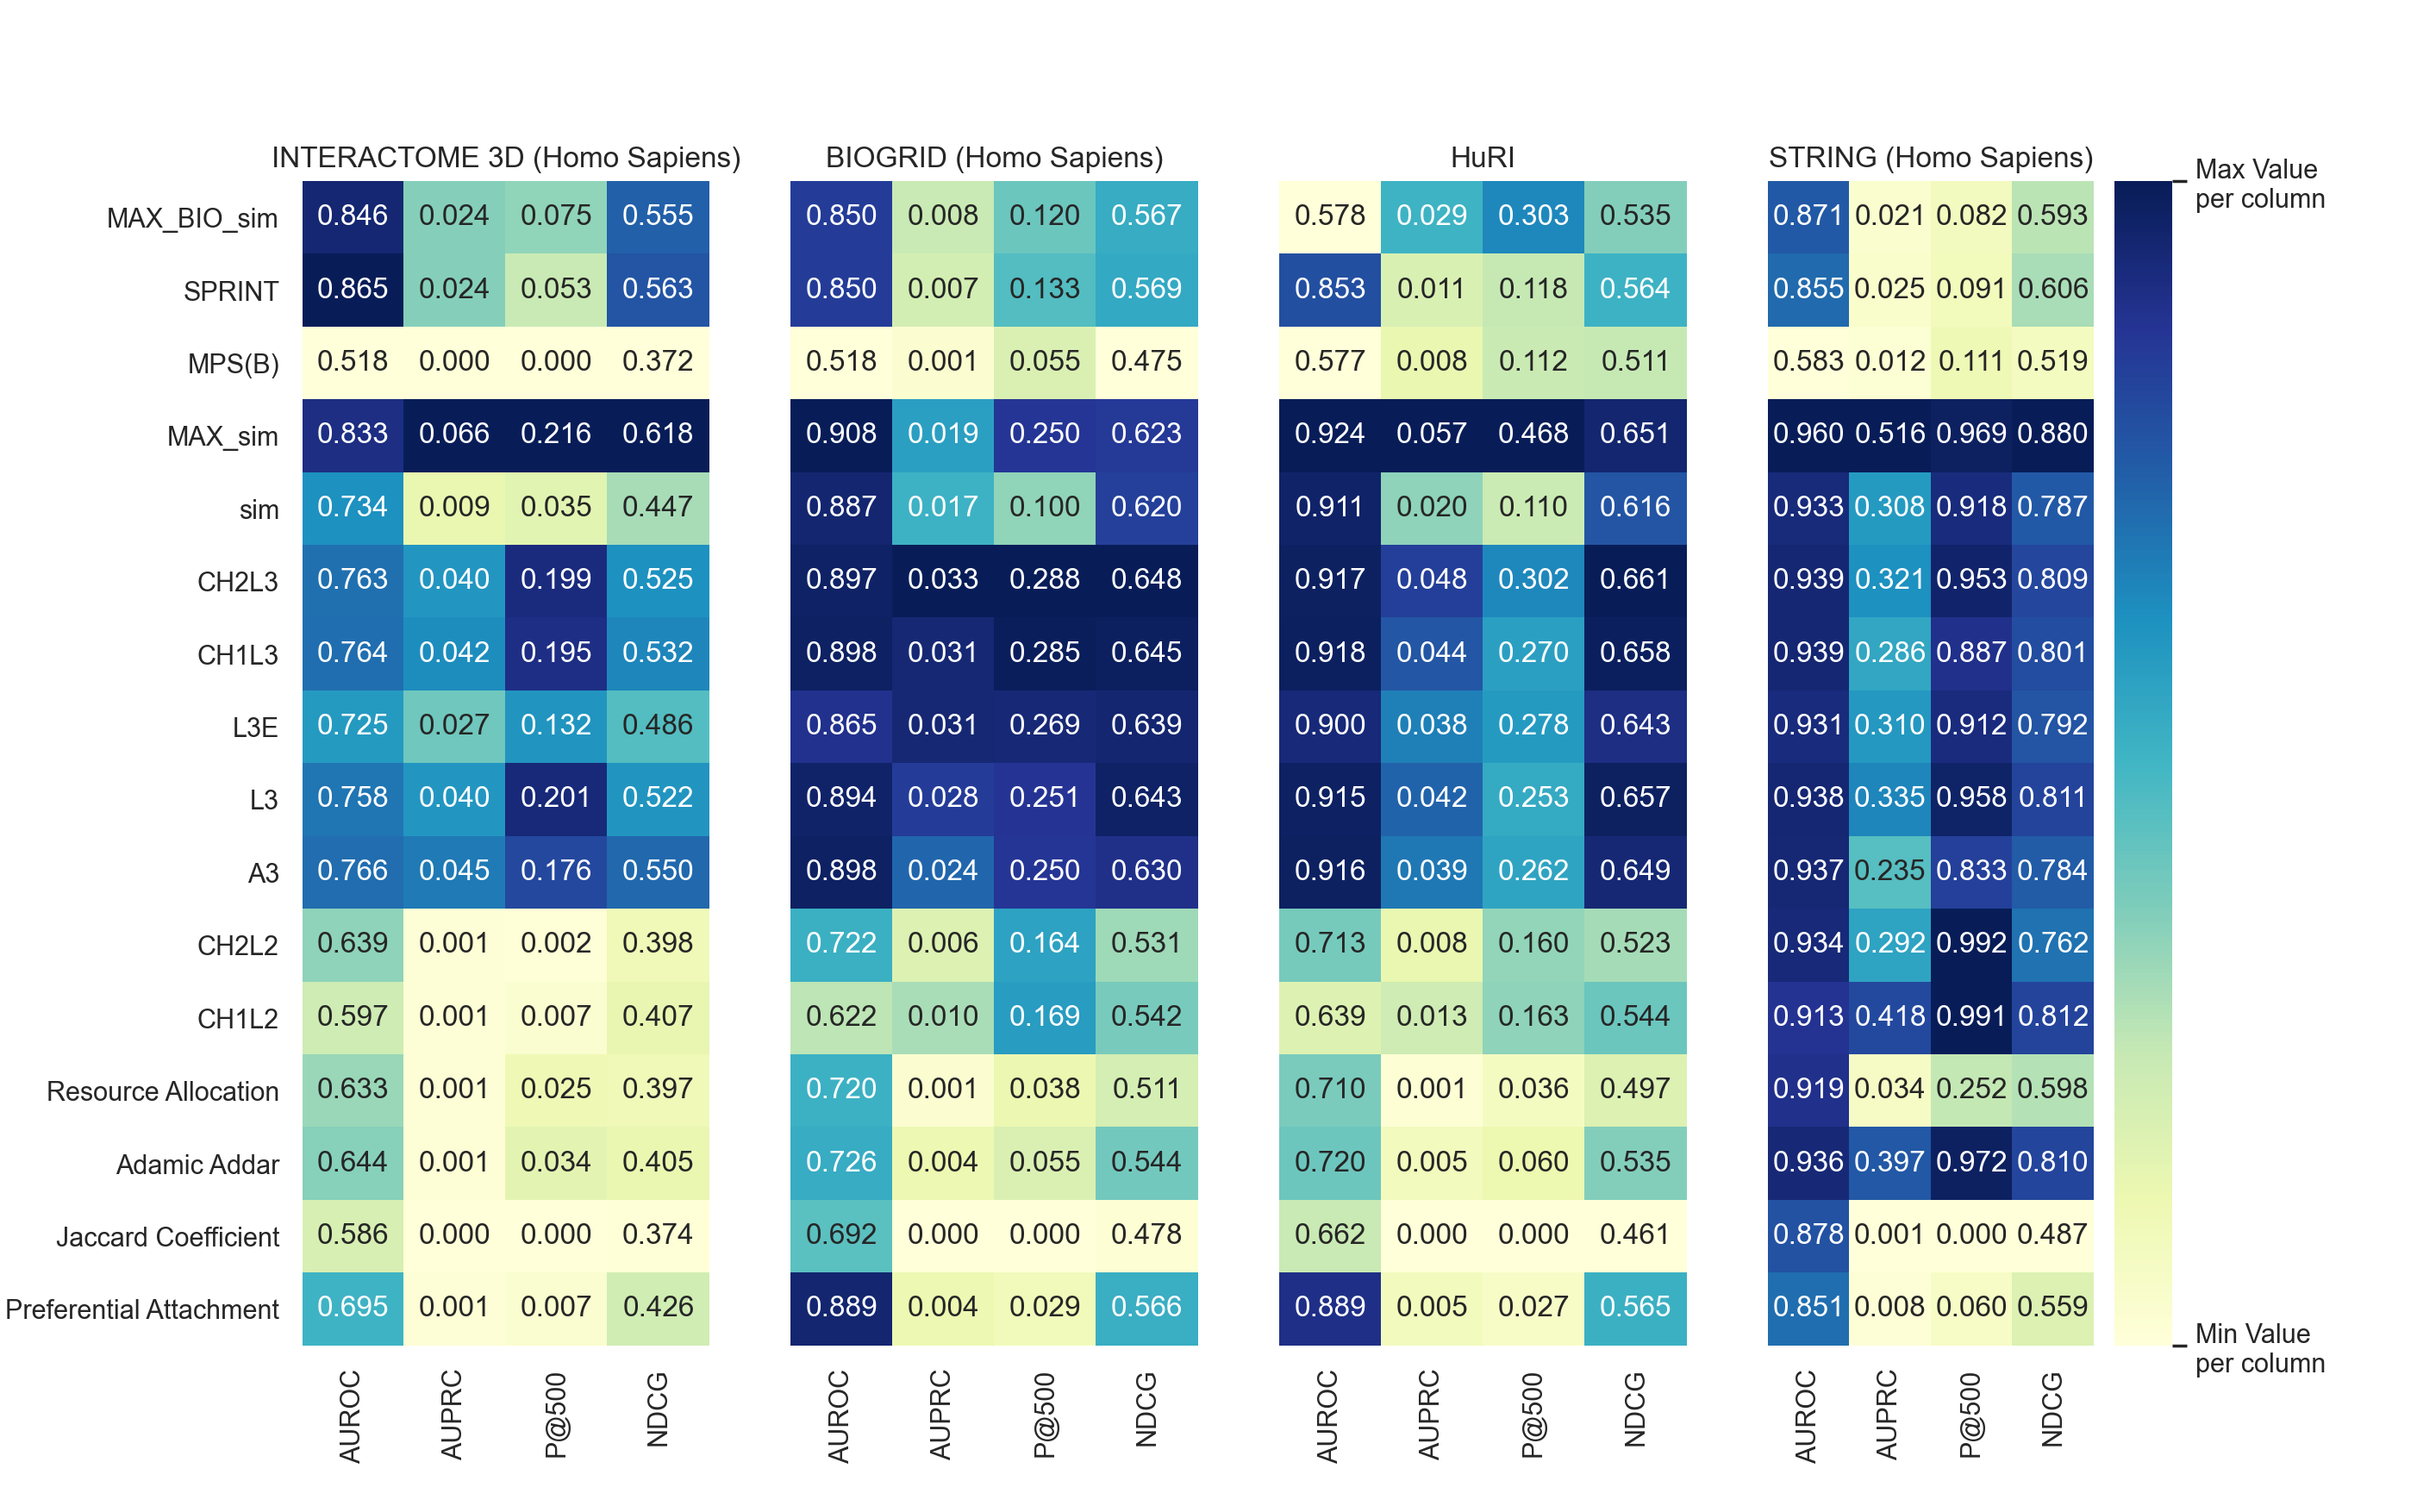
To begin, Figure 7 shows the algorithm’s performances on four different Human PPI networks. If we look at frameworks that leverage only topological information, we can see that algorithms based on the L3 paradigm outperform metrics that can predict only interactions between proteins within two hops (TCP paradigm). Indeed, this pattern is visible on all the data sets considered: , sim, CH2L3, CH1L3, L3E, L3, and A3 consistently outperform Resource Allocation, Adamich Addar, Jaccard Coefficient, CH1L2, and CH2L2. Furthermore, outperforms all the other heuristics in terms of AUPCR on three networks (INTERACTOME 3D, HuRI, and STRING) and returns the highest number of true positives (Precision@500) on two PPI networks (INTERACTOME 3D, and HuRI). Interestingly, Methods that leverage protein’s primary structures show lower computational performances than topology-based frameworks .
Since most topology-based algorithms show similar values of P@500, we plotted the precision curve of the best performers. Figure 8 a) shows the precision of the best algorithms when the number of top predictions is varying. On the INTERACTOME 3D CH1L3, CH2L3 and show similar behavior, but beats when we consider the top 500 predicted interactions. The same signal is visible on STRING: our topological framework is the best predictor when we consider a larger number of top ranked candidate protein pairs. Finally, on HuRI, is the best oracle. Surprisingly, shows promising results on this network. This result might be related to the positive correlation between Jaccard Index and Sequence similarity among protein pairs in HuRI as shown in Luck, K. et al.[15].
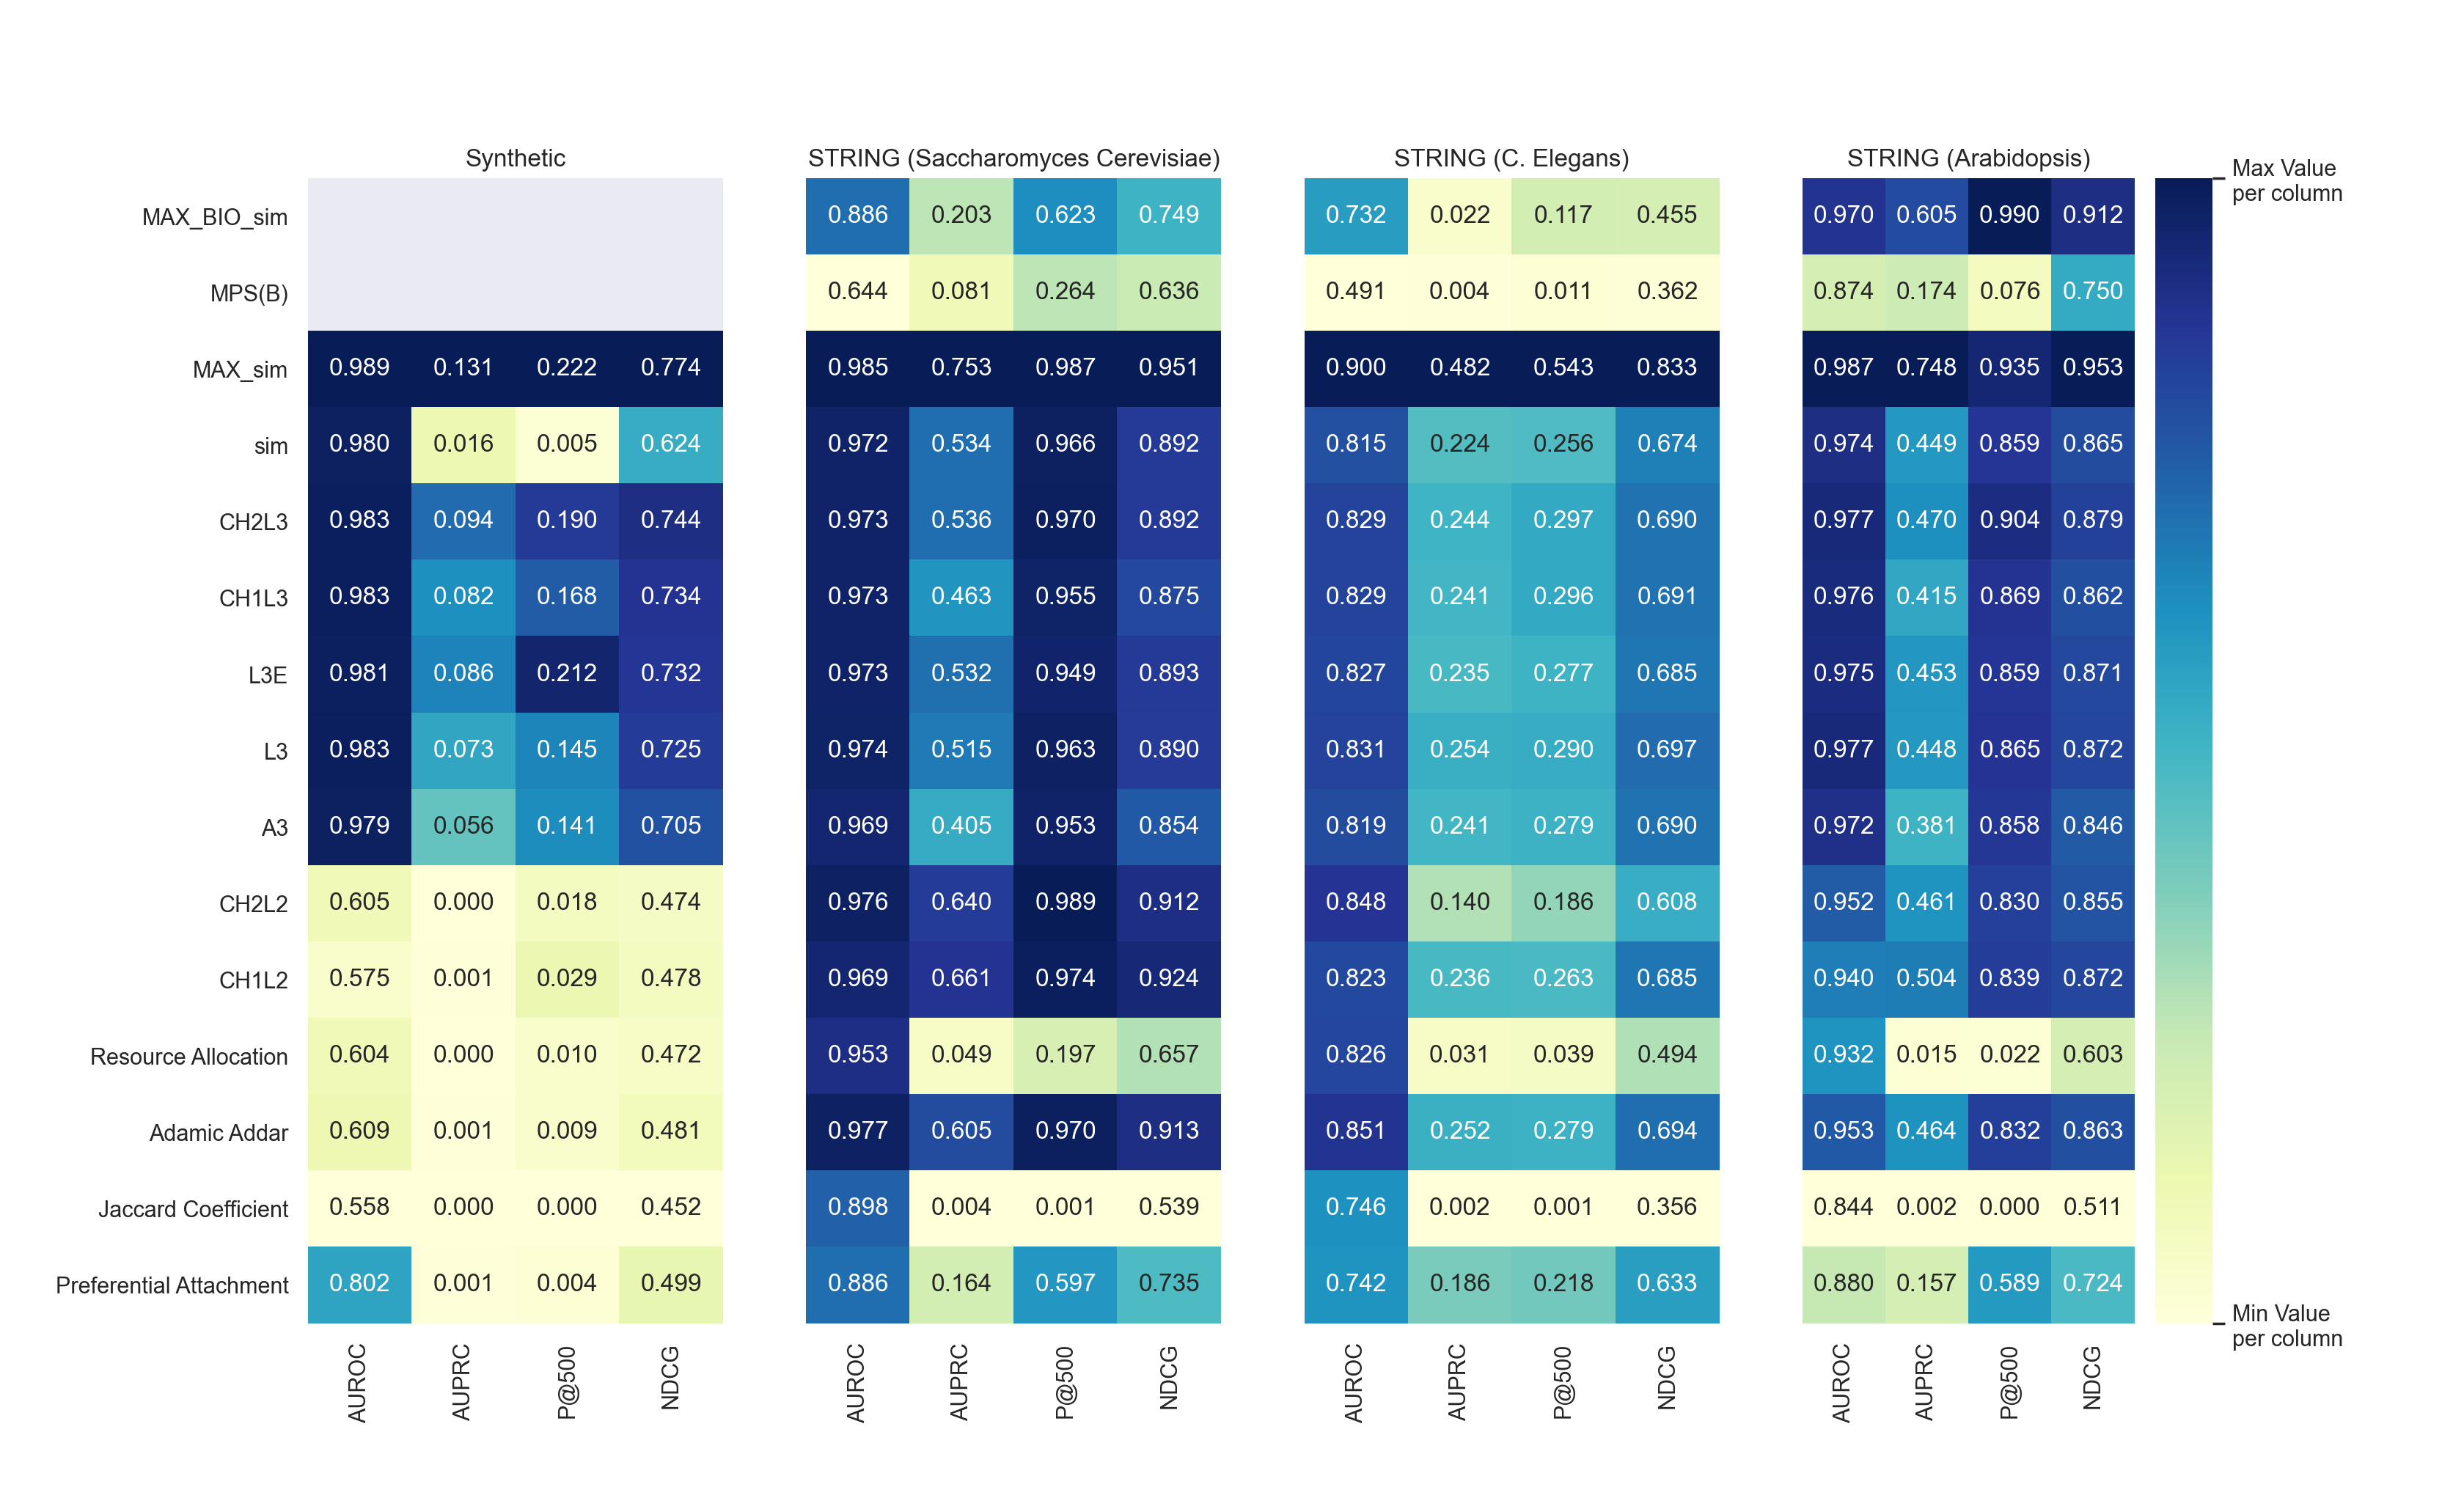
Besides, we verify the validity of our approaches also on not Human PPI networks. Supp. Figure 12 shows the framework’s validation on a Synthetic, and three different not Human (Yeast, C. Elegans, and Arabidopsis) interactomes. Results are coherent with the previous ones: L3 approaches outperforms methods that only predict candidate protein pairs within 2 hops(i.e. Resource Allocation, Jaccard Coefficient and Adamich Adar). Furthermore, methods that leverages protein sequence information shows better performances on these networks than Human interactomes. This observation may be due to a greater incompleteness of the Human interactomes than the non-Human ones[27].
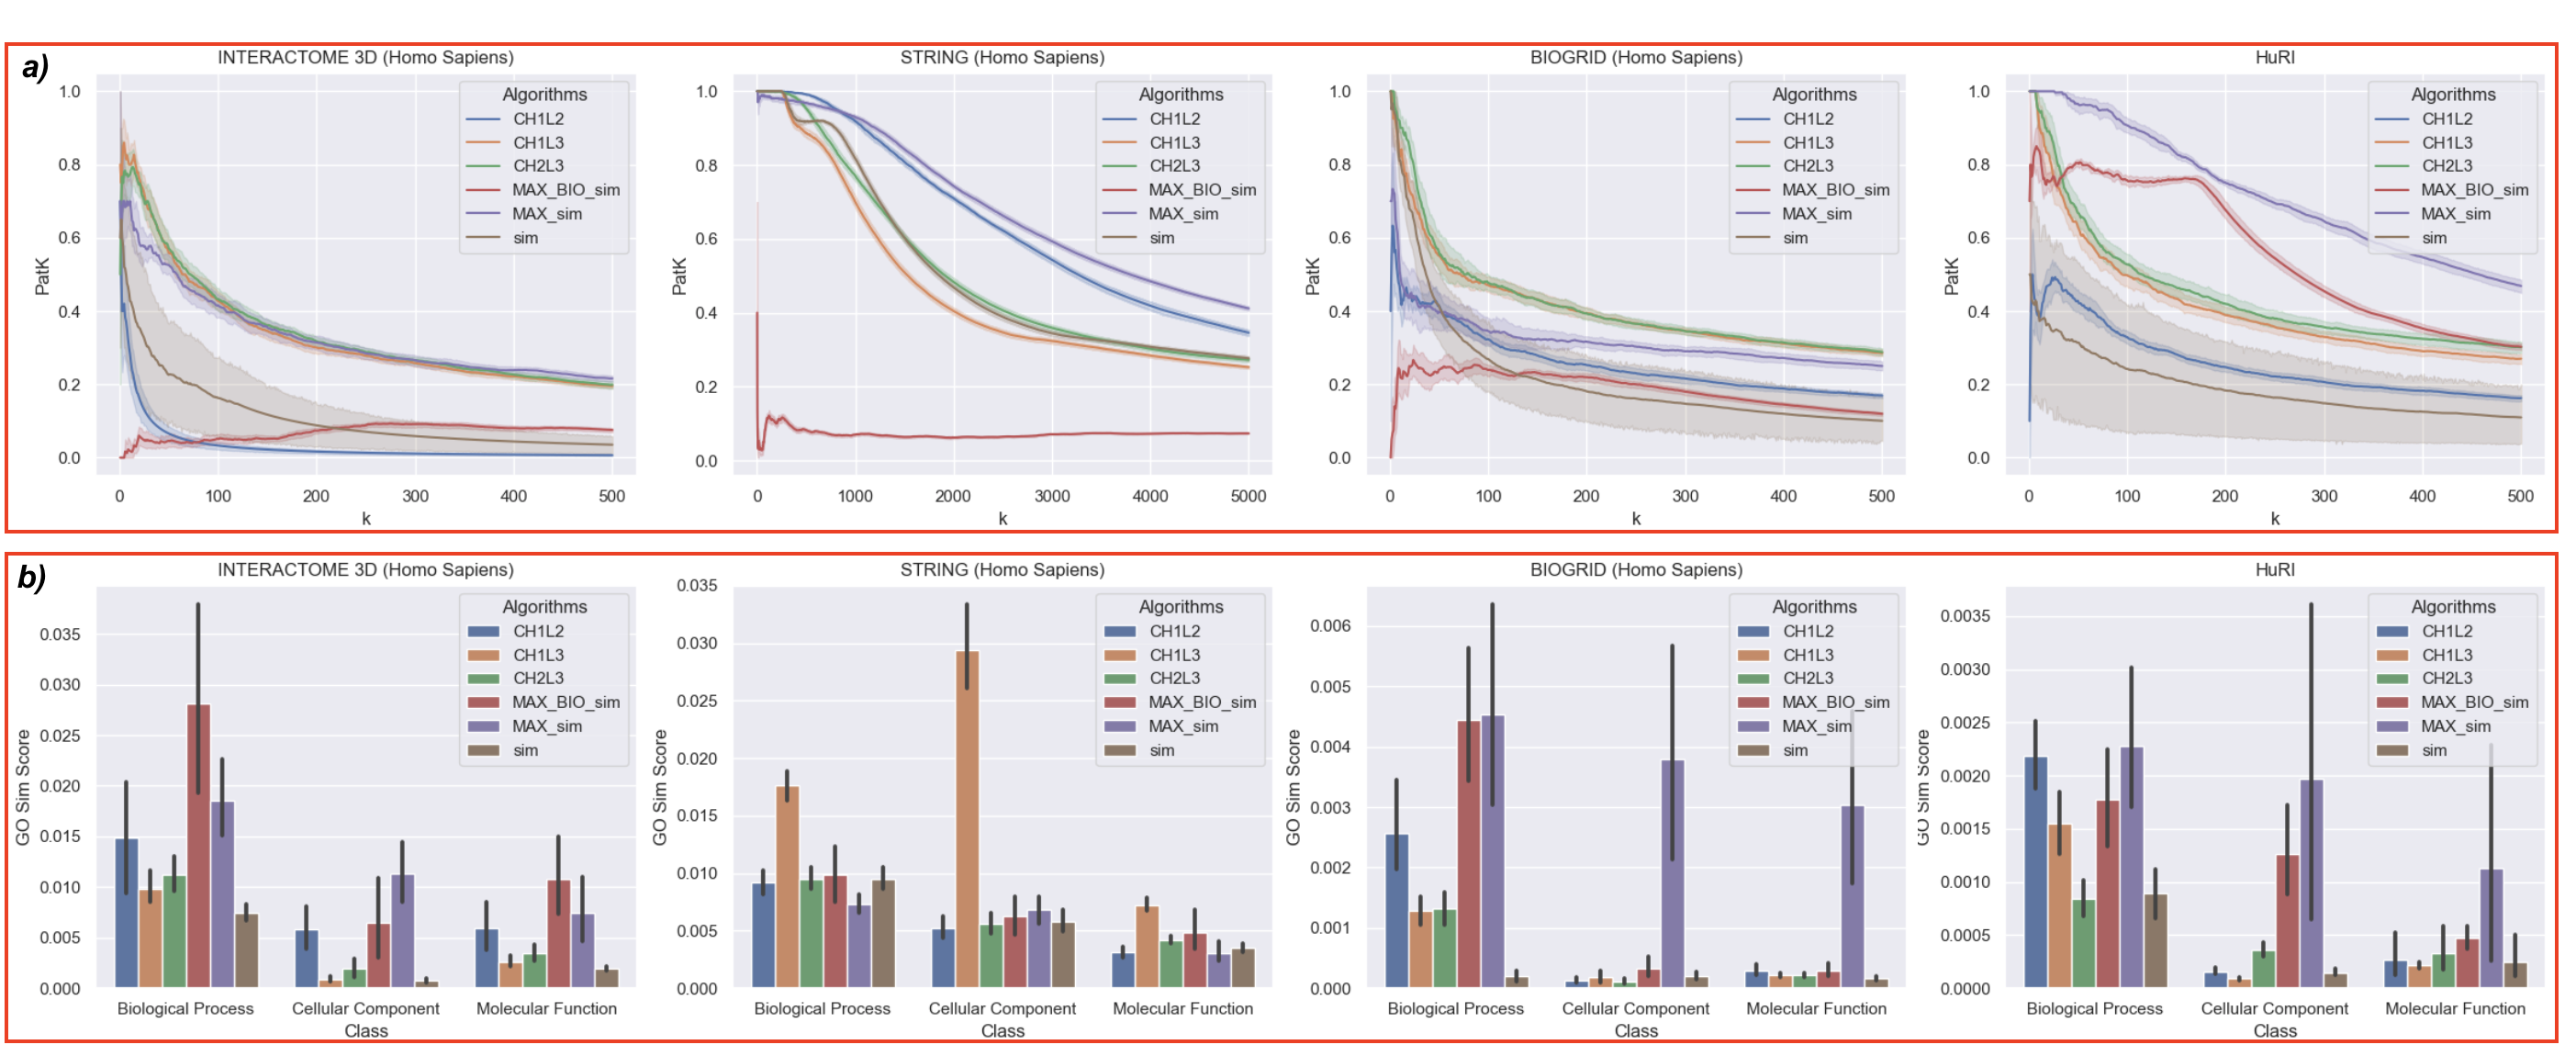
To further validate these heuristics, we compared their top candidate protein’s interaction using Gene Ontologies annotation[28, 29] (Biological Process, Molecular Function, and Cellular Component) downloaded from GO Consortium[30]. These annotations are routinely applied to validate computationally predicted links in the literature[31] instead of performing high-throughput validations or pairwise testing experiments. To induce a biological score for each framework, we consider the top 500 candidate pairs of each framework and we compute the GO sim score as in Kovaks et al.[22]. More formally, for each candidate protein pair () in the top k positions we defined and the sets of annotation u and v are respectively involved into, and we estimate their similarity as:
| (5) |
Where are the total number of protein involved in annotation . Finally, the framework’s score consists of the mean of all associated to the top k candidate predicted protein pairs:
| (6) |
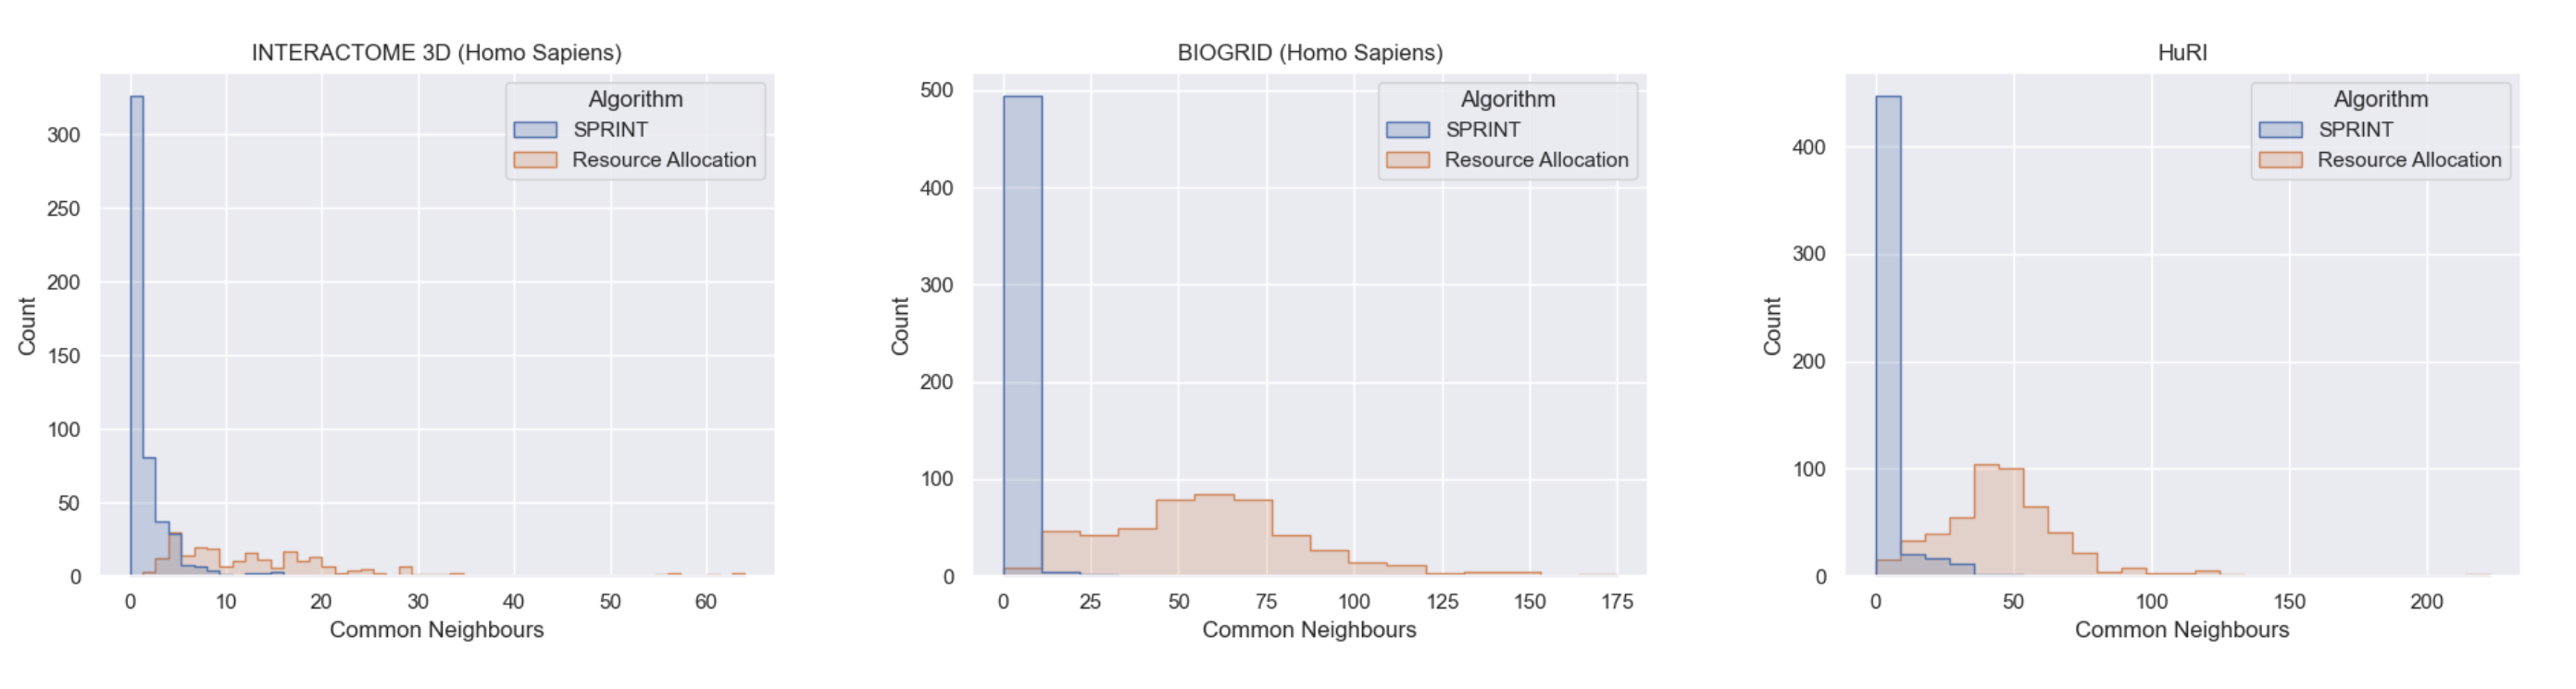
Figure 8 b) shows the performances of some of the best network-based and sequence-based approaches. Despite their prediction power shown in figure 7, candidate pairs seem to be less biologically similar than those ranked by Resource Allocation and Adamich Adar (see Supp. Figure 13). Kovaks et al.[22] observed the same pattern when they analyzed TCP-based methods and compared them with L3 using the same similarity metric. However, It is worth noticing that SPRINT get the best performances if compared with all the other frameworks, and almost all predicted interactions do not share a large number of common neighbors if compared with Resource Allocation (see Supp. Fig. 14). In conclusion, if we take in consideration methods based on L3 principle, and return candidate pairs more similar than those ones returned by other proposed methods (A3, L3, L3E, CH1L3, CH2L3 and sim) as shown in Figure 8 b) and Supp. Figure 13.
3.4 An Unsupervised Approach to Combine Sequence Based and Topological Information
Section 3.3 allowed us to understand framework’s limitations. First, topology-based approaches are unable to predict candidate protein pairs far away in the Interactome (i.e., Shortest path distance greater than 3). Secondly, as shown in Fig 7 and Supp. Fig. 13, they are very biased on the topology of the Protein-Protein Interaction network and fail to rank highly similar candidate protein pairs. On the other hand, methods that rely on primary sequence can score the likelihood of interaction of candidate proteins localized in distant areas of the network. Also, they rely on the information of the protein’s primary structure, reducing the bias of the Interactome.
Consequently, we investigate the effect of combining topological and biological frameworks to predict new protein interactions to moderate their topological bias and rank biologically similar protein pairs. Given the topological feature and the biological feature , we combine them using a linear combination of the two:
| (7) |
To choose the value of and , we first normalized/standardized and . Then, we projected them on a 1-dimensional space with the help of principal components analysis (PCA), a classical technique for extracting patterns and performing dimensionality reduction from unlabeled data. It computes a linear combination of two features, forming the direction that captures the most variance in the data set.
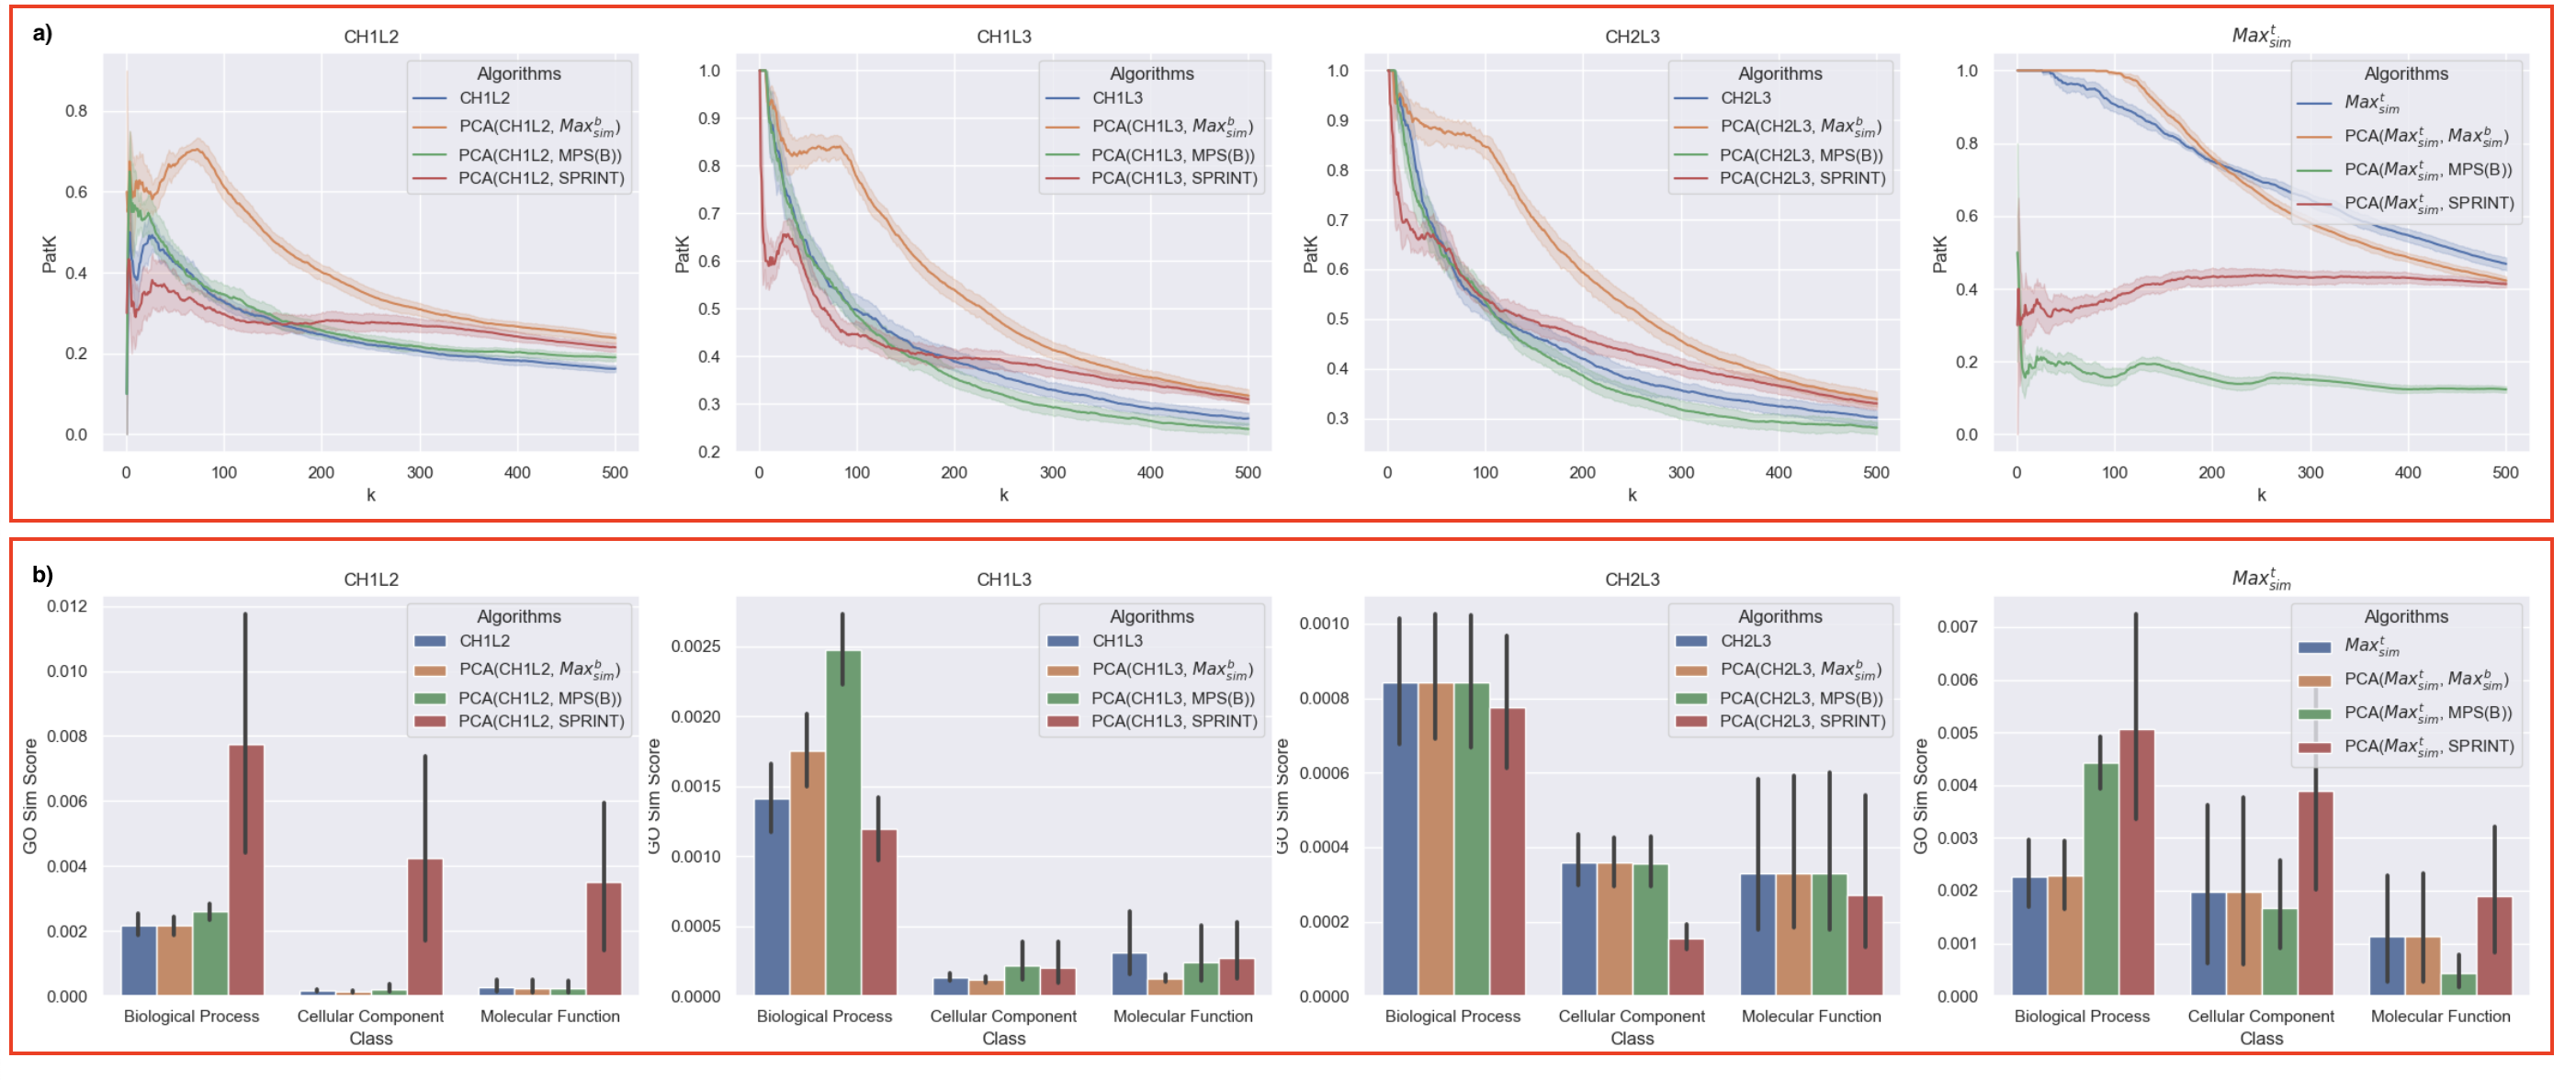
Figure 9 illustrates the performance of the combined metrics compared to individual ones. We analyzed the performances on HuRI Interactome: The network in which both topological and biological metrics have an excellent prediction power on P@K and GoSimScore. Each plot represents a topological framework and its combinations. As a first result, can improve the retrieval of the top 200 candidate protein pairs of each topological algorithm considered, as shown in Figure 9 a). Furthermore, biological frameworks help network-based approaches to retrieve more biologically similar protein pairs, as shown in Figure 9 b).
4 Conclusion
We presented two network-based approaches, named and , for predicting candidate interacting protein pairs. The exceptional success of our models depends on their ability to capture the structural and evolutionary principles that drive protein-protein interactions that Jaccard Indices infer, as discussed in Material and Methods.
We compared and with state-of-the-art network-based approaches using a 10-fold cross-validation approach on several Human and Not Human Protein-Protein Interaction networks. The ability of network-based approaches to predict protein interactions strongly depends on the network’s topology. Indeed, L3 approaches have similar performances, and outperforms the other heuristics in the majority of the network considered. On the other hand, Sequence-based approaches that do not rely exclusively on network topology fail in predicting candidate interacting pairs. Furthermore, to better understand the biological similarity of the top candidate protein pairs ranked by each framework, we implemented the GOSimScore as Kovaks et al.. Surprisingly, SPRINT, a well-known sequence-based approach, returned the candidate protein pairs involved in similar processes, molecular function, and in the same area.
Surprised by the excellent prediction power of on HuRI Interactome, we investigated possible combinations with the best network-based methods. We discover that combining topological and biological methods help in ranking interacting protein pairs without decreasing their biological similarity.
However, the framework is not without limitations. Like all L3-based methods, alone cannot find interacting partners for proteins without known links. For such proteins, we integrated information on sequence combining with , SPRINT or MPS(B).
Another limitation concerns the computational validation: Fig. 7 and Supp. Fig. 13 represent two different ways to validate candidate protein pairs predicted by the different frameworks. It is worth noticing that frameworks based on network topology perform better when compared with classical data-mining measures such as P@K and NDCG. At the same time, frameworks that rely on protein’s primary sequence outperform the others when GOSimScore is considered.
We can still do much work to improve our framework: we can think of a more reasonable way to combine topology and sequence-based methods. We can extend the framework to use several biological information such as Co-Expression of protein pairs, their functional similarities, and phylogenetic profile similarity, evolutionary history or 3D structure that we have not considered in this manuscript but that are integrated in several well-known bioinformatics tools[32, 33, 34, 35]. In conclusion, and with their combinations are promising tools for the completion of the human interactome, allowing us to exploit network effects as we aim to uncover the mechanistic roots of human disease[36, 37].
Acknowledgement
This work is partially supported by the ERC Advanced Grant 788893 AMDROMA “Algorithmic and Mechanism Design Research in Online Markets”, the EC H2020RIA project “SoBigData++” (871042), and the MIUR PRIN project ALGADIMAR “Algorithms, Games, and Digital Markets”.
References
- [1] Li, Y. & Ilie, L. Sprint: ultrafast protein-protein interaction prediction of the entire human interactome. \JournalTitleBMC bioinformatics 18, 1–11 (2017).
- [2] Pitre, S. et al. Pipe: a protein-protein interaction prediction engine based on the re-occurring short polypeptide sequences between known interacting protein pairs. \JournalTitleBMC bioinformatics 7, 1–15 (2006).
- [3] Ouedraogo, M. et al. The duplicated genes database: identification and functional annotation of co-localised duplicated genes across genomes. \JournalTitlePloS one 7, e50653 (2012).
- [4] Kidera, A., Konishi, Y., Ooi, T. & Scheraga, H. A. Relation between sequence similarity and structural similarity in proteins. role of important properties of amino acids. \JournalTitleJournal of Protein Chemistry 4, 265–297 (1985).
- [5] Guzzo, A. V. The influence of amino acid sequence on protein structure. \JournalTitleBiophysical journal 5, 809–822 (1965).
- [6] Chothia, C. & Lesk, A. M. The relation between the divergence of sequence and structure in proteins. \JournalTitleThe EMBO journal 5, 823–826 (1986).
- [7] Wilson, C. A., Kreychman, J. & Gerstein, M. Assessing annotation transfer for genomics: quantifying the relations between protein sequence, structure and function through traditional and probabilistic scores. \JournalTitleJournal of molecular biology 297, 233–249 (2000).
- [8] Rost, B. Twilight zone of protein sequence alignments. \JournalTitleProtein engineering 12, 85–94 (1999).
- [9] Yang, A.-S. & Honig, B. An integrated approach to the analysis and modeling of protein sequences and structures. ii. on the relationship between sequence and structural similarity for proteins that are not obviously related in sequence. \JournalTitleJournal of molecular biology 301, 679–689 (2000).
- [10] Jeffryes, M. & Bateman, A. Rapid identification of novel protein families using similarity searches. \JournalTitleF1000Research 7 (2018).
- [11] Hegyi, H. & Gerstein, M. The relationship between protein structure and function: a comprehensive survey with application to the yeast genome. \JournalTitleJournal of molecular biology 288, 147–164 (1999).
- [12] Joshi, T. & Xu, D. Quantitative assessment of relationship between sequence similarity and function similarity. \JournalTitleBMC genomics 8, 1–10 (2007).
- [13] Sangar, V., Blankenberg, D. J., Altman, N. & Lesk, A. M. Quantitative sequence-function relationships in proteins based on gene ontology. \JournalTitleBMC bioinformatics 8, 1–15 (2007).
- [14] Szklarczyk, D. et al. String v10: protein–protein interaction networks, integrated over the tree of life. \JournalTitleNucleic acids research 43, D447–D452 (2015).
- [15] Luck, K. et al. A reference map of the human binary protein interactome. \JournalTitleNature 580, 402–408 (2020).
- [16] Wang, Y., Wang, L., Li, Y., He, D. & Liu, T.-Y. A theoretical analysis of ndcg type ranking measures. In Conference on learning theory, 25–54 (PMLR, 2013).
- [17] Newman, M. E. J. Clustering and preferential attachment in growing networks. \JournalTitlePhys. Rev. E 64, 025102, DOI: 10.1103/PhysRevE.64.025102 (2001).
- [18] Jaccard, P. THE DISTRIBUTION OF THE FLORA IN THE ALPINE ZONE.1. \JournalTitleNew Phytologist 11, 37–50, DOI: 10.1111/j.1469-8137.1912.tb05611.x (1912).
- [19] Adamic, L. A. & Adar, E. Friends and neighbors on the web. \JournalTitleSocial Networks 25, 211–230, DOI: https://doi.org/10.1016/S0378-8733(03)00009-1 (2003).
- [20] Zhou, T., Lü, L. & Zhang, Y.-C. Predicting missing links via local information. \JournalTitleThe European Physical Journal B 71, 623–630 (2009).
- [21] Muscoloni, A., Abdelhamid, I. & Cannistraci, C. V. Local-community network automata modelling based on length-three-paths for prediction of complex network structures in protein interactomes, food webs and more. \JournalTitlebioRxiv 346916 (2018).
- [22] Kovács, I. A. et al. Network-based prediction of protein interactions. \JournalTitleNature communications 10, 1–8 (2019).
- [23] Yuen, H. Y. & Jansson, J. Better link prediction for protein-protein interaction networks. In 2020 IEEE 20th International Conference on Bioinformatics and Bioengineering (BIBE), 53–60 (IEEE, 2020).
- [24] Chen, Y., Wang, W., Liu, J., Feng, J. & Gong, X. Protein interface complementarity and gene duplication improve link prediction of protein-protein interaction network. \JournalTitleFrontiers in genetics 11, 291 (2020).
- [25] Barabási, A. et al. Evolution of the social network of scientific collaborations. \JournalTitlePhysica A: Statistical Mechanics and its Applications 311, 590–614, DOI: https://doi.org/10.1016/S0378-4371(02)00736-7 (2002).
- [26] Wang, X.-W. et al. Assessment of community efforts to advance computational prediction of protein-protein interactions. \JournalTitlebioRxiv (2021).
- [27] Hart, G. T., Ramani, A. K. & Marcotte, E. M. How complete are current yeast and human protein-interaction networks? \JournalTitleGenome biology 7, 1–9 (2006).
- [28] Ashburner, M. et al. Gene ontology: tool for the unification of biology. \JournalTitleNature genetics 25, 25–29 (2000).
- [29] Consortium, G. O. The gene ontology resource: 20 years and still going strong. \JournalTitleNucleic acids research 47, D330–D338 (2019).
- [30] Consortium, G. O. Gene ontology consortium: going forward. \JournalTitleNucleic acids research 43, D1049–D1056 (2015).
- [31] You, Z.-H., Lei, Y.-K., Gui, J., Huang, D.-S. & Zhou, X. Using manifold embedding for assessing and predicting protein interactions from high-throughput experimental data. \JournalTitleBioinformatics 26, 2744–2751 (2010).
- [32] Zhang, Q. C. et al. Structure-based prediction of protein–protein interactions on a genome-wide scale. \JournalTitleNature 490, 556–560 (2012).
- [33] Keskin, O., Tuncbag, N. & Gursoy, A. Predicting protein–protein interactions from the molecular to the proteome level. \JournalTitleChemical reviews 116, 4884–4909 (2016).
- [34] Szilagyi, A., Grimm, V., Arakaki, A. K. & Skolnick, J. Prediction of physical protein–protein interactions. \JournalTitlePhysical biology 2, S1 (2005).
- [35] Wuchty, S. Topology and weights in a protein domain interaction network–a novel way to predict protein interactions. \JournalTitleBMC genomics 7, 1–12 (2006).
- [36] Menche, J. et al. Uncovering disease-disease relationships through the incomplete interactome. \JournalTitleScience 347 (2015).
- [37] Huttlin, E. L. et al. Architecture of the human interactome defines protein communities and disease networks. \JournalTitleNature 545, 505–509 (2017).
- [38] Vázquez, A., Flammini, A., Maritan, A. & Vespignani, A. Modeling of protein interaction networks. \JournalTitleComplexus 1, 38–44 (2003).
- [39] Oughtred, R. et al. The biogrid interaction database: 2019 update. \JournalTitleNucleic acids research 47, D529–D541 (2019).
- [40] Mosca, R., Céol, A. & Aloy, P. Interactome3d: adding structural details to protein networks. \JournalTitleNature methods 10, 47–53 (2013).
Appendix A Appendix
A.1 Connection Probability

A.2 Protein-Protein Interaction Network Dataset
| Considered Protein-Protein Interaction Networks | ||||
| Data Set | Organism | Reference | Number of Nodes () | Number of Edges () |
| Synthetic | Vázquez et al. (2003)[38] | |||
| STRING | Yeast | Szklarczyk et al. (2015)[14] | ||
| STRING | C. Elegans | Szklarczyk et al. (2015)[14] | ||
| STRING | Arabidopsis | Szklarczyk et al. (2015)[14] | ||
| STRING | Homo Sapiens | Szklarczyk et al. (2015)[14] | ||
| BioGRID | Homo Sapiens | Oughtred et al. (2019) [39] | ||
| INTERACTOME 3D | Homo Sapiens | Mosca et al (2013)[40] | ||
| HuRI | Homo Sapiens | Luck, K.et al (2020)[15] | ||
A.3 Jaccard Index to Model Evolutionary and Functional Similarity
To statistically quantify if proteins created by this evolutionary process show this behaviour, we downloaded from [3] a data set consisting of groups of protein products generated by the gene duplication process. Firstly, we filtered out the smallest groups, keeping only groups consisting of a large number of proteins (i.e number of proteins ) that appear in the PPI network. Secondly, for each group , we defined the Mean Jaccard Index of group () as:
| (8) |
Where is the size of and is the Biological Jaccard index defined in section 2.1.3 of the main article. Finally, we compared the value of each group’s Mean Jaccard Index with a random distribution of the score computed using random set of proteins with the same size of the original group .
A.4 Algorithm Comparison