On the origin of late-time X-ray flares in UV/optically-selected tidal disruption events
Abstract
We propose a model to explain the time delay between the peak of the optical and X-ray luminosity, hereafter, in UV/optically-selected tidal disruption events (TDEs). The following picture explains the observed in several TDEs as a consequence of the circularization and disk accretion processes as long as the sub-Eddington accretion. At the beginning of the circularization, the fallback debris is thermalized by the self-crossing shock caused by relativistic precession, providing the peak optical emission. During the circularization process, the mass fallback rate decreases with time to form a ring around the supermassive black hole (SMBH). The formation timescale corresponds to the circularization timescale of the most tightly bound debris, which is less than a year to several decades, depending mostly on the penetration factor, the circularization efficiency, and the black hole mass. The ring will subsequently evolve viscously over the viscous diffusion time. We find that it accretes onto the SMBH on a fraction of the viscous timescale, which is years for given typical parameters, leading to X-ray emission at late times. The resultant is given by the sum of the circularization timescale and the accretion timescale and significantly decreases with increasing penetration factor to several to years typically. Since the X-ray luminosity substantially decreases as the viewing angle between the normal to the disk plane and line-of-sight increases from to , a low late-time X-ray luminosity can be explained by an edge-on view. We also discuss the super-Eddington accretion scenario, where is dominated by the circularization timescale.
1 Introduction
Tidal disruption events (TDEs) are becoming a key phenomenon in searching for dormant supermassive black holes (SMBHs) at the centers of the inactive galaxies. TDEs occur when a star approaches close enough to the SMBH to be ripped apart by its tidal force. The subsequent accretion of a fraction of the mass from the tidally disrupted star causes a characteristic flare with a high luminosity for a time scale of weeks to months to years, in exceptional cases (Rees, 1988; Evans & Kochanek, 1989; Phinney, 1989; Lodato et al., 2009). For SMBH masses M⊙ the luminosity can even exceed the Eddington luminosity (Guillochon & Ramirez-Ruiz 2013).
Recent multi-wavelength observations have revealed a diverse set of properties for TDEs. They can roughly be divided into two categories: thermal TDEs without a strong relativistic jet and non-thermal TDEs with a relativistic jet that probably has a relatively low inclination angle with respect to our line of sight, i.e., Jetted TDEs. The inferred event rate of thermal TDEs is per year per galaxy (see Stone et al. 2020 for a recent review), whereas that of the jetted TDEs is much lower as evidenced by the detection of only three jetted TDEs despite their much larger (beamed) luminosity (Levan et al., 2011; Burrows et al., 2011; Cenko et al., 2012; Brown et al., 2015). While some of the thermal TDEs shine brightly only in soft-X-ray wavebands (i.e., soft-X-ray TDEs) (see Saxton et al., 2021, for a recent review), others are bright mainly in optical/UV wavebands (i.e., optical/UV TDEs; see van Velzen et al. 2020 for a recent review). In addition, there is a growing number of optical, radio, and X-ray bright TDEs (e.g., Holoien et al. 2016; van Velzen et al. 2016; Gezari et al. 2017; Wevers et al. 2019; Nicholl et al. 2020; Stein et al. 2020; Cannizzaro et al. 2021). Interestingly, one of these, AT2019dsg, might also be responsible for (possible) neutrino emission (Stein et al., 2020; Hayasaki, 2021). It is proposed that the observed diversity of thermal TDEs can be explained, in part, by the viewing angle of the observer relative to the orientation of the disk angular momentum (Dai et al., 2018).
In another thermal TDE, ASASSN-15oi, the X-ray emission rose 1 year after the optical/UV peak as observed by Swift and XMM-Newon (Gezari et al., 2017). It has been proposed that this late rise in X-ray emission in ASASSN-15oi was related to the accretion disk becoming less puffed-up with time due to a decrease in mass accretion rate and/or the settling of the accretion disk in the BH equatorial plane (Wen et al. 2020). Besides, ASASSN-15lh is a highly luminous optical/UV transient regarded as a TDE candidate to explain the observational properties. The observed UV rebrightening at after the first UV peak is interpreted by viscously-delayed, reprocessed, accretion onto the SMBH (Leloudas et al., 2016). Recently, using Chandra observations Jonker et al. (2020, J20 hereafter) have detected X-ray emission at late times ( yr) from a few optically-selected TDEs. The period (i.e., ) between the optical and X-ray detections is several years on average, although the X-ray coverage of the optical light curve is sparse so a shorter delay time is possible as well in many cases. In J20 it was mentioned that the will depend on the TDE parameters such as , and the mass and spin of the black hole. Instead of the geometrical effect invoked by Wen et al. (2020) to explain ASASSN-15oi’s behavior, which could indeed play a role as well in individual systems, in this paper, we aim to explain and quantify the in TDEs in terms of a difference in the emission mechanisms brought about by the circularization and disk accretion processes.
2 Viscous diffusion of the circularized disk
The tidal disruption radius expressed in units of the Schwarzschild radius is given by
| (1) |
where is mass of the central SMBH, and are the stellar mass and radius, is the Schwarzschild radius of the SMBH, is the speed of light, and we adopt , , and as fiducial values throughout the paper 111As is expressed in units of the Schwarzschild radius, which is in itself a function of SMBH mass, the dependence of on SMBH mass goes as Mbh,6 to the power of ., unless otherwise noted. We furthermore take as fiducial value, where is the penetration factor, which is defined as the ratio between the tidal disruption and the orbital pericenter radii of the disrupted star. After the tidal disruption of a star, the stellar debris falls back towards the SMBH and the stream will self-interact. In a so called self-interaction shock orbital energy of the stream is converted into thermal energy.
It is still debated if, and if so, how all the stellar debris efficiently circularizes by the stream-stream collision. Some hydrodynamical simulations show that the TDE disk retains a significantly elliptical shape because the orbital energy is not dissipated efficiently enough to reduce the eccentricity of the entire disk to zero in a reasonable time (Guillochon et al., 2014; Shiokawa et al., 2015; Sądowski et al., 2016). Lu & Bonnerot (2020) show that a significant fraction of the debris can become unbound causing an outflow from the self-interaction region. Nevertheless, the debris that remains bound eventually contributes to the accretion flow around the SMBH. This part of the debris stream will finally be circularized by energy dissipation, leading to the formation of a small, initially ring-like, accretion disk around the black hole (Hayasaki et al., 2013; Bonnerot et al., 2016; Hayasaki et al., 2016). Note that, in an inefficient debris circularization case, the subsequent fallback material interacts with the outer elliptical debris so that their effect on the subsequent evolution of the initial ring is negligible. Angular momentum conservation allows us to estimate the circularization radius of the stellar debris, which is given by
| (2) |
where is the orbital eccentricity of the stellar orbit, is the pericenter distance radius. If debris circularization takes place only through dissipation at the self-interaction shock, the circularization timescale for the non-magnetized, most tightly bound debris can be estimated based on the ballistic approximation (Bonnerot et al., 2017) as
| (3) |
where the orbital period of the stellar debris on the most tightly bound orbit:
| (4) |
and is the dynamical angular frequency of the star, and we introduce as the circularization efficiency which represents how efficiently the kinetic energy at the stream-stream collision is dissipated and the most efficient () case corresponds to that of Bonnerot et al. (2017). Note that is not the circularization timescale of all the stellar debris. Our interest here is in the circularization timescale and radius of the most tightly bound debris because the accretion of this debris contributes most to the delayed X-ray peak luminosity in terms of the emitted energy.
The mass fallback rate is given by
| (5) |
where is for the standard case (Evans & Kochanek, 1989; Phinney, 1989). If a star on a slightly hyperbolic orbit is tidally disrupted by a SMBH, the resultant stellar debris is more loosely bound than the standard parabolic case, reducing the mass fallback rate significantly (Hayasaki et al., 2018). These hyperbolic TDEs have , and the power-law index of the temporal evolution is slightly larger than (Hayasaki et al., 2018; Park & Hayasaki, 2020). In the discussion here, the detailed slope of the mass fallback rate is not important, therefore, we do not parametrize the temporal power-law index.
The process responsible for the high optical luminosity in TDEs is still a matter of debate. One of the promising models is the shock-powered scenario where most of the observed optical emission is released around the self-interaction shock (Shiokawa et al., 2015; Piran et al., 2015; Ryu et al., 2020a). By using equations (4) and (5), the peak optical luminosity is estimated to be at most
| (6) |
where is the orbital semi-major axis of the most tightly bound debris. We can evaluate by equating the debris orbital energy with the tidal potential as
| (7) |
where we neglect the effect that the internal structure of the star will have on the spread of the orbital energies over the debris. Note that can be more than one order of magnitude lower if the heat produced by the shock is liberated radiatively inefficiently (Jiang et al., 2016). Since the energy liberated in the shock according to equation (6) is too low for the entire debris to be fully circularized, the remaining debris could form an eccentric disk (Svirski et al., 2017; Liu et al., 2017; Zanazzi & Ogilvie, 2020; Lynch & Ogilvie, 2021). However, even for an eccentric disk, the bolometric luminosity is comparable to (Zanazzi & Ogilvie, 2020).
Substituting equation (3) into equation (5), we obtain the mass fallback rate after the most tightly bound debris is circularized:
| (8) |
where is the Eddington accretion rate and
| (9) |
is the Eddington luminosity with the proton mass and the Thomson scattering cross section . For the given black hole and stellar masses and the stellar radius, we obtain the condition that is smaller than to be sub-Eddington rate as
| (10) |
Our model noted below is applicable for this parameter range.
The viscous timescale is estimated through the viscosity prescription (Shakura & Sunyaev 1973) as
| (11) |
where , is the Shakura-Sunyaev viscosity parameter, is the sound speed in the disk, is the disk scale height, and is a Keplerian angular frequency of the disk. Adopting the standard disk model (Shakura & Sunyaev, 1973), the square of the disk scale-height at is estimated to be
| (12) |
Substituting equation (12) into (11), we obtain the viscous diffusion timescale at as
| (13) |
Because is much longer than the circularization timescale of the most tightly bound debris, the subsequent disk evolves viscously.
2.1 Evolution and structure of a time-dependent accretion disk
Let us describe the subsequent disk evolution. We assume that the disk is one-dimensional (1D), axisymmetric. Mass and angular momentum conservation laws of the viscous accretion disk for a point-mass gravitational potential provide the equation for the surface density evolution as (e.g., see Frank et al. 2002; Kato et al. 2008 and references therein)
| (14) |
where is the viscous stress tensor of the disk in Keplerian rotation.
Adopting for the viscous stress tensor with a power-law index
| (15) |
we can make equation (14) dimensionless (Kato et al., 1998, 2008)
| (16) |
where with being the surface density at the circularization radius , , and . From equations (11) and (15), so that should be smaller than in order for the viscous timescale to be longer at larger radius. Because is only a power-law function of radius from equation (15), we can analytically solve equation (16) by using the Green’s function (Lynden-Bell & Pringle, 1974). The solution with the zero torque boundary is then given by
| (17) |
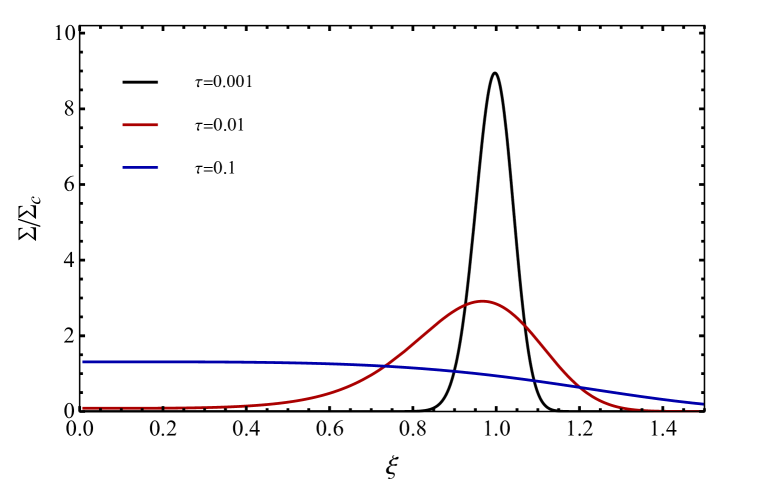
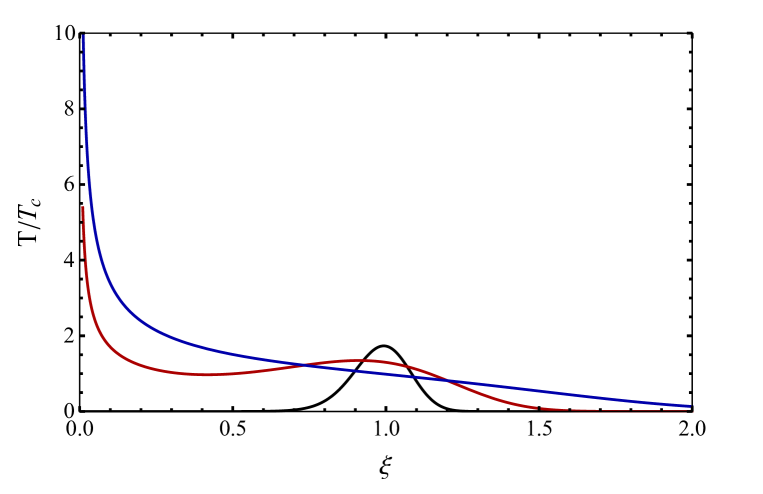
where is the modified Bessel function and . We show the surface density evolution for the three different times in Figure 1, where (i.e., ) is adopted. The disk has initially a ring-like structure, which is shown in the black solid line, and subsequently evolves viscously. The red and blue solid lines show the surface densities at and , respectively. The figure shows that the circularized ring-like most-bound debris formed at accretes onto the SMBH at , leading to a delayed X-ray flare. The time it takes for the debris to be accreted by the SMBH can be evaluated using equation (13):
| (18) |
where and our solution indicates as a typical value of .
The time delay between the optical and X-ray flares is then determined by the sum of and (equations 3 and 18) as
| (19) | |||||
where we adopt the approximate formula of the stellar mass-radius relation:
| (20) |
which is valid over the range of (Ryu et al., 2020b), incorporating the dependence on into that of . We find that depends strongly on the penetration factor , while it depends less strongly on mass of the disrupted star. While becomes rapidly shorter with increasing black hole mass, depends less strongly on the black hole mass. As a result, is shorter the larger the black hole mass. By substituting equation (20) into equation (10), the condition that is simplified to be
| (21) |
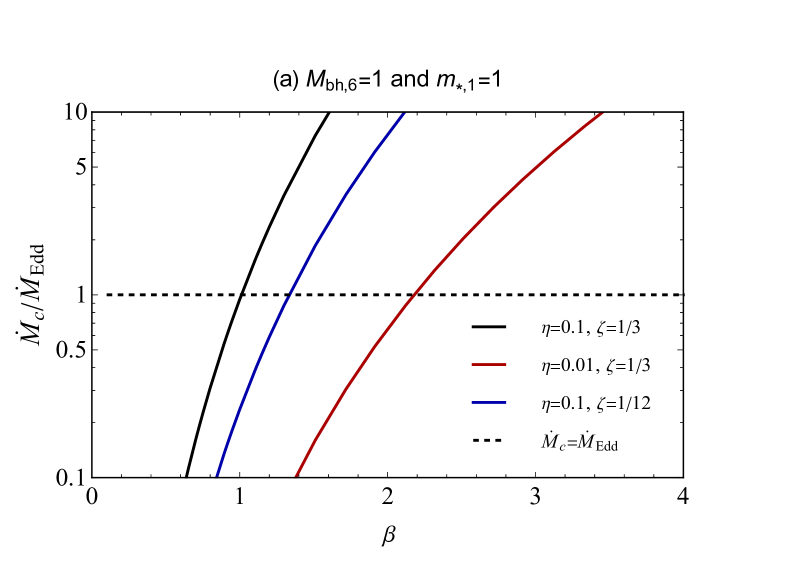
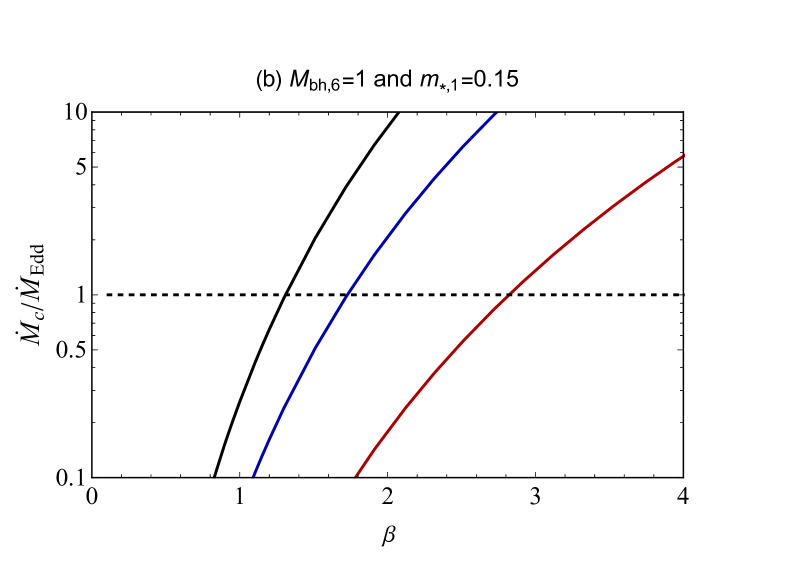
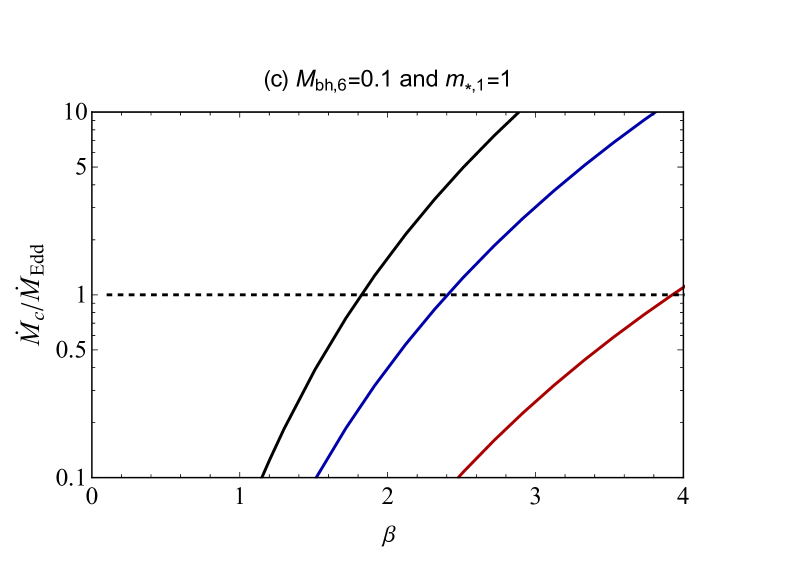
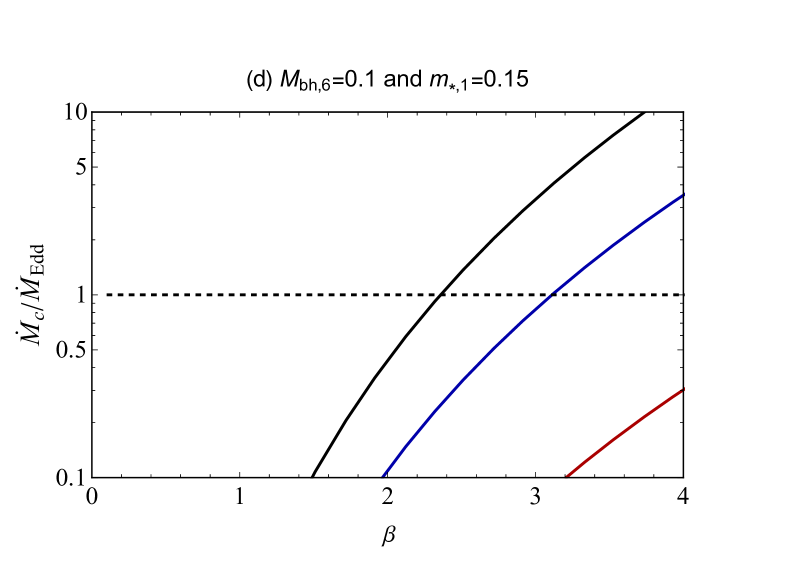
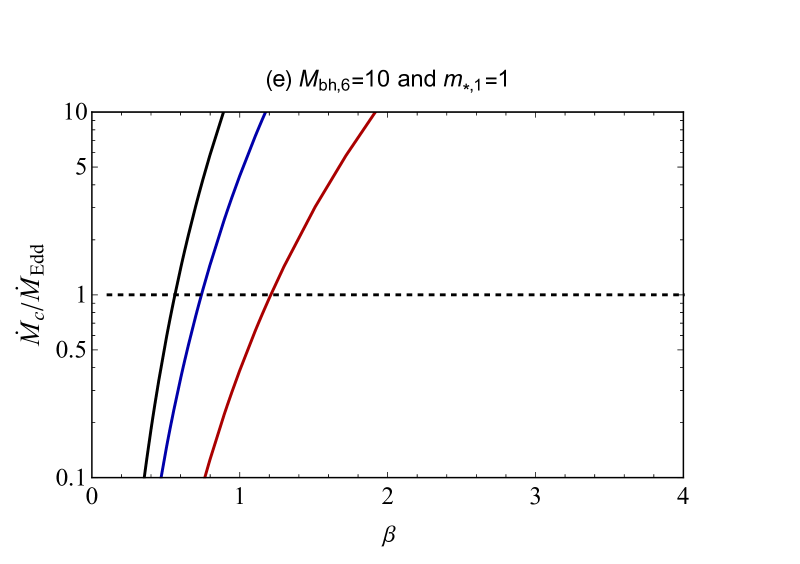
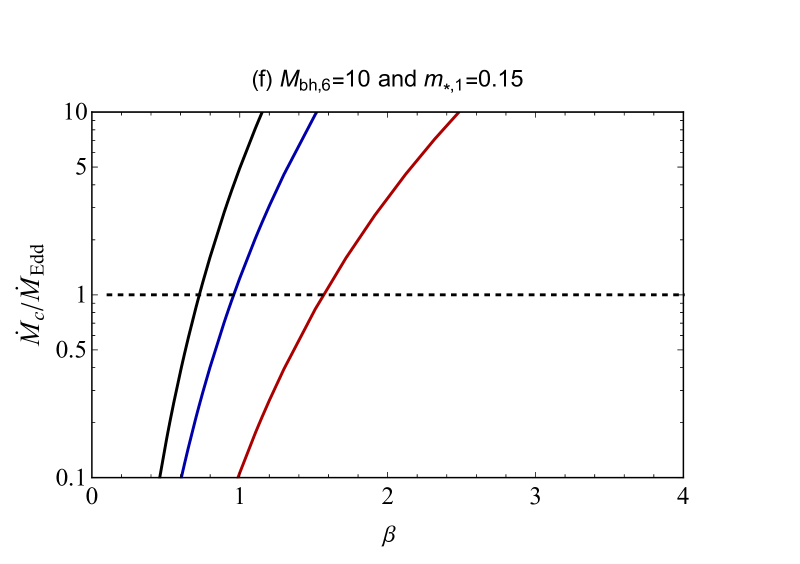
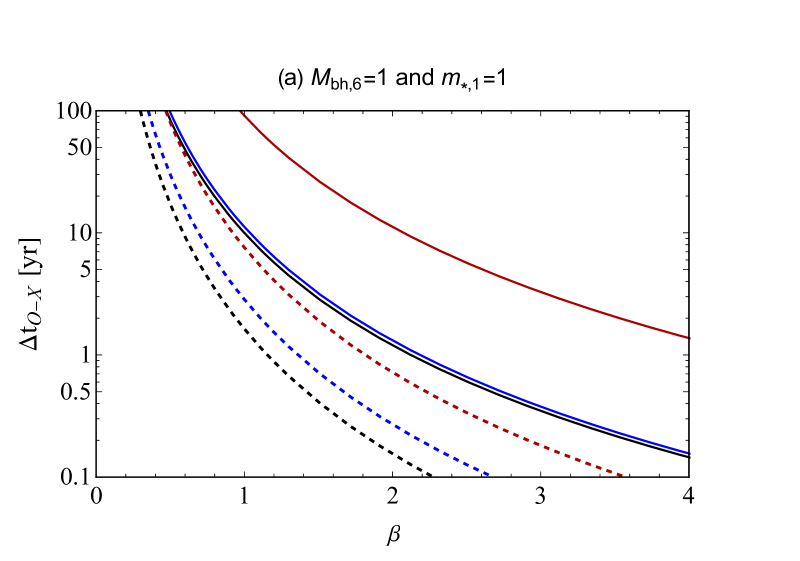
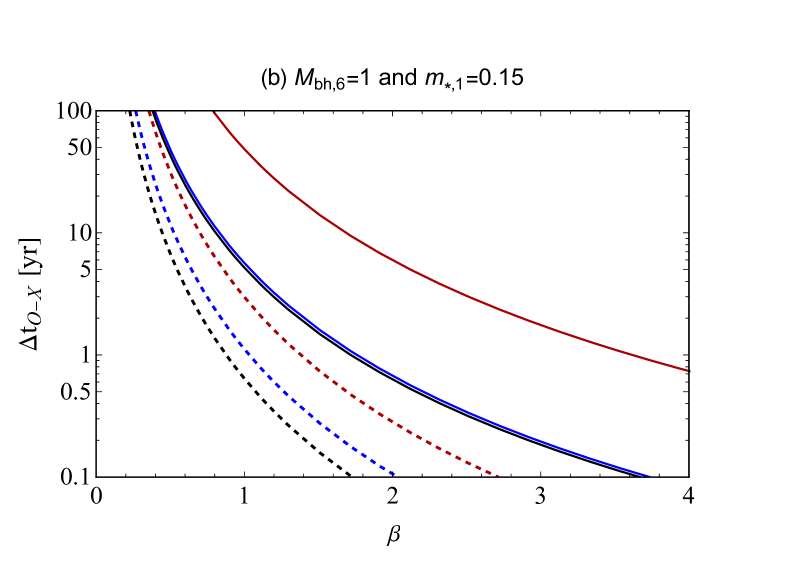
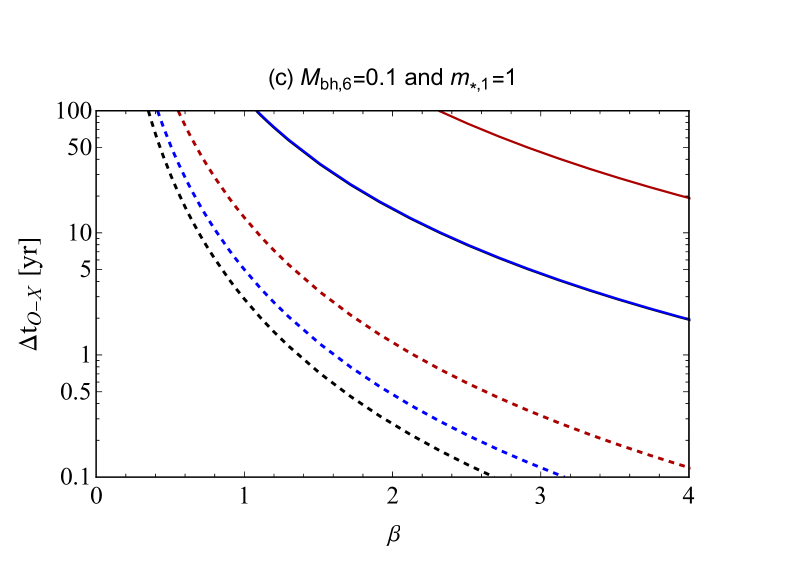
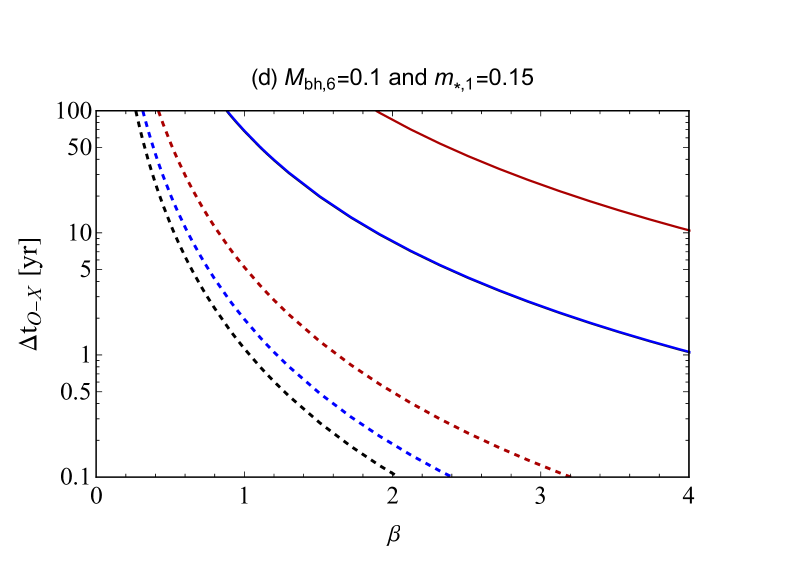
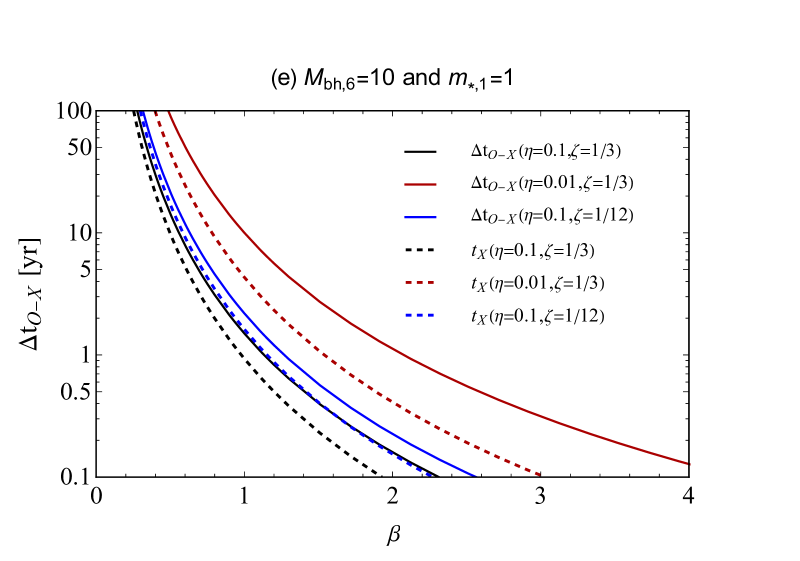
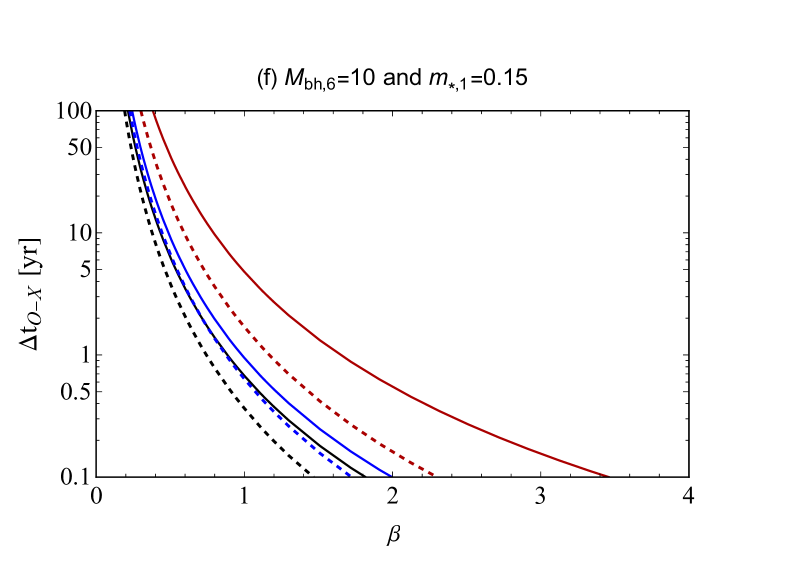
This inequality shows the parameter space where our model is applicable for given black hole and stellar masses. Figure 2 shows the dependence of on the penetration factor. Panel (a) represents our fiducial model with and , while panel (b) shows the case for a lower stellar mass . Panels (c) and (d) are for , and also panels (e) and (f) are for . The solid black, red, and blue lines denote the , , and cases, respectively. While the sub-Eddington accretion is dominant in the region below the horizontal dashed line, the super-Eddington accretion is dominant in the region above the horizontal dashed line.
Figure 3 shows the dependence of on for different stellar and black hole mass and for given other parameters: , , and . Note that similar to the effect of changing or , changing or affects the height of each curve. The solid line represents , whereas the dotted line represents . Both and decrease rapidly with increasing as seen in equations (18) and (19). Since is defined as the sum of the circularization timescale and , the difference between the solid and dotted lines gives the circularization timescale. The circularization timescale accounts for a large fraction of in a large part of the parameter space. As seen in equation (19), the circularization timescale is proportional to whereas is proportional to so that is closer to with increasing black hole mass. In fact, as seen in panels (e) and (f), the difference is significantly smaller for case than for the other two cases of the and . Also, is an important parameter for estimating ; a smaller results in a longer and by definition a longer . Since does not affect , the deviation between the solid and dotted lines becomes larger for a smaller . In summary, is dominated by for and a larger , while is dominated by for and a smaller . The possible range for such that the accretion rate is sub-Eddington is seen in the corresponding panels of Figure 2. We conclude that our model can explain an observed time delay of a year to dozens of years between the optical and X-ray flares.
2.2 Spectra of a time-dependent disk
Since the disk is effectively optically thick, the energy liberated by viscous heating is emitted through black body radiation. That is to say, , where and . We then obtain the blackbody temperature by substituting equation (15) into ,
| (22) |
The lower panel of Figure 1 depicts the corresponding temperature evolution of the disk.
In the spectral range where the electron scattering opacity dominates the free-free absorption opacity , the emergent specific intensity, , is modified from to be (Felten & Rees, 1972; Shakura & Sunyaev, 1973), where is the Planck constant, is the Boltzmann constant, is the Planck function, and is a distortion factor for the outgoing radiation from the disk surface:
| (23) |
(Rybicki & Lightman, 1979; Kato et al., 2008). Note that in the spectral range of so that . The flux density emerging from an accretion disk is expressed in the solid angle integral (Frank et al., 2002; Kato et al., 2008) as
| (24) |
where is the angle between the observer’s line of sight and the normal to the disk plane, is the distance to the Earth, and and are the radii of the disk inner and outer edge, respectively. The spectral luminosity follows from equation (24) as
| (25) |
where , , is the mass density at . For the purpose of comparing equation (25) with the blackbody spectral luminosity emitted from the standard disk, setting together with , the spectral luminosity is estimated to be
| (26) | |||||
where is the standard disk value, , , , , and are adopted, and and . We note that changes as a function of the black hole spin (Bardeen et al. 1972).
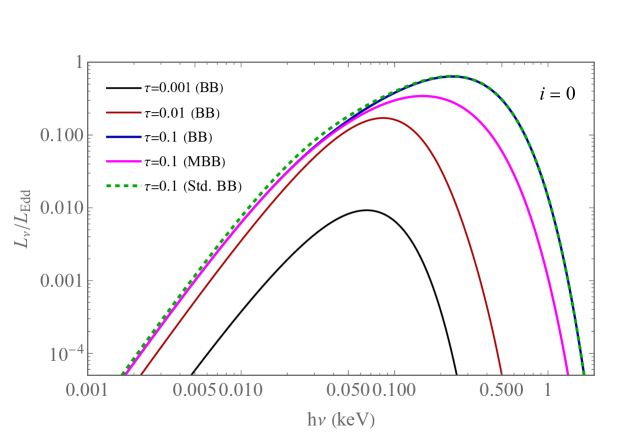
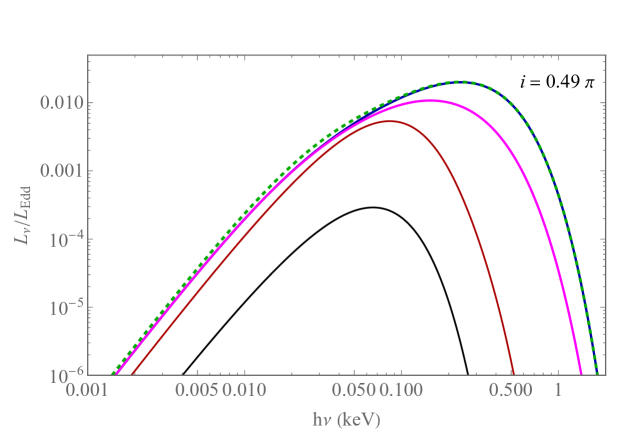
Figure 4 shows the spectral luminosity at respective time steps: , , and for two different inclination angles. The blue solid line shows the spectral luminosity of our time-dependent model at , whereas the green dashed line shows the spectral luminosity of a standard, i.e., steady-state, disk model corresponding to our mode at . It can be seen from Figure 4 that there is no large difference in the spectral energy distribution between the disk and the standard disk save for the slightly larger luminosity for the standard disk at the low energy side. The magenta solid line represents the spectral luminosity calculated based on the multi-color modified blackbody spectrum of our model at . The multi-color modified blackbody disk luminosity is significantly lower than the multi-color blackbody disk luminosity at the high-energy side, whereas it is in good agreement with the multi-color blackbody disk luminosity at the low-energy side. This is because, as seen in equation (23), is smaller than for in the high temperature region of the disk, whereas for in the low temperature region. Also, it is clear that the optical luminosity coming from the disk at early times is very low. This suggests the origin of the optical emission should be sought elsewhere, and the shock-powered optical luminosity caused by the debris self-interaction is a good contender model. In contrast, at late times, after a fraction of the viscous timescale has passed, the soft X-ray luminosity is a small fraction of the Eddington luminosity if the line of sight corresponds to the disk mid-plane, i.e., (edge-on view). This can explain the late-time X-ray luminosity observed in several optically discovered TDEs (J20). On the other hand, the X-ray luminosity gets close to the Eddington luminosity in the (pole-on) case.
This is also consistent with what Dai et al. (2018) proposed before, i.e., the soft-X-ray luminosity becomes higher (lower) when the viewing angle, , decreases (increases). According to the general relativistic radiation magnetohydrodynamic simulations of Dai et al. (2018), the lower the viewing angle is, the more dominant the effect of the hotter temperature side of the blackbody radiation on the spectral distribution becomes, and the whole distribution shifts to the higher energy side, resulting in a larger X-ray luminosity with a lower viewing angle. In our model, on the other hand, since the spectral distribution is simply proportional to as seen in equations (25) and (26), the X-ray luminosity becomes larger when the viewing angle is lower. The properties of the small sample of sources studied in J20, both their non-detection as well as the relatively low X-ray luminosities are not inconsistent with this picture because the X-ray luminosity depends strongly on several other parameters, e.g., , , and , and the values in the TDEs studied in J20 can depart from the fiducial values we adopted here.
3 Summary and Discussion
We have studied the black-body emission from a 1D time-dependent accretion disk formed after debris circularization to explain the significant time difference between the optical and and subsequent X-ray detection in several optically selected TDEs. We have solved equation (14) using the separation of variables method and the Green’s function. Cannizzo et al. (1990) solved the same diffusion equation as equation (14) using a self-similar solution method and then found that the light curve deviates from at late times. Both methods are good for calculating the secular, long-term evolution of the disk. In particular, our model is suitable for the so-called initial value problem, i.e., how the disk accretes diffusively from the initial ring-like structure to the SMBH. However, since our model makes the simplifying assumption that the viscous torque is a power-law function of radius and surface density as in equation (15), the general behavior needs to be checked using numerical calculations. Also, if the disk is thermally unstable, we need to solve the disk evolution and structure numerically with the energy equation (e.g., Honma et al. 1991). These cases and their influence on will be investigated in future work.
According to the shock powered scenario, the early-time optical emission is caused by energy dissipation from the shock formed due to the debris stream self-interaction at the orbital semi-major axis of the most tightly bound debris. The debris’s orbital energy is subsequently dissipated such that the most tightly bound debris is evolving towards circularization. The circularized disk viscously evolves as seen in the top panel (a) of Figure 1. The disk initially has a ring-like structure around the circularization radius. In our model, material of the disk accretes onto the SMBH by viscous diffusion for one-tenth of the viscous timescale. As seen in equation (19), the time delay between the optical and X-ray flares is the sum of the circularization timescale and the accretion timescale so that the viscous accretion is one of the two essential factors to cause the delayed X-ray emission. This delay amounts to years for typical parameters after the peak of optical emission in the optical/UV TDEs if the mass fallback rate is sub-Eddington (our fiducial parameters are a M⊙ black hole, a star, , , , and ). We find that the viscous timescale is most sensitive to the penetration factor, , whereas the viscous timescale is relatively insensitive to the black hole mass. Note that although the second-most sensitive parameters are stellar mass and radius, the effect of the two parameters on cancels each other out by the mass-radius relation for the main-sequence star, resulting in being insensitive for the stellar mass. On the other hand, the circularization timescale also strongly depends on and is sensitive to the circularization efficiency and the black hole mass, whereas it is insensitive to the stellar mass. The delay by the debris circularization amounts years for the fiducial parameters, where we adopt as the fiducial circularization efficiency. The resultant time delay significantly decreases with increasing penetration factor. This strong dependence of on is seen in Figure 3 with the dependence of the other parameters. Note that these parameters should satisfy the condition for the sub-Eddington accretion (see equation 21 and Figure 2). The fiducial is longer than for , while it is shorter than for . This suggests that the observed long-term () for several TDEs involves a star that is tidally disrupted at , while the observed short-term () for TDEs correspond to relatively high penetration factor disruptions.
Next, let us consider what happens to the optical-X-ray time delay if mass accretes onto the SMBH at a super-Eddington rate, (see equation 8), i.e., when . The viscous timescale is times as short for the geometrically thick () compared to the geometrically thin disk case (see equation 11) so that . Therefore, because of . However, we need to confirm whether there is effectively no continuous super-Eddington accretion onto the SMBH during the circularization through self-consistent radiation hydrodynamic simulations of the circularization process using the energy equation including radiative cooling, advective cooling, and viscous heating. Furthermore, we need to quantify the disk spectrum of the super-Eddington accretion flow based on the slim disk model (Abramowicz et al., 1988) for estimating the spectral luminosity of the delayed X-ray flare. We will tackle these problems in the future.
In addition, the viewing angle, which is defined as the angle between the normal to the disk plane and the line of sight, is an important parameter in setting the observed X-ray luminosity. The X-ray luminosity decreases significantly as a function of inclination angle. If the viewing angle goes to zero, the X-ray emission of our fiducial model can reach the luminosity between one-tenth of the Eddington luminosity and the Eddington luminosity. On the other hand, the X-ray luminosity decreases to be less than or approximately equal to one-hundredth of the Eddington luminosity if the viewing angle is close to . Another important parameter determining the luminosity of the disk black-body radiation is the black hole spin. If the black hole has a maximum positive (prograde) spin, the disk’s inner edge is two-thirds smaller than that in the non-rotating case, leading to the larger luminosity in the soft-X-ray waveband (Bardeen et al. 1972, see also figures 2 of both Wen et al. 2020 and Mummery 2021).
References
- Abramowicz et al. (1988) Abramowicz, M. A., Czerny, B., Lasota, J. P., & Szuszkiewicz, E. 1988, ApJ, 332, 646
- Bardeen et al. (1972) Bardeen, J. M., Press, W. H., & Teukolsky, S. A. 1972, ApJ, 178, 347
- Bonnerot et al. (2017) Bonnerot, C., Rossi, E. M., & Lodato, G. 2017, MNRAS, 464, 2816
- Bonnerot et al. (2016) Bonnerot, C., Rossi, E. M., Lodato, G., & Price, D. J. 2016, MNRAS, 455, 2253
- Brown et al. (2015) Brown, G. C., Levan, A. J., Stanway, E. R., et al. 2015, MNRAS, 452, 4297
- Burrows et al. (2011) Burrows, D. N., Kennea, J. A., Ghisellini, G., et al. 2011, Nature, 476, 421
- Cannizzaro et al. (2021) Cannizzaro, G., Wevers, T., Jonker, P. G., et al. 2021, MNRAS, arXiv:2012.10195
- Cannizzo et al. (1990) Cannizzo, J. K., Lee, H. M., & Goodman, J. 1990, ApJ, 351, 38
- Cenko et al. (2012) Cenko, S. B., Krimm, H. A., Horesh, A., et al. 2012, ApJ, 753, 77
- Dai et al. (2018) Dai, L., McKinney, J. C., Roth, N., Ramirez-Ruiz, E., & Miller, M. C. 2018, ApJ, 859, L20
- Evans & Kochanek (1989) Evans, C. R., & Kochanek, C. S. 1989, ApJL, 346, L13
- Felten & Rees (1972) Felten, J. E., & Rees, M. J. 1972, A&A, 17, 226
- Frank et al. (2002) Frank, J., King, A., & Raine, D. J. 2002, Accretion Power in Astrophysics: Third Edition (Cambridge University Press)
- Gezari et al. (2017) Gezari, S., Cenko, S. B., & Arcavi, I. 2017, ApJ, 851, L47
- Guillochon et al. (2014) Guillochon, J., Manukian, H., & Ramirez-Ruiz, E. 2014, ApJ, 783, 23
- Guillochon & Ramirez-Ruiz (2013) Guillochon, J., & Ramirez-Ruiz, E. 2013, ApJ, 767, 25
- Hayasaki (2021) Hayasaki, K. 2021, Nature Astronomy, arXiv:2102.11879
- Hayasaki et al. (2013) Hayasaki, K., Stone, N., & Loeb, A. 2013, MNRAS, 434, 909
- Hayasaki et al. (2016) —. 2016, MNRAS, 461, 3760
- Hayasaki et al. (2018) Hayasaki, K., Zhong, S., Li, S., Berczik, P., & Spurzem, R. 2018, ApJ, 855, 129
- Holoien et al. (2016) Holoien, T. W. S., Kochanek, C. S., Prieto, J. L., et al. 2016, MNRAS, 455, 2918
- Honma et al. (1991) Honma, F., Matsumoto, R., & Kato, S. 1991, PASJ, 43, 147
- Jiang et al. (2016) Jiang, Y.-F., Guillochon, J., & Loeb, A. 2016, ApJ, 830, 125
- Jonker et al. (2020) Jonker, P. G., Stone, N. C., Generozov, A., van Velzen, S., & Metzger, B. 2020, ApJ, 889, 166
- Kato et al. (1998) Kato, S., Fukue, J., & Mineshige, S. 1998, Black-Hole Accretion Disks (Kyoto University Press)
- Kato et al. (2008) —. 2008, Black-Hole Accretion Disks — Towards a New Paradigm — (Kyoto University Press)
- Leloudas et al. (2016) Leloudas, G., Fraser, M., Stone, N. C., et al. 2016, Nature Astronomy, 1, 0002
- Levan et al. (2011) Levan, A. J., Tanvir, N. R., Cenko, S. B., et al. 2011, Science, 333, 199
- Liu et al. (2017) Liu, F. K., Zhou, Z. Q., Cao, R., Ho, L. C., & Komossa, S. 2017, MNRAS, 472, L99
- Lodato et al. (2009) Lodato, G., King, A. R., & Pringle, J. E. 2009, MNRAS, 392, 332
- Lu & Bonnerot (2020) Lu, W., & Bonnerot, C. 2020, MNRAS, 492, 686
- Lynch & Ogilvie (2021) Lynch, E. M., & Ogilvie, G. I. 2021, MNRAS, 500, 4110
- Lynden-Bell & Pringle (1974) Lynden-Bell, D., & Pringle, J. E. 1974, MNRAS, 168, 603
- Mummery (2021) Mummery, A. 2021, arXiv e-prints, arXiv:2104.06203
- Nicholl et al. (2020) Nicholl, M., Wevers, T., Oates, S. R., et al. 2020, MNRAS, 499, 482
- Park & Hayasaki (2020) Park, G., & Hayasaki, K. 2020, ApJ, 900, 3
- Phinney (1989) Phinney, E. S. 1989, in IAU Symposium, Vol. 136, The Center of the Galaxy, ed. M. Morris, 543
- Piran et al. (2015) Piran, T., Svirski, G., Krolik, J., Cheng, R. M., & Shiokawa, H. 2015, ApJ, 806, 164
- Rees (1988) Rees, M. J. 1988, Nature, 333, 523
- Rybicki & Lightman (1979) Rybicki, G. B., & Lightman, A. P. 1979, Radiative processes in astrophysics
- Ryu et al. (2020a) Ryu, T., Krolik, J., & Piran, T. 2020a, ApJ, 904, 73
- Ryu et al. (2020b) Ryu, T., Krolik, J., Piran, T., & Noble, S. C. 2020b, ApJ, 904, 99
- Saxton et al. (2021) Saxton, R., Komossa, S., Auchettl, K., & Jonker, P. G. 2021, Space Sci. Rev., 217, 18
- Shakura & Sunyaev (1973) Shakura, N. I., & Sunyaev, R. A. 1973, A&A, 500, 33
- Shiokawa et al. (2015) Shiokawa, H., Krolik, J. H., Cheng, R. M., Piran, T., & Noble, S. C. 2015, ApJ, 804, 85
- Sądowski et al. (2016) Sądowski, A., Tejeda, E., Gafton, E., Rosswog, S., & Abarca, D. 2016, MNRAS, 458, 4250
- Stein et al. (2020) Stein, R., van Velzen, S., Kowalski, M., et al. 2020, arXiv e-prints, arXiv:2005.05340
- Stone et al. (2020) Stone, N. C., Vasiliev, E., Kesden, M., et al. 2020, Space Sci. Rev., 216, 35
- Svirski et al. (2017) Svirski, G., Piran, T., & Krolik, J. 2017, MNRAS, 467, 1426
- van Velzen et al. (2020) van Velzen, S., Holoien, T. W. S., Onori, F., Hung, T., & Arcavi, I. 2020, Space Sci. Rev., 216, 124
- van Velzen et al. (2016) van Velzen, S., Anderson, G. E., Stone, N. C., et al. 2016, Science, 351, 62
- Wen et al. (2020) Wen, S., Jonker, P. G., Stone, N. C., Zabludoff, A. I., & Psaltis, D. 2020, ApJ, 897, 80
- Wevers et al. (2019) Wevers, T., Pasham, D. R., van Velzen, S., et al. 2019, MNRAS, 488, 4816
- Zanazzi & Ogilvie (2020) Zanazzi, J. J., & Ogilvie, G. I. 2020, MNRAS, 499, 5562