Measurement of cross sections at center-of-mass energies between 3.77 and 4.60 GeV
M. Ablikim1, M. N. Achasov10,b, P. Adlarson67, S. Ahmed15, M. Albrecht4, R. Aliberti28, A. Amoroso66A,66C, M. R. An32, Q. An63,49, X. H. Bai57, Y. Bai48, O. Bakina29, R. Baldini Ferroli23A, I. Balossino24A, Y. Ban38,h, K. Begzsuren26, N. Berger28, M. Bertani23A, D. Bettoni24A, F. Bianchi66A,66C, J. Bloms60, A. Bortone66A,66C, I. Boyko29, R. A. Briere5, H. Cai68, X. Cai1,49, A. Calcaterra23A, G. F. Cao1,54, N. Cao1,54, S. A. Cetin53A, J. F. Chang1,49, W. L. Chang1,54, G. Chelkov29,a, D. Y. Chen6, G. Chen1, H. S. Chen1,54, M. L. Chen1,49, S. J. Chen35, X. R. Chen25, Y. B. Chen1,49, Z. J Chen20,i, W. S. Cheng66C, G. Cibinetto24A, F. Cossio66C, X. F. Cui36, H. L. Dai1,49, X. C. Dai1,54, A. Dbeyssi15, R. E. de Boer4, D. Dedovich29, Z. Y. Deng1, A. Denig28, I. Denysenko29, M. Destefanis66A,66C, F. De Mori66A,66C, Y. Ding33, C. Dong36, J. Dong1,49, L. Y. Dong1,54, M. Y. Dong1,49,54, X. Dong68, S. X. Du71, Y. L. Fan68, J. Fang1,49, S. S. Fang1,54, Y. Fang1, R. Farinelli24A, L. Fava66B,66C, F. Feldbauer4, G. Felici23A, C. Q. Feng63,49, J. H. Feng50, M. Fritsch4, C. D. Fu1, Y. Gao64, Y. Gao38,h, Y. Gao63,49, Y. G. Gao6, I. Garzia24A,24B, P. T. Ge68, C. Geng50, E. M. Gersabeck58, A Gilman61, K. Goetzen11, L. Gong33, W. X. Gong1,49, W. Gradl28, M. Greco66A,66C, L. M. Gu35, M. H. Gu1,49, Y. T. Gu13, C. Y Guan1,54, A. Q. Guo22, L. B. Guo34, R. P. Guo40, Y. P. Guo9,f, A. Guskov29,a, T. T. Han41, W. Y. Han32, X. Q. Hao16, F. A. Harris56, K. L. He1,54, F. H. Heinsius4, C. H. Heinz28, Y. K. Heng1,49,54, C. Herold51, M. Himmelreich11,d, T. Holtmann4, G. Y. Hou1,54, Y. R. Hou54, Z. L. Hou1, H. M. Hu1,54, J. F. Hu47,j, T. Hu1,49,54, Y. Hu1, G. S. Huang63,49, L. Q. Huang64, X. T. Huang41, Y. P. Huang1, Z. Huang38,h, T. Hussain65, N Hüsken22,28, W. Ikegami Andersson67, W. Imoehl22, M. Irshad63,49, S. Jaeger4, S. Janchiv26, Q. Ji1, Q. P. Ji16, X. B. Ji1,54, X. L. Ji1,49, Y. Y. Ji41, H. B. Jiang41, X. S. Jiang1,49,54, J. B. Jiao41, Z. Jiao18, S. Jin35, Y. Jin57, M. Q. Jing1,54, T. Johansson67, N. Kalantar-Nayestanaki55, X. S. Kang33, R. Kappert55, M. Kavatsyuk55, B. C. Ke43,1, I. K. Keshk4, A. Khoukaz60, P. Kiese28, R. Kiuchi1, R. Kliemt11, L. Koch30, O. B. Kolcu53A,m, B. Kopf4, M. Kuemmel4, M. Kuessner4, A. Kupsc67, M. G. Kurth1,54, W. Kühn30, J. J. Lane58, J. S. Lange30, P. Larin15, A. Lavania21, L. Lavezzi66A,66C, Z. H. Lei63,49, H. Leithoff28, M. Lellmann28, T. Lenz28, C. Li39, C. H. Li32, Cheng Li63,49, D. M. Li71, F. Li1,49, G. Li1, H. Li63,49, H. Li43, H. B. Li1,54, H. J. Li16, J. L. Li41, J. Q. Li4, J. S. Li50, Ke Li1, L. K. Li1, Lei Li3, Q. Y. Li41,n, P. R. Li31,k,l, S. Y. Li52, W. D. Li1,54, W. G. Li1, X. H. Li63,49, X. L. Li41, Xiaoyu Li1,54, Z. Y. Li50, H. Liang63,49, H. Liang1,54, H. Liang27, Y. F. Liang45, Y. T. Liang25, G. R. Liao12, L. Z. Liao1,54, J. Libby21, C. X. Lin50, B. J. Liu1, C. X. Liu1, D. Liu15,63, F. H. Liu44, Fang Liu1, Feng Liu6, H. B. Liu13, H. M. Liu1,54, Huanhuan Liu1, Huihui Liu17, J. B. Liu63,49, J. L. Liu64, J. Y. Liu1,54, K. Liu1, K. Y. Liu33, L. Liu63,49, M. H. Liu9,f, P. L. Liu1, Q. Liu68, Q. Liu54, S. B. Liu63,49, Shuai Liu46, T. Liu1,54, W. M. Liu63,49, X. Liu31,k,l, Y. Liu31,k,l, Y. B. Liu36, Z. A. Liu1,49,54, Z. Q. Liu41, X. C. Lou1,49,54, F. X. Lu50, H. J. Lu18, J. D. Lu1,54, J. G. Lu1,49, X. L. Lu1, Y. Lu1, Y. P. Lu1,49, C. L. Luo34, M. X. Luo70, P. W. Luo50, T. Luo9,f, X. L. Luo1,49, X. R. Lyu54, F. C. Ma33, H. L. Ma1, L. L. Ma41, M. M. Ma1,54, Q. M. Ma1, R. Q. Ma1,54, R. T. Ma54, X. X. Ma1,54, X. Y. Ma1,49, F. E. Maas15, M. Maggiora66A,66C, S. Maldaner4, S. Malde61, Q. A. Malik65, A. Mangoni23B, Y. J. Mao38,h, Z. P. Mao1, S. Marcello66A,66C, Z. X. Meng57, J. G. Messchendorp55, G. Mezzadri24A, T. J. Min35, R. E. Mitchell22, X. H. Mo1,49,54, N. Yu. Muchnoi10,b, H. Muramatsu59, S. Nakhoul11,d, Y. Nefedov29, F. Nerling11,d, I. B. Nikolaev10,b, Z. Ning1,49, S. Nisar8,g, S. L. Olsen54, Q. Ouyang1,49,54, S. Pacetti23B,23C, X. Pan9,f, Y. Pan58, A. Pathak1, A. Pathak27, P. Patteri23A, M. Pelizaeus4, H. P. Peng63,49, K. Peters11,d, J. Pettersson67, J. L. Ping34, R. G. Ping1,54, S. Pogodin29, R. Poling59, V. Prasad63,49, H. Qi63,49, H. R. Qi52, K. H. Qi25, M. Qi35, T. Y. Qi9, S. Qian1,49, W. B. Qian54, Z. Qian50, C. F. Qiao54, L. Q. Qin12, X. P. Qin9, X. S. Qin41, Z. H. Qin1,49, J. F. Qiu1, S. Q. Qu36, K. H. Rashid65, K. Ravindran21, C. F. Redmer28, A. Rivetti66C, V. Rodin55, M. Rolo66C, G. Rong1,54, Ch. Rosner15, M. Rump60, H. S. Sang63, A. Sarantsev29,c, Y. Schelhaas28, C. Schnier4, K. Schoenning67, M. Scodeggio24A,24B, D. C. Shan46, W. Shan19, X. Y. Shan63,49, J. F. Shangguan46, M. Shao63,49, C. P. Shen9, H. F. Shen1,54, P. X. Shen36, X. Y. Shen1,54, H. C. Shi63,49, R. S. Shi1,54, X. Shi1,49, X. D Shi63,49, J. J. Song41, W. M. Song27,1, Y. X. Song38,h, S. Sosio66A,66C, S. Spataro66A,66C, K. X. Su68, P. P. Su46, F. F. Sui41, G. X. Sun1, H. K. Sun1, J. F. Sun16, L. Sun68, S. S. Sun1,54, T. Sun1,54, W. Y. Sun34, W. Y. Sun27, X Sun20,i, Y. J. Sun63,49, Y. K. Sun63,49, Y. Z. Sun1, Z. T. Sun1, Y. H. Tan68, Y. X. Tan63,49, C. J. Tang45, G. Y. Tang1, J. Tang50, J. X. Teng63,49, V. Thoren67, W. H. Tian43, Y. T. Tian25, I. Uman53B, B. Wang1, C. W. Wang35, D. Y. Wang38,h, H. J. Wang31,k,l, H. P. Wang1,54, K. Wang1,49, L. L. Wang1, M. Wang41, M. Z. Wang38,h, Meng Wang1,54, W. Wang50, W. H. Wang68, W. P. Wang63,49, X. Wang38,h, X. F. Wang31,k,l, X. L. Wang9,f, Y. Wang50, Y. Wang63,49, Y. D. Wang37, Y. F. Wang1,49,54, Y. Q. Wang1, Y. Y. Wang31,k,l, Z. Wang1,49, Z. Y. Wang1, Ziyi Wang54, Zongyuan Wang1,54, D. H. Wei12, F. Weidner60, S. P. Wen1, D. J. White58, U. Wiedner4, G. Wilkinson61, M. Wolke67, L. Wollenberg4, J. F. Wu1,54, L. H. Wu1, L. J. Wu1,54, X. Wu9,f, Z. Wu1,49, L. Xia63,49, H. Xiao9,f, S. Y. Xiao1, Z. J. Xiao34, X. H. Xie38,h, Y. G. Xie1,49, Y. H. Xie6, T. Y. Xing1,54, G. F. Xu1, Q. J. Xu14, W. Xu1,54, X. P. Xu46, Y. C. Xu54, F. Yan9,f, L. Yan9,f, W. B. Yan63,49, W. C. Yan71, Xu Yan46, H. J. Yang42,e, H. X. Yang1, L. Yang43, S. L. Yang54, Y. X. Yang12, Yifan Yang1,54, Zhi Yang25, M. Ye1,49, M. H. Ye7, J. H. Yin1, Z. Y. You50, B. X. Yu1,49,54, C. X. Yu36, G. Yu1,54, J. S. Yu20,i, T. Yu64, C. Z. Yuan1,54, L. Yuan2, X. Q. Yuan38,h, Y. Yuan1, Z. Y. Yuan50, C. X. Yue32, A. A. Zafar65, X. Zeng Zeng6, Y. Zeng20,i, A. Q. Zhang1, B. X. Zhang1, Guangyi Zhang16, H. Zhang63, H. H. Zhang27, H. H. Zhang50, H. Y. Zhang1,49, J. J. Zhang43, J. L. Zhang69, J. Q. Zhang34, J. W. Zhang1,49,54, J. Y. Zhang1, J. Z. Zhang1,54, Jianyu Zhang1,54, Jiawei Zhang1,54, L. M. Zhang52, L. Q. Zhang50, Lei Zhang35, S. Zhang50, S. F. Zhang35, Shulei Zhang20,i, X. D. Zhang37, X. Y. Zhang41, Y. Zhang61, Y. T. Zhang71, Y. H. Zhang1,49, Yan Zhang63,49, Yao Zhang1, Z. Y. Zhang68, G. Zhao1, J. Zhao32, J. Y. Zhao1,54, J. Z. Zhao1,49, Lei Zhao63,49, Ling Zhao1, M. G. Zhao36, Q. Zhao1, S. J. Zhao71, Y. B. Zhao1,49, Y. X. Zhao25, Z. G. Zhao63,49, A. Zhemchugov29,a, B. Zheng64, J. P. Zheng1,49, Y. H. Zheng54, B. Zhong34, C. Zhong64, L. P. Zhou1,54, Q. Zhou1,54, X. Zhou68, X. K. Zhou54, X. R. Zhou63,49, X. Y. Zhou32, A. N. Zhu1,54, J. Zhu36, K. Zhu1, K. J. Zhu1,49,54, S. H. Zhu62, T. J. Zhu69, W. J. Zhu9,f, W. J. Zhu36, Y. C. Zhu63,49, Z. A. Zhu1,54, B. S. Zou1, J. H. Zou1
(BESIII Collaboration)
1 Institute of High Energy Physics, Beijing 100049, People’s Republic of China
2 Beihang University, Beijing 100191, People’s Republic of China
3 Beijing Institute of Petrochemical Technology, Beijing 102617, People’s Republic of China
4 Bochum Ruhr-University, D-44780 Bochum, Germany
5 Carnegie Mellon University, Pittsburgh, Pennsylvania 15213, USA
6 Central China Normal University, Wuhan 430079, People’s Republic of China
7 China Center of Advanced Science and Technology, Beijing 100190, People’s Republic of China
8 COMSATS University Islamabad, Lahore Campus, Defence Road, Off Raiwind Road, 54000 Lahore, Pakistan
9 Fudan University, Shanghai 200443, People’s Republic of China
10 G.I. Budker Institute of Nuclear Physics SB RAS (BINP), Novosibirsk 630090, Russia
11 GSI Helmholtzcentre for Heavy Ion Research GmbH, D-64291 Darmstadt, Germany
12 Guangxi Normal University, Guilin 541004, People’s Republic of China
13 Guangxi University, Nanning 530004, People’s Republic of China
14 Hangzhou Normal University, Hangzhou 310036, People’s Republic of China
15 Helmholtz Institute Mainz, Staudinger Weg 18, D-55099 Mainz, Germany
16 Henan Normal University, Xinxiang 453007, People’s Republic of China
17 Henan University of Science and Technology, Luoyang 471003, People’s Republic of China
18 Huangshan College, Huangshan 245000, People’s Republic of China
19 Hunan Normal University, Changsha 410081, People’s Republic of China
20 Hunan University, Changsha 410082, People’s Republic of China
21 Indian Institute of Technology Madras, Chennai 600036, India
22 Indiana University, Bloomington, Indiana 47405, USA
23 INFN Laboratori Nazionali di Frascati , (A)INFN Laboratori Nazionali di Frascati, I-00044, Frascati, Italy; (B)INFN Sezione di Perugia, I-06100, Perugia, Italy; (C)University of Perugia, I-06100, Perugia, Italy
24 INFN Sezione di Ferrara, (A)INFN Sezione di Ferrara, I-44122, Ferrara, Italy; (B)University of Ferrara, I-44122, Ferrara, Italy
25 Institute of Modern Physics, Lanzhou 730000, People’s Republic of China
26 Institute of Physics and Technology, Peace Ave. 54B, Ulaanbaatar 13330, Mongolia
27 Jilin University, Changchun 130012, People’s Republic of China
28 Johannes Gutenberg University of Mainz, Johann-Joachim-Becher-Weg 45, D-55099 Mainz, Germany
29 Joint Institute for Nuclear Research, 141980 Dubna, Moscow region, Russia
30 Justus-Liebig-Universitaet Giessen, II. Physikalisches Institut, Heinrich-Buff-Ring 16, D-35392 Giessen, Germany
31 Lanzhou University, Lanzhou 730000, People’s Republic of China
32 Liaoning Normal University, Dalian 116029, People’s Republic of China
33 Liaoning University, Shenyang 110036, People’s Republic of China
34 Nanjing Normal University, Nanjing 210023, People’s Republic of China
35 Nanjing University, Nanjing 210093, People’s Republic of China
36 Nankai University, Tianjin 300071, People’s Republic of China
37 North China Electric Power University, Beijing 102206, People’s Republic of China
38 Peking University, Beijing 100871, People’s Republic of China
39 Qufu Normal University, Qufu 273165, People’s Republic of China
40 Shandong Normal University, Jinan 250014, People’s Republic of China
41 Shandong University, Jinan 250100, People’s Republic of China
42 Shanghai Jiao Tong University, Shanghai 200240, People’s Republic of China
43 Shanxi Normal University, Linfen 041004, People’s Republic of China
44 Shanxi University, Taiyuan 030006, People’s Republic of China
45 Sichuan University, Chengdu 610064, People’s Republic of China
46 Soochow University, Suzhou 215006, People’s Republic of China
47 South China Normal University, Guangzhou 510006, People’s Republic of China
48 Southeast University, Nanjing 211100, People’s Republic of China
49 State Key Laboratory of Particle Detection and Electronics, Beijing 100049, Hefei 230026, People’s Republic of China
50 Sun Yat-Sen University, Guangzhou 510275, People’s Republic of China
51 Suranaree University of Technology, University Avenue 111, Nakhon Ratchasima 30000, Thailand
52 Tsinghua University, Beijing 100084, People’s Republic of China
53 Turkish Accelerator Center Particle Factory Group, (A)Istanbul Bilgi University, HEP Res. Cent., 34060 Eyup, Istanbul, Turkey; (B)Near East University, Nicosia, North Cyprus, Mersin 10, Turkey
54 University of Chinese Academy of Sciences, Beijing 100049, People’s Republic of China
55 University of Groningen, NL-9747 AA Groningen, The Netherlands
56 University of Hawaii, Honolulu, Hawaii 96822, USA
57 University of Jinan, Jinan 250022, People’s Republic of China
58 University of Manchester, Oxford Road, Manchester, M13 9PL, United Kingdom
59 University of Minnesota, Minneapolis, Minnesota 55455, USA
60 University of Muenster, Wilhelm-Klemm-Str. 9, 48149 Muenster, Germany
61 University of Oxford, Keble Rd, Oxford, United Kingdom OX13RH
62 University of Science and Technology Liaoning, Anshan 114051, People’s Republic of China
63 University of Science and Technology of China, Hefei 230026, People’s Republic of China
64 University of South China, Hengyang 421001, People’s Republic of China
65 University of the Punjab, Lahore-54590, Pakistan
66 University of Turin and INFN, (A)University of Turin, I-10125, Turin, Italy; (B)University of Eastern Piedmont, I-15121, Alessandria, Italy; (C)INFN, I-10125, Turin, Italy
67 Uppsala University, Box 516, SE-75120 Uppsala, Sweden
68 Wuhan University, Wuhan 430072, People’s Republic of China
69 Xinyang Normal University, Xinyang 464000, People’s Republic of China
70 Zhejiang University, Hangzhou 310027, People’s Republic of China
71 Zhengzhou University, Zhengzhou 450001, People’s Republic of China
a Also at the Moscow Institute of Physics and Technology, Moscow 141700, Russia
b Also at the Novosibirsk State University, Novosibirsk, 630090, Russia
c Also at the NRC ”Kurchatov Institute”, PNPI, 188300, Gatchina, Russia
d Also at Goethe University Frankfurt, 60323 Frankfurt am Main, Germany
e Also at Key Laboratory for Particle Physics, Astrophysics and Cosmology, Ministry of Education; Shanghai Key Laboratory for Particle Physics and Cosmology; Institute of Nuclear and Particle Physics, Shanghai 200240, People’s Republic of China
f Also at Key Laboratory of Nuclear Physics and Ion-beam Application (MOE) and Institute of Modern Physics, Fudan University, Shanghai 200443, People’s Republic of China
g Also at Harvard University, Department of Physics, Cambridge, Massachusetts, 02138, USA
h Also at State Key Laboratory of Nuclear Physics and Technology, Peking University, Beijing 100871, People’s Republic of China
i Also at School of Physics and Electronics, Hunan University, Changsha 410082, China
j Also at Guangdong Provincial Key Laboratory of Nuclear Science, Institute of Quantum Matter, South China Normal University, Guangzhou 510006, China
k Also at Frontiers Science Center for Rare Isotopes, Lanzhou University, Lanzhou 730000, People’s Republic of China
l Also at Lanzhou Center for Theoretical Physics, Lanzhou University, Lanzhou 730000, People’s Republic of China
m Currently at Istinye University, 34010 Istanbul, Turkey
n Currently at Shandong Institute of Advanced Technology, Jinan 250100, People’s Republic of China
Abstract
The () processes are studied at center-of-mass energies ranging from 3.773 to 4.600 GeV, using a total integrated luminosity of 19.3 fb-1
annihilation data accumulated with the BESIII detector at BEPCII. We observe for the first time signals at 4.180 GeV with
statistical significances of 7.6 and 6.0, respectively.
The production cross section of at each center-of-mass energy is also measured.
We find that the line shape of the cross section can be described with conventional charmonium states
, , , . Compared with this, for the channel, one more additional
resonance is added to describe the cross section line shape. Its mass and width are measured to be
MeV/ and MeV, where the first uncertainties are statistical and
the second systematic. The significance of this resonance is estimated to be 5.8, and its parameters agree with the resonance previously reported in , and the in within uncertainties.
No significant signal for the process is observed, and the upper limits of Born cross sections
at 90% confidence level are reported.
pacs:
13.25.Gv, 14.40.Pq
I INTRODUCTION
In the past decades, many charmoniumlike states were observed experimentally, such as the , , and Olsen:2017bmm .
Among them, the vector -states should have quantum numbers , as they are produced in annihilation process. Considering the Aubert:2005rm ; He:2006kg ; Yuan:2007sj ; Yuan:2007sj ; Liu:2013dau ,
, and states Aubert:2006ge ; Wang:2007ea ; Lees:2012pv ; Wang:2014hta , together with the conventional charmonium states , , and , there are at least six vector states
between 4.0 and 4.7 GeV. However, the potential model only predicts five vector charmonium states in this mass region potential . In addition, unlike the known
conventional charmonium states that decay predominantly into open-charm final states [], the -states show strong coupling to
hidden-charm final states. These unusual behaviors indicate that the -states might be non-conventional quarkonium states. To better understand the nature of these states and also one gets better insights in the relevant degrees of freedom that play a role in these systems that are governed by the strong interaction, it is important to further investigate these states experimentally.
The radiative transition rates between charmonium states have been predicted theoretically from potential models Barnes:2005pb . The partial widths of electric dipole (E1) transitions between and states () are in the range 0 35 keV. Quoting the full width of , , and to be 80, 70, and 62 MeV pdg , respectively, and the expected branching fractions are at the level of - . By studying the radiative transitions between vector -states and (), we can compare the decay of -states with conventional charmonium states, and thus help to understand the nature of states Ma:2014ofa ; Chao:2013cca .
Experimentally, the () processes above 4 GeV have been studied before by BESIII Ablikim:2014hwn , CLEO CLEOchicj , and Belle experiments Bellechicj . Due to the limited statistics, no obvious signal has been observed between 4 - 5 GeV.
The BESIII has collected the world’s largest dataset from 4.0 to 4.6 GeV, and it is thus highly motivated to search for these decay modes.
In this paper, we report the study of the processes at center-of-mass (c.m.) energies between 4.008 - 4.6 GeV, using data samples corresponding to an integrated luminosity of 16.0 fb-1 accumulated with the BESIII detector at the BEPCII collider. To better estimate the contributions from and , the datasets with integrated luminosity of 3.3 fb-1 between of 3.773 and 4.008 GeV for channels are also analyzed. The datasets together with the corresponding c.m. energies are summarized in Table A in the Appendix. Compared with the previous BESIII measurement Ablikim:2014hwn , the new dataset covers an extended c.m. energies with about one order of magnitude higher luminosity, and also both events (only used in previous work) are studied.
The integrated luminosities are measured with Bhabha events () with an uncertainty of 1 Ablikim:2015nan . The c.m. energy of each dataset is measured using dimuon events (), with an uncertainty of 0.8 MeV Ablikim:2015zaa .
II BESIII DETECTOR AND MC SIMULATION
The BESIII detector Ablikim:2009aa records symmetric collisions
provided by the BEPCII storage ring Yu:IPAC2016-TUYA01 , with a designed peak luminosity of cm-2s-1 at c.m. energy of 3.77 GeV.
BESIII has collected large data samples between 2.0 and 4.6 GeV Ablikim:2019hff . The cylindrical core of the BESIII detector covers 93% of the full solid angle and consists of a helium-based multilayer drift chamber (MDC), a plastic scintillator time-of-flight
system (TOF), and a CsI(Tl) electromagnetic calorimeter (EMC), which are all enclosed in a superconducting solenoidal magnet providing a 1.0 T magnetic field. The solenoid is supported by an
octagonal flux-return yoke with resistive plate counter muon
identification modules interleaved with steel.
The charged-particle momentum resolution at is
, and the dd resolution is for electrons
from Bhabha scattering. The EMC measures photon energies with a
resolution of () at GeV in the barrel (end cap)
region Ablikim:2009aa . The time resolution in the TOF barrel region is 68 ps, while
that in the end cap region is 110 ps. The end cap TOF
system was upgraded in 2015 using multi-gap resistive plate chamber
technology, providing a time resolution of
60 ps etof .
Simulated Monte Carlo (MC) samples produced with geant4-based geant4 software, which includes the geometrical description of the BESIII detector and the detector response, are used to determine the detection efficiency, and to estimate physical background. The signal MC events are generated assuming a pure E1 transition. The simulation models the beam energy spread and initial-state-radiation (ISR) in annihilation using the generator kkmcref:kkmc . The maximum ISR photon energy is set to the energy corresponding to the production threshold. The final-state-radiation (FSR) from charged final state particles is modelled with photosphotos . Possible background contributions are investigated with the inclusive MC samples, which consist of open-charm processes, the ISR production of lower mass vector charmonium(-like) states, and the continuum processes. The known decay modes of charmed hadrons are modelled with evtgenref:evtgen , with known branching fractions taken from the Particle Data Group (PDG) pdg , and the remaining unknown decays with lundcharmref:lundcharm .
III
III.1 Event selection
The final state particles for are , where the are reconstructed with , and the is reconstructed with ( e or ). Events with two charged tracks with zero net charge and at least two photons are selected. Each charged track is required to originate from the interaction point, within 1 cm in the plane perpendicular to the beams and 10 cm along the beam direction. The of each charged track is required to be less than 0.93, where is the polar angle of each track. Photons are required to have a deposited energy larger than 25 MeV in the barrel EMC region () and larger than 50 MeV in the end cap region (). The EMC time for a photon is required to be within 700 ns of the event start time to suppress the electronic noise and energy deposition unrelated to the physical events. Each charged track should have a momentum larger than 1 GeV/. For leptons, we use the energy deposited in the EMC to separate electrons from muons. Charged tracks with the energy deposited in the EMC larger than 1 GeV are identified as electrons, and charged tracks with the energy deposited less than 0.4 GeV are identified as muons. For photons, the two most energetic photons are regarded as the candidates for signal events. Through the paper, we denote the photon with higher energy as , and the other as .
To improve the mass resolution and to suppress backgrounds, a four-constraint (4C) kinematic fit is performed under the hypothesis, which constrains the total four momentum of the final measured particles to the initial four-momentum of the colliding beams. The of the kinematic fit is required to be less than 40.
To suppress the radiative Bhabha events () in the mode, the cosine of the opening angle between the electron and the nearest photon ( is required to be less than 0.86. Since the photon from radiative Bhabha process is always close to the beam direction, the cosine of the polar angle of the selected photons are required to satisfy .
In both and modes, the background from with is rejected by requiring GeV/. Furthermore, the background is rejected by requiring GeV/ in the mode. MC simulations show that the background from with can be ignored for most of the energies expect for data at GeV. These background events are simulated and subtracted from the signal yield at GeV. A fit to the lepton pair invariant mass gives a resolution of 10.8 MeV/ and 10.5 MeV/ for and events, respectively. The mass window is defined as 3.08 GeV/. While the sidebands of the are defined by 3.00 GeV/ and 3.14 GeV/, which is three times as wide as the signal region.
III.2 Cross section
According to kinematic, we find that the photon from has lower energy than the one from for data with GeV. On the contrary, the former has higher energy than the latter for data with GeV. To obtain the number of signal events, we make use of both fitting and counting methods. For each data sample with 400 pb-1( is integrated luminosity), a fit with or events is performed to the invariant mass distribution of ( GeV) or ( GeV). For data at GeV, these two photons cannot be distinguished by energy. A 2-dimensional fit to the distribution of versus is used to extract the number of signal events. In these fits, the signal probability density functions (PDFs) are described with MC-simulated shapes, and the background PDFs are constrained to sideband events. For the low-statistics data samples with 200 pb-1 and GeV, we obtain the signal yield by counting the number of events in the signal region and by subtracting the number of normalized background events in the mass sideband region. The and signal regions are defined as 3.49 GeV/ and 3.54 GeV/, which include more than 94 of the signal events. The sidebands of are defined as 3.42 GeV/ and 3.6 GeV/.
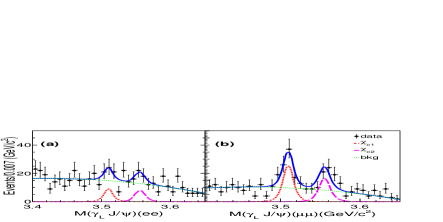
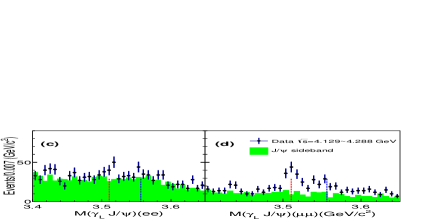
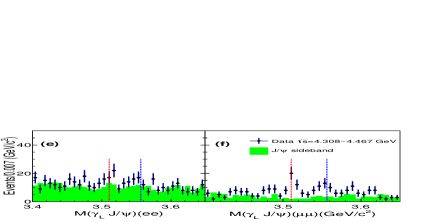
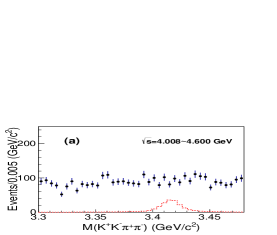
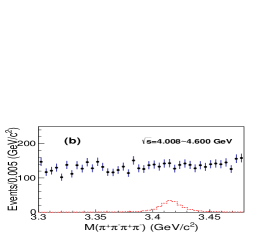
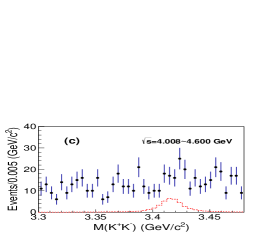
Taking GeV as an example, the invariant mass distribution of as well as the fit results for the surviving events are shown in Fig. 1. Clear signals are observed. The statistical significance of signals are calculated by comparing the log-likelihoods with and without the signal components in the fit, and taking the change of number of degrees of freedom into account. The statistical significances are estimated to be 7.6 for the signal and 6.0 for the signal. This is the first observation of the processes between 4 - 5 GeV. The invariant mass distributions of for both and at GeV (exclude 4.178 GeV) and GeV are also shown in Fig. 1.
Fig. 1: Fit to the distributions for (a) and (b) data at GeV. The distributions for (c,e) and (d,f) data at - GeV (exclude 4.178 GeV) (c,d) and - GeV (e,f). In a, b: Dots with error bars are data, the blue solid curves are the total fit results, the red dotted (pink dashed) curves are () signals, and the green dotted-dashed curves are backgrounds. In c, d, e, f: the shaded histograms are from normalized mass sideband events, the red and blue vertical dashed lines represent the world average mass values of and resonances, respectively.
The production cross section of at each c.m. energy is calculated as
(1)
where is the number of signal events, is the integrated luminosity, is the selection efficiency, and is the branching fraction of intermediate states in the sequential decay, is the ISR correction factor isr-cor .
The ISR correction factor is calculated with the kkmc program, with the measured -dependent cross section of the reactions as input.
This procedure is iterated several times until converges, i.e. the relative difference between the last two iterations is less than 1%.
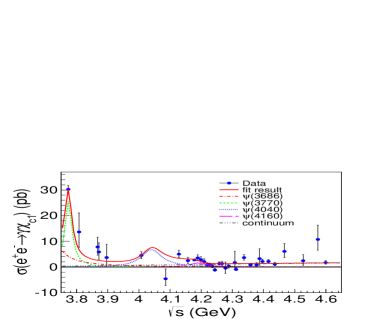
The final measured cross sections for are shown in Fig. 2 and are summarized
in Table A in the Appendix. Note that some of the cross sections are negative, thereby seem unphysical. This is caused by the fact that the number of events in the signal region is less than the estimated number of background events from sideband regions, and it can be explained by statistical fluctuations. To study the possible resonances in the process, a maximum likelihood fit is performed to the -dependent cross sections.
To describe the data, we use two coherent Breit-Wigner (BW) resonances, i.e. the and , together with a continuum term and the incoherent , tail
contributions. Since the contribution from and is small at GeV and also lack of data between 3.77 and 4.0 GeV, we do not consider the interference effect from and . The possible interference effect between continuum and other components is also investigated and we find its contribution is small (and taken as systematic effects).
The fit function is thus written as
(2)
where is the relative phase of the amplitude, and is the continuum amplitude
which is parametrized as
(3)
where and are the free parameters. function is described as
(4)
where M, and are the mass, full width and electric width of the resonance , respectively. is the branching fraction of , and is the phase space factor. For the E1 transition of the process , we consider an additional factor the Brambilla:2010cs and a damping factor Anashin:2010dh , according to
(5)
where the phase space factor is given by Brambilla:2010cs , and the damping factor as Anashin:2010dh . The parameters and are the energy of the E1 photon for the decay at c.m. energy and at the mass, respectively.
In the cross section fit, the likelihood function is defined as
(6)
where is the number of signal events measured from dataset ,
is the expected number of signal events for the corresponding dataset,
and represents a Gaussian distribution which describes datasets with high statistics
at and GeV.
is the number of events observed in the mass interval
from dataset , is the expected sum of signal and background events
in the same interval, and represents a Poisson distribution which describes
low statistics datasets at other c.m. energies.
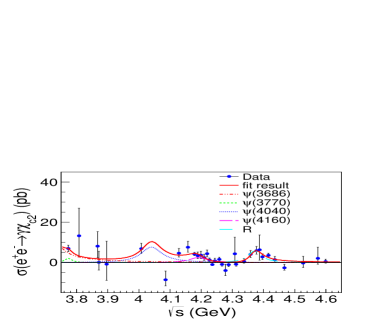
In the fit PDF, the masses and widths of , , , , and are fixed to PDG values pdg . The fit result is shown in Fig. 2, and also summarized in Table 1. The significance of , and the continuum term are estimated to be 3.7, 3.3 and 6.7, respectively. Considering the constructive and destructive interferences between and , there are two solutions with equal good quality from the fit, which has been proved mathematically Bai:2019jrb . A -test is used to estimate the fit quality. Due to the low statistics of data at some c.m. energies, we merge the datasets into 17 groups, and the -test gives , where is the number of degree of freedom.
Fig. 2: Cross section of process and a maximum likelihood fit to the line shape. Dots with error bars are data, the red curve shows
the fit results, and the dashed curves show the contribution of each component.
Table 1: Results of the fit to the cross sections. The unit of partial width is eV
and the unit of is eVpb.
The errors are statistical only.
Parameter
Solution I
Solution II
(6.80.4)
(6.
02.1)
(6.
12.1)
(1.
30.8)
(1.
40.9)
192.
196.
Fig. 3: Cross section of process and a maximum likelihood fit to the line shape. Dots with error bars are data, the red curve shows
the fit results, and the dashed curves show the contribution of each component.
For the process, the measured cross sections are shown in the Fig. 3 and summarized in Table B in the Appendix. In the fit PDF, the resonance parameters of , , ,
and are also fixed to PDG values. To describe the -dependent cross section, one more resonance is added in the fit function to describe the
structure around GeV. According to the fit, the contribution from continuum is not significant in this process (). Thus, we construct the fit function as
(7)
The fit results are shown in Fig. 3 and summarized in Table 2.
Same as before, there are four solutions with equal fit quality, due to the interferences between
, , and the new resonance Bai:2019jrb .
The significance of , and the resonance near 4.39 GeV
are estimated to be 2.0, 4.6 and 5.8, respectively.
Similarly, we merge the data into 17 groups when performing a -test.
The -test to the fit quality gives .
Table 2: Results of the fit to the cross sections. The unit of the partial width is eV. The errors are statistical only.
Parameter
Solution I
Solution II
Solution III
Solution IV
(0.60.4)
(13.
44.7)
(6.
93.5)
(13.
34.7)
(6.
93.5)
(6.
81.9)
(2.
10.9)
(6.
41.8)
(2.
10.9)
4371.7
51.1
(4.
71.6)
(3.
91.3)
(4.
41.5)
(4.
11.4)
241.
5
105.
238.
107.
248.
24.
252.
19.
IV
IV.1 Event selection
For the study, the resonance is reconstructed with , , and decay modes.
Considering the relatively small branching fractions from the decay and also the high background levels, only the data samples with pb-1 at GeV are used in this study. The selection criteria of charged tracks and photons are the same as for the analysis. The particle identification (PID) of kaons and pions is based on the dd and TOF information, and the particle type with the highest probability is assigned to each track. For photons, the most energetic photon is regarded as the candidate for signal events. A 4C kinematic fit is performed to these three decay modes and is required for both modes and for the mode.
For the decay mode, background events with a photon from resonances decay, such as , and are vetoed. For events with one of the photons from the decay undetected, we require MeV/ to suppress them. Here, MeV/ is the position of the peak obtained by fitting the distribution
in the data, which has a 25 MeV mass shift from the world average mass pdg .
The background events are vetoed by requiring MeV/ (hereafter, (particle) denotes the world average mass of a particle listed in the PDG pdg ). To further suppress backgrounds from decay, the combination of the radiative photon with an extra reconstructed photon should not come from a candidate. We require MeV/, where is the mass closest to from the radiative photon and an extra photon combination. Further background from process is also vetoed by requiring GeV/.
For the decay mode, the background events with , , and are suppressed by requiring MeV/, MeV/, MeV/ and MeV/, respectively. Similarly, the MeV/ is the average value obtained by fitting the spectrum for background events. Here, keeps all combinations of pion pairs. There are backgrounds from radiative Bhabha and radiative dimuon events (), with one of the radiative photon converted to an pair (-conversion) and misidentified as pions. The opening angle of the candidate is expected to be small (1) for such kind of background events, and we require for all candidate combinations to suppress them.
For the decay mode, there are Bhabha background events. We require the deposited energy in the EMC over the momentum of a charged track
to reject them. Same as before, MeV/ is required to suppress background with .
IV.2 Cross section
Figure 4 shows the ), ), and invariant mass distributions for the full datasets after imposing the
above selection criteria.
Fig. 4: Mass distributions of (a) , (b) and (c) for combined data samples from to 4.600 GeV. The red histograms represent the MC shape with an arbitrary normalization.
To obtain the number of signal events, an unbinned maximum likelihood fit is performed to the ), ) and distributions simultaneously at each c.m. energy. The signal yields for three decay modes are constrained according to corresponding reconstruction efficiencies and branching fractions.
In the fit, the signal PDFs are described with the shapes from simulated signal MC events. The background shapes are described with two 2nd-order polynomial functions
for the , decay modes, and a 1st-order polynomial function for the mode. The significance of signal is
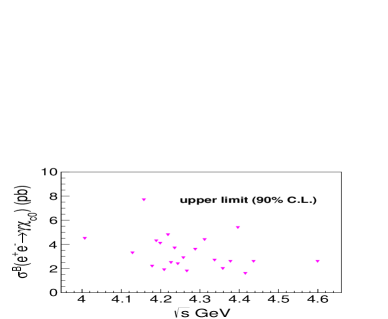
estimated to be less than 2 at each c.m. energy point. To estimate an upper limit (UL) of the production cross sections,
we scan the likelihood curve in the fit and set the 90% C.L. The corresponding UL of the cross section is calculated as
(8)
where is the UL of the number of signal events at 90% C.L., which is obtained by integrating the likelihood curve of the fit (the systematic uncertainty is considered
by convolving the likelihood curve with a Gaussian and its standard deviation is set to the systematic uncertainty). is the vacuum polarization factor taken from calculation VP-cite .
The UL of the cross sections at all c.m. energies are shown in Fig. 5 and summarized in Table C in the Appendix .
Fig. 5: The upper limits of Born cross section for process at - GeV.
V SYSTEMATIC UNCERTAINTY
The systematic uncertainty of the cross section measurements of () mainly comes from the luminosity measurement, detection efficiency, decay branching fractions, signal extraction, and radiative correction. The luminosity is measured using Bhabha events and the uncertainty is estimated to be 1 Ablikim:2015nan . For high momentum leptons, the uncertainty of the tracking efficiency is 1 per track Ablikim:2014hwn . The uncertainty in the photon reconstruction is 1 per photon, estimated by studying the decay Ablikim:2010zn . The PID efficiency uncertainty for each charged track is taken as 1 Ablikim:2017cbv . For the systematic uncertainty from the kinematic fit, we correct the track helix parameters in the MC simulation according to the method described in Ref. Ablikim:2012pg , and the efficiency difference before and after correction is considered as the systematic uncertainty.
The uncertainties for the branching fractions of , and from the PDG pdg are taken as systematic uncertainties for the cross section measurement. For the process, the systematic uncertainties for tracking, PID, photon detection and kinematic fit are the same, and the total systematic error is obtained by weighting each individual one according to the branching fractions and efficiencies of three decay modes, by considering the possible correlations between them.
For the systematic uncertainty from the background veto requirements, we select the control samples, and the selection requirements are exactly the same as the requirements described above. We take the efficiency difference between MC simulation and corresponding control samples as the systematic uncertainties. For the systematic uncertainty from the mass window, an control sample is studied and we take the efficiency difference between MC simulation and control samples as the uncertainties.
Table 3: Summary of systematic uncertainties sources on the cross section measurement in , the “” indicates that the uncertainty is not applicable.
Source
Luminosity
1.0
1.0
1.0
Tracking
3.7
2.0
2.0
Photon efficiency
1.0
2.0
2.0
PID
3.7
Kinematic fit
2.4
0.3
0.1
Branching fraction
7.5
3.5
3.6
Signal extraction
7.0
7.0
Background veto
1.2
1.7
1.2
Decay model
1.3
Radiative correction
1.2
4.5
3.9
Total
9.8
9.7
9.4
To obtain the systematic uncertainty from signal extraction, we refit the by replacing the background shape with 2nd-order polynomial function, varying the fit range (+0.05 GeV/), changing the signal shape from signal MC shape to signal MC shape convoluted with a float Gaussian function.
The difference with nominal fit results is taken as the systematic uncertainty. For the systematic uncertainties from the ISR correction factor in , two sources are considered. First, the difference of between the last two iterations is taken as systematic uncertainty, which is 1%. The other sources are the uncertainty of the fit parameters, fit components and damping factor. We sample the fit parameters with Gaussian functions (take the fit results as mean values and the errors as standard deviations) 200 times, then calculate the corresponding values. The standard deviation for of the 200 samplings is taken as a systematic error, which is 1.0% and 1.8% for and , respectively. Due to the low significance of / in the process and in the process, the input cross section line shapes in MC generation are tested by excluding these charmonium states. The differences for are 3.5 and 3.0 for and
, respectively. For the systematic uncertainty from the damping factor, we change the damping factor from Anashin:2010dh to Mitchell:2008aa (the value of is also quoted from Ref. Mitchell:2008aa ), the difference with two different damping factor are 0.9 and 1.3 for and , respectively. For the possible interference between continuum and other components in the process, the difference with or without considering interference is taken as systematic error, which is 2.3. For the , the difference between a flat line shape or a line shape is taken as uncertainty. For decay modes, the signal MC samples are generated by including all subprocesses. The difference with a pure phase space model is taken as the uncertainty due to the decay model. Table 3 summarizes all the systematic uncertainty sources and their contributions. The total systematic uncertainty is obtained by adding all sources in quadrature.
For the resonance parameters of the structure around 4.39 GeV, the uncertainty of c.m. energies ( MeV) are common for all data samples, and this uncertainty will propagate directly to the mass measurement. For the uncertainty from the damping factor, we change the damping factor from Anashin:2010dh to Mitchell:2008aa , and the differences are 0.9 MeV and 0.5 MeV for the mass and width, respectively. To estimate the uncertainties from the parameters of and , we randomly sample the four resonances parameters with Gaussian functions (PDG means and errors), and these values are used as input to refit the cross section. The standard deviations of these 1500 fit results are quoted as systematic errors, which are 1.0 MeV/ and 1.6 MeV for the mass and width, respectively. In the cross section fit, the contribution is added incoherently in the PDF. The possible systematic from the interference effect of is estimated by considering interference effect in the cross section fit. The differences are 0.8 MeV/ and 0.8 MeV for the mass and width. Assuming all the systematic errors are independent, the total systematic errors are 1.8 MeV/ and 1.9 MeV for mass and width, respectively, by adding all sources in quadrature.
VI SUMMARY
In summary, using 19.3 fb-1 data at c.m. energies between 3.773 and 4.600 GeV, we observe the processes for the first time at GeV. The statistical significances are 7.6 and 6.0 for , respectively. For the process, the cross section line shape can be described with , , and resonances. For the process, one more resonance is added to describe the line shape of the cross section. The
significance of this resonance is estimated to be , and its parameters are measured to be MeV/ and MeV, which are consistent with the / resonances pdg within errors. Our result supports the radiative transition.
In addition, the measured cross sections for are consistent with the potential model predictions Barnes:2005pb , except for , which is significantly lower than our measurement =(4.4 - 14.2.
For the process, no obvious signal is observed. The UL indicates the cross section is less than 8 pb between 4 and 4.6 GeV, and the UL is consistent with theoretical expectations.
VII ACKNOWLEDGEMENTS
The BESIII collaboration thanks the staff of BEPCII and the IHEP computing center for their strong support. This work is supported in part by National Key RD Program of China under Contracts No. 2020YFA0406300, No. 2020YFA0406400; National Natural Science Foundation of China (NSFC) under Contracts No. 11625523, No. 11635010, No. 11735014, No. 11822506, No. 11835012, No. 11935015, No. 11935016, No. 11935018, No. 11961141012, No. 12022510, No. 12025502, No. 12035009, No. 12035013, No. 12061131003, No. 11975141; the Chinese Academy of Sciences (CAS) Large-Scale Scientific Facility Program; Joint Large-Scale Scientific Facility Funds of the NSFC and CAS under Contracts No. U1732263, No. U1832207; CAS Key Research Program of Frontier Sciences under Contract No. QYZDJ-SSW-SLH040; 100 Talents Program of CAS; INPAC and Shanghai Key Laboratory for Particle Physics and Cosmology; ERC under Contract No. 758462; European Union Horizon 2020 research and innovation programme under Contract No. Marie Sklodowska-Curie grant agreement No 894790; German Research Foundation DFG under Contracts Nos. 443159800, Collaborative Research Center CRC 1044, FOR 2359, FOR 2359, GRK 214; Istituto Nazionale di Fisica Nucleare, Italy; Ministry of Development of Turkey under Contract No. DPT2006K-120470; National Science and Technology fund; Olle Engkvist Foundation under Contract No. 200-0605; STFC (United Kingdom); The Knut and Alice Wallenberg Foundation (Sweden) under Contract No. 2016.0157; The Royal Society, UK under Contracts No. DH140054, No. DH160214; The Swedish Research Council; U. S. Department of Energy under Contracts No. DE-FG02-05ER41374, No. DE-SC-0012069
References
(1)
S. L. Olsen, T. Skwarnicki and D. Zieminska,
Rev. Mod. Phys. 90, 015003 (2018).
(2)
B. Aubert et al. (BaBar Collaboration),
Phys. Rev. Lett. 95, 142001 (2005).
(3)
Q. He et al. (CLEO Collaboration),
Phys. Rev. D 74, 091104 (2006).
(4)
C. Z. Yuan et al. (Belle Collaboration),
Phys. Rev. Lett. 99, 182004 (2007).
(5)
Z. Q. Liu et al. (Belle Collaboration),
Phys. Rev. Lett. 110, 252002 (2013); 111, 019901(E) (2013).
(6)
B. Aubert et al. (BaBar Collaboration),
Phys. Rev. Lett. 98, 212001 (2007).
(7)
X. L. Wang et al. (Belle Collaboration),
Phys. Rev. Lett. 99, 142002 (2007).
(8)
J. P. Lees et al. (BaBar Collaboration),
Phys. Rev. D 89, 111103 (2014).
(9)
X. L. Wang et al. (Belle Collaboration),
Phys. Rev. D 91, 112007 (2015).
(10)
E. Eichten, K. Gottfried, T. Kinoshita, K. D. Lane, and T. M. Yan, Phys. Rev. D 17, 3090 (1978); 21, 313 (1980); S. Godfrey and N. Isgur, Phys. Rev. D 32, 189 (1985).
(11)
T. Barnes, S. Godfrey and E. S. Swanson,
Phys. Rev. D 72, 054026 (2005).
(12)
P. A. Zyla et al. (Particle Data Group), Prog. Theor. Exp. Phys. 2020, 083C01 (2020).
(13)
L. Ma, Z. F. Sun, X. H. Liu, W. Z. Deng, X. Liu and S. L. Zhu,
Phys. Rev. D 90, 034020 (2014).
(14)
K. T. Chao, Z. G. He, D. Li, and C. Meng,
arXiv:1310.8597.
(15) M. Ablikim et al. (BESIII Collaboration), Chin. Phys. C 39, 041001 (2015).
(16) T. E. Coan et al. (CLEO Collaboration), Phys. Rev. Lett. 96, 162003 (2006).
(17) Y. L. Han et al. (Belle Collaboration), Phys. Rev. D 92, 012011 (2015).
(18)
M. Ablikim et al. (BESIII Collaboration),
Chin. Phys. C 39, 093001 (2015); 37, 123001 (2013).
(19)
M. Ablikim et al. (BESIII Collaboration),
Chin. Phys. C 40, 063001 (2016).
(20)
M. Ablikim et al. (BESIII Collaboration),
Nucl. Instrum. Methods Phys. Res.,Sect. A 614, 345 (2010).
(21)
C. H. Yu et al.,
in Proceedings of IPAC2016, Busan, Korea, 2016(JACoW, Geneva, 2016).
(22)
M. Ablikim et al. (BESIII Collaboration),
Chin. Phys. C 44, 040001 (2020).
(23)
X. Li et al., Radiat. Detect. Technol. Methods 1, 13 (2017);
Y. X. Guo et al., Radiat. Detect. Technol. Methods 1, 15 (2017);
P. Cao et al., Nucl. Instrum. Methods Phys. Res. Sect A 953, 163053 (2020).
(24)
S. Agostinelli et al. (GEANT4 Collaboration),
Nucl. Instrum. Methods Phys. Res.,Sect. A 506, 250 (2003).
(25)
S. Jadach, B. F. L. Ward and Z. Was,
Phys. Rev. D 63, 113009 (2001);
Comput. Phys. Commun. 130, 260 (2000).
(26)
E. Richter-Was,
Phys. Lett. B 303, 163 (1993).
(27)
D. J. Lange,
Nucl. Instrum. Methods Phys. Res.,Sect. A 462, 152 (2001);
R. G. Ping,
Chin. Phys. C 32, 599 (2008).
(28)
J. C. Chen, G. S. Huang, X. R. Qi, D. H. Zhang and Y. S. Zhu,
Phys. Rev. D 62, 034003 (2000);
R. L. Yang, R. G. Ping and H. Chen,
Chin. Phys. Lett. 31, 061301 (2014).
(29)
E. A. Kuraev and V. S. Fadin, Sov. J. Nucl. Phys. 41, 466 (1985).
(30)
N. Brambilla et al.,
Eur. Phys. J. C 71, 1534 (2011).
(31)
V. V. Anashin et al.,
Int. J. Mod. Phys. Conf. Ser. 02, 188 (2011).
(32)
A. D. Bukin, arXiv:0710.5627;
K. Zhu, X. H. Mo, C. Z. Yuan, and P. Wang, Int. J. Mod.
Phys. A 26, 4511 (2011);
Y. Bai and D. Y. Chen,
Phys. Rev. D 99, 072007 (2019).
(33)
S. Actis et al., Eur. Phys. J. C 66, 585 (2010).
(34)
M. Ablikim et al. (BESIII Collaboration),
Phys. Rev. D 81, 052005 (2010).
(35)
M. Ablikim et al. (BESIII Collaboration),
Phys. Rev. D 97, 032008 (2018).
(36)
M. Ablikim et al. (BESIII Collaboration),
Phys. Rev. D 87, 012002 (2013).
(37)
R. E. Mitchell et al. (CLEO Collaboration),
Phys. Rev. Lett. 102, 011801 (2009); 106, 159903(E) (2011).
Appendix A Appendix
Table A: Summary of the c.m. energy, luminosities, the number of signals, detection efficiencies( and mode), radiative correction factors, measured cross section(). The first errors are statistical and the second systematic. The “” indicates that when we measure cross section, we merge and two modes, and only combined cross section is obtained.
(pb-1)
(pb)
(pb)
(pb)
3.7730
2932
281.
450.
0.210
0.369
0.689
32.
29.
30.
3.8077
50.5
0.252
0.983
-
-
13.
3.8675
109
0.207
1.114
-
-
7.
3.8715
110
0.207
1.113
-
-
5.
3.8962
52.6
0.208
1.105
-
-
3.
4.0076
482
8.
12.
0.194
0.358
0.849
5.
4.
4.
4.0855
52.9
0.269
0.948
-
-
-4.
4.1285
394
5.
14.
0.175
0.321
1.027
4.
5.
5.
4.1574
407
4.
6.
0.171
0.318
1.021
2.
2.
2.
4.1783
3189
23.
65.
0.173
0.322
1.031
2.
3.
2.
4.1888
566
-0.
18.
0.164
0.309
1.075
-0.
4.
3.
4.1989
526
2.
13.
0.159
0.297
1.146
1.
3.
2.
4.2092
517
3.
7.
0.147
0.282
1.220
2.
2.
2.
4.2187
515
1.
3.
0.146
0.276
1.269
0.
0.
0.
4.2263
1101
3.
7.
0.144
0.265
1.290
0.
1.
1.
4.2357
530
0.
1.
0.142
0.264
1.296
0.
0.
0.
4.2438
538
3.
-5.
0.142
0.264
1.289
1.
-1.
-1.
4.2580
828
13.
5.
0.143
0.263
1.265
4.
1.
1.
4.2668
531
1.
5.
0.147
0.262
1.250
0.
1.
1.
4.2778
176
0.203
1.230
-
-
-0.
4.2879
492
-1.
2.
0.148
0.268
1.225
-0.
0.
0.
4.3079
45.1
0.212
1.189
-
-
1.
4.3121
492
0.
-3.
0.152
0.276
1.189
0.
-1.
-1.
4.3374
501
7.
12.
0.156
0.286
1.162
3.
3.
3.
4.3583
544
-1.
4.
0.163
0.293
1.142
-0.
1.
0.
4.3774
523
9.
1.
0.160
0.297
1.129
4.
0.
0.
4.3874
55.6
0.225
1.124
-
-
3.
4.3965
505
3.
8.
0.159
0.299
1.117
1.
2.
2.
4.4156
1091
9.
16.
0.165
0.304
1.107
2.
2.
2.
4.4362
568
3.
3.
0.168
0.304
1.092
1.
1.
1.
4.4671
111
0.235
1.084
-
-
6.
4.5271
112
0.239
1.066
-
-
2.
4.5745
48.9
0.244
1.053
-
-
10.
4.5995
587
3.
7.
0.172
0.324
1.047
1.
1.
1.
Table B: Summary of the c.m. energy, luminosities, detection efficiencies( and mode), radiative correction factors, measured cross section(). The first errors are statistical and the second systematic.
(pb-1)
(pb)
(pb)
(pb)
3.7730
2932
26.
60.
0.191
0.334
0.746
5.
7.
7.
3.8077
50.5
0.233
0.877
-
-
13.
3.8675
109
0.220
0.946
-
-
8.
3.8715
110
0.222
0.945
-
-
0.
3.8962
52.6
0.228
0.942
-
-
-0.
4.0076
482
12.
8.
0.201
0.364
0.767
14.
5.
6.
4.0855
52.9
0.253
0.936
-
-
-8.
4.1285
394
2.
6.
0.166
0.313
1.011
3.
4.
4.
4.1574
407
5.
11.
0.175
0.318
0.953
6.
7.
7.
4.1783
3189
24.
46.
0.174
0.329
0.918
4.
4.
4.
4.1888
566
2.
7.
0.176
0.327
0.942
2.
3.
3.
4.1989
526
9.
4.
0.170
0.318
1.012
8.
2.
3.
4.2092
517
5.
4.
0.155
0.294
1.134
4.
2.
2.
4.2187
515
6.
8.
0.142
0.270
1.290
6.
4.
4.
4.2263
1101
3.
5.
0.130
0.245
1.480
1.
1.
1.
4.2357
530
-1.
-2.
0.114
0.213
1.722
-1.
-1.
-1.
4.2438
538
5.
0.
0.096
0.183
1.999
4.
0.
0.
4.2580
828
3.
5.
0.076
0.141
2.610
1.
1.
1.
4.2668
531
6.
-3.
0.062
0.121
3.075
6.
-1.
-0.
4.2778
176
0.074
3.602
-
-
-4.
4.2879
492
-3.
-0.
0.048
0.089
3.842
-3.
-0.
-1.
4.3079
45.1
0.086
2.708
-
-
4.
4.3121
492
-0.
-1.
0.069
0.125
2.407
-1.
-0.
-0.
4.3374
501
4.
0.
0.138
0.260
1.111
4.
0.
0.
4.3583
544
0.
9.
0.190
0.354
0.818
0.
5.
4.
4.3774
523
5.
10.
0.199
0.372
0.802
5.
5.
5.
4.3874
55.6
0.276
0.859
-
-
6.
4.3965
505
5.
4.
0.192
0.358
0.919
5.
2.
2.
4.4156
1091
9.
14.
0.171
0.324
1.066
4.
3.
3.
4.4362
568
-5.
6.
0.153
0.288
1.192
-4.
3.
1.
4.4671
111
0.184
1.376
-
-
-2.
4.5271
112
0.150
1.629
-
-
-0.
4.5745
48.9
0.136
1.785
-
-
2.
4.5995
587
-1.
1.
0.093
0.173
1.857
-1.
0.
0.
Table C: Summary of the c.m. energy, luminosities, detection efficiencies, radiative correction factor, vacuum polarization factor, and the UL of born cross section ( C.L.) of .