A Catalog of Host Galaxies for WISE-Selected AGN: Connecting Host Properties with Nuclear Activity and Identifying Contaminants
Abstract
We present a catalog of physical properties for galaxies hosting active galactic nuclei (AGN) detected by the Wide-field Infrared Survey Explorer (WISE). By fitting broadband spectral energy distributions of sources in the WISE AGN Catalog (Assef et al., 2018) with empirical galaxy and AGN templates, we derive photometric redshifts, AGN bolometric luminosities, measures of AGN obscuration, host galaxy stellar masses, and host galaxy star formation rates (s) for 695,273 WISE AGN. The wide-area nature of this catalog significantly augments the known number of obscured AGN out to redshifts of z 3 and will be useful for studies focused on AGN or their host galaxy physical properties. We first show that the most likely non-AGN contaminants are galaxies at redshifts of z 0.2 0.3, with relatively blue W1W2 colors, and with high specific s for which the dust continuum emission is elevated in the W2 filter. Toward increasingly lower redshifts, WISE AGN host galaxies have systematically lower specific s, relative to those of normal star forming galaxies, likely due to decreased cold gas fractions and the time delay between global star formation and AGN triggering. Finally, WISE AGN obscuration is not strongly correlated with AGN bolometric luminosity but shows a significant negative correlation with Eddington ratio. This result is consistent with a version of the ‘receding torus’ model in which the obscuring material is located within the supermassive black hole gravitational sphere of influence and the dust inner radius increases due to radiation pressure.
1 Introduction
Correlations between supermassive black holes (SMBHs) and observable properties of their host galaxies (e.g. Gebhardt et al., 2000; Ferrarese & Merritt, 2000; Marconi & Hunt, 2003; Bentz et al., 2009; Gültekin et al., 2009) suggest that evolution of the two may be driven by common mechanisms (e.g. Hernquist, 1989; Di Matteo et al., 2005; Springel et al., 2005; Hopkins et al., 2008). However, the number density of AGN, particularly at low luminosities, is dominated by those with significantly attenuated emission (e.g. Merloni et al., 2014; Buchner et al., 2015; Ricci et al., 2017a), and therefore a significant fraction of SMBH growth may occur in obscured phases (see Hickox & Alexander 2018 for a recent review). The obscuration can be from dust grains absorbing or scattering photons at infra-red (IR) to ultra-violet (UV) wavelengths (Draine, 2003a) or by photoelectric absorption and Compton scattering of X-ray photons (see Comastri, 2004, and references therein). While much of the obscuring material may reach compact scales of 1 pc (e.g. Suganuma et al., 2006; López-Gonzaga et al., 2016) and is often pictured in a torus structure (e.g. Antonucci, 1993; Urry & Padovani, 1995; Netzer, 2015), gas and dust throughout the entire galaxy can also contribute to the line-of-sight obscuration. Obscured AGN may therefore preferentially reside in galaxies with large gas fractions that also contribute to star formation and evolution of the host galaxy stellar populations.
Indeed, the population of nearby ultra-luminous IR galaxies (ULIRGs) are known to have high star formation rates (s), dust content, and often buried AGN (e.g. Sanders et al., 1988), and obscured AGN fractions are positively correlated with far-IR (FIR) luminosities that indicate star formation (e.g. Kim et al., 1998; Page et al., 2004; Chen et al., 2015). Moreover, enhanced star formation is observed in luminous AGN (e.g. Hutchings & Neff, 1992; Bahcall et al., 1997; Canalizo & Stockton, 2001), and numerous studies find that AGN bolometric luminosities correlate with host galaxy s (e.g. Boyle & Terlevich, 1998; Mullaney et al., 2012; Harris et al., 2016; Lanzuisi et al., 2017; Stemo et al., 2020). However, global star formation and SMBH accretion occur on vastly different physical scales that may introduce temporal delays between the peak of star formation and the most efficient phases of SMBH growth (e.g. Schawinski et al., 2009; Wild et al., 2010; Hopkins, 2012; Barrows et al., 2017).
Larger masses of obscuring gas and dust may also contribute to the reservoir of material for SMBH accretion, leading to a positive connection between AGN obscuration and luminosity that is observed in powerful and dust-reddened AGN (e.g. Assef et al., 2015; Tsai et al., 2015; Glikman et al., 2015). On the other hand, radiation from the AGN can also reduce the level of obscuration through sublimation of dust grains or through radiation pressure (e.g. Lawrence, 1991; Simpson, 2005; Treister et al., 2008; Assef et al., 2013; Toba et al., 2014; Ricci et al., 2017b), resulting in the observability of luminous and unobscured AGN as predicted in evolutionary models (e.g. Hopkins et al., 2005; Younger et al., 2008; Somerville et al., 2008).
To study how properties of the obscuring medium are linked with AGN and their host galaxies, observing large populations of obscured AGN is necessary. X-ray photons are often used for surveying obscured AGN (e.g. Civano et al., 2016; Marchesi et al., 2016) since they are less attenuated than optical and UV photons, and they directly trace SMBH accretion disk emission that has been inverse Compton-scattered. Since X-rays can still be scattered and absorbed by large columns of gas, deep X-ray observations are necessary to detect heavily buried AGN. However, a significant fraction of accretion disk emission absorbed by dust is re-emitted at IR wavelengths. This IR emission is therefore correlated with the AGN intrinsic luminosity, as demonstrated by IR bolometric corrections (e.g. Elvis et al., 1994; Richards et al., 2006; Hopkins et al., 2007; Runnoe et al., 2012) and the strong connection between IR and X-ray emission (e.g. Lutz et al., 2004; Fiore et al., 2009; Lanzuisi et al., 2009; Gandhi et al., 2009; Mateos et al., 2015; Stern, 2015), while being relatively insensitive to further attenuation. Since IR emission is produced by all AGN, it is a powerful tool for finding large numbers of accreting SMBHs, regardless of obscuration.
Several AGN selection diagnostics (calibrated using ‘truth’ samples of AGN based on X-ray and optical emission line properties) have been developed using mid-IR (MIR) colors from the Infrared Array Camera (IRAC) on the Spitzer Space Telescope (Fazio et al., 2004; Lacy et al., 2004; Stern et al., 2005; Lacy et al., 2007; Donley et al., 2012). These diagnostics fundamentally rely on colors to distinguish between the red power-law spectral slopes of AGN and the blackbody spectrum produced by the host galaxy at rest-frame wavelengths of 1.6 6 µm. More recently, the Wide-field Infrared Survey Explorer (WISE; Wright et al., 2010) has surveyed the entire sky in four bands - W1 (µm), W2 (µm), W3 (µm), and W4 (µm) - and has enabled development of several MIR AGN selection diagnostics that can be applied to millions of sources (Jarrett et al., 2011; Stern et al., 2012; Mateos et al., 2012; Assef et al., 2013; Secrest et al., 2015). Among the WISE bands, this selection is most efficiently accomplished with the W1W2 color that characterizes the MIR slope for galaxies below 1.
Since these MIR diagnostics are based on spectral slopes, they can potentially be mimicked by inactive early-type galaxies at 1 2 for which the rising stellar continuum flux at 1.6 µm falls within the W1 and W2 bands. Moreover, galaxies with significant quantities of dust heated through star formation and to high temperatures can potentially achieve the color requirements of MIR AGN selections (see Padovani et al., 2017 for a summary). However, the significant advantages over AGN selection at other wavelengths (comparable sensitivity to both obscured and unobscured AGN) and uniform sensitivity across the entire sky make WISE ideal for studying the conditions of AGN fueling.
The WISE AGN Catalog (Assef et al., 2018), built using a W1W2 cut with a W2 magnitude dependence, presents the largest catalog of IR-selected AGN and provides an all-sky catalog of millions of obscured and unobscured AGN candidates. The next step is to determine redshifts and measure physical properties of the AGN and their host galaxies in a uniform and systematic manner. These properties will enable studies of how SMBH growth is connected with host galaxy evolution and how this connection evolves with redshift. Furthermore, to examine these connections under both obscured and unobscured conditions, estimates of obscuration based on multi-wavelength observations are necessary since those based on MIR photometry alone are uncertain (e.g. Hickox et al., 2007; Netzer, 2015). These properties are also necessary to identify populations of potential contaminants, and the redshifts at which they enter the sample, for interpretation of future results. Therefore, in this paper we describe the WISE AGN Galaxy Catalog: a catalog of physical properties associated with WISE AGN and their host galaxies derived from broadband spectral energy distributions (SEDs). We intend for this catalog to be a useful resource for large population studies of WISE AGN and their host galaxies, and for identification of potential contaminants.
This paper is structured as follows: in Section 2 we describe the steps taken to create the catalog, in Section 3 we identify the populations of likely contaminants, in Section 4 we use the catalog to examine the correlation between star formation and stellar mass for WISE AGN host galaxies, in Section 5 we examine the connection between SMBH growth and AGN obscuration, and in Section 6 we present our conclusions. Throughout we assume a flat cosmology defined by the nine-year Wilkinson Microwave Anisotropy Probe observations (Hinshaw et al., 2013): 69.32 and 0.2865.
| Survey | Filt. | FWHM | Det. Lim. | ||
|---|---|---|---|---|---|
| () | () | (µm) | (µm) | (Mag) | () |
| 1 | 2 | 3 | 4 | 5 | 6 |
| GALEX | FUV | 0.1516 | 0.02 | 24.2aaSince the GALEX coverage has non-uniform depth, the GALEX detection limits correspond to the deepest coverage for our sample. | 174,186 |
| NUV | 0.2267 | 0.08 | 24.5aaSince the GALEX coverage has non-uniform depth, the GALEX detection limits correspond to the deepest coverage for our sample. | 583,906 | |
| SDSS | u | 0.3543 | 0.06 | 23.5 | 382,619 |
| g | 0.4770 | 0.13 | 23.8 | 423,840 | |
| r | 0.6231 | 0.11 | 23.2 | 434,980 | |
| i | 0.7625 | 0.12 | 22.6 | 437,347 | |
| z | 0.9134 | 0.11 | 21.7 | 420,820 | |
| Gaia | Gbp | 0.532 | 0.31 | 21.8 | 570,205 |
| Grp | 0.797 | 0.25 | 20.8 | 568,582 | |
| Pan-STARRS | g | 0.4810 | 0.12 | 24.7 | 622,365 |
| r | 0.6170 | 0.14 | 24.3 | 675,044 | |
| i | 0.7520 | 0.13 | 23.4 | 686,233 | |
| z | 0.8660 | 0.10 | 23.1 | 685,341 | |
| y | 0.9620 | 0.06 | 22.8 | 644,666 | |
| 2MASS | J | 1.2 | 0.2 | 18.6 | 299,882 |
| H | 1.7 | 0.2 | 18.6 | 299,506 | |
| KS | 2.2 | 0.3 | 18.5 | 296,301 | |
| WISE | W1 | 3.4 | 0.8 | 21.5 | 695,273 |
| W2 | 4.6 | 1.1 | 19.9 | 695,273 | |
| W3 | 12 | 9 | 18.9 | 694,791 | |
| W4 | 22 | 5 | 16.9 | 694,989 |
Note. — Column 1: survey name; column 2: filters from the surveys in column 1; column 3: filter effective wavelengths; column 4: filter full-width at half-maximums (FWHMs); column 5: survey/filter AB magnitude detection limits; column : number of sources detected by the survey/filter.
2 Creating the Catalog
In this section we describe our procedure for building the WISE AGN Galaxy Catalog. The parent sample is derived from the WISE AGN Catalog (Assef et al., 2018) in which AGN candidate host galaxies were defined as those with a significant fraction of the total SED luminosity from the intrinsic (unobscured) AGN () relative to that of the host galaxy (). This fraction (which correlates with the probability that including an AGN component in the SED model yields a statistically significant improvement; Chung et al., 2014) is defined as with the threshold set at 0.5. We use the version of the WISE AGN Catalog that is optimized for reliable AGN selection at the level (R90) and consists of 4,543,529 robust WISE AGN candidates. The criterion used to select AGN in the R90 version is a W1W2 lower threshold that is a function of W2. We refer the reader to Assef et al. (2018) for further details on the WISE AGN candidate selection function and additional filters applied to develop the final WISE AGN Catalog.
The specific steps we take are as follows: identifying the subset of the R90 WISE AGN Catalog with uniform multi-wavelength coverage (Section 2.1), matching with multi-wavelength detections (Section 2.2), modeling the SEDs to measure photometric redshifts and to separate the galaxy and AGN contributions (Section 2.3), applying a quality filter to generate the final sample (Section 2.4), quantifying the photometric redshift accuracy (Section 2.5), using the best-fit SED models to compute intrinsic physical properties of the AGN (Section 2.6) and of the host galaxies (Section 2.7), and estimating the impact of scattered AGN light (Section 2.8). In Section 2.9 we describe the data structure of the final catalog.
2.1 Photometric Datasets
We use photometric coverage from five additional major astronomical surveys: the Galaxy Evolution Explorer (GALEX), the Sloan Digital Sky Survey Data Release 14 (SDSS DR14), Gaia DR2, the Panoramic Survey Telescope and Rapid Response System DR2 (Pan-STARRS2), and the Two Micron All Sky Survey (2MASS) Point Source Catalog. These photometric databases are chosen for two primary reasons: 1) they each have wide-area sky coverage; and 2) when combined with the WISE photometry, the full filter set covers 0.1522 µm (most of the rest-frame 0.0330 range covered by our SED models). We require that each R90 WISE AGN candidate have coverage at UV (GALEX), optical (Gaia and SDSS or Pan-STARRS), NIR (2MASS), and MIR (WISE) wavelengths. If coverage is available from a survey but no detection exists, we incorporate flux upper limits into the SED modeling based on the detection limits. The surveys/filters used in our analysis, their effective wavelengths, filter full-width at half-maximums (FWHMs), and detection limits are listed in Table 1.
2.2 Matching and Filtering the Photometry
We assign photometric detections from the surveys described in Section 2.1 to unique WISE AGN candidates based on a fixed angular separation upper limit as in Assef et al. (2013, 2018). Based on photometric redshift accuracy estimates (Section 2.5) for 10% of the parent sample, we find that angular separation upper limits larger than 05 correspond to a significant decrease in photometric redshift quality, indicating that the incidence of spurious matches may increase for larger thresholds. Angular separation upper limits lower than 05 do not result in significantly improved or reduced photometric redshift quality, though the number of matched sources is significantly reduced. Therefore, to optimize both the number of sources with sufficient data points for SED modeling and their photometric redshift accuracy, we adopt a fixed angular separation upper limit of 05.
The absolute astrometric accuracy of the SDSS (; Pier et al., 2003) and 2MASS (; Skrutskie et al., 2006) are both tied to the Tycho reference frame (Høg et al., 2000), while that of WISE (; Wright et al., 2010) is tied to 2MASS. The absolute astrometry of GALEX (; Morrissey et al., 2007) is tied to the U.S. Naval Observatory Catalog (Zacharias et al., 2000), though it is shown to be consistent with the SDSS to within . The absolute astrometry of Pan-STARRS (; Chambers et al., 2016; Magnier et al., 2020) is tied to that of Gaia DR1 which itself is tied to the Tycho catalog. Finally, the absolute astrometry of Gaia DR2 (1 mas; Lindegren et al., 2018), is independent of these catalogs. Since the absolute astrometric accuracies of these surveys are smaller than their typical positional uncertainties, further registration of the datasets is not necessary.
If more than one source from any survey is within the 05 matching threshold, the WISE AGN candidate is not passed to the SED fitting process on the justification that multiple sources are blended and that a reliable SED model can not be generated. To mitigate the effects of variability, if detections in multiple epochs are available from a given survey, then photometry from the observations taken closest in time to the corresponding ALLWISE111https://wise2.ipac.caltech.edu/docs/release/allwise/ observation is used. Furthermore, since the g, r, i, and z filters from Pan-STARRS and SDSS overlap, of those filters we only use detections from the one taken closest in time to the ALLWISE observation. An SED is passed to the modeling step (Section 2.3) if it contains photometric data points. We choose this threshold because it corresponds to the minimum number of data points necessary to generate a statistically meaningful model.
2.3 Photometric Redshifts and SED Models
To compute photometric redshifts () and model the SEDs of WISE AGN candidates that pass the photometry requirements outlined in Sections 2.1 and 2.2, we use the galaxy and AGN Low-Resolution Templates222http://www.astronomy.ohio-state.edu/ rjassef/lrt/ (LRT) from Assef et al. (2010). The LRT libraries consist of empirical galaxy templates (elliptical, Sbc spiral, and irregular) plus a Type 1 AGN template to which variable extinction is applied (accounting for nuclear obscuration), and we use them for our SED modeling because they were used to select reliable AGN for the WISE AGN Catalog.
The templates were modeled after the SEDs of galaxies in the AGN and Galaxy Evolution Survey (AGES; Kochanek et al., 2012), and we refer the reader to Assef et al. 2010 for more details on their construction. Here we summarize the basic properties: the galaxy templates were adopted from Coleman et al. (1980) and supplemented with synthesized stellar templates at UV and IR wavelengths (from Bruzual & Charlot, 2003) plus MIR SEDs from Devriendt et al. (1999) that include dust and polycyclic aromatic hydrocarbon (PAH) emission. The AGN template is a combination of power laws plus broad emission lines, modeled on the composite Type 1 quasi-stellar object (QSO) template from Richards et al. (2006).
The SED modeling procedure we use computes optimal linear combinations of the templates by fitting to the observed photometry and varying six parameters to minimize the statistic: the redshift, normalizations for each of the four templates, and the color excess () that controls the wavelength-dependent extinction law applied to the Type 1 AGN component. The extinction law was constructed by Assef et al. (2010) from the Cardelli et al. (1989) optical-IR function ( 3,300 Å) and the Gordon & Clayton (1998) UV function ( 3,300 Å) and assumes a Milky Way extinction curved defined by (Schultz & Wiemer, 1975). We apply a standard mean intergalactic medium (IGM) absorption to each galaxy. All photometric fluxes have been corrected for Galactic extinction using the dust maps of Schlegel et al. (1998) and Schlafly & Finkbeiner (2011).
To improve the accuracy, during the fitting we apply a luminosity prior to the galaxy components in the form of a redshift probability function (Assef et al., 2008): where is the comoving volume per unit redshift, and is the Las Campanas Redshift Survey band luminosity function from Lin et al. (1996), defined by a Schechter function (Schechter, 1976) with a characteristic magnitude of and a slope of (Assef et al., 2010; Chung et al., 2014; Carroll et al., 2021). We allow the models to explore redshifts in the range 0 7 with a grid of step-size (significantly smaller than the estimated photometric redshift uncertainties; Section 2.5). In no cases do the solutions converge on the upper bounds ( 7).
The wide range of possible dust temperatures, contributions from host galaxy star formation, and silicate emission introduce spectral diversity into AGN SEDs at wavelengths longer than 20 µm (e.g. Mason et al., 2012; Dale et al., 2014; Lyu & Rieke, 2018) that is difficult for the LRT to model. Therefore, as in Assef et al. (2010, 2013) we remove W4 photometry when solving for (removal of the W4 filter is accounted for in the requirement of 6 photometric data points outlined in Section 2.2).
To identify the subset with spectroscopic redshifts (), we crossmatch with the SDSS DR16 spectroscopic database333The SDSS DR16 is chosen since it has the largest catalog of uniformly-measured spectroscopic redshifts that overlap with the WISE AGN Catalog. using the same 05 matching radius as in Section 2.2 and select sources with primary spectroscopic classifications of either Galaxy or QSO (obtained from template fits; Bolton et al., 2012). If a value is available, it is adopted as the final redshift (). Otherwise, the value is used.
2.4 Final Sample of SED models
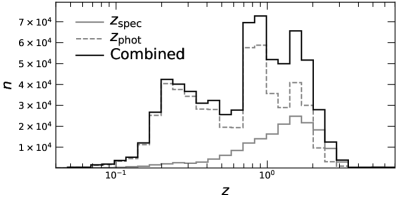
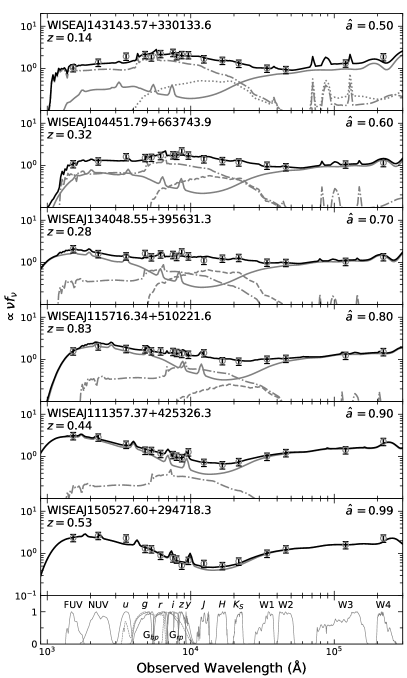
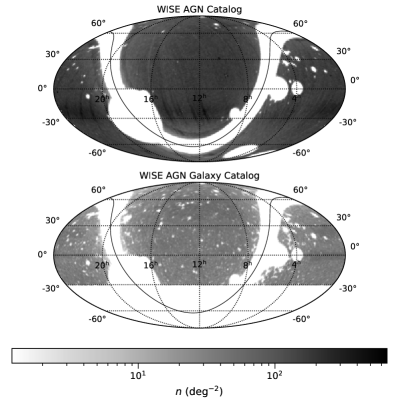
To obtain the final SED models that separate the galaxy and AGN contributions, we re-fit each SED fixing the redshift at the final value () and varying the remaining parameters (including the IGM absorption). To remove outlying poor SED fits, we require the reduced () to be (Carroll et al., 2021). Furthermore, we remove the 10 with the largest combined galaxy and AGN component luminosity errors to filter out unreliable decompositions. Imposing these restrictions yields a final sample of 695,273 WISE AGN candidates with SED models. The median value is 1.52, with a standard deviation of 1.50. The subset with spectroscopic redshifts (173,993 sources) has a median value of , and the subset with only photometric redshifts (521,280 sources) has a median value of (Figure 1). The spectroscopic subset is dominated by the QSO class (%) which is likely responsible for the higher redshifts (though note that a fraction of the values are under-estimated; see Section 2.5). A local peak is observed around 0.25 (also observed in Assef et al., 2013, 2018) that may be due, in part, to contaminants (see Section 3). SEDs with values in the range 0.5 1 are displayed in Figure 2 and show that the WISE filter fluxes are dominated by the AGN. Figure 3 shows the surface density sky maps for the parent sample (the WISE AGN Catalog) and for our catalog which is limited to declinations of -30∘ due to the survey coverage requirements (Section 2.1). The numbers of sources detected in each survey/filter combination are listed in Table 1.
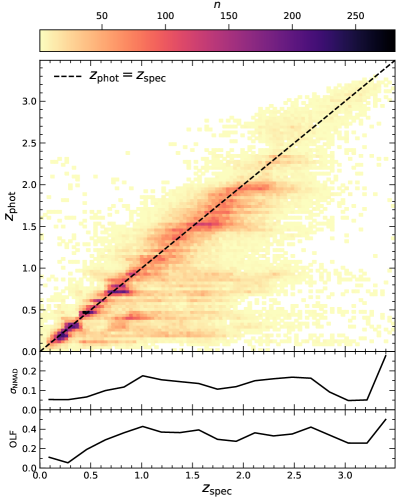
2.5 Photometric Redshift Accuracy
We use the subset with values (Section 2.3) to quantify the photometric redshift accuracy (Figure 4). When parameterized with the normalized median absolute deviation (NMAD; Hoaglin et al., 1983) metric of where , we find . We also find that the outlier fraction (OLF; defined as the fraction with 0.15) is OLF. Since our catalog is limited to photometry from broad filters, the accuracy is worse than for AGN in the Cosmic Evolution Survey (COSMOS; Scoville et al., 2007) field for which medium filters are available (e.g. ; Salvato et al., 2009). However, the accuracy is comparable to that obtained from other common template sets that are fit to IR-selected AGN host galaxies and limited to broadband photometry (e.g. 0.095 0.29 and OLF 0.31 0.51; Duncan et al., 2018; Brown et al., 2019). The systematically under-estimated values of the outliers are caused by the prior that restricts galaxy masses from being unphysically large (Assef et al., 2010, 2013).
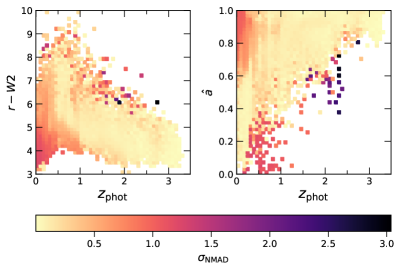
Photometric redshifts of galaxies with observed SEDs dominated by AGN (i.e. hosts of unobscured AGN) are typically less accurate than those of SEDs with detectable features of the galaxy stellar continua (e.g. Brodwin et al., 2006; Rowan-Robinson et al., 2008; Salvato et al., 2009). Therefore, in Figure 5 (left) we show how varies as a function of and color (; useful as a non-parametric proxy for AGN obscuration). In Figure 5 (right) we also show how varies as a function of and since the AGN fraction is shown to be strongly correlated with accuracy from the LRT and is relatively stable against inaccurate estimates (Assef et al., 2010, 2013). While the poorest accuracy does indeed occur among systems with blue colors and large values, this effect is mainly seen at low values due to the systematic effects of the prior. Above 1 the photometric redshift accuracy is relatively stable, regardless of the or values. In Sections 2.6 and 2.7 we discuss the effects of these systematic offsets on the derived physical properties.
2.6 AGN Bolometric Luminosities and Obscuration
AGN bolometric luminosities () are computed from the un-extinguished, normalized best-fit AGN templates integrated between the full rest-frame wavelength range of the LRT libraries (0.0330 ). AGN extinctions are parameterized by the color excess term (). The distributions of and for our catalog are shown in Figure 6. The uncertainties introduce a systematic negative offset in the values (median offset of %) that is primarily driven by the population with under-estimated photometric redshifts at 1 (see Figures 4 and 5). On the other hand, the values of are relatively stable against uncertainties (median offset of %).
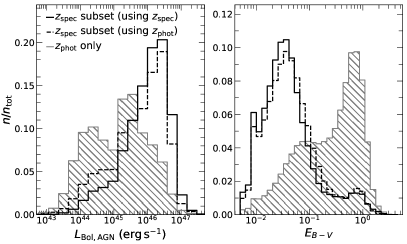
After correcting for systematic offsets due to uncertainties, the subset with only photometric redshifts has smaller values (median of ) and larger values (median of ) compared to the spectroscopic subset (median values of and ). These differences reflect that the subset with values is dominated by the QSO class and hence toward more luminous and unobscured AGN. The photometric redshift sample therefore significantly augments the number of luminous and obscured AGN.
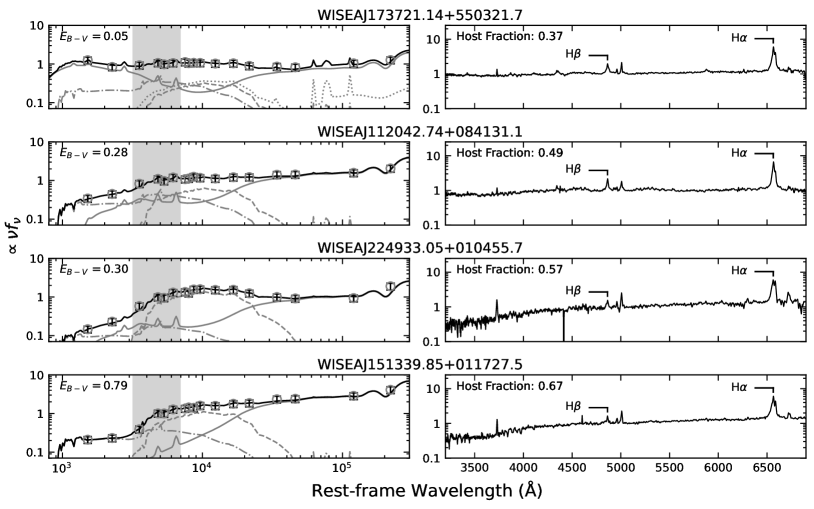
While sources in the spectroscopic QSO class have broad emission lines by definition, of them have obscuration levels larger than the typically assumed value of (or 0.2, using the gas-to-dust conversion of Maiolino et al., 2001) that broadly separates Type 1 and Type 2 AGN (e.g. Ueda et al., 2003; Burtscher et al., 2016; Schnorr-Müller et al., 2016). However, large intrinsic ratios of AGN to host galaxy luminosity can result in spectroscopic detections of broad emission lines despite large nuclear obscuration (see Hickox & Alexander, 2018, and references therein). The obscuration will be manifested in spectra as stronger galaxy stellar continuum features at rest-frame optical and UV wavelengths. Indeed, as demonstrated in Figure 7, the subset of QSOs with large nuclear obscuration as measured from our SED models (), have larger host galaxy fractions (by an average of ) as measured from the optical SDSS spectra (Rakshit et al., 2020).
Figure 7 also shows that broad emission lines are only weakly present (or not present at all) in our summed SED models, and this difference likely reflects the limitations of our AGN template. The SED models may incorrectly fit the UV flux with a star-forming component that artificially lowers the AGN contribution by adding nuclear extinction. However, this effect is countered by the inherent prior in our SED modeling against highly reddened AGN models that improve the fit at MIR wavelengths without contributing to the flux at shorter wavelengths (see Assef et al. 2010 for more details on this prior). Therefore, the true AGN components of these systems may instead have stronger optical broad emission lines than assumed in our models.
2.7 Host Galaxy Physical Properties
In this section we discuss the host galaxy stellar masses () and star formation rates (s) for our catalog of WISE AGN candidate host galaxies. In Section 2.7.1 we describe our procedure for estimating and , and in Section 2.7.2 we compare our estimates with those from independent methods.
2.7.1 Stellar Mass and Star Formation Rate Estimates
We first subtract the AGN contribution (determined from the LRT models; Section 2.4) from each photometric detection and compute physical models for the host galaxies using the Code Investigating GALaxy Emission (CIGALE; Noll et al., 2009; Boquien et al., 2019) with a delayed star formation history, a Salpeter initial mass function (Salpeter, 1955), and the stellar population libraries of Bruzual & Charlot (2003). To use the results from these models we require that is measured at 3 significance (565,098 WISE AGN candidates) since galaxy properties can not otherwise be reliably determined.
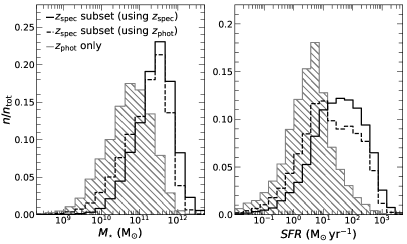
The values of and are shown in Figure 8. As with the estimates (Section 2.6), the uncertainties introduce a systematic negative offset in the and estimates (median offsets of % and %, respectively). After correcting for these systematic offsets, the subset with only photometric redshifts has smaller values (median of ) and smaller values (median of ) compared to the spectroscopic subset (median values of and ). This is likely due to the high fraction of QSOs among the spectroscopic subset and hence a bias toward more massive and luminous host galaxies.
2.7.2 Comparison with Independent Estimates
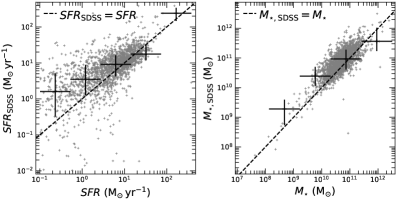
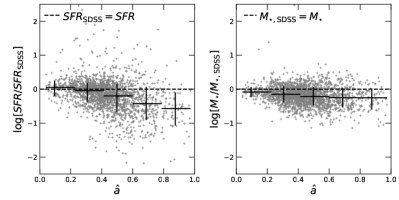
We compare our and estimates with those from the SDSS DR14 spectroscopic galaxy sample that are based on fitting galaxy models (Conroy et al., 2009) to SDSS photometry (Montero-Dorta et al., 2016). The top panels of Figure 9 show that our estimates are systematically offset toward lower values (median offsets of log[/] and log[/]). The offsets are negligible for small AGN fractions (small values) but increase in magnitude toward larger values (bottom panels of Figure 9). These negative trends suggest that the systematic offsets are due to our subtraction of an AGN component that is not accounted for in the SDSS galaxy models. The significantly larger scatter (and the larger offsets) among the low s are likely due to these estimates being sensitive to both UV and IR flux that can each have substantial AGN contributions and introduce uncertainties when the star formation signatures are weak.
Since inaccurate AGN subtractions may compromise estimates of host galaxy properties, we have computed independent estimates based on FIR (rest-frame 81000) luminosities where AGN contribute significantly less than the host galaxy (e.g. Schartmann et al., 2008; Richards et al., 2006; Shang et al., 2011; Kirkpatrick et al., 2012; Shi et al., 2013). We first identify the subset of our sample (we use the spectroscopic subset to avoid biases due to uncertainties) with photometry from the Photodetector Array Camera and Spectrometer (PACS) on Herschel (bands centered at 70, 100, and 160 µm). We then estimate by normalizing dust templates (Dale & Helou, 2002) to the the Herschel/PACS luminosities (minimizing the statistic to the available detections). The AGN contribution to is estimated from the starburst plus AGN composite spectra from Dale et al. (2014) and the 520 AGN fractions from our SED models.
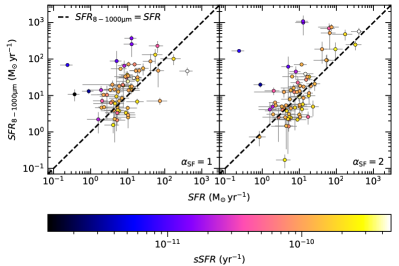
Figure 10 shows the s obtained using the dust templates defined by 1 and 2, where parameterizes the distribution of radiation fields contributing to the heated dust mass (typical values for galaxies are 1 2.5, and only strongly star-forming galaxies have values of 1; e.g. Dale et al., 2001; Dale & Helou, 2002). The star formation rate estimates from the FIR dust templates () are correlated with those from our SED modeling, though with a systematic offset toward larger values. The offsets are negligible for systems with higher specific s (s) and become more significant among those with lower s. This result is consistent with the sensitivity of FIR luminosity to dust heated by stars over long timescales that leads to over-estimates for systems with large stellar mass fractions from evolved stars and hence low s (e.g. Kennicutt & Evans, 2012).
2.8 Scattered AGN Light
The AGN template used in our SED models does not directly account for AGN light that has been scattered into the line-of-sight by interactions with electrons and dust (e.g. Antonucci & Miller, 1985; Kishimoto, 1999). Since the scattered AGN continuum flux rises toward and peaks at UV wavelengths (e.g. Kishimoto et al., 2001; Draine, 2003b) that trace star formation, the galaxy luminosities returned by our SED models may, in some cases, lead to over-estimated s. Scattered light is most significant for powerful obscured AGN (e.g. Zakamska et al., 2006), and indeed some WISE AGN in the population of hot, dust-obscured galaxies (Hot DOGs) show evidence for excess blue colors due to scattering of AGN light off of dust (Assef et al., 2020).
Assuming a scattering efficiency at 2800 Å (the monochromatic luminosity at this wavelength is strongly correlated with ; e.g. Madau et al., 1998) of 0.01 (e.g. Zakamska et al., 2005), we find that the median value of the scattered-to-stellar flux ratio (defined as the fraction of scattered light relative to the total stellar light for a galaxy) is and generally larger among more luminous AGN. The values extend up to , and therefore UV-based s may be over-estimated by up to a factor of several among the most luminous AGN. For reference, we provide the 2800 Å monochromatic AGN luminosities in the catalog.
| Column Number | Data Type | Note |
|---|---|---|
| 1 | ID | Catalog specific unique identifier |
| 2 | Name | WISE source name |
| 3 | RA | WISE source right ascension (degrees) |
| 4 | DEC | WISE source declination (degrees) |
| 5 | z_spec | Spectroscopic redshift (-999 if not available) |
| 6 | z_phot | Photometric redshift |
| 7 | z_best | Best redshift |
| 8 | z_type | Best redshift type [spec or phot] |
| 9 | L_bol_agn_best | AGN component bolometric luminosity, best [] |
| 10 | L_bol_agn_16 | AGN component bolometric luminosity, 16th percentile [] |
| 11 | L_bol_agn_84 | AGN component bolometric luminosity, 84th percentile [] |
| 12 | EBV_best | AGN color excess, best [mag] |
| 13 | EBV_16 | AGN color excess, 16th percentile [mag] |
| 14 | EBV_84 | AGN color excess, 84th percentile [mag] |
| 15 | SFR_best | Host galaxy star formation rate, best [] |
| 16 | SFR_16 | Host galaxy star formation rate, 16th percentile [] |
| 17 | SFR_84 | Host galaxy star formation rate, 84th percentile [] |
| 18 | M_star_best | Host galaxy stellar mass, best [] |
| 19 | M_star_16 | Host galaxy stellar mass, 16th percentile [] |
| 20 | M_star_84 | Host galaxy stellar mass, 84th percentile [] |
| 21 | L_2800_best | 2800 monochromatic AGN luminosity, best [] |
| 22 | L_2800_16 | 2800 monochromatic AGN luminosity, 16th percentile [] |
| 23 | L_2800_84 | 2800 monochromatic AGN luminosity, 84th percentile [] |
| 24 | L_E_best | Elliptical component bolometric luminosity, best [] |
| 25 | L_E_16 | Elliptical component bolometric luminosity, 16th percentile [] |
| 26 | L_E_84 | Elliptical component bolometric luminosity, 84th percentile [] |
| 27 | L_Sbc_best | Spiral component bolometric luminosity, best [] |
| 28 | L_Sbc_16 | Spiral component bolometric luminosity, 16th percentile [] |
| 29 | L_Sbc_84 | Spiral component bolometric luminosity, 84th percentile [] |
| 30 | L_Im_best | Irregular component bolometric luminosity, best [] |
| 31 | L_Im_16 | Irregular component bolometric luminosity, 16th percentile [] |
| 32 | L_Im_84 | Irregular component bolometric luminosity, 84th percentile [] |
| 33-49 | f_i_mod | Model fluxes, [Jy] |
| 50-66 | k_i_mod | Photometric k-corrections, |
| 67-83 | f_i_obs | Observed fluxes (-999 if no detection), [Jy] |
| 84-100 | f_e_i_obs | Observed flux errors (-999 if no detection), [Jy] |
Note. — Columns are basic source descriptors, columns are described in Section 2.3, columns are described in Section 2.6, columns are described in Section 2.7, columns are described in Section 2.8, columns are additional output values related to the SED fitting process, and columns are the input photometric fluxes and their errors.
2.9 Catalog Contents and Structure
The primary data products in the WISE AGN Galaxy Catalog we present here are photometric redshifts (and spectroscopic redshifts, if available), AGN physical properties (bolometric luminosities and nuclear obscuration), and host galaxy physical properties (stellar masses and s). The catalog also includes bolometric luminosities of the individual galaxy components (elliptical, Sbc, and irregular) and the 2800 Å monochromatic AGN luminosities. The distance properties are computed assuming the cosmology stated in Section 1 and the best available redshifts. For completeness, the catalog includes observed and model photometric fluxes for each filter from the full photometric data set plus the model corrections. Table 2 lists the full suite of data included in the catalog. Uncertainties on all derived parameters are estimated by re-fitting each SED 1,000 times with random Gaussian noise (standard deviations equal to the photometry 1 uncertainties) added. Uncertainties in the host galaxy model fluxes are propagated into the stellar mass and uncertainties.
3 Contamination from Purely Star-Forming Galaxies
In this section we identify and discuss the nature of contaminants in our catalog. We use the SDSS spectroscopic subset to identify sources from our catalog with AGN signatures based on either 1) a QSO classification or 2) a Galaxy classification plus optical emission line ratios consistent with Seyfert galaxies based on all three diagnostics in Kewley et al. (2006). In Section 3.1 we quantify the contamination fraction, in Section 3.2 we identify the regions of redshift and WISE color-space where the contaminants are found, and in Section 3.3 we discuss their physical nature.
3.1 The Contamination Fraction
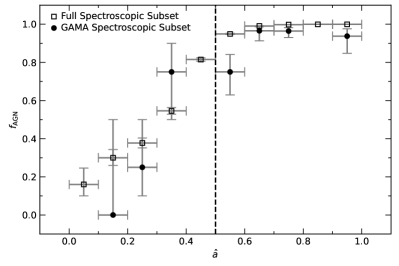
The fraction of sources with spectroscopic AGN signatures is % and is positively correlated with (Figure 11). Those with 0.5 have an average AGN fraction of %. Since the spectroscopic subset is subject to SDSS selection effects, in Figure 11 we also show the subset within the Galaxy and Mass Assembly (GAMA) survey that is complete to a magnitude limit of (Baldry et al., 2010). The AGN fraction in the GAMA subset is % and has a positive dependence on that is consistent with the full spectroscopic sample when accounting for the binomial uncertainties. The GAMA subset with 0.5 has an average AGN fraction of %.
We remark that these spectroscopic AGN identifications are biased toward unobscured AGN and therefore likely provide an underestimate of the AGN fraction. While narrow emission line diagnostics may in some cases yield inaccurate AGN classifications (e.g. Wylezalek et al., 2018), this effect will be negligible since the vast majority of spectroscopic AGN signatures in our catalog are based on the QSO classification.
3.2 The WISE Colors and Redshifts of Contaminants
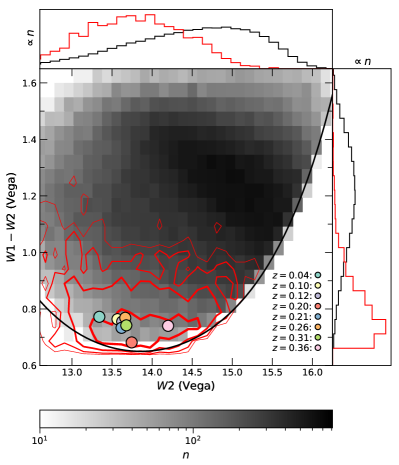
The locations of spectroscopic AGN and contaminants in the color-magnitude space of the WISE AGN Catalog are shown in Figure 12. Contaminants are biased toward bluer W1W2 colors (median of W1W2) relative to AGN (median of W1W2), likely due to MIR spectral slopes being steeper among AGN than among purely star-forming galaxies (e.g. Donley et al., 2012; Chang et al., 2017). The fainter magnitudes among the AGN (median of W2) compared to contaminants (median of W2) may be due, at least in part, to the bias of SDSS QSOs toward higher redshifts (e.g. Figure 1).
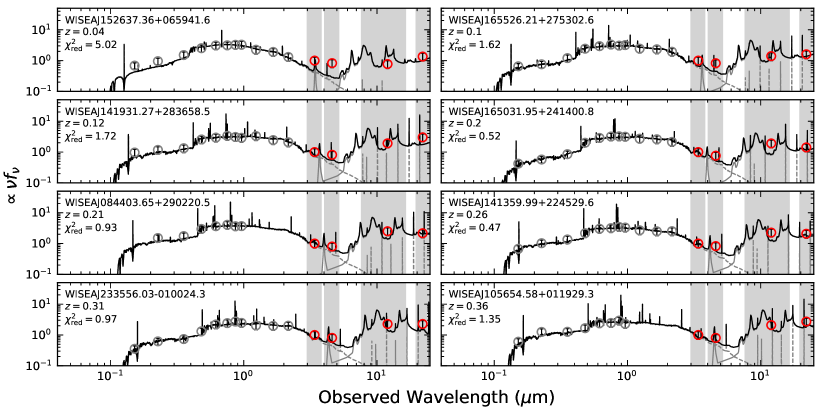
To understand how purely star-forming galaxies can pass the WISE AGN selection criteria as a function of redshift, we have fit the SED of each contaminant with a pure galaxy model using CIGALE and the same configuration described in Section 2.7.1. To identify the contaminants that are best-fit within the constraints of our models, in each of eight evenly-spaced redshift bins over the range 00.4 (corresponding to the redshift range of spectroscopic contaminants in our sample) we select the fit with the lowest value. Their locations within the WISE AGN color-magnitude space are marked in Figure 12 and indicate that they are representative of the overall contaminant population. Their SEDs and best-fit models (Figure 13) show how the W1W2 colors are affected by a combination of (attenuated) stellar continuum and dust that includes several strong PAH emission lines that migrate through the WISE filter set with increasing redshift. The best fits are achieved at redshifts of 0.2 0.3 when the W3 filter aligns with a local dip in the redshifted dust continuum and allows for larger dust contribution to the W2 filter.
The redshift distributions of the AGN and contaminants are shown in the top panel of Figure 14. The redshifts of contaminants have a median value of that is consistent with the redshifts corresponding to the best pure galaxy SED models (Figure 13), suggesting that the majority of contamination in the WISE AGN Catalog is due to dust heated by star formation in galaxies at 0.2 0.3 and with relatively blue W1W2 colors. While high-redshift () galaxies are another potential source of contamination (Section 1) they are unlikely due to the W2 magnitude dependence.
3.3 The Nature of the Contaminants
Purely star-forming galaxies are theorized to pass WISE color qualifications of AGN selection due to large ionization parameters from the stellar radiation field and significant reservoirs of heated dust (Hainline et al., 2016; Satyapal et al., 2018), and these conditions are most likely to exist in galaxies with large s. In the middle panel of Figure 14 we plot s of the AGN and contaminants as a function of redshift. In each redshift bin occupied by contaminants, the s of contaminants are consistent with those of AGN within their respective uncertainties. However, the s of contaminants are systematically elevated, relative to those of AGN, and suggest that enhanced s (per unit stellar mass) contribute to the red W1W2 colors observed in galaxies without spectroscopic AGN signatures.
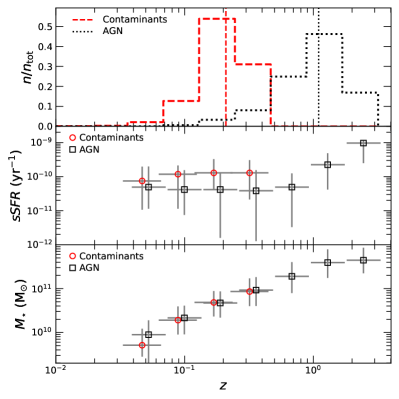
Contamination from low-mass galaxies ( ) without AGN may also be significant (Hainline et al., 2016; Satyapal et al., 2018; Lupi et al., 2020) since they are frequently star-forming and are known to have low metallicities that result in large effective stellar temperatures and harder radiation fields for heating dust (e.g. Griffith et al., 2011; Rémy-Ruyer et al., 2015; O’Connor et al., 2016). However, while lower metallicities result in hotter dust, they also correspond to lower overall dust abundances that make achieving the red W1W2 colors difficult (Satyapal et al., 2018). Indeed, the bottom panel of Figure 14 shows no evidence for systematically lower stellar masses among the contaminants.
4 Co-evolution of WISE AGN and Their Host Galaxies
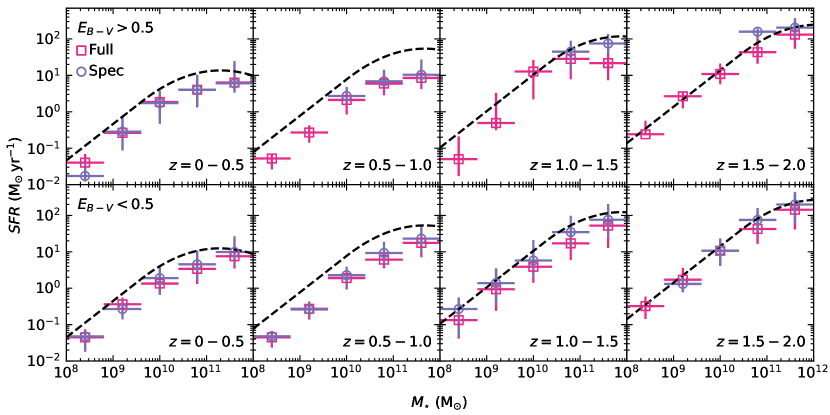
To investigate the evolutionary histories of WISE AGN host galaxies, we use our catalog to examine the relationship between and separately for obscured AGN (; galaxy-dominated SED continua) and unobscured AGN (; AGN-dominated SED continua) in Figure 15. To avoid contribution from potential contaminants (Section 3), we omit galaxies with 0.5. To test the impact of photometric redshift uncertainties, we also show the subset with spectroscopic redshifts. Since the normalization of the function relating and increases with redshift for star forming galaxies (e.g. Daddi et al., 2007; Rodighiero et al., 2010; Karim et al., 2011; Whitaker et al., 2012; Schreiber et al., 2015; Spilker et al., 2018), we plot these values in four evenly-spaced redshift bins over the range (where the sample is well-represented).
Our sample of AGN host galaxies is relatively shallow compared to those built from deeper surveys such as COSMOS (e.g. Suh et al., 2017, 2019) and therefore biased toward more massive galaxies at each epoch. Regardless, similar to previous studies of AGN hosts (e.g. Boyle & Terlevich, 1998; Chapman et al., 2005; Santini et al., 2012; Azadi et al., 2015), we observe a trend of increasing and values with redshift that reflects the increasing cold gas fractions (e.g. Boselli et al., 2001).
The largest s are observed in massive galaxies at high redshifts and have values similar to those seen for powerful X-ray AGN (e.g. Rodighiero et al., 2010; Rosario et al., 2012; Bernhard et al., 2016). These are likely gas-rich galaxies hosting luminous AGN and that may have experienced mergers similar to those observed for ULIRGs (e.g. Sanders et al., 1988). Indeed, the systems with the highest s also have relatively elevated values of suggesting they may be dust-rich systems.
Toward lower redshifts, the s show increasing systematic negative offsets from the prediction for star-forming galaxies, reaching offsets of % and % for the obscured and unobscured samples, respectively. As seen in Figure 15, these offsets are qualitatively the same (accounting for the uncertainties) when limited to the sample with spectroscopic redshifts. These results may suggest that, once the gas has reached the SMBH and triggered an AGN, most of the available cold gas has been used to form stars so that the galaxies move toward a passively evolving sequence at low redshifts (e.g. Peng et al., 2010; Renzini & Peng, 2015; Spilker et al., 2018; McPartland et al., 2019). Such quiescent galaxies are known to be the dominant hosts of QSOs at lower redshifts based on imaging (e.g. Taylor et al., 1996; McLure et al., 1999) and spectroscopy (e.g. Nolan et al., 2001). Moreover, this trend may be similar to that seen for hard X-ray selected AGN at (e.g. Shimizu et al., 2015), for optically-selected AGN (e.g. Leslie et al., 2016), and possibly for the hosts of many well-studied low-redshift Seyfert galaxies with relatively red colors (e.g. Kotilainen & Ward, 1994).
These results are overall consistent with evolutionary models in which the bulk of star formation occurs before the peak in SMBH accretion and associated onset of a QSO phase (see Hickox et al., 2009, and references therein). Interestingly, this result also suggests that, while WISE AGN color selection is less sensitive to obscuration than optical or even X-ray selection, the requirement that the intrinsic AGN component represent a significant fraction of the source emission (i.e. 0.5) introduces a bias toward luminous and powerful AGN that are triggered after the global cold gas supply for star formation has been depleted. This hypothesis suggests a delay between star formation and AGN triggering that is observed in galaxies with low gas fractions (e.g. Kaviraj et al., 2015a, b; Shabala et al., 2017). Alternatively, if significant star formation is still occurring when the AGN is triggered, then negative AGN feedback may also contribute to lower s in nearby galaxies (e.g. Schawinski et al., 2007).
5 The Connection Between Nuclear Obscuration and SMBH Growth
While large reservoirs of circum-nuclear dust and gas provide material for accretion onto SMBHs, negative feedback can remove obscuring material (as is assumed in AGN evolutionary models; e.g. Hopkins et al., 2009; Hickox et al., 2009). Several studies have presented a dynamic picture in which the obscured AGN fraction increases with AGN luminosity among low luminosity AGN (e.g. Beckmann et al., 2009; Burlon et al., 2011; Kawamuro et al., 2016) but then declines toward more luminous AGN (the ‘receding torus’ model; e.g. Lawrence, 1991; Mulchaey et al., 1992; Granato & Danese, 1994; Ueda et al., 2003; Simpson, 2005; Lusso et al., 2013; Assef et al., 2013; Merloni et al., 2014).
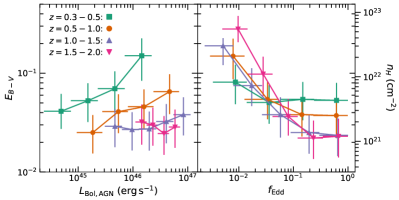
Since AGN obscuration traces the amount of dust near the central SMBH, we use the SED-based measurements of in our catalog to investigate its direct physical connection with both AGN bolometric luminosity and Eddington ratio. The Eddington ratio is defined as , and Eddington luminosities are computed as , where is the gravitational constant, is the mass per unit electron, and is the Thomson scattering cross-section (Krolik, 1999). We only do this analysis for the spectroscopic QSO subset with SMBH mass () estimates (Rakshit et al., 2020) based on the 5100 Å monochromatic luminosity, the H broad emission line FWHM, and the mass-scaling relation from Assef et al. (2011). Since the AGN template used in our modeling is relatively blue (corresponding to the composite QSO template from Richards et al. 2006 with 0.05; Assef et al., 2010), for this analysis we subtract from our obscuration measurements.
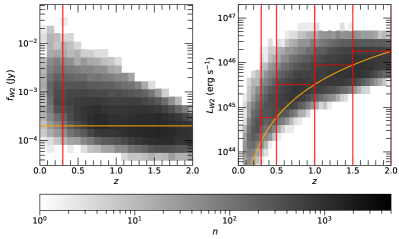
To account for the strong dependence of AGN luminosity on redshift, we construct discrete redshift bins with samples that are sensitive down to a common limiting luminosity. We start by choosing a uniform limiting W2 flux of Jy that approximately aligns with the faintest galaxies at (left panel of Figure 16). In each redshift bin samples are defined by assigning a lower luminosity limit such that the limiting flux of Jy can detect all sources in that bin (right panel of Figure 16). These bins are constructed out to (where the sample is well-represented).
is plotted against and in Figure 17. When parameterized by a powerlaw function, the slopes are offset from zero at significances of , , , and for the redshift bins in ascending order. The decreasing strength of the positive correlation between and toward higher redshifts (and generally higher ) is consistent with radiation from luminous AGN sublimating dust grains or exerting outward radiation pressure on them. Since we have limited the analysis to QSOs with detectable broad emission lines, the obscuration levels for our sample are generally lower than the threshold used for selecting obscured AGN in the X-ray samples ( ; Beckmann et al., 2009; Burlon et al., 2011; Kawamuro et al., 2016).
On the other hand, negative correlations between and are observed (in the same redshift bins the powerlaw slopes are offset from zero at significances of , , , and ). These negative correlations (strongest for the higher redshift bins with generally higher values of ) are consistent with the implication drawn from the X-ray AGN sample of Ricci et al. (2017b) that the obscuring medium of AGN is within the SMBH gravitational sphere of influence and most efficiently removed from less massive SMBHs accreting close to the Eddington limit. Furthermore, the Eddington ratios in our sample are above the dust effective Eddington limit (; Fabian et al., 2009) and consistent with the obscuring material being removed by radiation pressure.
6 Conclusions
We present a catalog of redshifts and physical properties for the AGN (bolometric luminosities and extinctions) and host galaxies (stellar masses and s) for 695,273 WISE-selected AGN candidates from Assef et al. (2018). If spectroscopic redshifts from the SDSS are available, they are used (173,993 sources). Otherwise, we use photometric redshifts derived from our SED models (521,280 sources). The physical properties are measured from the SED models that separate the AGN component from the host galaxy emission and compute intrinsic bolometric luminosities and dust extinctions. From the isolated host galaxy component we compute stellar masses and s by accounting for stellar emission plus dust absorption and re-emission.
In this paper we detail how the sample is developed and describe the AGN and host galaxy physical properties. We then use the sample to identify purely star-forming galaxy contaminants admitted by the WISE AGN selection criteria. Finally, we use the sample to examine the connections between host galaxy properties, SMBH growth, and nuclear obscuration. Our conclusions are as follows:
-
•
Using the subset with spectroscopic redshifts, we find the photometric redshift accuracy to be , with an outlier fraction of OLF. The outliers have systematically under-estimated photometric redshifts due to the prior and are primarily associated with sources having blue colors and large AGN fractions at photometric redshifts of .
-
•
While the subset of WISE AGN with spectroscopic redshifts is dominated by relatively unobscured QSOs (median ), the subset with only photometric redshifts in our catalog have generally larger AGN obscuration (median ). This photometric redshift subset has a median AGN bolometric luminosity of and therefore contains many previously unidentified luminous and obscured AGN. A fraction () of spectroscopic QSOs have obscuration values above the threshold broadly separating Type 1 and Type 2 AGN ( ) and may represent examples of obscured yet intrinsically luminous AGN with strong broad emission lines.
-
•
Based on spectroscopic AGN signatures (broad emission lines or narrow emission line diagnostics), % of the WISE-selected AGN candidates are true AGN. This probability is a strong function of the AGN fractions measured from our SED models, with AGN fractions 0.5 corresponding to an average probability of for hosting an AGN.
-
•
Contaminants have relatively blue W1W2 colors (median value of W1W2, compared to a median value of W1W2 for likely AGN). For contaminants, purely star-forming SED models can yield excellent fits in the redshift range where the majority of candidates with low AGN fractions are found. The purely star-forming SED models suggest that the W1W2 colors are achieved by a combination of stellar attenuation and dust emission, and these potential contaminants are biased toward high specific s.
-
•
Moving toward lower redshifts, the specific s of WISE AGN host galaxies show an increasing negative offset relative to the prediction for normal star forming galaxies. These offsets are most significant at the lowest redshifts (50 %) and suggest evolution of the host galaxy population toward a passive sequence due to reduced cold gas supplies at later epochs. This evolution may also suggest a temporal delay between the onset of star formation and luminous AGN triggering due the time necessary for cold gas to travel from global scales (where the majority of star formation occurs) to nuclear scales for SMBH accretion.
-
•
AGN extinctions show a marginal positive correlation with AGN bolometric luminosities ( 3 significance) that becomes weaker for more luminous AGN. However, AGN extinctions show negative correlations with Eddington ratios that are strongest among the most luminous AGN ( 6 significance). This result is consistent with the ‘receding torus’ model being regulated by radiation pressure and also with the obscuring material being within the SMBH gravitational sphere of influence.
References
- Antonucci (1993) Antonucci, R. 1993, ARA&A, 31, 473, doi: 10.1146/annurev.aa.31.090193.002353
- Antonucci & Miller (1985) Antonucci, R. R. J., & Miller, J. S. 1985, ApJ, 297, 621, doi: 10.1086/163559
- Assef et al. (2018) Assef, R. J., Stern, D., Noirot, G., et al. 2018, ApJS, 234, 23, doi: 10.3847/1538-4365/aaa00a
- Assef et al. (2008) Assef, R. J., Kochanek, C. S., Brodwin, M., et al. 2008, ApJ, 676, 286, doi: 10.1086/527533
- Assef et al. (2010) —. 2010, AJ, 713, 970, doi: 10.1088/0004-637X/713/2/970
- Assef et al. (2011) Assef, R. J., Kochanek, C. S., Ashby, M. L. N., et al. 2011, ApJ, 728, 56, doi: 10.1088/0004-637X/728/1/56
- Assef et al. (2013) Assef, R. J., Stern, D., Kochanek, C. S., et al. 2013, ApJ, 772, 26, doi: 10.1088/0004-637X/772/1/26
- Assef et al. (2015) Assef, R. J., Eisenhardt, P. R. M., Stern, D., et al. 2015, ApJ, 804, 27, doi: 10.1088/0004-637X/804/1/27
- Assef et al. (2020) Assef, R. J., Brightman, M., Walton, D. J., et al. 2020, ApJ, 897, 112, doi: 10.3847/1538-4357/ab9814
- Astropy Collaboration et al. (2013) Astropy Collaboration, Robitaille, T. P., Tollerud, E. J., et al. 2013, A&A, 558, A33, doi: 10.1051/0004-6361/201322068
- Astropy Collaboration et al. (2018) Astropy Collaboration, Price-Whelan, A. M., Sipőcz, B. M., et al. 2018, AJ, 156, 123, doi: 10.3847/1538-3881/aabc4f
- Azadi et al. (2015) Azadi, M., Aird, J., Coil, A. L., et al. 2015, ApJ, 806, 187, doi: 10.1088/0004-637X/806/2/187
- Bahcall et al. (1997) Bahcall, J. N., Kirhakos, S., Saxe, D. H., & Schneider, D. P. 1997, ApJ, 479, 642, doi: 10.1086/303926
- Baldry et al. (2010) Baldry, I. K., Robotham, A. S. G., Hill, D. T., et al. 2010, MNRAS, 404, 86, doi: 10.1111/j.1365-2966.2010.16282.x
- Barrows et al. (2017) Barrows, R. S., Comerford, J. M., Zakamska, N. L., & Cooper, M. C. 2017, ApJ, 850, 27, doi: 10.3847/1538-4357/aa93de
- Beckmann et al. (2009) Beckmann, V., Soldi, S., Ricci, C., et al. 2009, A&A, 505, 417, doi: 10.1051/0004-6361/200912111
- Bentz et al. (2009) Bentz, M. C., Peterson, B. M., Pogge, R. W., & Vestergaard, M. 2009, The Astrophysical Journal Letters, 694, L166
- Bernhard et al. (2016) Bernhard, E., Mullaney, J. R., Daddi, E., Ciesla, L., & Schreiber, C. 2016, MNRAS, 460, 902, doi: 10.1093/mnras/stw973
- Bolton et al. (2012) Bolton, A. S., Schlegel, D. J., Aubourg, É., et al. 2012, AJ, 144, 144, doi: 10.1088/0004-6256/144/5/144
- Boquien et al. (2019) Boquien, M., Burgarella, D., Roehlly, Y., et al. 2019, A&A, 622, A103, doi: 10.1051/0004-6361/201834156
- Boselli et al. (2001) Boselli, A., Gavazzi, G., Donas, J., & Scodeggio, M. 2001, AJ, 121, 753, doi: 10.1086/318734
- Boyle & Terlevich (1998) Boyle, B. J., & Terlevich, R. J. 1998, MNRAS, 293, L49, doi: 10.1046/j.1365-8711.1998.01264.x
- Brodwin et al. (2006) Brodwin, M., Brown, M. J. I., Ashby, M. L. N., et al. 2006, ApJ, 651, 791, doi: 10.1086/507838
- Brown et al. (2019) Brown, M. J. I., Duncan, K. J., Landt, H., et al. 2019, MNRAS, 489, 3351, doi: 10.1093/mnras/stz2324
- Bruzual & Charlot (2003) Bruzual, G., & Charlot, S. 2003, MNRAS, 344, 1000, doi: 10.1046/j.1365-8711.2003.06897.x
- Buchner et al. (2015) Buchner, J., Georgakakis, A., Nandra, K., et al. 2015, ApJ, 802, 89, doi: 10.1088/0004-637X/802/2/89
- Burlon et al. (2011) Burlon, D., Ajello, M., Greiner, J., et al. 2011, ApJ, 728, 58, doi: 10.1088/0004-637X/728/1/58
- Burtscher et al. (2016) Burtscher, L., Davies, R. I., Graciá-Carpio, J., et al. 2016, A&A, 586, A28, doi: 10.1051/0004-6361/201527575
- Canalizo & Stockton (2001) Canalizo, G., & Stockton, A. 2001, ApJ, 555, 719, doi: 10.1086/321520
- Cardelli et al. (1989) Cardelli, J. A., Clayton, G. C., & Mathis, J. S. 1989, ApJ, 345, 245, doi: 10.1086/167900
- Carroll et al. (2021) Carroll, C. M., Hickox, R. C., Masini, A., et al. 2021, ApJ, 908, 185, doi: 10.3847/1538-4357/abd185
- Chambers et al. (2016) Chambers, K. C., Magnier, E. A., Metcalfe, N., et al. 2016, ArXiv e-prints. https://arxiv.org/abs/1612.05560
- Chang et al. (2017) Chang, Y.-Y., Le Floc’h, E., Juneau, S., et al. 2017, ApJS, 233, 19, doi: 10.3847/1538-4365/aa97da
- Chapman et al. (2005) Chapman, S. C., Blain, A. W., Smail, I., & Ivison, R. J. 2005, ApJ, 622, 772, doi: 10.1086/428082
- Chen et al. (2015) Chen, C.-T. J., Hickox, R. C., Alberts, S., et al. 2015, ApJ, 802, 50, doi: 10.1088/0004-637X/802/1/50
- Chung et al. (2014) Chung, S. M., Kochanek, C. S., Assef, R., et al. 2014, ApJ, 790, 54, doi: 10.1088/0004-637X/790/1/54
- Civano et al. (2016) Civano, F., Marchesi, S., Comastri, A., et al. 2016, ApJ, 819, 62, doi: 10.3847/0004-637X/819/1/62
- Coleman et al. (1980) Coleman, G. D., Wu, C. C., & Weedman, D. W. 1980, ApJS, 43, 393, doi: 10.1086/190674
- Comastri (2004) Comastri, A. 2004, Compton-Thick AGN: The Dark Side of the X-Ray Background, ed. A. J. Barger, Vol. 308, 245
- Conroy et al. (2009) Conroy, C., Gunn, J. E., & White, M. 2009, ApJ, 699, 486, doi: 10.1088/0004-637X/699/1/486
- Daddi et al. (2007) Daddi, E., Dickinson, M., Morrison, G., et al. 2007, ApJ, 670, 156, doi: 10.1086/521818
- Dale & Helou (2002) Dale, D. A., & Helou, G. 2002, ApJ, 576, 159, doi: 10.1086/341632
- Dale et al. (2001) Dale, D. A., Helou, G., Contursi, A., Silbermann, N. A., & Kolhatkar, S. 2001, ApJ, 549, 215, doi: 10.1086/319077
- Dale et al. (2014) Dale, D. A., Helou, G., Magdis, G. E., et al. 2014, ApJ, 784, 83, doi: 10.1088/0004-637X/784/1/83
- Devriendt et al. (1999) Devriendt, J. E. G., Guiderdoni, B., & Sadat, R. 1999, A&A, 350, 381. https://arxiv.org/abs/astro-ph/9906332
- Di Matteo et al. (2005) Di Matteo, T., Springel, V., & Hernquist, L. 2005, Nature, 433, 604, doi: 10.1038/nature03335
- Donley et al. (2012) Donley, J. L., Koekemoer, A. M., Brusa, M., et al. 2012, ApJ, 748, 142, doi: 10.1088/0004-637X/748/2/142
- Draine (2003a) Draine, B. T. 2003a, ARA&A, 41, 241, doi: 10.1146/annurev.astro.41.011802.094840
- Draine (2003b) —. 2003b, ApJ, 598, 1017, doi: 10.1086/379118
- Duncan et al. (2018) Duncan, K. J., Brown, M. J. I., Williams, W. L., et al. 2018, MNRAS, 473, 2655, doi: 10.1093/mnras/stx2536
- Elvis et al. (1994) Elvis, M., Wilkes, B. J., McDowell, J. C., et al. 1994, ApJS, 95, 1, doi: 10.1086/192093
- Fabian et al. (2009) Fabian, A. C., Vasudevan, R. V., Mushotzky, R. F., Winter, L. M., & Reynolds, C. S. 2009, MNRAS, 394, L89, doi: 10.1111/j.1745-3933.2009.00617.x
- Fazio et al. (2004) Fazio, G. G., Hora, J. L., Allen, L. E., et al. 2004, ApJS, 154, 10, doi: 10.1086/422843
- Ferrarese & Merritt (2000) Ferrarese, L., & Merritt, D. 2000, ApJ, 539, L9, doi: 10.1086/312838
- Fiore et al. (2009) Fiore, F., Puccetti, S., Brusa, M., et al. 2009, ApJ, 693, 447, doi: 10.1088/0004-637X/693/1/447
- Gandhi et al. (2009) Gandhi, P., Horst, H., Smette, A., et al. 2009, A&A, 502, 457, doi: 10.1051/0004-6361/200811368
- Gebhardt et al. (2000) Gebhardt, K., Bender, R., Bower, G., et al. 2000, ApJ, 539, L13, doi: 10.1086/312840
- Glikman et al. (2015) Glikman, E., Simmons, B., Mailly, M., et al. 2015, ApJ, 806, 218, doi: 10.1088/0004-637X/806/2/218
- Gordon & Clayton (1998) Gordon, K. D., & Clayton, G. C. 1998, ApJ, 500, 816, doi: 10.1086/305774
- Granato & Danese (1994) Granato, G. L., & Danese, L. 1994, MNRAS, 268, 235, doi: 10.1093/mnras/268.1.235
- Griffith et al. (2011) Griffith, R. L., Tsai, C.-W., Stern, D., et al. 2011, ApJ, 736, L22, doi: 10.1088/2041-8205/736/1/L22
- Gültekin et al. (2009) Gültekin, K., Richstone, D. O., Gebhardt, K., et al. 2009, ApJ, 698, 198, doi: 10.1088/0004-637X/698/1/198
- Hainline et al. (2016) Hainline, K. N., Reines, A. E., Greene, J. E., & Stern, D. 2016, ApJ, 832, 119, doi: 10.3847/0004-637X/832/2/119
- Harris et al. (2016) Harris, K., Farrah, D., Schulz, B., et al. 2016, MNRAS, 457, 4179, doi: 10.1093/mnras/stw286
- Hernquist (1989) Hernquist, L. 1989, Nature, 340, 687, doi: 10.1038/340687a0
- Hickox & Alexander (2018) Hickox, R. C., & Alexander, D. M. 2018, ARA&A, 56, 625, doi: 10.1146/annurev-astro-081817-051803
- Hickox et al. (2007) Hickox, R. C., Jones, C., Forman, W. R., et al. 2007, ApJ, 671, 1365, doi: 10.1086/523082
- Hickox et al. (2009) —. 2009, ApJ, 696, 891, doi: 10.1088/0004-637X/696/1/891
- Hinshaw et al. (2013) Hinshaw, G., Larson, D., Komatsu, E., et al. 2013, The Astrophysical Journal Supplement Series, 208, 19, doi: 10.1088/0067-0049/208/2/19
- Hoaglin et al. (1983) Hoaglin, D. C., Mosteller, F., & Tukey, J. W. 1983, Understanding robust and exploratory data anlysis
- Høg et al. (2000) Høg, E., Fabricius, C., Makarov, V. V., et al. 2000, A&A, 355, L27
- Hopkins (2012) Hopkins, P. F. 2012, MNRAS, 420, L8, doi: 10.1111/j.1745-3933.2011.01179.x
- Hopkins et al. (2005) Hopkins, P. F., Hernquist, L., Cox, T. J., et al. 2005, ApJ, 630, 705, doi: 10.1086/432438
- Hopkins et al. (2008) Hopkins, P. F., Hernquist, L., Cox, T. J., & Kereš, D. 2008, ApJS, 175, 356, doi: 10.1086/524362
- Hopkins et al. (2009) Hopkins, P. F., Hickox, R., Quataert, E., & Hernquist, L. 2009, MNRAS, 398, 333, doi: 10.1111/j.1365-2966.2009.15136.x
- Hopkins et al. (2007) Hopkins, P. F., Richards, G. T., & Hernquist, L. 2007, ApJ, 654, 731, doi: 10.1086/509629
- Hutchings & Neff (1992) Hutchings, J. B., & Neff, S. G. 1992, AJ, 104, 1, doi: 10.1086/116216
- Jarrett et al. (2011) Jarrett, T. H., Cohen, M., Masci, F., et al. 2011, ApJ, 735, 112, doi: 10.1088/0004-637X/735/2/112
- Karim et al. (2011) Karim, A., Schinnerer, E., Martínez-Sansigre, A., et al. 2011, ApJ, 730, 61, doi: 10.1088/0004-637X/730/2/61
- Kaviraj et al. (2015a) Kaviraj, S., Shabala, S. S., Deller, A. T., & Middelberg, E. 2015a, MNRAS, 454, 1595, doi: 10.1093/mnras/stv1957
- Kaviraj et al. (2015b) —. 2015b, MNRAS, 452, 774, doi: 10.1093/mnras/stv1329
- Kawamuro et al. (2016) Kawamuro, T., Ueda, Y., Tazaki, F., Terashima, Y., & Mushotzky, R. 2016, ApJ, 831, 37, doi: 10.3847/0004-637X/831/1/37
- Kennicutt & Evans (2012) Kennicutt, R. C., & Evans, N. J. 2012, ARA&A, 50, 531, doi: 10.1146/annurev-astro-081811-125610
- Kewley et al. (2006) Kewley, L. J., Groves, B., Kauffmann, G., & Heckman, T. 2006, MNRAS, 372, 961, doi: 10.1111/j.1365-2966.2006.10859.x
- Kim et al. (1998) Kim, D. C., Veilleux, S., & Sanders, D. B. 1998, ApJ, 508, 627, doi: 10.1086/306409
- Kirkpatrick et al. (2012) Kirkpatrick, A., Pope, A., Alexander, D. M., et al. 2012, ApJ, 759, 139, doi: 10.1088/0004-637X/759/2/139
- Kishimoto (1999) Kishimoto, M. 1999, ApJ, 518, 676, doi: 10.1086/307290
- Kishimoto et al. (2001) Kishimoto, M., Antonucci, R., Cimatti, A., et al. 2001, ApJ, 547, 667, doi: 10.1086/318403
- Kochanek et al. (2012) Kochanek, C. S., Eisenstein, D. J., Cool, R. J., et al. 2012, ApJS, 200, 8, doi: 10.1088/0067-0049/200/1/8
- Kotilainen & Ward (1994) Kotilainen, J. K., & Ward, M. J. 1994, MNRAS, 266, 953, doi: 10.1093/mnras/266.4.953
- Krolik (1999) Krolik, J. H. 1999, Active galactic nuclei : from the central black hole to the galactic environment, ed. Krolik, J. H.
- Lacy et al. (2007) Lacy, M., Petric, A. O., Sajina, A., et al. 2007, AJ, 133, 186, doi: 10.1086/509617
- Lacy et al. (2004) Lacy, M., Storrie-Lombardi, L. J., Sajina, A., et al. 2004, ApJS, 154, 166, doi: 10.1086/422816
- Lanzuisi et al. (2009) Lanzuisi, G., Piconcelli, E., Fiore, F., et al. 2009, A&A, 498, 67, doi: 10.1051/0004-6361/200811282
- Lanzuisi et al. (2017) Lanzuisi, G., Delvecchio, I., Berta, S., et al. 2017, A&A, 602, A123, doi: 10.1051/0004-6361/201629955
- Lawrence (1991) Lawrence, A. 1991, MNRAS, 252, 586, doi: 10.1093/mnras/252.4.586
- Leslie et al. (2016) Leslie, S. K., Kewley, L. J., Sanders, D. B., & Lee, N. 2016, MNRAS, 455, L82, doi: 10.1093/mnrasl/slv135
- Lin et al. (1996) Lin, H., Kirshner, R. P., Shectman, S. A., et al. 1996, ApJ, 464, 60, doi: 10.1086/177300
- Lindegren et al. (2018) Lindegren, L., Hernández, J., Bombrun, A., et al. 2018, A&A, 616, A2, doi: 10.1051/0004-6361/201832727
- López-Gonzaga et al. (2016) López-Gonzaga, N., Burtscher, L., Tristram, K. R. W., Meisenheimer, K., & Schartmann, M. 2016, A&A, 591, A47, doi: 10.1051/0004-6361/201527590
- Lupi et al. (2020) Lupi, A., Sbarrato, T., & Carniani, S. 2020, MNRAS, 492, 2528, doi: 10.1093/mnras/stz3636
- Lusso et al. (2013) Lusso, E., Hennawi, J. F., Comastri, A., et al. 2013, ApJ, 777, 86, doi: 10.1088/0004-637X/777/2/86
- Lutz et al. (2004) Lutz, D., Maiolino, R., Spoon, H. W. W., & Moorwood, A. F. M. 2004, A&A, 418, 465, doi: 10.1051/0004-6361:20035838
- Lyu & Rieke (2018) Lyu, J., & Rieke, G. H. 2018, ApJ, 866, 92, doi: 10.3847/1538-4357/aae075
- Madau et al. (1998) Madau, P., Pozzetti, L., & Dickinson, M. 1998, ApJ, 498, 106, doi: 10.1086/305523
- Magnier et al. (2020) Magnier, E. A., Schlafly, E. F., Finkbeiner, D. P., et al. 2020, ApJS, 251, 6, doi: 10.3847/1538-4365/abb82a
- Maiolino et al. (2001) Maiolino, R., Marconi, A., Salvati, M., et al. 2001, A&A, 365, 28, doi: 10.1051/0004-6361:20000177
- Marchesi et al. (2016) Marchesi, S., Civano, F., Elvis, M., et al. 2016, ApJ, 817, 34, doi: 10.3847/0004-637X/817/1/34
- Marconi & Hunt (2003) Marconi, A., & Hunt, L. K. 2003, ApJ, 589, L21, doi: 10.1086/375804
- Mason et al. (2012) Mason, R. E., Lopez-Rodriguez, E., Packham, C., et al. 2012, AJ, 144, 11, doi: 10.1088/0004-6256/144/1/11
- Mateos et al. (2012) Mateos, S., Alonso-Herrero, A., Carrera, F. J., et al. 2012, MNRAS, 426, 3271, doi: 10.1111/j.1365-2966.2012.21843.x
- Mateos et al. (2015) Mateos, S., Carrera, F. J., Alonso-Herrero, A., et al. 2015, MNRAS, 449, 1422, doi: 10.1093/mnras/stv299
- McLure et al. (1999) McLure, R. J., Kukula, M. J., Dunlop, J. S., et al. 1999, MNRAS, 308, 377, doi: 10.1046/j.1365-8711.1999.02676.x
- McPartland et al. (2019) McPartland, C., Sanders, D. B., Kewley, L. J., & Leslie, S. K. 2019, MNRAS, 482, L129, doi: 10.1093/mnrasl/sly202
- Merloni et al. (2014) Merloni, A., Bongiorno, A., Brusa, M., et al. 2014, MNRAS, 437, 3550, doi: 10.1093/mnras/stt2149
- Montero-Dorta et al. (2016) Montero-Dorta, A. D., Bolton, A. S., Brownstein, J. R., et al. 2016, MNRAS, 461, 1131, doi: 10.1093/mnras/stw1352
- Morrissey et al. (2007) Morrissey, P., Conrow, T., Barlow, T. A., et al. 2007, ApJS, 173, 682, doi: 10.1086/520512
- Mulchaey et al. (1992) Mulchaey, J. S., Mushotzky, R. F., & Weaver, K. A. 1992, ApJ, 390, L69, doi: 10.1086/186374
- Mullaney et al. (2012) Mullaney, J. R., Daddi, E., Béthermin, M., et al. 2012, ApJ, 753, L30, doi: 10.1088/2041-8205/753/2/L30
- Netzer (2015) Netzer, H. 2015, ARA&A, 53, 365, doi: 10.1146/annurev-astro-082214-122302
- Nolan et al. (2001) Nolan, L. A., Dunlop, J. S., Kukula, M. J., et al. 2001, MNRAS, 323, 308, doi: 10.1046/j.1365-8711.2001.04174.x
- Noll et al. (2009) Noll, S., Burgarella, D., Giovannoli, E., et al. 2009, A&A, 507, 1793, doi: 10.1051/0004-6361/200912497
- O’Connor et al. (2016) O’Connor, J. A., Rosenberg, J. L., Satyapal, S., & Secrest, N. J. 2016, MNRAS, 463, 811, doi: 10.1093/mnras/stw1976
- Padovani et al. (2017) Padovani, P., Alexander, D. M., Assef, R. J., et al. 2017, A&A Rev., 25, 2, doi: 10.1007/s00159-017-0102-9
- Page et al. (2004) Page, M. J., Stevens, J. A., Ivison, R. J., & Carrera, F. J. 2004, ApJ, 611, L85, doi: 10.1086/423892
- Peng et al. (2010) Peng, Y.-j., Lilly, S. J., Kovač, K., et al. 2010, ApJ, 721, 193, doi: 10.1088/0004-637X/721/1/193
- Pier et al. (2003) Pier, J. R., Munn, J. A., Hindsley, R. B., et al. 2003, AJ, 125, 1559, doi: 10.1086/346138
- Rakshit et al. (2020) Rakshit, S., Stalin, C. S., & Kotilainen, J. 2020, ApJS, 249, 17, doi: 10.3847/1538-4365/ab99c5
- Rémy-Ruyer et al. (2015) Rémy-Ruyer, A., Madden, S. C., Galliano, F., et al. 2015, A&A, 582, A121, doi: 10.1051/0004-6361/201526067
- Renzini & Peng (2015) Renzini, A., & Peng, Y.-j. 2015, ApJ, 801, L29, doi: 10.1088/2041-8205/801/2/L29
- Ricci et al. (2017a) Ricci, C., Trakhtenbrot, B., Koss, M. J., et al. 2017a, ApJS, 233, 17, doi: 10.3847/1538-4365/aa96ad
- Ricci et al. (2017b) —. 2017b, Nature, 549, 488, doi: 10.1038/nature23906
- Richards et al. (2006) Richards, G. T., Lacy, M., Storrie-Lombardi, L. J., et al. 2006, ApJS, 166, 470, doi: 10.1086/506525
- Rodighiero et al. (2010) Rodighiero, G., Cimatti, A., Gruppioni, C., et al. 2010, A&A, 518, L25, doi: 10.1051/0004-6361/201014624
- Rosario et al. (2012) Rosario, D. J., Santini, P., Lutz, D., et al. 2012, A&A, 545, A45, doi: 10.1051/0004-6361/201219258
- Rowan-Robinson et al. (2008) Rowan-Robinson, M., Babbedge, T., Oliver, S., et al. 2008, MNRAS, 386, 697, doi: 10.1111/j.1365-2966.2008.13109.x
- Runnoe et al. (2012) Runnoe, J. C., Brotherton, M. S., & Shang, Z. 2012, MNRAS, 422, 478, doi: 10.1111/j.1365-2966.2012.20620.x
- Salpeter (1955) Salpeter, E. E. 1955, ApJ, 121, 161, doi: 10.1086/145971
- Salvato et al. (2009) Salvato, M., Hasinger, G., Ilbert, O., et al. 2009, ApJ, 690, 1250, doi: 10.1088/0004-637X/690/2/1250
- Sanders et al. (1988) Sanders, D. B., Soifer, B. T., Elias, J. H., et al. 1988, ApJ, 325, 74, doi: 10.1086/165983
- Santini et al. (2012) Santini, P., Rosario, D. J., Shao, L., et al. 2012, A&A, 540, A109, doi: 10.1051/0004-6361/201118266
- Satyapal et al. (2018) Satyapal, S., Abel, N. P., & Secrest, N. J. 2018, ApJ, 858, 38, doi: 10.3847/1538-4357/aab7f8
- Schartmann et al. (2008) Schartmann, M., Meisenheimer, K., Camenzind, M., et al. 2008, A&A, 482, 67, doi: 10.1051/0004-6361:20078907
- Schawinski et al. (2007) Schawinski, K., Thomas, D., Sarzi, M., et al. 2007, MNRAS, 382, 1415, doi: 10.1111/j.1365-2966.2007.12487.x
- Schawinski et al. (2009) Schawinski, K., Virani, S., Simmons, B., et al. 2009, ApJ, 692, L19, doi: 10.1088/0004-637X/692/1/L19
- Schechter (1976) Schechter, P. 1976, ApJ, 203, 297, doi: 10.1086/154079
- Schlafly & Finkbeiner (2011) Schlafly, E. F., & Finkbeiner, D. P. 2011, ApJ, 737, 103, doi: 10.1088/0004-637X/737/2/103
- Schlegel et al. (1998) Schlegel, D. J., Finkbeiner, D. P., & Davis, M. 1998, ApJ, 500, 525, doi: 10.1086/305772
- Schnorr-Müller et al. (2016) Schnorr-Müller, A., Davies, R. I., Korista, K. T., et al. 2016, MNRAS, 462, 3570, doi: 10.1093/mnras/stw1865
- Schreiber et al. (2015) Schreiber, C., Pannella, M., Elbaz, D., et al. 2015, A&A, 575, A74, doi: 10.1051/0004-6361/201425017
- Schultz & Wiemer (1975) Schultz, G. V., & Wiemer, W. 1975, A&A, 43, 133
- Scoville et al. (2007) Scoville, N., Aussel, H., Brusa, M., et al. 2007, ApJS, 172, 1, doi: 10.1086/516585
- Secrest et al. (2015) Secrest, N. J., Dudik, R. P., Dorland, B. N., et al. 2015, ApJS, 221, 12, doi: 10.1088/0067-0049/221/1/12
- Shabala et al. (2017) Shabala, S. S., Deller, A., Kaviraj, S., et al. 2017, MNRAS, 464, 4706, doi: 10.1093/mnras/stw2536
- Shang et al. (2011) Shang, Z., Brotherton, M. S., Wills, B. J., et al. 2011, ApJS, 196, 2, doi: 10.1088/0067-0049/196/1/2
- Shi et al. (2013) Shi, Y., Helou, G., Armus, L., Stierwalt, S., & Dale, D. 2013, ApJ, 764, 28, doi: 10.1088/0004-637X/764/1/28
- Shimizu et al. (2015) Shimizu, T. T., Mushotzky, R. F., Meléndez, M., Koss, M., & Rosario, D. J. 2015, MNRAS, 452, 1841, doi: 10.1093/mnras/stv1407
- Simpson (2005) Simpson, C. 2005, MNRAS, 360, 565, doi: 10.1111/j.1365-2966.2005.09043.x
- Skrutskie et al. (2006) Skrutskie, M. F., Cutri, R. M., Stiening, R., et al. 2006, AJ, 131, 1163, doi: 10.1086/498708
- Somerville et al. (2008) Somerville, R. S., Hopkins, P. F., Cox, T. J., Robertson, B. E., & Hernquist, L. 2008, MNRAS, 391, 481, doi: 10.1111/j.1365-2966.2008.13805.x
- Spilker et al. (2018) Spilker, J., Bezanson, R., Barišić, I., et al. 2018, ApJ, 860, 103, doi: 10.3847/1538-4357/aac438
- Springel et al. (2005) Springel, V., Di Matteo, T., & Hernquist, L. 2005, MNRAS, 361, 776, doi: 10.1111/j.1365-2966.2005.09238.x
- Stemo et al. (2020) Stemo, A., Comerford, J. M., Barrows, R. S., et al. 2020, ApJ, 888, 78, doi: 10.3847/1538-4357/ab5f66
- Stern (2015) Stern, D. 2015, ApJ, 807, 129, doi: 10.1088/0004-637X/807/2/129
- Stern et al. (2005) Stern, D., Eisenhardt, P., Gorjian, V., et al. 2005, ApJ, 631, 163, doi: 10.1086/432523
- Stern et al. (2012) Stern, D., Assef, R. J., Benford, D. J., et al. 2012, ApJ, 753, 30, doi: 10.1088/0004-637X/753/1/30
- Suganuma et al. (2006) Suganuma, M., Yoshii, Y., Kobayashi, Y., et al. 2006, ApJ, 639, 46, doi: 10.1086/499326
- Suh et al. (2017) Suh, H., Civano, F., Hasinger, G., et al. 2017, ApJ, 841, 102, doi: 10.3847/1538-4357/aa725c
- Suh et al. (2019) —. 2019, ApJ, 872, 168, doi: 10.3847/1538-4357/ab01fb
- Taylor et al. (1996) Taylor, G. L., Dunlop, J. S., Hughes, D. H., & Robson, E. I. 1996, MNRAS, 283, 930, doi: 10.1093/mnras/283.3.930
- Toba et al. (2014) Toba, Y., Oyabu, S., Matsuhara, H., et al. 2014, ApJ, 788, 45, doi: 10.1088/0004-637X/788/1/45
- Treister et al. (2008) Treister, E., Krolik, J. H., & Dullemond, C. 2008, ApJ, 679, 140, doi: 10.1086/586698
- Tsai et al. (2015) Tsai, C.-W., Eisenhardt, P. R. M., Wu, J., et al. 2015, ApJ, 805, 90, doi: 10.1088/0004-637X/805/2/90
- Ueda et al. (2003) Ueda, Y., Akiyama, M., Ohta, K., & Miyaji, T. 2003, ApJ, 598, 886, doi: 10.1086/378940
- Urry & Padovani (1995) Urry, C. M., & Padovani, P. 1995, Publications of the Astronomical Society of the Pacific, 107, 803
- Whitaker et al. (2012) Whitaker, K. E., van Dokkum, P. G., Brammer, G., & Franx, M. 2012, ApJ, 754, L29, doi: 10.1088/2041-8205/754/2/L29
- Wild et al. (2010) Wild, V., Heckman, T., & Charlot, S. 2010, MNRAS, 405, 933, doi: 10.1111/j.1365-2966.2010.16536.x
- Wright et al. (2010) Wright, E. L., Eisenhardt, P. R. M., Mainzer, A. K., et al. 2010, AJ, 140, 1868, doi: 10.1088/0004-6256/140/6/1868
- Wylezalek et al. (2018) Wylezalek, D., Zakamska, N. L., Greene, J. E., et al. 2018, MNRAS, 474, 1499, doi: 10.1093/mnras/stx2784
- Younger et al. (2008) Younger, J. D., Hopkins, P. F., Cox, T. J., & Hernquist, L. 2008, ApJ, 686, 815, doi: 10.1086/591639
- Zacharias et al. (2000) Zacharias, N., Urban, S. E., Zacharias, M. I., et al. 2000, AJ, 120, 2131, doi: 10.1086/301563
- Zakamska et al. (2005) Zakamska, N. L., Schmidt, G. D., Smith, P. S., et al. 2005, AJ, 129, 1212, doi: 10.1086/427543
- Zakamska et al. (2006) Zakamska, N. L., Strauss, M. A., Krolik, J. H., et al. 2006, AJ, 132, 1496, doi: 10.1086/506986