Czech Republic, 11email: honza.kara.7@gmail.com 22institutetext: Universidad Nacional Autónoma de México, Instituto de Astronomía, AP 106, Ensenada, 22800, BC, México 33institutetext: Astronomical Institute, Academy of Sciences, Fričova 298, 251 65 Ondřejov, Czech Republic 44institutetext: Research Centre for Theoretical Physics and Astrophysics, Institute of Physics, Silesian University in Opava, Bezručovo nám. 13, 746 01 Opava, Czech Republic 55institutetext: Variable Star and Exoplanet Section, Czech Astronomical Society, Fričova 298, 251 65 Ondřejov 66institutetext: BSObservatory, Modrá 587, CZ-760 01 Zlín, Czech Republic 77institutetext: FZU – Institute of Physics of the Czech Academy of Sciences, Na Slovance 1999/2, Prague 182 21, Czech Republic
The period-gap cataclysmic variable CzeV404 Her:
A link between SW Sex and SU UMa systems
††thanks: Based on observations obtained at San Pedro Martír Observatory, UNAM, Baja California, Mexico, Ondřejov Observatory, Czech Republic,
Observatorio del Roquede los Muchachos, Spain,
BS Observatory, Zlín, Czech Republic,
and La Silla Observatory, Chile.
Table 4 is available in electronic form at www.aanda.org.
Abstract
Context. We present a new study of the eclipsing cataclysmic variable CzeV404 Her ( d) that is located in the period gap.
Aims. This report determines the origin of the object and the system parameters and probes the accretion flow structure of the system.
Methods. We conducted simultaneous time-resolved photometric and spectroscopic observations of CzeV404 Her. We applied our light-curve modelling techniques and the Doppler tomography method to determine the system parameters and analyse the structure of the accretion disk.
Results. We found that the system has a massive white dwarf M☉, a mass ratio of , and a relatively hot secondary with an effective temperature K. The system inclination is . The accretion disk spreads out to the tidal limitation radius and has an extended hot spot or line region. The hot spot or line is hotter than the remaining outer part of the disk in quiescence or in intermediate state, but does not stand out completely from the disk flux in (super)outbursts.
Conclusions. We claim that this object represents a link between two distinct classes of SU UMa-type and SW Sex-type cataclysmic variables. The accretion flow structure in the disk corresponds to the SW Sex systems, but the physical conditions inside the disk fit the behaviour of SU UMa-type objects.
Key Words.:
variables: cataclysmic – stars: individual: CzeV404 Her – stars: fundamental parameters – stars: dwarf novae – methods: observational1 Introduction
Cataclysmic variables (CVs) are semi-detached binaries consisting of a white dwarf as a primary and a late-type (K-M) secondary star or a brown dwarf (Warner 1995a). The secondary overfills its Roche lobe and transfers matter onto the primary. The orbital period of CVs ranges from min to hours. If the primary has a weak magnetic field (), the transferred matter forms an accretion disk around the white dwarf. In some CVs, called dwarf novae (DNe), the accretion disk can fluctuate between a low- and a high-temperature or density state. This explosive transition has an outbursting behaviour. The amplitudes of DNe outbursts range between 2 – 8 magnitudes and last for 2 – 20 days.
The range of orbital periods between 2.15 and 3.18 hours is called the period gap. A significant deficiency of CVs is observed there (Knigge et al. 2011). It is assumed that the lack of CVs inside the period gap is caused by the secondary star becoming fully convective. This causes the magnetic breaking to shut off, whereby long-period CVs lose angular momentum and sustain mass transfer between their components (Zorotovic et al. 2016; Garraffo et al. 2018). Unable to lose its angular momentum, the binary evolves towards shorter orbital periods as a detached binary. When the system reaches an orbital period of hours, mass transfer restarts. For shorter periods until the period minimum, the emission of gravitational waves becomes the leading process of losing the angular momentum, and this is efficient enough for the mass transfer to continue.
The small number of CVs in the period gap (Katysheva & Pavlenko 2003) includes eclipsing systems (Dai & Qian 2012), which provide an opportunity to determine system parameters and to probe the evolutionary theories. These systems include polars, DNes, novas, and nova-likes. In recent years, the list has been slightly extended mostly by the newly discovered polars MLS110213:022733+130617 (Silva et al. 2015), CRTS J035010.7+323230 (Mason et al. 2019), 2PBC J0658.0-1746 (Bernardini et al. 2019), DNes CzeV404 Her (Cagas & Cagas 2014), and RXS J003828.7+250920 (Pavlenko et al. 2016).


The subject of this paper is the study of CzeV404 Her (also 2MASS J18300176+1233462, UCAC4 513-078584). Cagas & Cagas (2014) reported the discovery of the object and determined its orbital period as 2.35 hours. Based on the detection of the superoutburst and several outbursts, they classified the source as an SU UMa-type CV. The system resides inside the period gap and is currently known as the eclipsing SU UMa-type object with the longest orbital period. B\kakowska et al. (2014) confirmed the SU UMa nature of CzeV404 Her by detecting a superoutburst with an amplitude of that lasted 17 days. The superhump period = 0.10472(2)111Herein, the numbers in brackets are 1 uncertainties referring to the last significant digits quoted. day was found with a highly decreasing rate of = -2.43(8) s s-1. Based on 17 eclipses, they derived the orbital period of = 0.0980203(6) day. The period excess was . B\kakowska et al. (2014) estimated the mass ratio in the system to be 222We note that the improved relation (Patterson et al. 2005, see equation (8)) gives . Equation (5) from Kato & Osaki (2013) gives a lower value of . based on the relation from Patterson (1998).
Hardy et al. (2017) refined the ephemeris of CzeV404 Her:
Pri. Min. = BMJD 24 5687191730(4) + 009802125(2) .
The Gaia parallax of the source is 2.94(5) mas (Luri et al. 2018), which gives a distance of pc.333 Luri et al. (2018) showed that when the relative error of the parallax is sufficiently low, inverting the parallax is a valid approach to obtain the accurate distance to the object. With a relative error in the case of CzeV404 Her, inverting the parallax is a valid approach to determine the distance. The interstellar absorption in this direction for the object distance is (Green et al. 2015).
Here we report the results of new time-resolved photometric and spectroscopic observations of CzeV404 Her. The paper is structured as follows. In Sections 2 and 3 we describe our observations, the photometric data available from the ASAS-SN photometry database, and the data reduction. In Sections 4 and 5 we analyse the outburst and superoutburst activity and the short-term light curves of CzeV404 Her. The eclipse light-curve modelling and fundamental system parameters are presented in Section 6. Section 7 reports the accretion flow structure based on the Doppler mapping method. The results are discussed and our conclusions are given in Sections 8 and 9, respectively.
2 Photometry
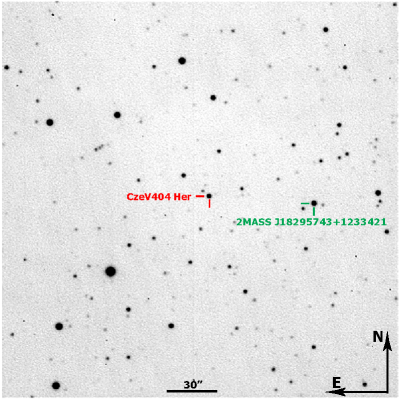
The CCD photometry of CzeV404 Her was obtained at different observatories: at Ondřejov Observatory (Czech Republic), at La Silla Observatory (Chile), at the Observatorio Astronomico Nacional San Pedro Mártir (México, SPM hereafter), at the Observatorio del Roque de los Muchachos (Spain, ORM hereafter), and at BSObservatory444http://www.tcmt.org (Czech Republic, BSO hereafter), a private observatory in the Czech Republic operated by P. Cagaš. The log of photometric observations is presented in Table 1. The field star 2MASS J18295743+1233421 ( mag, see Fig. 1) was used as a standard. Its magnitude was calculated from the Pan-STARRS1 data (Chambers et al. 2016) using the transformation equations reported by Kostov & Bonev (2018).
Standard data reduction was carried out using the apphot/IRAF tools for SPM data, the Aphot32 555developed at the Ondřejov Observatory by M. Velen and P. Pravec and C-MUNIPACK 666 http://c-munipack.sourceforge.net, created by D. Motl software in the case of data obtained at La Silla and Ondřejov observatories, C-MUNIPACK for ORM data, and SIPS 777https://www.gxccd.com/cat?id=146&lang=409, created by P. Cagaš for BSO data.
| Observatory | Photometric bands | Monitoring period |
|---|---|---|
| Ondřejov | C, V, R | 2015 – 2021 |
| SPM | V | 2019 |
| La Silla | R | 2019 |
| BSO | C | 2012 – 2020 |
| ORM | B, V, R | 2020 |
2.1 Ondřejov Observatory photometry
Since June 2015, the CzeV404 Her eclipses have been regularly monitored at Ondřejov Observatory in the Czech Republic. A total of 44 eclipse light curves has been collected using the Mayer 0.65 m () reflecting telescope with the CCD camera G2-3200 in clear light (called ”C” filter) with an exposure time of 30 seconds. In addition, the series of 10 second frames in the V and R bands were carried out in 2019 – 2020 in order to study long-term brightness variations of the system.
2.2 SPM photometry
Time-resolved photometry of CzeV404 Her was obtained using the direct CCD image mode of the 0.84 m telescope OAN-SPM Observatory in México. The object was observed on 2019, April 9 – 11, and on July 28 – 29. The time of an individual exposure was 60 seconds and the runs lasted about 2 – 3.5 hours. The images were bias-corrected and flat-fielded before aperture photometry was carried out. The photometric data were calibrated using the field standard star. The errors, ranging from 0.01 to 0.05 mag, were estimated from the magnitude dispersion of comparison stars with similar brightness. One whole orbital period light curve and three additional light curves of the eclipse were collected.
| Date | HJD∗ | Range | Dispersion | Exp. | Number | Duration | V band |
|---|---|---|---|---|---|---|---|
| (2019). | +2450000 | [Å] | [Å/pixel ] | time [min] | of spectra | [hour] | [mag] |
| Apr 08 (N1) | 8582.872 | ||||||
| Apr 09 (N2) | 8583.922 | ||||||
| Apr 10 (N3) | 8584.888 | 13 | |||||
| Jul 28 (N4) | 8692.687 | 8 | |||||
| 15 | 10 | 3.4 | |||||
| Jul 29 (N5) | 8693.753 |
2.3 La Silla photometry
The additional single-night light curve of CzeV404 Her was obtained in the R band with a total observation time of 2 hours and an exposure time of 7 s on 2019, March 15. The Danish 1.54 m telescope located at La Silla Observatory in Chile was used.
2.4 BSO photometry
We also used data from the long-term monitoring in the clear light collected during 2014 – 2019 using the 25 cm and 30 cm reflecting telescopes of BSObservatory in the Czech Republic.
2.5 ORM photometry
The BVR-bands observations of the superoutburst (cycle 22, Table 3) and the out-of-eclipse brightness monitoring of the object were obtained during 2020, July, using the FRAM CTA-N 25 cm telescope located at the Observatorio del Roque de los Muchachos, La Palma, Canary Islands, Spain (Ebr et al. 2019).
2.6 ASAS-SN photometry database
The ASAS-SN photometry database888https://asas-sn.osu.edu/ (Shappee et al. 2014; Kochanek et al. 2017; Jayasinghe et al. 2019) contains the V-band (2012, 2015 – 2018) and g-band (2018 – 2021) photometric data of CzeV404 Her. We extracted the data using the ASAS-SN photometry database online tool. A circular aperture of 16′′ radius was used for the aperture photometry. Several background stars fell into the aperture and contaminated the object flux. We verified that none of these stars showed any variability and added a constant value to the source flux measurements. The ASAS-SN data typically cover a short time interval during one night (up to three points per night). They are only suitable for studying long-term variability and monitoring normal and superoutbursts.

3 Spectroscopy
Long-slit spectroscopic observations were obtained using the Boller & Chivens spectrograph attached to the 2.12 m telescope of the SPM during two observing runs. The first run was on 2019, April 8 – 10 and the second run on 2019, July 28 – 29. The weather conditions during the first run were photometric, but the second run was partly affected by a small variation in the sky transparency. The spectral data were reduced in the standard way using the apextract and onedspec IRAF tools. The log of spectroscopic observations is given in Table 2. The period-averaged spectra of the source obtained in 2019, April and July, are shown in Fig. 2. The spectra clearly confirm the CV nature of the object.
4 Long-term behaviour of CzeV404 Her
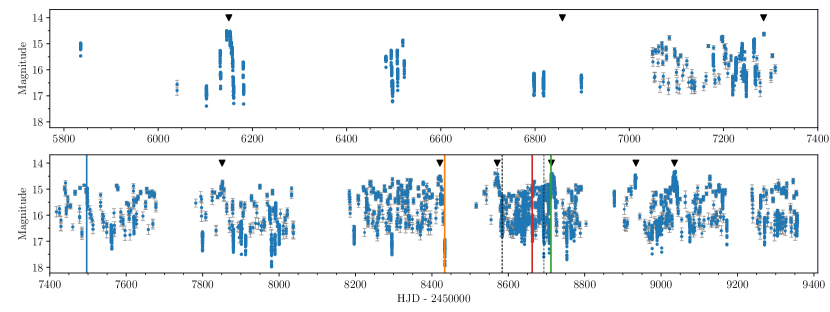
Fig. 3 shows long-term behaviour of CzeV404 Her on a timescale of about 3000 days. The object varies strongly between 145–165 in the V and g bands. Normal outbursts and superoutbursts can be clearly distinguished in the light curve. The normal outbursts of CzeV404 Her have an amplitude of in the V band, and they occur with a recurrence period of days. A normal outburst lasts about days. The object brightness increases from quiescence to the maximum with a rate of day-1 , and the duration of the maximum source brightness is about day. After the maximum, the object falls to quiescence with a rate that is twice slower ( day-1) than the increasing phase.
| HJD – 2400000 | BJD – 2400000 | r.m.s. | Epoch | Observatory |
|---|---|---|---|---|
| 55835.352271 | 55835.353038 | 0.000127 | -26401 | BSO |
| 56102.458581 | 56102.459355 | 0.000013 | -23676 | BSO |
| 56131.375919 | 56131.376705 | 0.000002 | -23381 | BSO |
| … | … | … | … |
Various superoutbursts were also observed by the ASAS-SN project in addition to those reported by Cagas & Cagas (2014) and B\kakowska et al. (2014) (see Table 3). The amplitude of a superoutburst in the V band is , which exceeds the amplitude of a normal outburst by about . A superoutburst lasts about 20 days. Typically, the brightness increases with a rate of 05 day-1 during days, then the accretion disk spends days in a plateau phase, and after this, the brightness declines for days to quiescence. All superoutbursts recorded so far are listed in Table 3. The mean recurrent time based on all superoutbursts is days. This recurrent time was used to compute the cycle numbers and to construct the diagram for the superoutburst occurrence presented in Fig. 4. The diagram shows that the recurrent time changed after the cycle 19. We estimate that superoutbursts occurred with a recurrent time of days between epochs of HJD 2456150 – 2458713. The occurrence times of cycles 21 and 22 imply a recurrent time days, but no superoutbursts were observed after cycle 22 to support this value. Two events were observed at HJD 2459127101010observed in the ASAS-SN project and HJD 2459255111111based on an alert available at http://ooruri.kusastro.kyoto-u.ac.jp/mailarchive/vsnet-alert/25366. The epochs of these events correspond to a recurrent time of 108 days after cycle 22. Nevertheless, although the amplitudes of brightness increase were comparable to a superoutburst, their durations were the same as of a normal outburst.
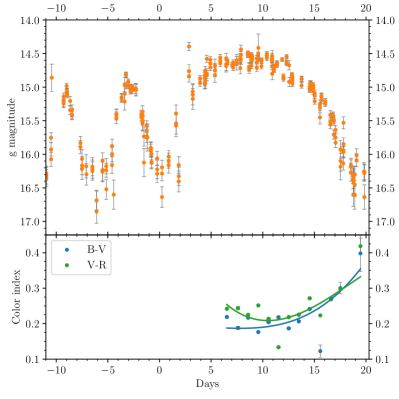
In Fig. 5 we plot the fragment of the light curve centred on a superoutburst together with two preceding normal outbursts. The light curve was formed by a combination of data of all superoutbursts observed by the ASAS-SN project in g band. The data were shifted arbitrarily so that the shapes of the superoutbursts are outlined. We note that the amplitudes (, ) and the periods (, ) of outbursts and superoutbursts of CzeV404 Her follow the corresponding linear relations versus derived by Otulakowska-Hypka et al. (2016) for SU UMa-type stars.
5 Orbital period light curves of CzeV404 Her
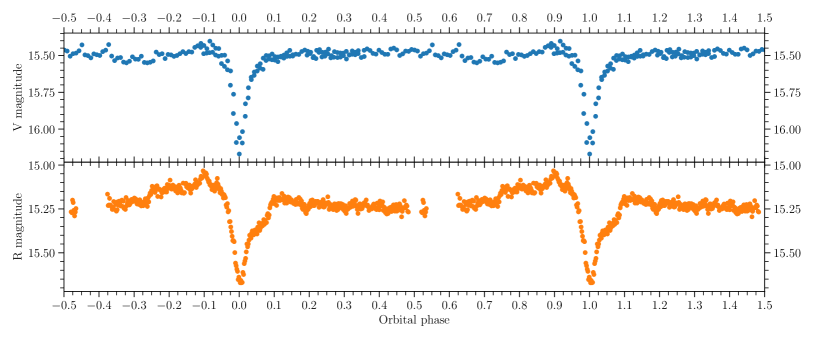
In Fig. 6 we display typical light curves of the object folded on the orbital period. The magnitudes out of eclipses were (2019, April 9) and (2019, March 15). They correspond to intermediate states of the system (Fig. 5). There is flickering in the light curve. The increase in the brightness of the object before eclipses is related to the hot spot at the edge of the accretion disk. The eclipse depth was about and . We note that the shape and depth of the eclipses depend on the system brightness (Fig. 7).
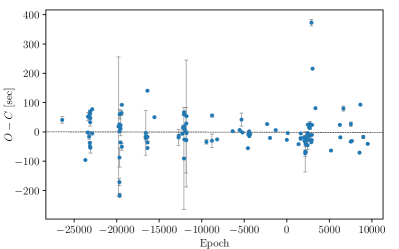
To search for orbital period variations, we measured moments of the minima of eclipses using the lcurve software (Copperwheat et al. 2010). The results are listed in Table 4 and were used to update the system ephemeris,
Pri. Min. = BJD 24 5842321151(8) + 0098021247(6) .
No significant variations in the orbital period are noted (Fig. 8). The standard deviation of the moments of eclipse minima is = 52 s.
| Fixed parameters: | |||
|---|---|---|---|
| 8469.04 s | |||
| 0.16(3) | |||
| Distance | 340(6) pc | ||
| Variable and their best values: | |||
| 788(4) | |||
| 1.00(2) M☉ | |||
| 17000(5000) K | |||
| 2.03(3)M☉ year-1 | |||
| K | |||
| Parameters∗ of the disk: | |||
| 0.008 R☉ | |||
| 0.47(2) R☉ | |||
| 0.024(5) R☉ | |||
| The hot spot/line: | Q | S | |
| length spot () | 1110(5) | 280(5) | |
| width spot (%) | 5.0(2.5) | 0.0(1) | |
| Temp. excess spot () | 2.9 | 8.5 | |
| Shift spot () | -219 | -100(4) | |
| Shift () | -125(2) | -23(1.0) | |
| Calculated: | |||
| 0.94 R☉ | |||
| 0.159 | |||
| 0.158 M☉ | |||
| 0.221 R☉ | |||
| 0.008 R☉ | |||
6 Eclipse light-curve modelling
We used the collected photometric observations to analyse the eclipse light curves using a tool developed by Zharikov et al. (2013) to define the system parameters. Briefly, the model includes a primary white dwarf, a secondary red dwarf star, a stream of accretion matter, an accretion disk with thickness , and the standard effective temperature gradient
| (1) |
(see Warner 1995a) between the inner and outer edges () of the disk, and a hot spot or line. The white dwarf is a sphere, defined by the mass-radius relation in Warner (1995b, 2.83b). The secondary is assumed to fill its Roche lobe, and the Roche-lobe shape is directly calculated using Equation 2.2 Warner (1995b) for equipotential (L1). The surface of each component of the system is divided into a series of triangles. We assume that each triangle emits as a black body with the corresponding effective temperature. The limb-darkening (Claret et al. 2012) and the illumination of the secondary by the primary are also included. The intensity of each element is convolved with the corresponding filter bandpass and converted into the flux taking into account the element surface, the orientation to the line of view of an observer, the distance to the system, and the interstellar absorption. The light curves of individual components and the binary system as a whole were obtained by integrating the emission from all elements lying in view of an observer.
Free parameters of the fit are the mass of the primary (), the mass ratio (), the mass transfer rate (), the system inclination (), the outer radius of the accretion disk (), the disk thickness at the outer radius (), the effective temperature of the secondary (), and the parameters of the hot spot or line. Because the hot spot is a dominating source in the continuum (also in the Balmer emission lines, see Section 7 below) around the eclipse, we used a complex model for the spot, as presented in Fig. 9. The impact of the stream with the outer edge of the disk forms a shock-heated trailing arc along the rim. The vertical size and the temperature of the arc-like hot spot are not uniform; it is wider and hotter at the impact point (), quickly increases before the impact point, and slowly declines after one in the temperature and the vertical extension, according to an arbitrarily selected manner described by the following equations:
| (2) |
where is the angle between the line connecting the stars in conjunction and the direction of the spot viewed from the centre of mass; is a linear function with constants and defined by boundary conditions of , and , and are free parameters. The index corresponds to parts of the hot spot before and after the impact point.
The eclipses of CzeV404 Her presented in Fig. 7, left, were used to fit the system parameters beginning with the light curve obtained in quiescence (2018, November 11). Only the phase region [-0.09, 0.09] was used for the fitting where only weak effects of the flickering related to an inner variability of the disk or/and the spot are expected. We searched for the minimum of the function with the gradient-descent method. It is defined as
| (3) |
where is the number of observed points in each fitted light curve. The values of the best-fit model are presented in Table 5. The error of each fitted parameter was calculated with the Gaussian approximation of the function when other parameters were fixed at the best values. The result of the fit and the observed minus calculated residuals are shown in Fig. 10, top left panel, and the corresponding geometry and temperature distribution of the system components are given in Fig. 10, bottom left panel.
Using the same values for the most of the parameters, we calculated (Fig. 10, top right) the model eclipse light curve (filled orange circles) of CzeV404 Her for the superoutburst on 2019, August 16 (blue circles). The observed eclipse light curve was reproduced by an increase in mass transfer rate up to year-1 together with changes in the spot parameters and configuration (see the Table 5), and the disk slope = 0.078 in the relation. The main difference between the model of the quiescence and the superoutburst eclipse light curves is a substantial change in the mass transfer rate (of about two orders). The disk in a superoutburst is significantly hotter and practically flat, with a constant size along the z-axis independent of its radial size. This means that the disk thickness becomes wider in the inner part during a superoutburst. The impact region has a higher temperature, but the total contrast of the spot within the disk becomes low, and it appears to have a notably smaller geometrical size in the model. The stream between the secondary and the disk is optically thick and affects the eclipse light curve because it absorbs part of the radiation from the hot spot. An additional element is needed in the model (see Fig. 10, bottom right) to absorb part of the radiation of the hot spot. We show non-absorbing (open circles) and self-absorbing (filled orange circles) models of light curves of the system for comparison in Fig. 10, top right. We interpret this additional element as matter that bounces off the disk during impact of the stream. Having a temperature slightly lower than that of the edge of the disk, it covers part of the hottest spot region for an observer at eclipse ingress. This results in the lower brightness of the spot compared to what is expected when the observed flux from the spot is extrapolated after the eclipse to the orbital phases preceding it. The outer radius of the accretion disk does not change much between quiescence and outbursts. Other very important results of eclipse light-curve modelling are a relatively high mass of the white dwarf, M☉ , and that the secondary with a temperature K is hotter than expected for a main-sequence star with a mass of 0.16 M☉. The last two factors are probably responsible for the fact that this object is observed inside the period gap. Clearly, the parameters of the spot are only effective parameters of the model. They show how the observed behaviour of the object can be described within the model framework. The exact description of the impact area and its observational manifestations are more complex. Describing them requires a complete non-conservative magnetohydrodynamic modelling of the disk and the disk-stream impact region.
7 Doppler tomography
We used the Doppler tomography technique (Marsh & Horne 1988) to probe the accretion flow structure in CzeV404 Her. This technique is a well-known method to map the emission of gas moving in the velocity plane. It was applied to map the H and He I emission lines. We generated Doppler maps from our time-resolved spectra of the object using the maximum entropy method Spruit (1998) as implemented by Kotze et al. (2016). We combined the data from nights N1–N3 (2019, April) and N4+N5 (2019, July; see Table 2). The first set was obtained during a decline of a normal outburst, while the second one was observed close to the quiescence level. The resulting trailed spectra and Doppler maps are shown in Fig. 11. The orbital phase zero was well defined from the simultaneous photometry obtained in the same nights as the spectroscopy. The possible displacement between orbital phase zero when the secondary stays strictly between the primary and an observer and a minimum of an eclipse does not exceed 0.005 orbital phase, as follows from our light-curve modelling estimate.
The trailed spectra of the Hα line in 2019 April clearly show a low-velocity S-wave with an amplitude of about 200 km s-1. The S-wave varies in intensity with orbital phase. It is brighter at 0.0 – 0.5 orbital phases and diminishes significantly at phases of 0.5 – 1.0. There is a dip in intensity at the phase about 0.25. The system parameters from Section 6 were used to draw the primary and secondary Roche lobes, the ballistic and Keplerian stream trajectories, and the centre of mass of the system in the Doppler maps. The outermost radius of the disk is marked by the solid line circle at km s-1 in Fig. 11 and corresponds to the Keplerian velocity at the tidal limitation radius of the disk.
The maps look unusual for an SU UMa-type system131313see, for examples, the Doppler maps of SU UMa-type systems in Rodríguez-Gil et al. (2005); Mennickent et al. (2006); Longa-Peña et al. (2015); Littlefield et al. (2018) presenting a bright spot at the low velocity of km s-1, km s-1 in the standard, and the km s-1, in the inside-out projections. The disk-stream impact hot spot is in SU UMa-type systems typically located inside the disk at or between the continuation of ballistic or Keplerian trajectories. However, in the case of Czev404 Her, the velocity of the spot does not correspond to the expected position. It is below the lowest Keplerian velocity in the accretion disk.
The disk is poorly expressed in the standard projection compared to the inside-out view (the spot in the centre of the maps is an artefact of the inside-out projection). A similar picture is observed in He I trailed spectra and Doppler maps where the spot and disk are less pronounced. The brightness variation of the S-wave in He I is also different from that in Hα. The S-wave varies with the same phases, but has two dips in the intensity at orbital phases close to 0.25 and 0.8. In data from July 2019, when the object brightness was about one magnitude lower than in April 2019, we obtained a similar Hα map, but at lower intensity levels for its details. From this fact, we conclude that only the brightness of the accretion disk changed, but the accretion flow structure remained the same.
In Fig. 12 we plot the result of transforming the Doppler map calculated from April 2019 data into the system of spatial coordinates using the assumption of the Keplerian velocity distribution of the emitting particles. The colour bars marked by the letters ”I” and ”T” correspond to the intensity of the Doppler map similar to Fig. 11 and the effective temperature of the system components (from 3000 K to 10000 K), respectively. The peak of the intensity (black region) is located out of the accretion disk, as also follows from the Doppler map. This fact can be interpreted to mean that the hot-spot region deviates strongly from Keplerian velocity. Nevertheless, the part of the disk related to the tail of the impact region between the stream and the outer edge of the disk has a significantly higher intensity than the rest of the disk. This extended hot spot or line was proposed by different authors (Dhillon et al. 2013; Tovmassian et al. 2014) to explain the origin of SW Sex-type systems.
| Parameter | EF Peg | YZ Cnc | V344 Lyr | GZ Cnc | UV Gem | V725 Aql | NY Ser | CzeV404 Her | TU Men |
|---|---|---|---|---|---|---|---|---|---|
| [d] | 0.0837 | 0.0868 | 0.087904 | 0.0881 | 0.0895 | 0.0939 | 0.0978 | 0.0980 | 0.1172 |
| Distance [pc] | 255(26) | 240(3) | 1064(86) | 181(11) | 667(79) | 746(285) | 773(31) | 340(6) | 278(5) |
| [d] | 0.087 | 0.0903 | 0.0918 | 0.0928 | - | 0.0985 | 0.106 | 0.10472 | 0.126 |
| [mag] | 18.50 | 14.8 | 19.5 | 16 | 18.50 | 19.0 | 18.5 | 17.5 | 18.50 |
| [mag] | - | 11.9 | 14.50 | 13.8 | 15.50 | - | 15.0 | 15.0 | 12.50 |
| [mag] | 10.70 | 11.2 | 14.00 | 12.8 | 14.70 | 13.6 | 14.7 | 14.5 | 11.60 |
| [d] | - | 7 | 10 | 10 | 54 | - | 6 | 7 | 37 |
| [d] | - | 125 | 260 | 260 | 180 | 500 | 85 | 140 | 150 |
| [d] | - | 4 | 6 | 6 | - | - | 4 | 5 | 6 |
| [d] | - | 20 | 17 | 17 | - | - | 21 | 20 | - |
| [d] | - | 4 | 2 | 2 | - | 1 | 3 | 5 | - |
| [d] | - | 13 | 8 | 8 | - | 11 | 11 | 10 | - |
| [d] | - | 3 | 7 | 7 | - | - | 7 | 5 | - |
8 Discussion
About 120 objects lie inside of the period gap (2.15 – 3.18 h) and are proposed to be CVs following the last version 7.24 (2017, February) of the Ritter & Kolb (2003) catalogue. About 35% of these CVs are polars and intermediate polars. Another 41% objects are marked as DNe, 4 of them at the upper period-gap limit are classified as U Gem-type systems, and the rest are SU UMa-type objects. Five objects in the period range of 2.44 – 3.05 h also show SW Sex characteristics. Four objects in the list are eclipsing systems. One is the subject of this study, another is the recently discovered poorly studied DNe-type object 1RXS J003828.7+250920 (Pavlenko et al. 2016). The 1RXS J003828.7+250920 shows outburst and superoutburst behaviour. The average light-curve profile of the object resembles the typical light curve of U Gem and indicates multi-component emission by sources that appear to be the hot and cold parts of the accretion disk and a hot spot on the disk. Unfortunately, no spectroscopy is available for this object.
Another two eclipsing objects are nova-likes systems. The first is V348 Pup, which was interpreted as an SW Sex system (Rodríguez-Gil et al. 2001; Froning et al. 2003) and is discussed below. The second is V Per (Nova Persei 1887), a classical nova system (Shafter & Abbott 1989). The light curves of CzeV404 Her, V348 Pup, and V Per are very similar, and their spectra show single-peaked Balmer and He emission lines. V Per is a faint ( mag) object with a larger accretion disk that shows a flat temperature distribution along its radius (Shafter & Misselt 2006). No outburst activity is detected. Only limited spectroscopy has been presented so far (Haefner & Fiedler 2007), and a possible SW Sex nature of the object has been indicated. Most of the other DNe-type objects in the period gap that have been proposed as SU UMa systems are based on detected superoutbursts and/or superhumps, but they have not been studied in quiescence and only very poorly in outbursts. Their system parameters are unknown, and long-term photometric or spectroscopic monitoring is missing. Nevertheless, several period-gap DNe show outburst activity similar to CzeV404 Her.
The outburst characteristics of these objects are presented in Table 6, where and are orbital and superhump periods, respectively. The next three rows give the average magnitudes of the systems in quiescence and at the maximum brightness of a normal, , and a superoutburst, . The marks and denote the duration of normal and superoutbursts, respectively. The last is defined as as well, where , , and are the duration of the rise, the plateau phase, and the decline of an outburst. The recurrent time of normal and superoutbursts are labelled and . All these values are given in units of days. Table 6 shows that the outbursts and superoutbursts of CzeV404 Her have small amplitudes and a short recurrent time compared to other SU UMa-type CVs placed in the period gap.
The spectra of SU UMa systems in the period gap show some diversity. For example, YZ Cnc, GZ Cnc, and EF Peg display one-peak relatively strong Balmer and He I emission lines accompanied by faint He II 4686Å and Fe II 5169Å lines (Shafter & Hessman 1988; Howell & Liebert 1994; Howell et al. 2002; Sheets et al. 2007) over a blue continuum. On the other hand, NY Ser only shows low-intensity Hα emission at a blue continuum and probably faint high-order Balmer absorptions with indications of emission in its central part (Munari & Zwitter 1998). However, no time-resolved spectroscopy and Doppler tomography is available for these objects. As a result, the structure of the accretion flows in these systems is unknown. Nevertheless, there is one well-studied eclipsing system, V348 Pup, with an orbital period of 0.1018 days that is close to CzeV404 Her. The object was interpreted as an SW Sex system in the period gap, as we mentioned above. The spectrum of V348 Pup (Rodríguez-Gil et al. 2001) shows single-peak Balmer and He II emission lines. The He I emission lines look like double-peak lines in some orbital phases. The intense He II lines are evidence of a high-temperature region in the accretion disk. The trailed spectra of Hα emission and the Doppler map (Rodríguez-Gil et al. 2001, see their fig. 6) demonstrate a similar configuration as observed in CzeV404 Her (Fig. 11). It is interesting that the radial velocity amplitudes of the emission lines in CzeV404 Her and V348 Pup are also very close to each other (200–300 km s-1).
The distance to CzeV404 Her is about 2.4 times smaller than the distance to V348 Pup (813(20) pc). However, V348 Pup has out of eclipse and does not show outburst activity, in contrast to CzeV404 Her, which varies between 145 in a superoutburst to 175 in quiescence. The V-shaped eclipse of V348 Pup (Rodríguez-Gil et al. 2001; Dai et al. 2010) is similar to that of CzeV404 Her in a superoutburst. The eclipse mapping of the accretion disk reveals two asymmetric structures in the accretion disk (Saito & Baptista 2016). One of them looks like a tail of the disk-stream impact region and has an azimuthal extension of about 90 deg. The other structure is more probably related to the inner part of the disk. The position of the bright region in the disk of CzeV404 Her (marked in red and blue in Fig. 12) matches the first structure in the accretion disk of V348 Pup (Saito & Baptista 2016, see their fig. 7). Moreover, the Doppler maps of CzeV404 Her are very similar to those observed in other SW Sex-type systems (Kaitchuck et al. 1994; Hellier & Robinson 1994; Dhillon et al. 1997; Hoard et al. 1998; Dhillon et al. 2013; Schmidtobreick 2015). As we noted before, the accretion disk of CzeV404 Her in superoutburst is hot and flat, similar to what was reported in V Per. Following our light-curve modelling, Doppler mapping, and the observed outburst behaviours, we therefore propose that Czev404 Her is an example of a CV that simultaneously shows the characteristics of SU UMa-type and SW Sex-type objects.
9 Conclusions
We performed time-resolved photometric and spectroscopic observations of the CV CzeV404 Her that is located in the period gap. We found that the object shows outburst activity of SU UMa-type systems. The time between normal outbursts is about 7 days, and superoutbursts occur with an interval of about 140 days. These two timescales are relatively short compared to similar period-gap CVs. The orbital period has not varied during ten years of monitoring. Using the light curves of eclipses in quiescence and superoutbursts, we determined the fundamental parameters of the system. The object contains the massive white dwarf primary, M☉, and a hot secondary with an effective temperature of K. Another example of a hot secondary in period-gap CVs is SDSS J0011-0647. Rebassa-Mansergas et al. (2014) proposed that these hot secondaries are formed by evolved stars that are not expected to become fully convective (Baraffe & Kolb 2000), and they therefore should not lock magnetic braking like the donor stars in canonical CVs. For this reason, they might be visible in the period gap. The derived value of the mass ratio is . This is lower than the value estimated from the superhump period applying different relationships. However, we note that a similar discrepancy is also observed in some other eclipsing systems (Kato & Osaki 2013). The system inclination is .
Although Czev404 Her shows outburst activity characteristic of SU UMa-type systems, the structure of its accretion disk is similar to that observed in SW Sex-type systems: The optically thick accretion disk spreads out to the tidal limitation radius and has a larger hot spot that extends along the outer rim of the disk. The spot or line is hotter than the rest of the outer part of the disk in quiescence and in the intermediate state, and it does not stand out from the disk flux in (super)outbursts. The eclipsing light curve, the trailed spectra of Balmer and He I emission lines, and the Doppler maps of the object are similar to those observed in V348 Pup, another eclipsing CV located in the period gap at a similar orbital period that is classified as an SW Sex-type system. Based on our analyses, we therefore claim that Czev404 Her represents a link between two distinct classes of CVs: SU UMa- and SW Sex-type CVs. The accretion disk structure is similar to that of SW Sex systems. The physical conditions inside the disk begin to manifest the behaviour of SU UMa-type objects, however.
It is generally accepted that the period-gap phenomenon in the CV period distribution is caused by a reduction in the angular momentum loss rate and a temporary switch-of off the mass transfer rate. CVs transform into detached systems with a white dwarf plus a main-sequence star that do not exhibit mass transfer activity. However, as we noted above, the number of CVs in the period gap has increased in the past decades, and detailed studies of these objects are essential to understand the physical mechanism of the mass transfer lock.
Acknowledgements.
The authors acknowledge allotment of observing time at San Pedro Mártir observatory, UNAM, Baja California, Mexico. S.Z. acknowledges PAPIIT grants IN102120. M.W. was supported by the Czech Science Foundation grant GA19-01995S. The research of J.K. and M.W. was supported partially by the project Progress Q47 Physics of the Charles University in Prague. This work is supported by MEYS (Czech Republic) under the projects MEYS LM2018505, LTT17006 and EU/MEYS CZ.02.1.01/0.0/0.0/16_013/0001403 and CZ.02.1.01/0.0/0.0/18_046/0016007. The following internet-based resources were used in research for this paper: the SIMBAD database and the VizieR service operated at CDS, Strasbourg, France; the NASA’s Astrophysics Data System Bibliographic Services. This research is part of an ongoing collaboration between professional astronomers and the Czech Astronomical Society, Variable Star and Exoplanet Section.References
- Baraffe & Kolb (2000) Baraffe, I. & Kolb, U. 2000, MNRAS, 318, 354
- Bernardini et al. (2019) Bernardini, F., de Martino, D., Mukai, K., Falanga, M., & Masetti, N. 2019, MNRAS, 489, 1044
- B\kakowska et al. (2014) B\kakowska, K., Olech, A., Pospieszyński, R., Martinelli, F., & Marciniak, A. 2014, Acta Astron., 64, 337
- Cagas & Cagas (2014) Cagas, P. & Cagas, P. 2014, Information Bulletin on Variable Stars, 6097, 1
- Chambers et al. (2016) Chambers, K. C., Magnier, E. A., Metcalfe, N., et al. 2016, arXiv e-prints [arXiv:1612.05560]
- Claret et al. (2012) Claret, A., Hauschildt, P. H., & Witte, S. 2012, A&A, 546, A14
- Copperwheat et al. (2010) Copperwheat, C. M., Marsh, T. R., Dhillon, V. S., et al. 2010, MNRAS, 402, 1824
- Dai & Qian (2012) Dai, Z. B. & Qian, S. B. 2012, Mem. Soc. Astron. Italiana, 83, 614
- Dai et al. (2010) Dai, Z. B., Qian, S. B., Fernández Lajús, E., & Baume, G. L. 2010, MNRAS, 409, 1195
- Dhillon et al. (1997) Dhillon, V. S., Marsh, T. R., & Jones, D. H. P. 1997, MNRAS, 291, 694
- Dhillon et al. (2013) Dhillon, V. S., Smith, D. A., & Marsh, T. R. 2013, MNRAS, 428, 3559
- Ebr et al. (2019) Ebr, J., Mandát, D., Pech, M., et al. 2019, arXiv e-prints [arXiv:1909.08085]
- Froning et al. (2003) Froning, C. S., Long, K. S., & Baptista, R. 2003, AJ, 126, 964
- Gaia Collaboration (2018) Gaia Collaboration. 2018, VizieR Online Data Catalog, I/345
- Garraffo et al. (2018) Garraffo, C., Drake, J. J., Alvarado-Gomez, J. D., Moschou, S. P., & Cohen, O. 2018, ApJ, 868, 60
- Green et al. (2015) Green, G. M., Schlafly, E. F., Finkbeiner, D. P., et al. 2015, ApJ, 810, 25
- Haefner & Fiedler (2007) Haefner, R. & Fiedler, A. 2007, Information Bulletin on Variable Stars, 5751, 1
- Hardy et al. (2017) Hardy, L. K., McAllister, M. J., Dhillon, V. S., et al. 2017, MNRAS, 465, 4968
- Hellier & Robinson (1994) Hellier, C. & Robinson, E. L. 1994, ApJ, 431, L107
- Hoard et al. (1998) Hoard, D. W., Szkody, P., Still, M. D., Smith, R. C., & Buckley, D. A. H. 1998, MNRAS, 294, 689
- Howell et al. (2002) Howell, S. B., Gänsicke, B. T., Szkody, P., & Sion, E. M. 2002, ApJ, 575, 419
- Howell & Liebert (1994) Howell, S. B. & Liebert, J. 1994, Information Bulletin on Variable Stars, 4073, 1
- Jayasinghe et al. (2019) Jayasinghe, T., Stanek, K. Z., Kochanek, C. S., et al. 2019, MNRAS, 485, 961
- Kaitchuck et al. (1994) Kaitchuck, R. H., Schlegel, E. M., Honeycutt, R. K., et al. 1994, ApJS, 93, 519
- Kato & Osaki (2013) Kato, T. & Osaki, Y. 2013, PASJ, 65, 115
- Katysheva & Pavlenko (2003) Katysheva, N. A. & Pavlenko, E. P. 2003, Astrophysics, 46, 114
- Knigge et al. (2011) Knigge, C., Baraffe, I., & Patterson, J. 2011, ApJS, 194, 28
- Kochanek et al. (2017) Kochanek, C. S., Shappee, B. J., Stanek, K. Z., et al. 2017, PASP, 129, 104502
- Kostov & Bonev (2018) Kostov, A. & Bonev, T. 2018, Bulgarian Astronomical Journal, 28, 3
- Kotze et al. (2016) Kotze, E. J., Potter, S. B., & McBride, V. A. 2016, VizieR Online Data Catalog, J/A+A/595/A47
- Littlefield et al. (2018) Littlefield, C., Garnavich, P., Kennedy, M., Szkody, P., & Dai, Z. 2018, AJ, 155, 232
- Longa-Peña et al. (2015) Longa-Peña, P., Steeghs, D., & Marsh, T. 2015, MNRAS, 447, 149
- Luri et al. (2018) Luri, X., Brown, A. G. A., Sarro, L. M., et al. 2018, A&A, 616, A9
- Marsh & Horne (1988) Marsh, T. R. & Horne, K. 1988, MNRAS, 235, 269
- Mason et al. (2019) Mason, P. A., Wells, N. K., Motsoaledi, M., Szkody, P., & Gonzalez, E. 2019, MNRAS, 488, 2881
- Mennickent et al. (2006) Mennickent, R. E., Unda-Sanzana, E., & Tappert, C. 2006, A&A, 451, 613
- Munari & Zwitter (1998) Munari, U. & Zwitter, T. 1998, A&AS, 128, 277
- Otulakowska-Hypka et al. (2016) Otulakowska-Hypka, M., Olech, A., & Patterson, J. 2016, MNRAS, 460, 2526
- Patterson (1998) Patterson, J. 1998, PASP, 110, 1132
- Patterson et al. (2005) Patterson, J., Kemp, J., Harvey, D. A., et al. 2005, PASP, 117, 1204
- Pavlenko et al. (2016) Pavlenko, E. P., Sosnovskij, A. A., Katysheva, N. A., Kato, T., & Littlefield, K. 2016, Astrophysics, 59, 304
- Rebassa-Mansergas et al. (2014) Rebassa-Mansergas, A., Parsons, S. G., Copperwheat, C. M., et al. 2014, ApJ, 790, 28
- Ritter & Kolb (2003) Ritter, H. & Kolb, U. 2003, A&A, 404, 301
- Rodríguez-Gil et al. (2005) Rodríguez-Gil, P., Gänsicke, B. T., Hagen, H. J., et al. 2005, A&A, 431, 269
- Rodríguez-Gil et al. (2001) Rodríguez-Gil, P., Martínez-Pais, I. G., Casares, J., Villada, M., & van Zyl, L. 2001, MNRAS, 328, 903
- Saito & Baptista (2016) Saito, R. K. & Baptista, R. 2016, MNRAS, 457, 198
- Schmidtobreick (2015) Schmidtobreick, L. 2015, in The Golden Age of Cataclysmic Variables and Related Objects - III (Golden2015), 34
- Shafter & Abbott (1989) Shafter, A. W. & Abbott, T. M. C. 1989, ApJ, 339, L75
- Shafter & Hessman (1988) Shafter, A. W. & Hessman, F. V. 1988, AJ, 95, 178
- Shafter & Misselt (2006) Shafter, A. W. & Misselt, K. A. 2006, ApJ, 644, 1104
- Shappee et al. (2014) Shappee, B. J., Prieto, J. L., Grupe, D., et al. 2014, ApJ, 788, 48
- Sheets et al. (2007) Sheets, H. A., Thorstensen, J. R., Peters, C. J., Kapusta, A. B., & Taylor, C. J. 2007, PASP, 119, 494
- Silva et al. (2015) Silva, K. M. G., Rodrigues, C. V., Oliveira, A. S., et al. 2015, MNRAS, 451, 4183
- Spruit (1998) Spruit, H. C. 1998, arXiv e-prints [arXiv:astro-ph/9806141]
- Tovmassian et al. (2014) Tovmassian, G., Stephania Hernandez, M., González-Buitrago, D., Zharikov, S., & García-Díaz, M. T. 2014, AJ, 147, 68
- Warner (1995a) Warner, B. 1995a, Cambridge Astrophysics Series, 28
- Warner (1995b) Warner, B. 1995b, Ap&SS, 226, 187
- Zharikov et al. (2013) Zharikov, S., Tovmassian, G., Aviles, A., et al. 2013, A&A, 549, A77
- Zorotovic et al. (2016) Zorotovic, M., Schreiber, M. R., Parsons, S. G., et al. 2016, MNRAS, 457, 3867