Co-existence of short- and long-range magnetic order in LaCo2P2
Abstract
The ferromagnetic (FM) nature of the metallic LaCo2P2 was investigated with the positive muon spin rotation, relaxation and resonance (SR) technique. Transverse and zero field SR measurements revealed that the compound enters a long range FM ground state at K, consistent with previous studies. Based on the reported FM structure, the internal magnetic field was computed at the muon sites, which were predicted with first principles calculations. The computed result agree well with the experimental data. Moreover, although LaCo2P2 is a paramagnet at higher temperatures K, it enters a short range ordered (SRO) magnetic phase for K. Measurements below the vicinity of revealed that the SRO phase co-exists with the long range FM order at temperatures . Such co-existence is an intrinsic property and stems from competition between the 2D and 3D interactions/fluctuations.
I Introduction
The interplay between magnetism and superconductivity is a long-term popular problem, particularly since the discovery of high- cuprates, because the ground states are usually considered incompatible with each other Bardeen et al. (1957). While the coexistence of both phases have been reported Lange et al. (2003); Marsik et al. (2010), a competition between the two phases is more common and has been observed in many systems such as rare earth () Ni2B2C Eisaki et al. (1994), K doped Ba1-xKxFe2As2 Rotter et al. (2009) or BaFe1.89Co0.11As2 Marsik et al. (2010). The latter two compounds in particular crystallize in a ThCr2Si2-type structure, for which the general structure is described by with a metal , transition metal and metalloid atoms. In these systems, the interactions are presumably dominated by low dimensional fluctuations within the edge-sharing tetrahedra layers. The interlayer interaction across the layer is heavily dependent on the bonding distance, which naturally changes depending on the specific elements that occupy each site of . As a result, many ground states, such as, paramagnetism (PM), ferromagnetism (FM), antiferromagnetism (AF), short range order and superconductivity have been reported for Reehuis and Jeitschko (1990); Baumbach et al. (2014); Thompson et al. (2014); Sugiyama et al. (2015a), since this family can accommodate many elements and combinations. The flexibility in the combination of constituent elements results in ground states that greatly varies with chemical doping Thompson et al. (2014); Sugiyama et al. (2015a); Tan et al. (2016) and by application of hydrostatic pressure Baumbach et al. (2014).
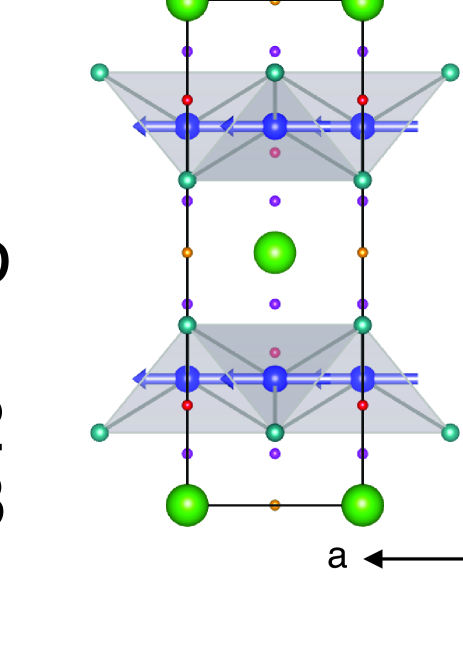
It has been observed in several P2 ( = Ca, Sr, and Ba, and T = Fe, Co, and Ni) compounds that the magnetic phase transitions are related to subtle structural changes in the crystals Hoffmann and Zheng (1985); Reehuis and Jeitschko (1990); Jia et al. (2009). These compounds have shown to transform from an uncollapsed tetragonal (ucT) phase to a collapsed tetragonal (cT) phase as a function of chemical doping Reehuis and Jeitschko (1990); Jia et al. (2009); Sugiyama et al. (2015a), which naturally affects the ground state. While the majority of the P2 compounds exhibit AF or PM ground states, LaCo2P2 is an itinerant FM with K. Early magnetization measurements showed a Curie-Weiss behavior at higher temperatures above Mörsen et al. (1988); Reehuis and Jeitschko (1990). Neutron diffraction measurements on a polycrystalline sample revealed a collinear FM structure along the -axis with an ordered moment of (Fig. 1) Reehuis et al. (1994). Indeed, a recent magnetization measurements, performed on a single crystal at low temperature, suggests a highly anisotropic FM ground state Imai et al. (2015). Meanwhile, the spin-lattice relaxation rate reported in a 31P-NMR study Imai et al. (2015) indicated a 3D character of the spin fluctuations above .
Since LaCo2P2 exhibits a 3D character above , but a highly anisotropic character below , it is of high interest to study the crossover between these two regimes across . Therefore, we have initiated a detailed of LaCo2P2 using muon spin rotation, relaxation and resonance (SR), taking advantage of the fact that SR can offer information about the internal magnetic field distributions of both static and dynamic characters Hayano et al. (1979); Forslund et al. (2019); Sugiyama et al. (2021). In this study, a cascade of magnetic transitions is observed using SR. In particular, both short and long range magnetic ordered phases are likely to coexist in LaCo2P2 in the vicinity of . Such behavior is attributed to an intrinsic property and is most likely originating from the competing interactions of different dimensionality.
II Experimental Setup
Polycrystalline LaCo2P2 was prepared from pure La, and Co and P starting materials. LaP and Co2P were first synthesized by a solid state reaction between La/Co and P in evacuated quartz tubes at 800∘C/700∘C. LaCo2P2 could then be synthesized from a solid state reaction between LaP and Co2P, kept at 1000∘C for 20 hours in an Ar atmosphere. Details about the sample synthesis can be found elsewhere Sugiyama et al. (2015b); Imai et al. (2014).
The SR measurements were performed at the Dolly instrument at the SS muon source at Paul Scherrer Institute, Switzerland. A top loaded 4He cryostat was used in order to reach temperatures down to K. About 500 mg of powder sample was inserted into an Al-coated Mylar tape envelope. The envelope was attached to a low-background fork type sample holder made of Cu. The SR data was analyzed using MUSRFIT A. Suter and B. M. Wojek (2012).
The muon sites and the local spin density at the muon sites in LaCo2P2 were predicted by density functional theory (DFT) calculations using a full-potential linearlized augmented plane-wave method within generalized gradient approximation as implemented in WIEN2k program package Blaha et al. (2020). In the calculations, the lattice parameters and atomic positions of LaCo2P2 were taken from Ref. Reehuis and Jeitschko, 1990. The magnetic moments were aligned parallel to the [100] direction through spin-orbit coupling. The muffin tin potential radii () for La, Co, and P were taken to be 2.50, 2.36, and 1.84 Å, respectively. The energy cutoff was chosen to be (, and 20 20 20 -points meshes were used in the Brillouin zone. Here, is the maximum modulus for the reciprocal vectors.
III Results
The presentation of the SR results of LaCo2P2 is divided into sections based on the type of field configuration chosen for the SR experiments: transverse field (TF) or zero field (ZF). Transverse refers to the applied field direction with respect to the initial muon spin polarization. Additionally, the ZF time spectra collected at base temperature is reproduced based on the published magnetic structure and muon site determined from DFT calculations.
III.1 Transverse field
Figure 2 shows the collected TF ( Oe) spectra of LaCo2P2 for selected temperatures. At high temperatures, a distinct oscillation is observed with a frequency of about 0.7 MHz, corresponding to the applied field TF. As the temperature is lowered, the amplitude of the 0.7 MHz oscillation, the asymmetry due to the applied TF, decreases. Although, the amplitude is not completely diminished at lower temperature. Moreover, a faster oscillation can be observed in the time spectra at lower temperatures, accompanied by a positive offset. Therefore, the TF spectra were fitted using a combination of three exponentially relaxing cosine oscillations together with an non-oscillating exponential relaxation:
| (1) | |||||
| (2) | |||||
| (3) | |||||
| (4) |
where is the initial asymmetry determined by the the detector geometry of the instrument and is the muon spin polarization function in TF configuration. , , and are the asymmetry, frequency, initial phase and depolarization rate resulting from the applied TF, where the superscripts PM and imp represent the contributions from the paramagnetic (PM) and impurity (imp) phases, respectively. Furthermore, , , , and represent contributions from the internal FM field, together with , . In particular, represents the internal magnetic field contributions that are perpendicular to the initial muon spin polarization, while are contributions from the internal field that are parallel to the initial muon spin polarization.
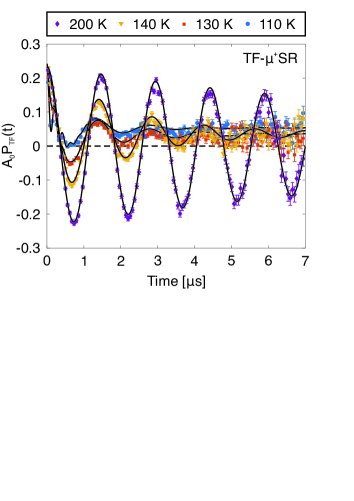
In order to properly separate the PM and the impurity phases under the applied TF, the constraint was set. Since an oscillating fraction of 0.08 was obtained at 110 K well below , the sample is found to contain about 34 PM impurity phase, most likely Co2P. Therefore, was fixed through the whole temperature range since this fraction should be temperature independent. Finally, the total asymmetry was fixed to 0.2351 for the measurements above 125 K, a value obtained from a high temperature measurement.
The obtained fit parameters using Eq. (4) with the procedure as described above are displayed in Fig. 3. Each asymmetry component has a temperature dependence that is expected for a magnetically ordered sample. For K, and exhibits a sharp change at a certain critical temperature. Since /() roughly corresponds to the PM volume fraction, the abrupt change observed at K corresponds to the transition from a magnetically ordered state at low temperatures to magnetically disordered state at high temperatures. An accurate value of the transition temperature is obtained by fitting the curve using a sigmoidal function, for which K is obtained. Similarly, above while poses none zero values even above , which steadily decreases with increasing temperature. Such behavior is naturally expected as these fractions stem from internal magnetic fields as described above. It should be noted that the term is observed well above . The origin of such behavior is underlined in the ZF section presented below.
The temperature dependencies of , and are displayed in Fig. 3(b). shows a steady decrease from lowest measured temperature up to the highest, and shows no anomaly at the magnetic transition. Such behaviour originate most likely from fluctuating Co -moments and static Co and/or P nuclear moments, as also underlined in the ZF section. Such temperature dependence is similar to the one obtained in ZF configuration, underlying the quality of the fits in both field configurations. On the other hand, is none zero only above , as expected. It has a maximum just above and starts to decrease with increasing temperature, reflecting an increase in the internal field dynamics. Such temperature dependence will most likely follow the temperature dependence of magnetic susceptibility of a Curie-Weiss paramagnet. The small value of (below ) at high temperatures suggests that the PM fluctuations eventually become motionally narrowed for the SR time window.
The fact that s-1 across the whole measured temperature range suggests a static behavior of the internal FM field. Both and represent the nature of the internal FM field but is not presented here. Instead, measurements in ZF configuration provide more accurate information regarding the internal fields. Finally, it should be noted that since MHz at 110 K, which is not very different from the TF precession frequency with 50 Oe (about 0.7 MHz), the estimated volume fraction of the nonmagnetic impurity phase includes an ambiguity. A more accurate value of the size of this fraction will be estimated using the ZF-SR data.

III.2 Zero field
ZF-SR time spectra for selected temperatures are shown in Fig. 4. At 200 K, the ZF-spectrum in an early time domain exhibits a convex shape time dependence, which indicates a Gaussian-type relaxation. A notable small dip around s would suggest the presence of two independent Gaussian relaxations, consistent with the presence of an impurity phase. As temperature is lowered, the Gaussian relaxation is gradually changing into a more exponential like form, until an oscillation appears at lower temperatures below . In order to take into account all the phases present over the whole measured temperature range, the time spectra were fitted using a combination of two static Gaussian Kubo-Toyabe (SGKT) functions, two exponential relaxations, and one exponentially relaxing cosine oscillating terms:
| (5) | |||||
| (6) | |||||
| (7) | |||||
| (8) | |||||
| (9) |
is the initial asymmetry determined by the instrument’s detector geometry and is the muon spin polarization function in ZF configuration. The first two terms of Eq. (9), i.e., and , represents the response of the sample at low temperatures, when it enters a magnetically long range ordered state below . The third and forth terms, i.e., and , represents the sample response above or close to . The last term, , corresponds to the impurity phase present in the sample, a constant term throughout the whole temperature range. In detail, , , and are the asymmetry, frequency, phase, and relaxation rate resulting from perpendicular (with respect to the initial muon spin polarisation) internal field components, while and are the asymmetry and relaxation rate of the tail component that inevitably exist in powder measurement of a magnetically ordered sample. This contribution stems from the fact that on average, 1/3 of the internal magnetic fields are parallel with respect to the initial muon spin polarisation for a perfect powder. and are the asymmetry and relaxation rate of a fast component that manifests the ZF-spectra around . and correspond to the asymmetry and relaxation rate related to the static Gaussian KT, represented by where is the internal field distribution width stemming from isotropically distributed magnetic moments. The same description holds also for the subscript signal, but corresponds to the impurity phase instead of the main phase.
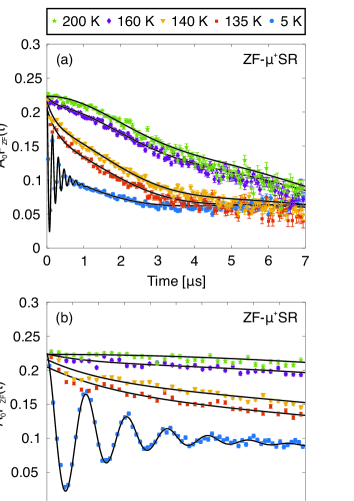
In order to separate the various contributions, some constraints were set for the fits using Eq. (9). In particular, and were fixed across the whole temperature range, as these parameters can be expected to be temperature independent. Such values were estimated at the base temperature given that the magnetic contrast between the main and impurity phase is the biggest. Indeed, the value of suggests the presence of Co and/or P elements in the impurity phase. The value of corresponds to a volume fraction of 22 %, which is lower than fraction estimated from TF configuration, as expected. It is noted that measurements (not shown here) in a longitudinal field configuration i.e. field parallel with the initial muon spin polarization, at 200 K confirm that the internal fields are static, supporting the fit with two static G-KT functions and that the internal fields originate from nuclear magnetic moments: s-1, which corresponds to 1.484237(2) Oe.
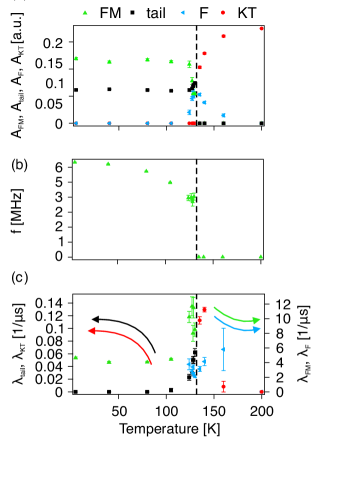
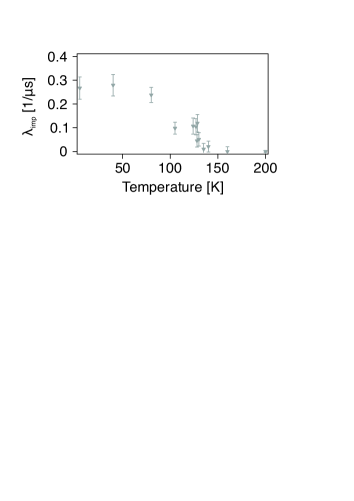
The temperature dependencies of the obtained fit parameters are shown in Fig. 5, using the fit procedure as described above. Below , only two asymmetry components have none zero values (except for the that is not shown). This is consistent with the whole main sample phase entering a long range magnetically ordered state, for which . Just below , a small upturn is observed in while a downturn is seen in . This is natural given that parallel fluctuations usually increases as the static perpendicular component loses its structure close to . Intriguingly, the decrease of is followed by an additional fast relaxing component, . Such component exhibits a maximum just below , for which is still none zero, and slowly decreases with further increasing temperature. Above , defined at the point where MHz and thus , the spectra consist of and components, where only persist above 160 K. It is noted that the fast exponential relaxation component () is present between the temperature range 124 and 160 K, across . This implies that long range and short range order coexist for a narrow temperature range below , which will be further discussed in Sec. IV.
The muon spin precession frequency (), on the other hand, exhibits an order parameter like temperature dependence. The value of the frequency corresponds to the total magnitude of the local field at the muon site. A frequency of 6.33(2) MHz is obtained at the base temperature and corresponds to 0.04670(15) T, which can be considered relatively low. Detailed calculations referencing these values are presented in Sec. III.3.
As for the relaxation rates, both and are temperature independent at low temperatures. Here, corresponds to the spin-lattice relaxation rate. The value of Ks-1 suggests that the magnetic order at low temperatures is static. increases as is approached, indicating that the internal field is dynamic close to . on the other hand corresponds roughly to the spin-spin relaxation rate and its value can be interpreted as the field distribution width at the muon site. Similar to the , an increase of is observed close to . Part of it can be ascribed to increase in dynamics (in principle, is composed of both spin-spin and spin-lattice relaxation rates).
The temperature dependencies of and are consistent with the findings in TF configuration. In Eq. (9), each static Gaussian KT is multiplied by an exponential relaxation function. This is because the internal field at the muon site has two independent contributions (nuclear and electronic) and the time dependence of the muon polarization, , is given by the product of the expected polarization function originating from each contribution. Since the KT is the depolarization due to isotropically distributed nuclear moments, the exponential is accounting additional PM fluctuations present in the compound and it should follow the temperature dependence of . Details of are highlighted in Appendix A. Finally, is the additional fast relaxation rate that manifests in the time spectra close to . Its temperature dependence shows a minimum close to , and increases again both below and above . The origin of this additional fast relaxation is discussed in Sec. IV.
III.3 Magnetic structure
For the sake of completeness, we have evaluated the internal field based on the FM structure proposed in Ref. Reehuis et al., 1994. The magnetic structure was inferred from a combination of single crystal magnetization and polycrystal neutron diffraction (ND) measurements. In detail, ND measurements determined the to be aligned perpendicular to [001], which naturally cannot be resolved for tetragonal structures for a powder sample. Complementary magnetisation measurements determined then that the easy axis of magnetization to be along [100].
The expected muon sites for the given electrostatic potential and the corresponding local spin density (based on the FM structure as described above) was predicted within the Wien2K framework Blaha et al. (2020). These calculations yield three possible moun sites; , and . The complete magnetic structure together with the predicted muon sites are shown in Fig. 1 and the calculated local spin density at these sites are listed in Table 1.
With this in mind, we attempt to calculate the local field at the predicted muon sites, based on the magnetic structure presented above. For an non-magnetized FM in ZF, the internal field at the moun site () is given by the following three components,
| (10) |
where is the resulting dipole field within the considered Lorentz sphere, is the Lorentz field, and is the hyperfine contact field. Such internal fields can be translated into the corresponding precession frequency via , so that
| (11) |
where is the muon spin Larmor precession frequency around the internal field at the considered muon site. The modules of Eq. 11 corresponds to the fact that SR only detects the total magnitude of the local internal field.
In general, the local field components presented in Eq. 10 can be considered as contributions from localized and delocalized electrons. The hyperfine contact field accounts for delocalized electrons present at the muon site: the local spin density at the muon site. The microscopic form of such interactions requires the detailed wave function of the electron. It is however common to assume that is isotropic, assuming a spherical electron wave functions. In this case, the is simplified to
| (12) |
where is the vacuum permeability ( H/m) and the probability density for a spherical cloud at the muon site is given by , which in turn is related to the local spin density . In other words, is given as a scalar coupling between and the magnetic moment of the electron where is the total angular momentum.
The dipole field at the muon site on the other hand is originating from the dipolar interactions between localized electrons and the muon spin. A good approximation is to simply consider classical dipoles originating from spin polarized electron orbitals at the center of the magnetic atoms within a large sphere (the Lorentz sphere) with atoms:
| (13) |
where if then . is the distance between the muon and the -th ion. Since the summation in Eq. (13) is not infinite but is instead limited up to within the so called Lorentz sphere, an additional contribution is added to the local field, known as the Lorentz field
| (14) |
where is the vector sum of the magnetic moments inside the Lorentz sphere divided by its volume.
Based on presented theoretical models and the determined magnetic structure, the local fields were computed for the muon sites; (0,0,0.198), (0,0.5,0.102) and (0,0,0.5). The calculations were performed using Python package Bonfà et al. , and the obtained local field values are presented in Table 1. Among the considered muon sites, agrees well with the experimentally obtained data with K, although the calculated value slightly overestimates the local field in comparison to the data. This is most likely due to local magnetic excitations present in a FM, according to the Bloch-3/2 law Blundell (2003); Forslund et al. (2020a), effectively lowers the precession frequency due to the spontaneous magnetization.
The Lorentz field is independent on muon site, since the considered Lorentz sphere was kept constant for the all muon sites. It is however noted that given the symmetry of the positions of and , and are effectively canceling each other resulting into a low precession frequencies, especially for . The hyperfine contact fields are fairly constant across the considered muon sites and constitute a fairly large portion of the resultant local field. Such behavior is different from the -type AF NaNiO2 Forslund et al. (2020b), where the local field was found to be solely formed by dipolar fields. This is to some degree expected since the local spin density should be more considerable in a FM, compared to an AF.
| Muon site | Å | [T] | [T] | [T] | [MHz] | K [MHz] | |
|---|---|---|---|---|---|---|---|
| (0,0,0.198) | -0.00237581 | [0.0872,0,0] | [-0.0185,0,0] | [0.0429,0,0] | 15.13 | 6.332(23) | 0.379 |
| (0,0.5,0.102) | -0.0015081 | [-0.0947,0,0] | [-0.0117,0,0] | [0.0428,0,0] | 8.61 | 6.332(23) | 0.461 |
| (0,0,0.5) | -0.00176282 | [-0.0379,0,0] | [-0.0137,0,0] | [0.0428,0,0] | 1.86 | 6.332(23) | 0.297 |
IV Discussion
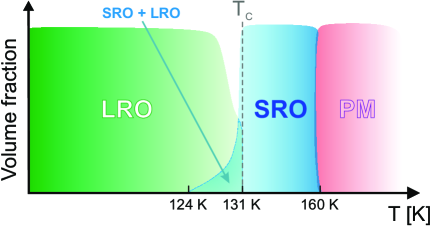
The value of the local field at the site at low temperatures is reasonably explained by the magnetic structure determined by neutron diffraction. Therefore, we will to focus our discussion on the behavior of the compound at higher temperatures. The ZF scan presented above reveals that the sample undergoes a cascade of magnetic transitions (Fig. 6). In detail, a PM order is established at higher temperatures K, as evidenced by the exponentially relaxing KT (). A short range order is stabilized in the temperature range K, for which the muon spin depolarization is made up of two separate exponential relaxations ( and with ). Intriguingly, such short range order (SRO) is likely to coexist with the FM long range order (FM-LRO) in the range K, for which FM-LRO is fully formed below K. Such assertion is supported by the fact that is split into two components at . While settles to a value , consistent with the tail component, shows a maximum at which is separated into and just below . Since is the oscillating fraction, this is the long range ordered fraction of the sample. on the other hand is still an exponential relaxation even below , implying that there is a small temperature range in which FM-LRO and SRO co-exist.
While it was not clearly commented on, a similar behavior was observed in 31P-NMR study in the raw data figure Imai et al. (2015). In fact, the spin-spin relaxation rate () seems to decrease between 130 and 120 K, the increases again around 110 K. Such behavior is reflected by the behavior of , presented in Fig. 5(c). Although NMR does not provide the information on the volume fraction, our study clearly show that a small fraction of SRO is present while the majority of the sample forms LRO.
A coexistence of LRO and SRO has been reported for SrEr2O4 Hayes et al. (2011) or La0.7Sr0.3Mn1-xCoxO3 Thanh et al. (2015). SrEr2O4 is a frustrated magnet where the coexistence was attributed to complex interactions arising from geometrically frustrated magnetism. For La0.7Sr0.3Mn1-xCoxO3, on the other hand, the coexistence looks to stem from the competitions between AF and FM interactions. This would suggest that similar competitions among multiple interactions should be present in LaCo2P2 as well. In fact, LaCo2P2 shows a strong anisotropic character in the FM state, because of the 2D interactions in the CoP plane Imai et al. (2015). At high temperatures, on the other hand, the fluctuation were shown to be of a 3D character Imai et al. (2015). In other words, there exists a small temperature range for which there is a competition between the 2D and 3D character of the interactions, resulting into the coexistence of SRO and LRO. A similar seperation of ordered and disordered phases has also been reported for Cu2IrO3 Kenney et al. (2019) and Li2RhO3 Khuntia et al. (2017). Theoretical treatment of such phenomena revealed that the ground state is stabilized from competition between quantum fluctuation and frustration Gonzalez et al. (2019); Seifert and Vojta (2019).
We wish to note the fact that a relatively large impurity phase is present in the compound, which could be the origin behind the anomaly around . However, the signal from the impurity phase is nicely fitted with a exponentially relaxing Gaussian KT at 2 K, and it is highly unlikely that such behaviour should evolve into an exponential like relaxation at higher temperatures. The value of the exponential relaxation rate itself is also one order of magnitude lower than the one of (Appendix A). Moreover, SR is sensitive to detecting magnetic volume fractions, meaning each contribution is in principle separated. We wish to stress that the XRD analysis indicated no structurally phase separations, the sample is chemically homogeneous. The previous study underlines the high quality of our sample Imai et al. (2015).
V Conclusions
Transverse and zero field (ZF) SR measurements reveal that the sample exhibits a long range ferromagnetic (FM) ground state below K, consistent with previous reports. The muon sites and the corresponding local spin density, based on the already reported magnetic structure, were predicted by density functional theory. The estimated local field calculations agrees well with the presented ZF-SR data. Intriguingly, this study reveals cascade of magnetic transitions, not observed in previous studies. In detail, a paramagnetic (PM) phase is found at higher temperatures K. A short range order (SRO) is stabilized at lower temperatures, for which a coexistence of the SRO and long range FM is present for K. The coexistence originates from a competition of 2D and 3D magnetic interactions and/or fluctuations, prominent at , since a coexistence of magnetic phases is commonly found in compounds with competing magnetic interactions.
Acknowledgements.
We thank the staff of PSI for help with the SR experiments. We also appreciate H. Nozaki, M. Harada and R. Scheuermann for their help with the SR experiments. This research was supported by the Swedish Research Council (VR) (Dnr. 2016-06955) as well as the Swedish Foundation for Strategic Research (SSF) within the Swedish national graduate school in neutron scattering (SwedNess). J.S. acknowledge support from the Ministry of Education, Culture, Sports, Science and Technology (MEXT) of Japan, KAKENHI Grant No.23108003 and Japan Society for the Promotion Science (JSPS) KAKENHI Grant No. JP26286084, JP18H01863 and JP20K21149. D.A. acknowledges partial financial support from the Romanian UEFISCDI project PN-III-P4-ID-PCCF2016-0112 (6/2018). H.O. acknowledge support from KAKENHI Grant No. JP20K05663. The crystal figure was drawn using VESTA Momma and Izumi (2008).Appendix A Temperature dependence of the impurity phase
The temperature dependence of the KT relaxation rate for the impurity phase, , is shown in Fig. 7. The values saturates at lower temperatures and steadily decreases with increasing temperature. As mentioned in the main text, the temperature dependence follows the one obtained in TF configuration, underlying the high quality of our fits in both field configuration. Moreover, the value itself is one order of magnitude lower than that of , suggesting that the origin of the additional exponential close to is not from the impurity but is truly an intrinsic behavior of LaCo2P2.
References
- Bardeen et al. (1957) J. Bardeen, L. N. Cooper, and J. R. Schrieffer, Phys. Rev. 108, 1175 (1957).
- Lange et al. (2003) M. Lange, M. J. V. Bael, Y. Bruynseraede, and V. V. Moshchalkov, Phys. Rev. Lett. 90, 197006 (2003).
- Marsik et al. (2010) P. Marsik, K. W. Kim, A. Dubroka, M. Rössle, V. K. Malik, L. Schulz, C. N. Wang, C. Niedermayer, A. J. Drew, M. Willis, T. Wolf, and C. Bernhard, Phys. Rev. Lett. 105, 057001 (2010).
- Eisaki et al. (1994) H. Eisaki, H. Takagi, R. J. Cava, B. Batlogg, J. J. Krajewski, W. F. Peck, K. Mizuhashi, J. O. Lee, and S. Uchida, Phys. Rev. B 50, 647 (1994).
- Rotter et al. (2009) M. Rotter, M. Tegel, I. Schellenberg, F. M. Schappacher, R. Pöttgen, J. Deisenhofer, A. Günther, F. Schrettle, A. Loidl, and D. Johrendt, New Journal of Physics 11, 025014 (2009).
- Reehuis and Jeitschko (1990) M. Reehuis and W. Jeitschko, Journal of Physics and Chemistry of Solids 51, 961 (1990).
- Baumbach et al. (2014) R. E. Baumbach, V. A. Sidorov, X. Lu, N. J. Ghimire, F. Ronning, B. L. Scott, D. J. Williams, E. D. Bauer, and J. D. Thompson, Phys. Rev. B 89, 094408 (2014).
- Thompson et al. (2014) C. M. Thompson, K. Kovnir, V. O. Garlea, E. S. Choi, H. Zhou, and M. Shatruk, Journal of Materials Chemistry C 2, 7561 (2014).
- Sugiyama et al. (2015a) J. Sugiyama, H. Nozaki, I. Umegaki, M. Harada, Y. Higuchi, K. Miwa, E. J. Ansaldo, J. H. Brewer, M. Imai, C. Michioka, K. Yoshimura, and M. Månsson, Phys. Rev. B 91, 144423 (2015a).
- Tan et al. (2016) X. Tan, A. A. Yaroslavtsev, H. Cao, A. Y. Geondzhian, A. P. Menushenkov, R. V. Chernikov, L. Nataf, V. O. Garlea, and M. Shatruk, Chemistry of Materials, Chemistry of Materials 28, 7459 (2016).
- Hoffmann and Zheng (1985) R. Hoffmann and C. Zheng, The Journal of Physical Chemistry, The Journal of Physical Chemistry 89, 4175 (1985).
- Jia et al. (2009) S. Jia, A. J. Williams, P. W. Stephens, and R. J. Cava, Phys. Rev. B 80, 165107 (2009).
- Mörsen et al. (1988) E. Mörsen, B. Mosel, W. Müller-Warmuth, M. Reehuis, and W. Jeitschko, Journal of Physics and Chemistry of Solids 49, 785 (1988).
- Reehuis et al. (1994) M. Reehuis, C. Ritter, R. Ballou, and W. Jeitschko, Journal of Magnetism and Magnetic Materials 138, 85 (1994).
- Imai et al. (2015) M. Imai, C. Michioka, H. Ueda, and K. Yoshimura, Phys. Rev. B 91, 184414 (2015).
- Hayano et al. (1979) R. S. Hayano, Y. J. Uemura, J. Imazato, N. Nishida, T. Yamazaki, and R. Kubo, Phys. Rev. B 20, 850 (1979).
- Forslund et al. (2019) O. K. Forslund, D. Andreica, Y. Sassa, H. Nozaki, I. Umegaki, E. Nocerino, V. Jonsson, O. Tjernberg, Z. Guguchia, Z. Shermadini, R. Khasanov, M. Isobe, H. Takagi, Y. Ueda, J. Sugiyama, and M. Månsson, Scientific Reports 9, 1141 (2019).
- Sugiyama et al. (2021) J. Sugiyama, W. Higemoto, D. Andreica, O. K. Forslund, E. Nocerino, M. Månsson, Y. Sassa, R. Gupta, R. Khasanov, H. Ohta, and H. Nakamura, Phys. Rev. B 103, 104418 (2021).
- Sugiyama et al. (2015b) J. Sugiyama, H. Nozaki, M. Harada, I. Umegaki, Y. Higuchi, K. Miwa, M. Imai, C. Michioka, K. Yoshimura, E. J. Ansaldo, J. H. Brewer, D. Andreica, C. Baines, and M. Mansson, Physics Procedia 75, 426 (2015b), 20th International Conference on Magnetism, ICM 2015.
- Imai et al. (2014) M. Imai, C. Michioka, H. Ohta, A. Matsuo, K. Kindo, H. Ueda, and K. Yoshimura, Phys. Rev. B 90, 014407 (2014).
- A. Suter and B. M. Wojek (2012) A. Suter and B. M. Wojek, Phys. Proc. 30, 69 (2012).
- Blaha et al. (2020) P. Blaha, K. Schwarz, F. Tran, R. Laskowski, G. K. H. Madsen, and L. D. Marks, The Journal of Chemical Physics 152, 074101 (2020), https://doi.org/10.1063/1.5143061 .
- (23) P. Bonfà, I. J. Onuorah, and R. D. Renzi, “Introduction and a quick look at muesr, the magnetic structure and muon embedding site refinement suite,” in Proceedings of the 14th International Conference on Muon Spin Rotation, Relaxation and Resonance (SR2017), https://journals.jps.jp/doi/pdf/10.7566/JPSCP.21.011052 .
- Blundell (2003) S. Blundell, “Magnetism in condensed matter,” (2003).
- Forslund et al. (2020a) O. K. Forslund, K. Papadopoulos, E. Nocerino, G. Morris, B. Hitti, D. Arseneau, V. Pomjakushin, N. Matsubara, J.-C. Orain, P. Svedlindh, D. Andreica, S. Jana, J. Sugiyama, M. Månsson, and Y. Sassa, Phys. Rev. B 102, 144409 (2020a).
- Forslund et al. (2020b) O. K. Forslund, H. Ohta, K. Kamazawa, S. L. Stubbs, O. Ofer, M. Månsson, C. Michioka, K. Yoshimura, B. Hitti, D. Arseneau, G. D. Morris, E. J. Ansaldo, J. H. Brewer, and J. Sugiyama, Phys. Rev. B 102, 184412 (2020b).
- Hayes et al. (2011) T. J. Hayes, G. Balakrishnan, P. P. Deen, P. Manuel, L. C. Chapon, and O. A. Petrenko, Phys. Rev. B 84, 174435 (2011).
- Thanh et al. (2015) T. D. Thanh, D. C. Linh, T. V. Manh, T. A. Ho, T.-L. Phan, and S. C. Yu, Journal of Applied Physics, Journal of Applied Physics 117, 17C101 (2015).
- Kenney et al. (2019) E. M. Kenney, C. U. Segre, W. Lafargue-Dit-Hauret, O. I. Lebedev, M. Abramchuk, A. Berlie, S. P. Cottrell, G. Simutis, F. Bahrami, N. E. Mordvinova, G. Fabbris, J. L. McChesney, D. Haskel, X. Rocquefelte, M. J. Graf, and F. Tafti, Phys. Rev. B 100, 094418 (2019).
- Khuntia et al. (2017) P. Khuntia, S. Manni, F. R. Foronda, T. Lancaster, S. J. Blundell, P. Gegenwart, and M. Baenitz, Phys. Rev. B 96, 094432 (2017).
- Gonzalez et al. (2019) M. G. Gonzalez, F. T. Lisandrini, G. G. Blesio, A. E. Trumper, C. J. Gazza, and L. O. Manuel, Phys. Rev. Lett. 122, 017201 (2019).
- Seifert and Vojta (2019) U. F. P. Seifert and M. Vojta, Phys. Rev. B 99, 155156 (2019).
- Momma and Izumi (2008) K. Momma and F. Izumi, Journal of Applied Crystallography 41, 653 (2008).