Deep vacancy induced low-density fluxional interfacial water
Abstract
Interfacial water on transition metal oxides such as TiO2 has been widely studied because of their structural complexity and scientific relevance in e.g. photocatalysis and ice growth. Using ab initio molecular dynamics, we find that interfacial water on anatase (101) surface features an unconventional fluxional structure with reduced contact layer density. The density reduction and flexibility of interfacial water are induced by oxygen vacancy defects deeply located in the subsurface. Our study proposes a fresh perspective of the anatase/water interface, raising the importance of non-trivial long-range effects caused by deep defects. These often-neglected effects highlight the necessity and challenges of the state-of-the-art simulation and experimental probing of solid liquid interfaces.
Water is one of the most ubiquitous materials in nature and has an incredibly diverse range of structures and properties at the interfaces with other materialsHodgson and Haq (2009); Björneholm et al. (2016); Debenedetti and Klein (2017). Aqueous interfaces are fundamental to many natural phenomena and modern technologiesKuhlenbeck et al. (2013); Sosso et al. (2016); Striolo et al. (2016). Understanding the molecular structure of interfacial liquid water is key to examining the physical and chemical processes at interfaces. For example, ordering and density of interfacial water are two key elements for heterogeneous ice crystallization Sosso et al. (2016); Fitzner et al. (2020); electric double layers formed at water solid interfaces control many electrochemical reactions Sulpizi et al. (2012); Kattirtzi et al. (2017); Magnussen and Gross (2019); Zhang et al. (2019); interfacial water crucially affects energy converting in modern nanotechnologies De Angelis et al. (2014); Selcuk and Selloni (2016); Rao and Dey (2017); Tocci et al. (2020). Because of these important applications, many experimental studies have been carried out to establish microscopic structure of interfacial water on surfaces, including e.g. high resolution imaging in vacuum Stipe et al. (1998), in-situ diffraction measurements Henderson (2002) and vibrational spectroscopy Shen and Ostroverkhov (2006); Li et al. (2019). Molecular dynamics simulations based on density functional theory and force fields have also been very successful in elucidating interfacial structure and water dissociation Carrasco et al. (2012); Cheng et al. (2014); Björneholm et al. (2016); Andrade et al. (2020).
From a different perspective, understanding the details of substrate materials can lead to fine tuning of properties at solid liquid interfaces Björneholm et al. (2016). For example, in titanium dioxide, a material that has been widely investigated for photo-catalysis, reduced defects such as oxygen vacancies are considered to be ubiquitous Pang et al. (2013); Diebold (2017). Studies have shown that defects on surface can react with water and subsurface defects can migrate to surface to interact with water Bikondoa et al. (2006); Li and Gao (2014); Deskins et al. (2020). Besides, excess electrons induced by defects can also migrate and affect water adsorption and dissociation Deskins et al. (2010); Selcuk and Selloni (2016); Yim et al. (2018); Chen et al. (2020). These interfacial effects, involving direct chemical interactions between water and surface, are intuitively understandable Diebold (2017). In contrast, long range physical effects induced by defects are generally less important. However, the fact that there is a delicate balance between water adsorption and hydrogen bonding network suggests interfacial water properties may be sensitive to deep defects in subsurface as well.
In this study, we investigate the sensitivity of interfacial water structure to oxygen vacancy, a natural defect in TiO2. We find that oxygen vacancies, surprisingly even very deep vacancies, have strong impacts on the structures of interfacial water. The impacts feature a density reduction and a fluxional behavior of interfacial water. These effects are not a direct consequence of reactions with surface oxygen vacancies and polarons, but rather due to a delicate balance of (i) hydrogen bonding between water molecules, (ii) adsorption of water, (iii) hydrogen bonding interactions between water and the substrate, and (iv) long range electrostatic interactions.
Ab initio molecular dynamics (AIMD) simulations Car and Parrinello (1985) were carried out using density functional theory (DFT) with the Vienna ab initio simulation package(VASP) Kresse and Furthmüller (1996). The Van der Waals inclusive optB86-vdW exchange correlation functional was employed Klimeš et al. (2010, 2011). Additional simulations with SCAN-rvv10 exchange correlation functionalSun et al. (2015); Peng et al. (2016) and with Hubbard corrections (U=3.9 eV)Dudarev et al. (1998) were performed to test the validity of conclusions. Electron–ion interactions were described using the projector augmented wave method, with Ti(3d, 4s), O(2s, 2p), and H(1s) electrons treated explicitly as valence electrons Kresse and Joubert (1999). Wave functions were expanded in plane-waves up to a kinetic energy cutoff of 500 eV. K-point sampling was restricted to the point only. The deuterium mass (2 amu) was used for hydrogen to allow for a larger time step of 1 fs. Temperature was controlled using Nos-Hoover thermostat at 330 K within NVT ensemble. Ten different configurations were considered for anatase(101), including a stoichiometric substrate and nine substrates each containing one oxygen vacancy (VO) located at different depths. The oxygen vacancy concentration in our supercell is , which is within the typical range in reduced TiO2. Taking the stoichiometric configuration as an example, a periodically repeated supercell of size was used in our simulation, corresponding to a composition of ten Ti-layers and twenty O-layers () and a (101) surface area of Å2. Water slabs including 52 water molecules were constructed with the bulk water density (1.02 g/cm3). After reaching equilibrium in e.g. 10 ps, trajectories were collected for up to 120 ps. The pressure is within 50 MPa throughout the simulations. We carry out additional simulations with 15 Å vacuum above 76 water molecules and a substrate with 36 Ti atoms and 72/71 oxygen atoms (VO8/pristine system). The bottom layer of substrate is fixed to keep the bulk TiO2 properties.(Fig. S15) We also tested other models, including anatase(001) (Ti90O180), rutile(110) (Ti64O128) and silica(0001) (Si24O48). Further details and convergence tests are described in the supporting information.
Anatase(101) surface has a sawtooth-like structure composed of both five-fold coordinated titanium (Ti5c) atoms and two-fold coordinated oxygen (O2c) atoms along the [010] direction, as highlighted in Fig.1. Compared with their coordination number in the bulk, O2c and Ti5c are under-coordinated and are easy to capture water. Previous studies of water adsorption on anatase(101) surface in ultrahigh vacuum have suggested both Ti5c and O2c are favorable bonding sites, presenting two ordered layers of water. This structure of water over-layer is also reproduced in many previous simulationsTilocca and Selloni (2012); Zhao et al. (2012); Aschauer et al. (2015); Selli et al. (2017). For liquid water-anatase interface at room temperature, however, the structure is not clearNadeem et al. (2018).
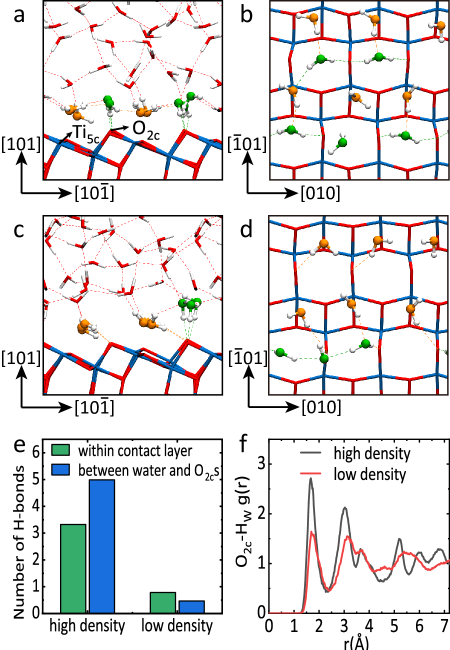
Fig.1a-b shows an interfacial water structure observed in the simulation on the pristine substrate. The structure of contact water layer resembles the over-layer structure on the anatase (101) surface in vacuum, containing alternating rows of adsorbed water. One row is along the Ti5cs (adsorbed water highlighted in yellow) and the other is along the O2cs (adsorbed water highlighted in green). Water molecules bonded to O2c mainly form donating hydrogen bonds with neighboring O2cs and accepting hydrogen bond with water molecules on Ti5c. Because the structure contains two bonded water molecules per Ti site, effectively covering all surface sites, we name it as the high-density interfacial water 111The density of interfacial water can not be directly compared with bulk water because of the arbitrariness of the choice of the interfacial regime. However, for a rough comparison the lateral density of the high-density interfacial water on anatase (101) is slightly smaller than the lateral density of the basal bilayer of ice-Ih by approximately 10%. The high-density interfacial water is named because it has the highest density of interfacial water observed on this surface..
Prior to a systematic discussion of the impact of defects on the interfacial water structure, we first discuss another typical interfacial water structure identified in our simulations. In this structure (Fig.1c-d), water molecules on the O2c row mostly form no more than one hydrogen bond with O2c, in contrast to two hydrogen bonds in the high-density model. In addition, water molecules on Ti5c may directly form hydrogen bond with the O2c rather than with adsorbed water molecules (orange molecules in Fig.1a,c). In this unconventional structure, fewer water molecules feature in the contact layer, thus we refer it as the low-density interfacial water 222The high-density and low-density water discussed here refer to interfacial water structures with relatively different lateral water density, which are different from the high-density and low-density phases in supercooled bulk water, a topic that is beyond the scope of this study. Fig. 1e further shows that the low-density interfacial water has fewer hydrogen bonds within the contact layer, and fewer hydrogen bonds between water and the surface. Such differences are also shown in the radial distribution function of water hydrogen (HW) around O2c (Fig.1f). In the high-density structure, more H atoms prefer to stay bonded to O2cs, while the density of H atoms is obviously lower in the low-density model.
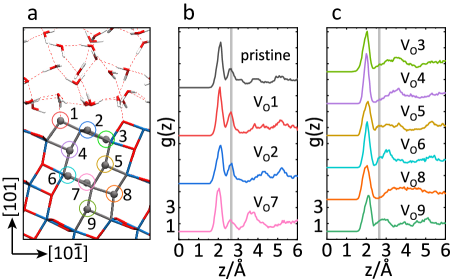
Another measure to distinguish the low-density and the high-density interfacial water is the g(z) profile. Fig.2b,c shows all g(z) profiles of ten different simulations, including a pristine substrate and nine substrates with oxygen vacancy, which are labeled from to according to the depth of the oxygen vacancy. The relative stability of these 9 vacancy sites is yet to be established, therefore as a first step it is important to understand how each vacancy site impacts the interfacial water structure. In reality, vacancies may migrate across the substrates and have a dynamical influence on the interfacial water structure. Fig.2a shows a sideview of the pristine model, and the colored circles highlight the positions of oxygen vacancy in other nine substrates. Overall from g(z) profiles, interfacial water in these ten simulations can be categorized into 4 high-density (Fig.2b) and 6 low-density (Fig.2c) structures. For both the high-density and the low-density interfacial water, a sharp peak at about 2 Å corresponds to water adsorbed on Ti5c. In the high-density model, water molecules bonded to O2cs give rise to a second peak at about 2.6 Å, while the peak is missing for the low-density model (grey shaded area in Fig.2b,c). An immediate consequence of such structural changes is the density reduction of interfacial water, and a quantitative analysis will be discussed later.
Besides the density reduction, the low-density interfacial water is accompanied by a fluxional feature, which are reflected in Fig.3a-b by projected trajectories of OW in x-y plane. There are six black trajectories indicating six water molecules on Ti5c. Because water bonding energy to Ti5c is significantly higher than hydrogen bonding energy to O2cHerman et al. (2003); Dahal and Dohnálek (2017), these molecules remain adsorbed in all simulations. Difference appears for water molecules on O2cs (viridis lines), whose trajectories are concentrated in the high-density model, while they are extended in the low-density model.
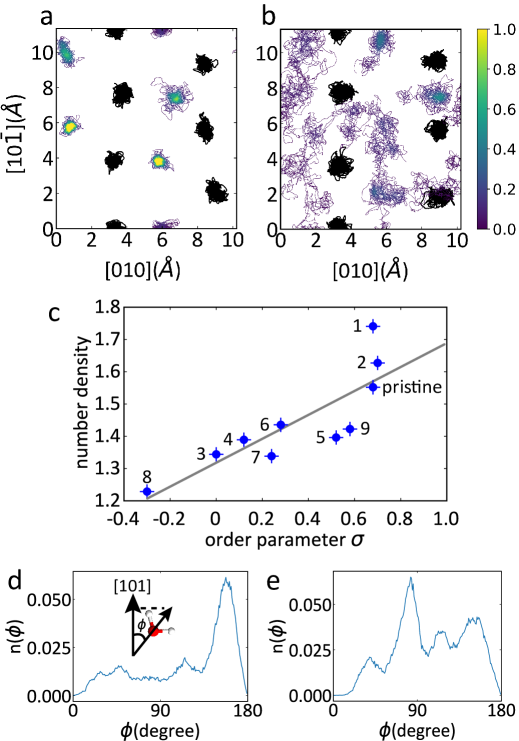
Another feature indicated by the trajectory projection is that the high-density interfacial water layer is ordered, whereas the fluxional interfacial water layer of the low-density model is disordered. To quantify the ordering, we define an order parameter based on the lateral angular distribution of water. The order parameter is calculated by in polar coordinate system, where N is the total number of water molecules within a radius of 3 Å from O2c and is the polar angle of the molecule (on Ti5c)-molecule (on O2c) line with respect to the x-axis (Fig. S4a). Orderly adsorbed water molecules on Ti5c and O2c sites feature a distribution with , and , where gets a maximum value of 1. In contrast, has a minimum value of -1 in directions around , , and . As a result, for relatively ordered distribution of water in the high-density model, approaches 1, whereas the fluxional distribution in the low-density model results in a smaller, possibly negative, value of .
Furthermore, Fig.3c indicates there is a relation between the density of interfacial water and the order parameter . The number density of water molecules in Fig.3c is defined by the number of water molecules per unit cell within the region of 3 Å above the Ti5c surface. Overall, the higher the density is the larger the order parameter is, meaning the structure is more ordered. However, when the density is lower the structure is less ordered and more fluxional. The disordering of the contact layer is also reflected on the orientation of water molecules. Fig.3d-e plots the distribution of molecular orientation of water above O2c rows, which are hydrogen bonded with O2cs directly or with the water adsorbed on Ti5c. For the ordered high-density model, there is a clear preference of water molecules aligning in a double-leg orientation, which peaks at about 160 degree with respect to the surface normal (Fig.3d). In contrast, a typical fluxional interfacial model would break such a preference (Fig.3e). This difference in orientation indicates the fluxional molecules alternately form donating hydrogen bonds with O2c and the bulk liquid. The distribution profiles of all ten systems are shown in the SI (Fig. S5, Fig. S6), supporting the analyses discussed. In addition, the fluxional behaviors are accompanied by dynamic exchanges between the contact layer and the bulk liquid (Fig. S8).
From above results, a particularly interesting finding is that the density reduction and the fluxional interfacial water layer is observed on substrates with deep vacancies. Even for the VO7 system, showing a similar second peak on g(z) to the conventional high-density interfacial water model, other analyses of order parameter (Fig.3c), water orientation (Fig. S5) and hydrogen bonded water number (Fig. S6) clarify its fluxional nature. VO9, located 9 Å under the interfacial water layer, is the deepest vacancy considered in our simulations, and our results suggest that deeper vacancies would have similar effects. This means that only the pristine substrate and the substrates with surface vacancies (VO1 and VO2) maintain the high-density interfacial water. Given the fact that in TiO2 oxygen vacancies are ubiquitous at different depths across the substrate, low-density fluxional interfacial water may appear generally. The density reduction appeared in our simulation is in line with the experimental results of I.M.Nadeem et al., in which they found that a 50% coverage of water on O2c fits best with measurements Nadeem et al. (2018).
It is also worth noting that our results do not contradict with previous studies where water dissociation was discussed. Recently, Calegari Andrade et al. investigated the spontaneous dissociation of water on TiO2 surface using machine learning force fields and suggested that spontaneous water dissociation requires nanoseconds for equilibriumAndrade et al. (2020). Here we focus on the interfacial structure of water, characterized by the distribution of oxygen positions, whose equilibrium is often reached within a few tens of picoseconds. In fact, water dissociation induced by surface VO is also observed in our simulations with VO1 and VO2. Dissociation, however, does not lead to the density reduction of interfacial water. The fact that surface vacancies (VO1 and VO2) have minor effects on the interfacial water structure is rather counter-intuitive because surface oxygen vacancies are reactive to water, and lead to the formation of hydroxide groups on the surface.
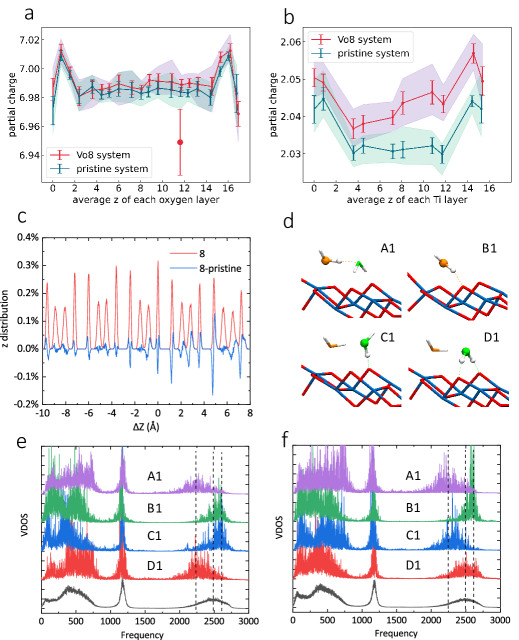
Our counter-intuitive results suggest there is very delicate balance of competing interactions at the interface associated with the details of substrate. To provide deeper physical insights, we further compared the position and charge distribution of the VO8 system and the pristine substrate. Fig.4a-b plots the Bader charge of oxygen and titanium atoms on each layer across the pristine and VO8 substrates. In comparison to the pristine system, oxygen vacancies result in excess electrons in the substrate. We note that although the difference is a few percent, this magnitude of change is large enough to induce an electrostatic energy difference of tens of meV simply based on electrostatics, which is comparable to the 330K temperature (28 meV). Such a difference is enough to tip the balance of the competition between hydrogen bonding network and adsorption on bridging oxygen, thus leading to a new interfacial water structure on TiO2. For example, previous studies have shown a competition between two water molecules for hydrogen bonding to the bridging oxygen that raises up the adsorption energy by about 33 meVHe et al. (2009). Slight electron deficit on bridging oxygen (Fig.4a) in defected system leads to weaker hydrogen bonding, hence pushing one of the competing water molecules away from the bridging oxygen.
Previous studies have shown that excess electrons can migrate from subsurface to the surface, affecting hydrogen bonding, adsorption and dissociation of waterSelcuk and Selloni (2016); Chen et al. (2020); Yim et al. (2018). We note that the behavior of excess electrons is quite sensitive to DFT methods used. For example, excess electrons may localize and show polaronic behavior when DFT+U methods are used. We have also carried out simulations with SCAN-rvv10 and PBE+U, which show consistent results that density reduction can be induced by deep oxygen vacancies (Fig. S3, Fig. S7-8, Fig. S10). These additional tests suggest the low-density fluxional interfacial water is not an artifact and not sensitive to the description of localized electrons and the extent of water dissociation.
Fig.4c plots the oxygen atom distribution and their difference, which shows the interfacial water structure on these two substrates are quite different, displaying a collective variation of atomic positions across the substrate layers. The collective variation is a typical elastic effect that can physically transfer interactions to a long range. Similar effects have been observed in rutile, where water adsorption and dissociation energies vary along with the substrate positionsLiu et al. (2010). In the SI, we further compare the VO5 and VO8 systems. These two systems have oxygen vacancies located on the opposite side of a void regime, and during the simulations the oxygen atom on the opposite side vibrates in the middle, resulting in two very similar substrates structurally (Fig. S11) and electronically (Fig. S12). Overall, here we propose that the long-range effects to the interfacial water structure may entangle with minuscule atomic position and charge distribution charges of the substrate, which should be paid attention to and further investigated in the future.
Before concluding, we note that the delicate nature indicates that experimental identification of the interfacial water structure on anatase(101)-water interface is of great challenge, requiring not only advanced characterization techniques but also clean and well controlled substrate samples. The interfacial water density change reflects to some extent on the hydrogen bonding change at the interface, which can be detected experimentally using vibrational spectroscopies. Fig.4e-f shows the vibrational density of state (VDOS) from AIMD trajectories of the pristine and VO8 systems. VDOS profiles A1-D1 in Fig.4e-f correspond to the donor O-H stretching highlighted in Fig.4d. For comparison VDOS from water molecules are shown in black lines. The red and blue shifts in the stretching mode indicate strong and weak hydrogen bonds. The strength difference in C1 and D1 between pristine and defected systems leads to the difference in the interfacial structure. Specifically, oxygen vacancy shifts the preference of local hydrogen bonding structure from D1 to C1, which is also highlighted in the dipole orientation profiles (Fig. 3d-e).
Finally, to examine whether our findings can extend to other systems, we have considered a few other substrates, namely rutile(110), anatase(001), and silica(0001) (Fig. S13, Fig. S14). These substrates cover three different kinds: (i) on rutile(110) water remains intact; (ii) on anatase(001) water dissociates; and on silica(0001) the surface is readily hydroxylated. In the end, on these substrates tested we do not see strong influences of deep oxygen vacancies on the interfacial water structure. Therefore, whether there are other substrates that possess similar interesting behaviors identified on anatase(101) remains an open question.
In summary, we have reported ab initio simulations of water-anatase(101) interface, where we have identified the low-density fluxional interfacial water due to oxygen vacancies in the substrate. We show that the influence of oxygen vacancies can be rather long-range and indirect, which lead to the finding that even the deepest vacancy considered in our simulations can strongly impact the interfacial water structure. We also reveal the density reduction and induced flexibility is closely related, and the behaviors are likely to be physically amplified by minor changes in the substrate due to the presence of oxygen vacancy. The non-trivial long range effect identified in our study is another highlight of the complexity of interfacial water structure, and it is also potentially an opportunity for materials engineering to manipulate interfacial water properties by controlling the inner part of materials.
acknowledgements
The authors thank Angelos Michaelides for helpful discussions. This work was supported by the National Key R&D Program of China under Grant No.2016YFA030091, the National Natural Science Foundation of China under Grant No. 11974024, and the Strategic Priority Research Program of Chinese Academy of Sciences under Grant No. XDB33000000. We are grateful for computational resources provided by Peking University, the TianHe-1A supercomputer, Shanghai Supercomputer Center, and Songshan Lake Materials Lab.
References
- Hodgson and Haq (2009) A. Hodgson and S. Haq, Surface Science Reports 64, 381 (2009).
- Björneholm et al. (2016) O. Björneholm, M. H. Hansen, A. Hodgson, L.-M. Liu, D. T. Limmer, A. Michaelides, P. Pedevilla, J. Rossmeisl, H. Shen, G. Tocci, E. Tyrode, M.-M. Walz, J. Werner, and H. Bluhm, Chemical Reviews 116, 7698 (2016).
- Debenedetti and Klein (2017) P. G. Debenedetti and M. L. Klein, Proceedings of the National Academy of Sciences: USA 114, 13325 (2017).
- Kuhlenbeck et al. (2013) H. Kuhlenbeck, S. Shaikhutdinov, and H.-J. Freund, Chemical Reviews 113, 3986 (2013).
- Sosso et al. (2016) G. C. Sosso, J. Chen, S. J. Cox, M. Fitzner, P. Pedevilla, A. Zen, and A. Michaelides, Chemical Reviews 116, 7078 (2016).
- Striolo et al. (2016) A. Striolo, A. Michaelides, and L. Joly, Annual Review of Chemical and Biomolecular Engineering 7, 533 (2016).
- Fitzner et al. (2020) M. Fitzner, P. Pedevilla, and A. Michaelides, Nature Communications 11, 4777 (2020).
- Sulpizi et al. (2012) M. Sulpizi, M.-P. Gaigeot, and M. Sprik, Journal of Chemical Theory and Computation 8, 1037 (2012).
- Kattirtzi et al. (2017) J. A. Kattirtzi, D. T. Limmer, and A. P. Willard, Proceedings of the National Academy of Sciences: USA 114, 13374 (2017).
- Magnussen and Gross (2019) O. M. Magnussen and A. Gross, Journal of the American Chemical Society 141, 4777 (2019).
- Zhang et al. (2019) C. Zhang, J. Hutter, and M. Sprik, The Journal of Physical Chemistry Letters 10, 3871 (2019).
- De Angelis et al. (2014) F. De Angelis, C. Di Valentin, S. Fantacci, A. Vittadini, and A. Selloni, Chemical Reviews 114, 9708 (2014).
- Selcuk and Selloni (2016) S. Selcuk and A. Selloni, Nature Materials 15, 1107 (2016).
- Rao and Dey (2017) C. N. R. Rao and S. Dey, Proceedings of the National Academy of Sciences: USA 114, 13385 (2017).
- Tocci et al. (2020) G. Tocci, M. Bilichenko, L. Joly, and M. Iannuzzi, Nanoscale 12, 10994 (2020).
- Stipe et al. (1998) B. C. Stipe, M. A. Rezaei, and W. Ho, Science 280, 1732 (1998).
- Henderson (2002) M. A. Henderson, Surface Science Reports 46, 1 (2002).
- Shen and Ostroverkhov (2006) Y. R. Shen and V. Ostroverkhov, Chemical Reviews 106, 1140 (2006).
- Li et al. (2019) C.-Y. Li, J.-B. Le, Y.-H. Wang, S. Chen, Z.-L. Yang, J.-F. Li, J. Cheng, and Z.-Q. Tian, Nature Materials 18, 697 (2019).
- Carrasco et al. (2012) J. Carrasco, A. Hodgson, and A. Michaelides, Nature Materials 11, 667 (2012).
- Cheng et al. (2014) J. Cheng, X. Liu, J. VandeVondele, M. Sulpizi, and M. Sprik, Accounts of Chemical Research 47, 3522 (2014).
- Andrade et al. (2020) M. F. C. Andrade, H.-Y. Ko, L. Zhang, R. Car, and A. Selloni, Chemical Science 11, 2335 (2020).
- Pang et al. (2013) C. L. Pang, R. Lindsay, and G. Thornton, Chemical Reviews 113, 3887 (2013).
- Diebold (2017) U. Diebold, The Journal of Chemical Physics 147, 040901 (2017).
- Bikondoa et al. (2006) O. Bikondoa, C. L. Pang, R. Ithnin, C. A. Muryn, H. Onishi, and G. Thornton, Nature Materials 5, 189 (2006).
- Li and Gao (2014) Y. Li and Y. Gao, Physical Review Letters 112, 206101 (2014).
- Deskins et al. (2020) N. A. Deskins, G. A. Kimmel, and N. G. Petrik, The Journal of Physical Chemistry Letters 11, 9289 (2020).
- Deskins et al. (2010) N. A. Deskins, R. Rousseau, and M. Dupuis, The Journal of Physical Chemistry C 114, 5891 (2010).
- Yim et al. (2018) C. M. Yim, J. Chen, Y. Zhang, B.-J. Shaw, C. L. Pang, D. C. Grinter, H. Bluhm, M. Salmeron, C. A. Muryn, A. Michaelides, and G. Thornton, The Journal of Physical Chemistry Letters 9, 4865 (2018).
- Chen et al. (2020) J. Chen, C. Penschke, A. Alavi, and A. Michaelides, Physical Review B 101, 115402 (2020).
- Car and Parrinello (1985) R. Car and M. Parrinello, Physical Review Letters 55, 2471 (1985).
- Kresse and Furthmüller (1996) G. Kresse and J. Furthmüller, Physical Review B 54, 11169 (1996).
- Klimeš et al. (2010) J. Klimeš, D. R. Bowler, and A. Michaelides, J. Phys.: Condens. Matter 22, 022201 (2010).
- Klimeš et al. (2011) J. Klimeš, D. R. Bowler, and A. Michaelides, Phys. Rev. B 83, 195131 (2011).
- Sun et al. (2015) J. Sun, A. Ruzsinszky, and J. P. Perdew, Phys. Rev. Lett. 115, 036402 (2015).
- Peng et al. (2016) H. Peng, Z.-H. Yang, J. P. Perdew, and J. Sun, Phys. Rev. X 6, 041005 (2016).
- Dudarev et al. (1998) S. L. Dudarev, G. A. Botton, S. Y. Savrasov, C. J. Humphreys, and A. P. Sutton, Physical Review B 57, 1505 (1998).
- Kresse and Joubert (1999) G. Kresse and D. Joubert, Phys. Rev. B 59, 1758 (1999).
- Tilocca and Selloni (2012) A. Tilocca and A. Selloni, The Journal of Physical Chemistry C 116, 9114 (2012).
- Zhao et al. (2012) Z. Zhao, Z. Li, and Z. Zou, The Journal of Physical Chemistry C 116, 11054 (2012).
- Aschauer et al. (2015) U. J. Aschauer, A. Tilocca, and A. Selloni, International Journal of Quantum Chemistry 115, 1250 (2015).
- Selli et al. (2017) D. Selli, G. Fazio, G. Seifert, and C. Di Valentin, Journal of Chemical Theory and Computation 13, 3862 (2017).
- Nadeem et al. (2018) I. M. Nadeem, J. P. W. Treacy, S. Selcuk, X. Torrelles, H. Hussain, A. Wilson, D. C. Grinter, G. Cabailh, O. Bikondoa, C. Nicklin, and A. Selloni, J. Phys. Chem. Lett. 9, 3131 (2018).
- Note (1) The density of interfacial water can not be directly compared with bulk water because of the arbitrariness of the choice of the interfacial regime. However, for a rough comparison the lateral density of the high-density interfacial water on anatase (101) is slightly smaller than the lateral density of the basal bilayer of ice-Ih by approximately 10%. The high-density interfacial water is named because it has the highest density of interfacial water observed on this surface.
- Note (2) The high-density and low-density water discussed here refer to interfacial water structures with relatively different lateral water density, which are different from the high-density and low-density phases in supercooled bulk water, a topic that is beyond the scope of this study.
- Herman et al. (2003) G. S. Herman, Z. Dohnálek, N. Ruzycki, and U. Diebold, The Journal of Physical Chemistry B 107, 2788 (2003).
- Dahal and Dohnálek (2017) A. Dahal and Z. Dohnálek, The Journal of Physical Chemistry C 121, 20413 (2017).
- He et al. (2009) Y. He, A. Tilocca, O. Dulub, A. Selloni, and U. Diebold, Nature Materials 8, 585 (2009).
- Liu et al. (2010) L.-M. Liu, C. Zhang, G. Thornton, and A. Michaelides, Physical Review B 82, 161415 (2010).