Midwifery Learning and Forecasting: Predicting Content Demand with User-Generated Logs
Abstract.
Every day, 800 women and 6,700 newborns die from complications related to pregnancy or childbirth. A well-trained midwife can prevent most of these maternal and newborn deaths. Data science models together with logs generated by users of online learning applications for midwives can help to improve their learning competencies. The goal is to use these rich behavioral data to push digital learning towards personalized content and to provide an adaptive learning journey. In this work, we evaluate various forecasting methods to determine the interest of future users on the different kind of contents available in the app, broken down by profession and region.
1. Introduction
The rapid expansion of mobile health applications in low- and middle-income countries, and the large volume of data generated by their users, has created unprecedented opportunities for applying artificial intelligence (AI) to improve individual and population health (Hosny and Aerts, 2019; Wahl et al., 2018). The application of data science models to the digital tools’ behavioral logs of frontline healthcare workers and patients can lead to improvements in clinical research and practice, and health service delivery. And public health can use big datasets to promote healthy habits and ameliorate self-management, by providing people with health and well-being plans based on their particular medical and social circumstances (O’Connor, 2018; Marsch, 2021).
Every year 300,000 women and 5 million newborns die of causes related to pregnancy and childbirth (Fund, 2020; for Child Mortality Estimation, 2020). Additionally, for every maternal death approximately 20 women suffer serious birth injuries (World Health Organization and Bank, 2019). Nearly all of these deaths and disabilities occur in low- and middle-income countries, and almost 90% of them could be prevented if the woman gave birth with qualified assistance from a skilled midwife (Nove et al., 2021). Additionally, 80% of all newborn deaths result from conditions which are preventable and treatable, and for which proven, cost-efficient interventions exist (Organization and UNICEF, 2014). Almost all intrapartum and many antepartum stillbirths could be prevented with quality essential childbirth care and antenatal care (Lawn et al., 2016).
Here we show an analysis of the logs from skilled birth attendants using the Safe Delivery App (Foundation, 2021b), a digital training and learning mobile application developed by the Maternity Foundation—a non-profit that develops digital learning tools to ensure all women and newborns have a safe childbirth (Foundation, 2021a). This work represents a step towards content personalization for midwives, in a sector that has traditionally been left out of big technological developments. Forecasting the demand for learning content by profession and region can lead to a better understanding of user habits and improve the management of campaigns (Xu and Chan, 2019). We apply several forecasting methods to evaluate their accuracy and production feasibility with the aim of using the outcomes for future experimentation and incentive analysis. Previous studies using similar methodologies and user logs can be found in (Guitart et al., 2018; del Río et al., 2021).
1.1. Forecasting models
We compare the performance of different time series forecasting methods in predicting the daily demand (in number of users) per type of content (module, in the app’s language) and user’s profession. Training and prediction were performed using the gluonTS (Alexandrov et al., 2020), keras (Chollet et al., 2015) and mxnet (Chen et al., 2015) Python libraries and the Forecast R package (Hyndman and Khandakar, 2008).
1.1.1. Seasonal naïve forecaster
The naïve forecast model (Alexandrov et al., 2020) was used as a benchmark. Its forecasts are given by the exact values at the equivalent time points of the previous season. For prediction lengths larger than a season, the season is repeated multiple times, whereas for time series shorter than a season, the mean observed value is used as the prediction.
1.1.2. Seasonal Autorregressive Integrated Moving Average (SARIMA) forecaster
The SARIMA model (Box and Jenkins, 1990) was used as an additional benchmark, as it is one of the best performing and most widely used classical approaches to time series analysis and forecasting. At each time step, the time series value is a combination of regular and seasonal autoregressive (where the value depends on the previous values) and moving average (where the value depends on the previous errors) polynomials. In addition, one can take as many differences as needed in the original time series to make it stationary.
1.1.3. Neural networks with categorical embedding
The last decade has seen the rapid growth of deep neural network architectures to tackle a great variety of problems (LeCun et al., 2015), due to increasing computational resources and data availability, as well as improved methodology. One shortcoming of this approach is its difficulty to include categorical features, due to their lack of continuity. Entity embedding (Guo and Berkhahn, 2016) can be used to effectively learn the representation of categorical variables in multidimensional spaces, increasing their continuity and thus providing an intelligent way of using them as features in deep learning models. In particular, it overcomes the problems faced by the more traditional approach of one-hot encoding, namely the need for excessive computational power and its tendency to overfitting.
1.1.4. Autoregressive recurrent networks (DeepAR)
The use of autoregressive recurrent networks to simultaneously predict many time series was introduced in (Salinas et al., 2020). The method trains either long short-term memory (LSTM) or gated recurrent unit (GRU) networks, where the inputs at each time step are the covariates, the target value from the previous time step (which makes it autoregressive) and the previous output of the network (which makes it recurrent). A global model is learned from all the time series that can be used to generate probabilistic forecasts for the individual time series, each with its own individual distribution. This technique has been previously used in connection with healthcare in (Papastefanopoulos et al., 2020).
1.1.5. Low-rank Gaussian copula processes
This is a multivariate approach with deep learning elements, described as GP-Copula in (Salinas et al., 2019). It combines a time series model based on autoregressive recurrent newtworks with a Gaussian copula process to parametrize the output distribution. This copula has low-rank structure in order to keep the number of parameters and computational complexity within reasonable bounds.
| Model | MASE | MAPE | sMAPE | RMSE | MSE |
|---|---|---|---|---|---|
| Seasonal Naïve | 1.3221 | 0.7945 | 0.7294 | 8.2179 | 84.2975 |
| ARIMA | 0.8752 | 0.5569 | 0.7416 | 4.5020 | 21.2377 |
| NN with categorical embeddings | 1.0381 | 0.5283 | 0.6547 | 12.4945 | 250.0235 |
| DeepAR | 0.8110 | 0.4373 | 0.5689 | 4.4461 | 22.1728 |
| GP-Copula | 0.8209 | 0.4285 | 0.6564 | 4.4088 | 21.5326 |
2. Modeling
2.1. Dataset
Our dataset comprised user logs extracted from Maternity Foundation’s Safe Delivery App. This app targets skilled birth attendants around the world, empowering them to provide a safer birth for mothers and newborns through evidence-based and up-to-date clinical guidelines on maternal and neonatal care, including the core components or ”signal functions” of Basic Emergency Obstetric and Newborn Care.
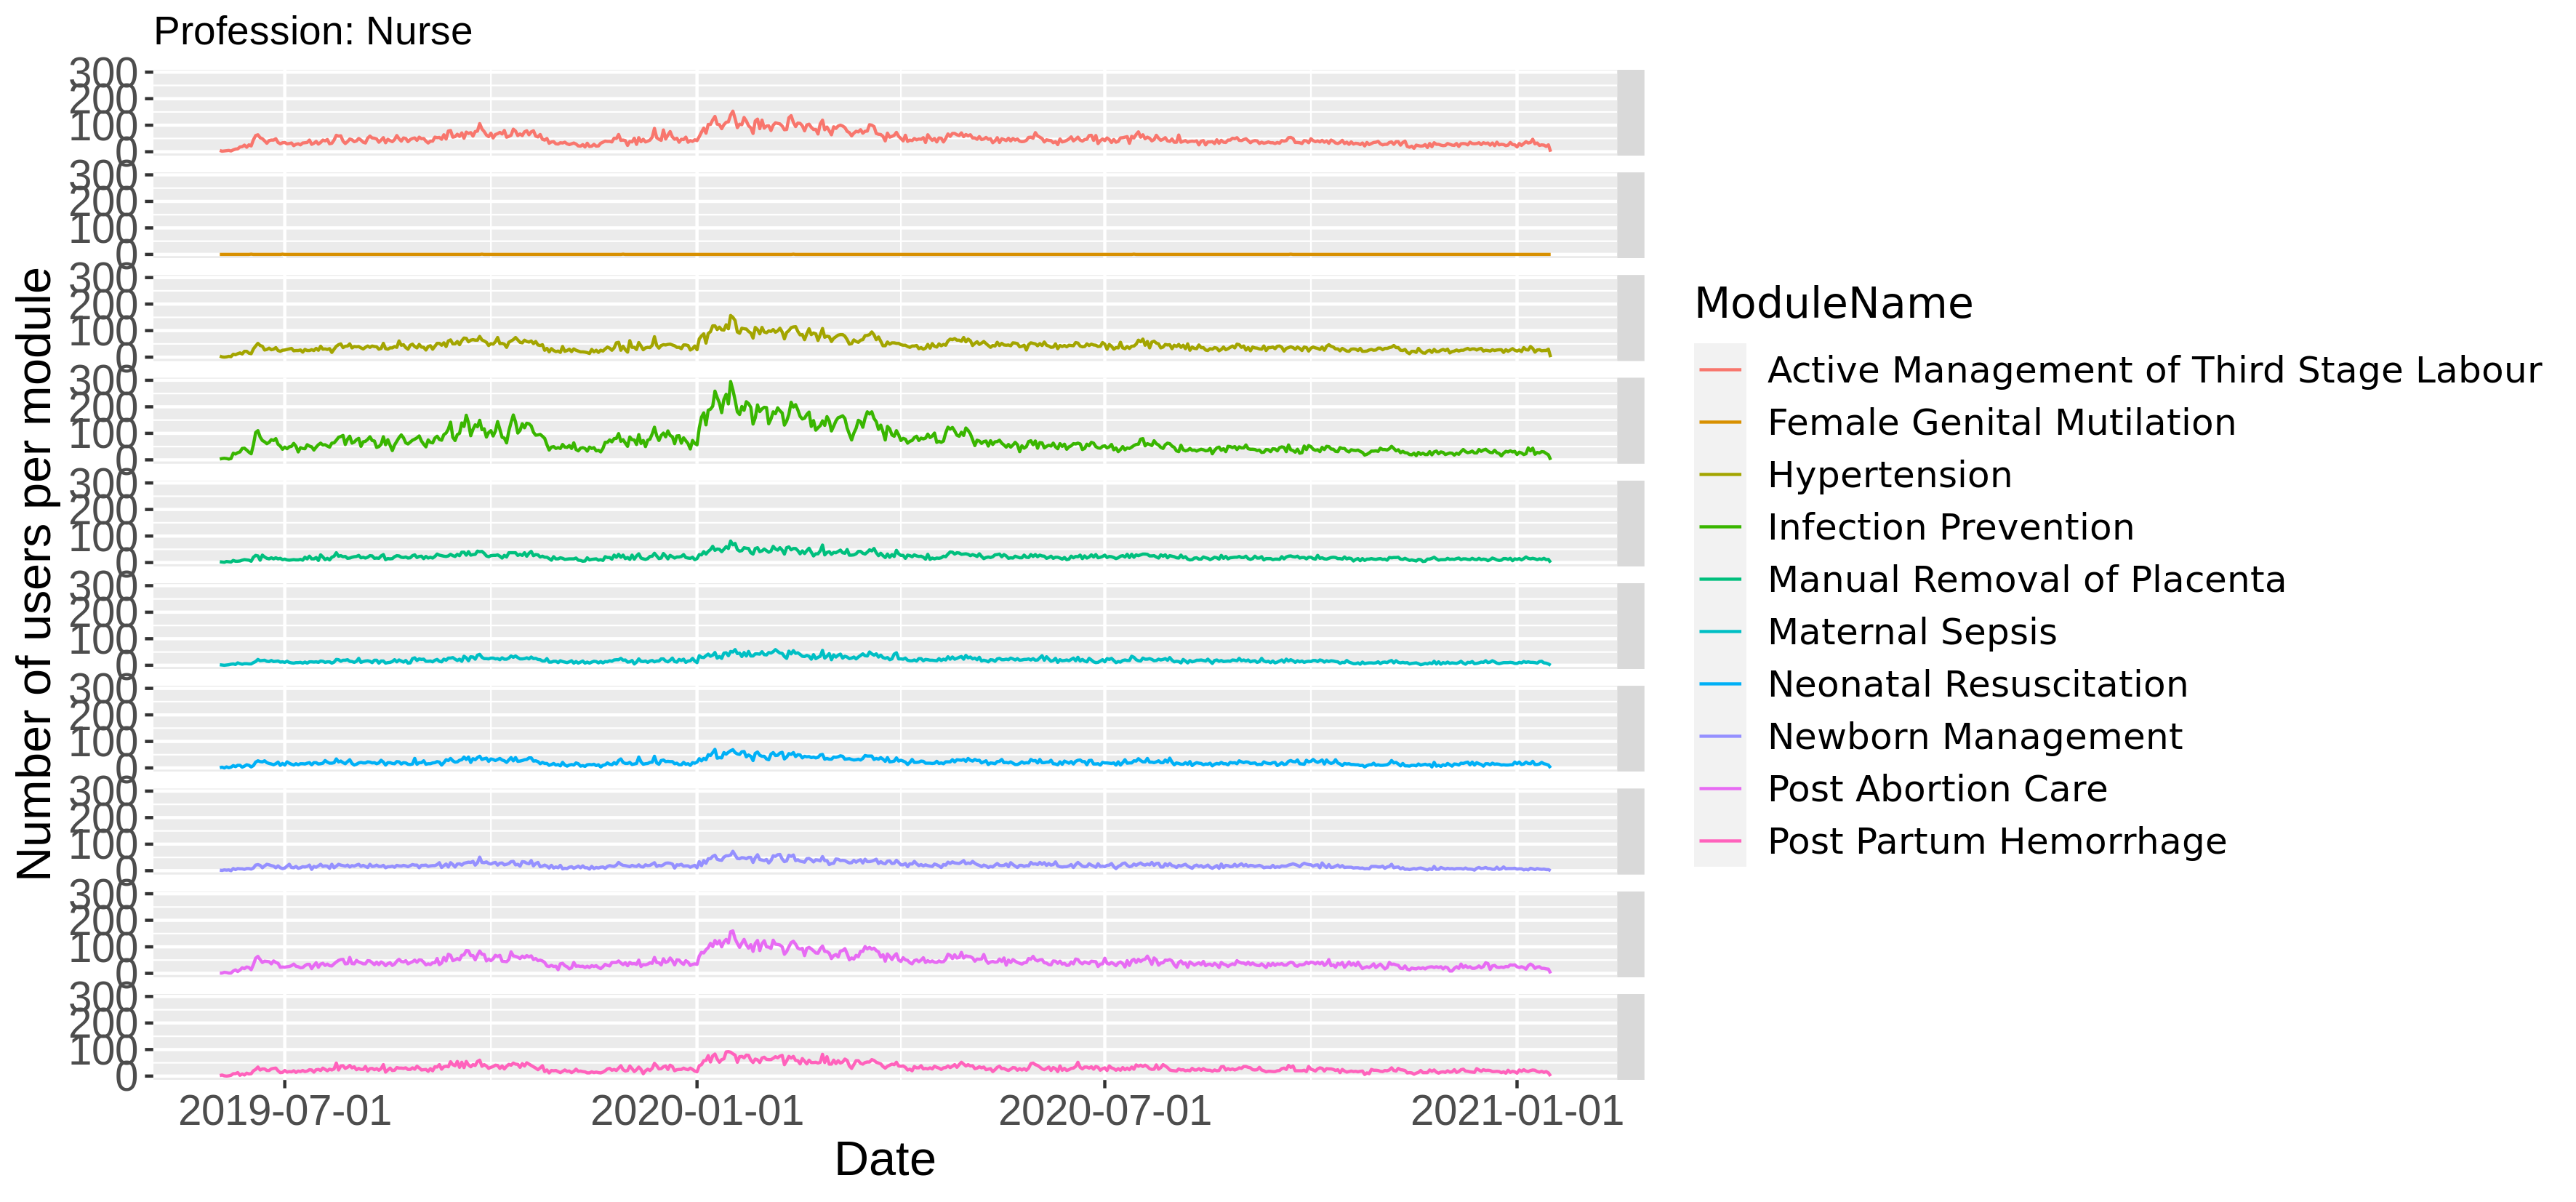
Safe Delivery App is organized in several learning topics, known as modules: Active Management of Third Stage Labour, Female Genital Mutilation, Hypertension, Infection Prevention, Manual Removal of Placenta, Maternal Sepsis, Neonatal Resuscitation, Newborn Management, Post Abortion Care and Post Partum Hemorrhage. The possible professions of the app users (as self-reported by them on first login) are: Midwife, Nurse, Other skilled birth attendant, Physician or Student.
Data were collected from 2019-05-01 to 2021-01-14, and the results shown correspond to a sample of 20,422 users from India. We built daily time series of module usage per profession, showing the number of professionals that accessed a particular module per day, and took them as a proxy for the demand for that specific content. Figure 1 presents the time series for various modules in the case of nurses. Even though all modules show a similar overall usage trend, each series exhibits different scale and usage patterns. Similar series are obtained for the other professions. Our goal is to predict the app usage per profession, in order to personalize the content and get a better grasp of usage dynamics.
2.2. Model specification
The goal was to predict the daily values of the usage time series for each month and each module-profession combination, training the model with all the available data until the end of the previous month. Cross-validation was performed using a rolling window (Racine, 2000; Cerqueira et al., 2020) from 2020-06-01 to 2020-12-01,considering all historical data before the prediction date for the training samples and 30 days of data before the prediction date for the test sample (training samples were split into training and validation sets). The final configuration was selected as the one that got the best results in the cross-validation rolling-window process. All models used the profession and module as categorical features, and the day of the month, day of the week, month and year as covariates. The inclusion of COVID-19-related covariates and information on the Safe Delivery App training for healthcare professionals was tested but did not result in any clear improvement.
Regarding the specifications of each method, the SARIMA forecasting was performed using the auto-ARIMA functionality, which means that all combinations of regular polynomials up to degree 5, seasonal polynomials up to degree 2, up to 2 regular and up to 1 seasonal differences were tried, using the Akaike Information Criterion to select the best of them. Our neural network with categorical embeddings had 3 fully connected layers with 1000, 500 and 1 cells; the activation function for the dense layers was ReLU for the first and a sigmoid for the second layer, and we used the mean absolute error as the loss function and Adam as the optimization method. The best performing DeepAR model was found to be that using 20 2-layer LSTM cells, a negative binomial distribution, a dropout rate of 0.01, 300 epochs and a training batch size of 30. The selected GP-Copula variant had exactly the same settings, except that only 5 epochs were considered—as this method is much more computationally intensive and the model was already reaching convergence.
2.3. Results
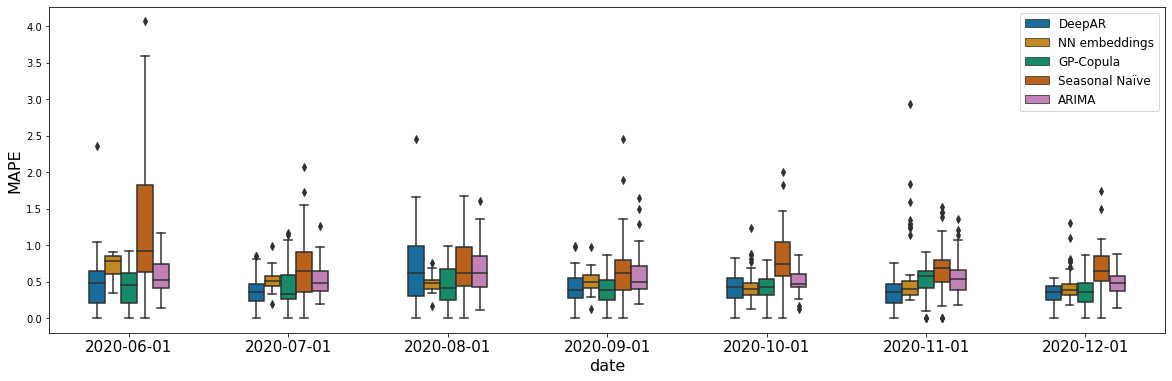
Most of the forecasting models evaluated were able to capture the trend of the time series, with results differing mainly in the estimation of the daily patterns specific to each time series. Results are summarized in Table 1, which shows several error metrics averaged over across all monthly predictions. These are: Mean Absolute Scaled Error (MASE), Mean Absolute Percentage Error (MAPE), Symmetric Mean Absolute Percentage Error (sMAPE), Root Mean Squared Error (RMSE) and Mean Squared Error (MSE) (Botchkarev, 2019). In Figure 2 the boxplot distribution of the individual MASE scores are displayed for each model and for each prediction month. We can observe that for more recent months, the scores tend to be lower, partially due to the enlargement of the historic data used in the training sample.
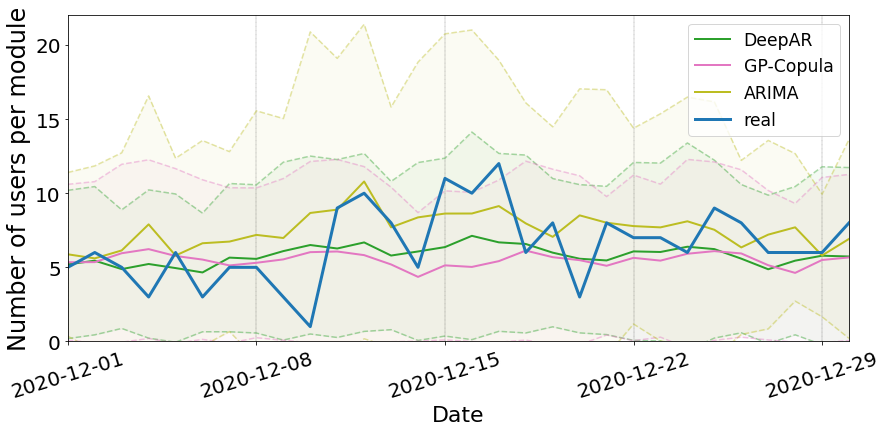
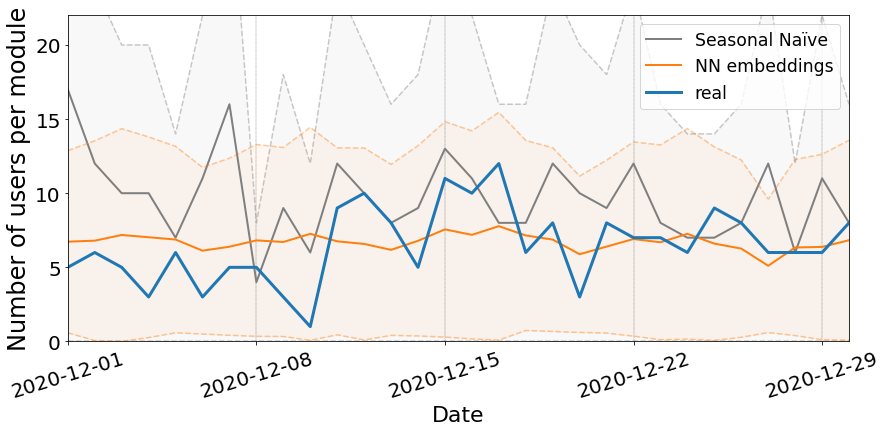
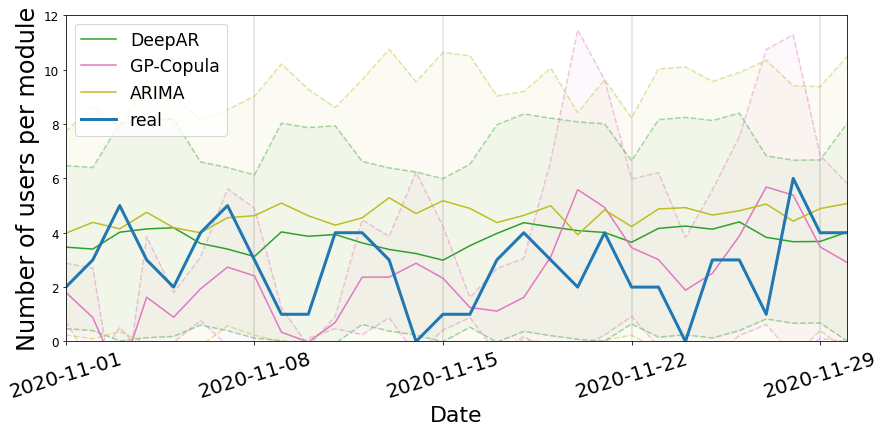
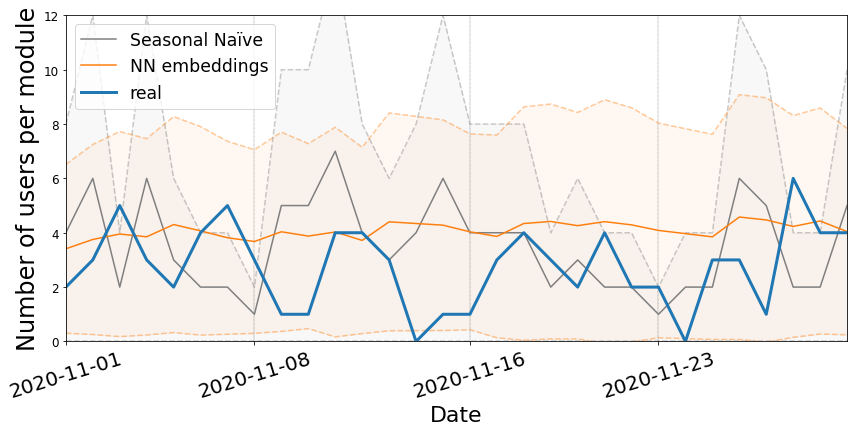
Figures 3 and 4 shows an example of the forecasts for each model. It illustrates that, while the performance of the DeepAR and GP-Copula methods is relatively similar (left panel), the former shows a tighter 50% confidence prediction interval that fits better the shape of the actual series. The ARIMA model also produced remarkably accurate predictions, which accounts for its extended use even nowadays that more sophisticated methods are available, although it shows a larger forecast uncertainty (as shown by the wider confidence interval). The forecasts for the other evaluated models are displayed in the right panel. The GP-Copula model trained over just 5 epochs performs similarly than the DeepAR model trained over 300 epochs, though it still needs more time and resources. For that reason, DeepAR would be the preferred option in a production environment. However, if higher accuracy were critical and there were no constraints on computational time and resources, the use of GP-Copula with an increased number of epochs would be justified.
3. Summary and conclusion
Overall, we found that the DeepAR and GP-Copula deep learning models are the most accurate for daily forecasting of the content demand. This result holds across different contents (modules) and user types (professions), as these two models show less error variability in the overall results of each individual time series. Other models such as Facebook’s Prophet (Taylor and Letham, 2018) and DeepVAR (the simplest multivariate extension of DeepAR) (Salinas et al., 2019), both with their default settings, were also tested but performed worse than the ARIMA benchmark, so they were not included in the analysis.
Although the evaluated dataset corresponds to India, this methodology shows potential to be applied to different countries or geographical areas, and also to additional contents. DeepAR constitutes a generalizable model that can correctly capture the trend behavior of the time series and anticipate user demand for a particular content depending on the user profile. We provided a solution that could be used in operational settings to get real-time demand estimates, due to the flexibility and speed of the model implementation.
Data
All data used in this analysis comes from the Safe Delivery App logs and belongs to the Maternity Foundation. For inquiries regarding its use, please contact them at mail@maternity.dk.
Acknowledgements.
The authors wish to thank Javier Grande and Wei Xiang Low for their careful review of the manuscript. This work was supported, in whole or in part, by the Bill & Melinda Gates Foundation INV-022480. Under the grant conditions of the Foundation, a Creative Commons Attribution 4.0 Generic License has already been assigned to the Author Accepted Manuscript version that might arise from this submission.References
- (1)
- Alexandrov et al. (2020) Alexander Alexandrov, Konstantinos Benidis, Michael Bohlke-Schneider, Valentin Flunkert, Jan Gasthaus, Tim Januschowski, Danielle C Maddix, Syama Rangapuram, David Salinas, Jasper Schulz, et al. 2020. GluonTS: Probabilistic and Neural Time Series Modeling in Python. Journal of Machine Learning Research 21, 116 (2020), 1–6.
- Botchkarev (2019) Alexei Botchkarev. 2019. A New Typology Design of Performance Metrics to Measure Errors in Machine Learning Regression Algorithms. Interdisciplinary Journal of Information, Knowledge, and Management 14 (2019), 045–076. https://doi.org/10.28945/4184
- Box and Jenkins (1990) George Edward Pelham Box and Gwilym Jenkins. 1990. Time Series Analysis, Forecasting and Control. Holden-Day, Inc., USA.
- Cerqueira et al. (2020) Vitor Cerqueira, Luis Torgo, and Igor Mozetič. 2020. Evaluating time series forecasting models: An empirical study on performance estimation methods. Machine Learning 109, 11 (2020), 1997–2028.
- Chen et al. (2015) Tianqi Chen, Mu Li, Yutian Li, Min Lin, Naiyan Wang, Minjie Wang, Tianjun Xiao, Bing Xu, Chiyuan Zhang, and Zheng Zhang. 2015. MXNet: A Flexible and Efficient Machine Learning Library for Heterogeneous Distributed Systems. arXiv:1512.01274 https://arxiv.org/abs/1512.01274
- Chollet et al. (2015) Francois Chollet et al. 2015. Keras. Keras. https://github.com/fchollet/keras
- del Río et al. (2021) Ana Fernández del Río, Anna Guitart, and África Periáñez. 2021. A Time Series Approach to Player Churn and Conversion in Videogames. In Intelligent Data Analysis, vol. 25, no. 1. 177 – 203. https://doi.org/10.3233/IDA-194940
- for Child Mortality Estimation (2020) United Nations. Interagency Group for Child Mortality Estimation. 2020. Levels & Trends in Child Mortality: Report 2020: Estimates Developed by the UN Inter-Agency Group for Child Mortality Estimation. United Nations Children’s Fund.
- Foundation (2021a) Maternity Foundation. 2021a. Maternity Foundation. https://www.maternity.dk/. Accessed: 2021-05-20.
- Foundation (2021b) Maternity Foundation. 2021b. Safe Delivery App. https://www.maternity.dk/safe-delivery-app/. Accessed: 2021-05-20.
- Fund (2020) United Nations Population Fund. 2020. Cost of Ending Preventable Maternal Deaths. In Costing the three transformative results. 11–17. {https://www.unfpa.org/sites/default/files/pub-pdf/Transformative_results_journal_23-online.pdf}
- Guitart et al. (2018) Anna Guitart, Pei Pei Chen, Paul Bertens, and África Periáñez. 2018. Forecasting Player Behavioral Data and Simulating in-Game Events. In 2018 IEEE Conference on Future of Information and Communication Conference (FICC). IEEE, Singapore.
- Guo and Berkhahn (2016) Cheng Guo and Felix Berkhahn. 2016. Entity Embeddings of Categorical Variables. arXiv:1604.06737 https://arxiv.org/abs/1604.06737
- Hosny and Aerts (2019) Ahmed Hosny and Hugo JWL Aerts. 2019. Artificial intelligence for global health. Science 366, 6468 (2019), 955–956.
- Hyndman and Khandakar (2008) R. Hyndman and Yeasmin Khandakar. 2008. Automatic Time Series Forecasting: The forecast Package for R. Journal of Statistical Software 27 (2008), 1–22.
- Lawn et al. (2016) Joy E Lawn, Hannah Blencowe, Peter Waiswa, Agbessi Amouzou, Colin Mathers, Dan Hogan, Vicki Flenady, J Frederik Frøen, Zeshan U Qureshi, Claire Calderwood, et al. 2016. Stillbirths: rates, risk factors, and acceleration towards 2030. The Lancet 387, 10018 (2016), 587–603.
- LeCun et al. (2015) Yann LeCun, Yoshua Bengio, and Geoffrey Hinton. 2015. Deep Learning. Nature 521, 7553 (2015), 436–444. https://doi.org/10.1038/nature14539
- Marsch (2021) Lisa A Marsch. 2021. Digital health data-driven approaches to understand human behavior. Neuropsychopharmacology 46, 1 (2021), 191–196.
- Nove et al. (2021) Andrea Nove, Ingrid K Friberg, Luc de Bernis, Fran McConville, Allisyn C Moran, Maria Najjemba, Petra ten Hoope-Bender, Sally Tracy, and Caroline SE Homer. 2021. Potential impact of midwives in preventing and reducing maternal and neonatal mortality and stillbirths: a Lives Saved Tool modelling study. The Lancet Global Health 9, 1 (2021), e24–e32.
- O’Connor (2018) Siobhan O’Connor. 2018. Big data and data science in health care: What nurses and midwives need to know. Journal of Clinical Nursing 27, 15-16 (2018), 2921–2922. https://doi.org/10.1111/jocn.14164
- Organization and UNICEF (2014) World Health Organization and UNICEF. 2014. Every newborn: an action plan to end preventable deaths. (2014).
- Papastefanopoulos et al. (2020) Vasilis Papastefanopoulos, Pantelis Linardatos, and Sotiris Kotsiantis. 2020. Covid-19: A comparison of time series methods to forecast percentage of active cases per population. Applied Sciences 10, 11 (2020), 3880.
- Racine (2000) Jeff Racine. 2000. Consistent cross-validatory model-selection for dependent data: hv-block cross-validation. Journal of econometrics 99, 1 (2000), 39–61.
- Salinas et al. (2019) David Salinas, Michael Bohlke-Schneider, Laurent Callot, Roberto Medico, and Jan Gasthaus. 2019. High-dimensional multivariate forecasting with low-rank Gaussian Copula Processes. In Advances in Neural Information Processing Systems, H. Wallach, H. Larochelle, A. Beygelzimer, F. d'Alché-Buc, E. Fox, and R. Garnett (Eds.), Vol. 32. Curran Associates, Inc., Vancouver, Canada. https://proceedings.neurips.cc/paper/2019/file/0b105cf1504c4e241fcc6d519ea962fb-Paper.pdf
- Salinas et al. (2020) David Salinas, Valentin Flunkert, Jan Gasthaus, and Tim Januschowski. 2020. DeepAR: Probabilistic forecasting with autoregressive recurrent networks. International Journal of Forecasting 36, 3 (2020), 1181–1191. https://doi.org/10.1016/j.ijforecast.2019.07.001
- Taylor and Letham (2018) Sean J Taylor and Benjamin Letham. 2018. Forecasting at scale. The American Statistician 72, 1 (2018), 37–45.
- Wahl et al. (2018) Brian Wahl, Aline Cossy-Gantner, Stefan Germann, and Nina R Schwalbe. 2018. Artificial intelligence (AI) and global health: how can AI contribute to health in resource-poor settings? BMJ global health 3, 4 (2018), e000798.
- World Health Organization and Bank (2019) United Nations Population Fund World Health Organization, UNICEF and The World Bank. 2019. Trends in maternal mortality: 2000 to 2017: estimates by WHO, UNICEF.
- Xu and Chan (2019) Shuojiang Xu and Hing Kai Chan. 2019. Forecasting medical device demand with online search queries: A big data and machine learning approach. Procedia Manufacturing 39 (2019), 32–39.