A search for active galactic nuclei in low-mass compact galaxies
Abstract
Low-mass compact galaxies (ultracompact dwarfs -UCDs- and compact ellipticals -cEs-) populate the stellar size-mass plane between globular clusters and early-type galaxies. Known to be formed either in-situ with an intrinsically low mass or resulting from the stripping of a more massive galaxy, the presence of a supermassive or an intermediate-mass black hole (BH) could help discriminate between these possible scenarios. With this aim, we have performed a multiwavelength search of active BH activity, i.e. active galactic nuclei (AGN), in a sample of 937 low-mass compact galaxies (580 UCDs and 357 cEs). This constitutes the largest study of AGN activity in these types of galaxies. Based on their X-ray luminosity, radio luminosity and morphology, and/or optical emission line diagnostic diagrams, we find a total of 11 cEs that host an AGN. We also study for the first time the location of both low-mass compact galaxies (UCDs and cEs) and dwarf galaxies hosting AGN on the BH-galaxy scaling relations, finding that low-mass compact galaxies tend to be overmassive in the BH mass-stellar mass plane but not as much in the BH mass-stellar velocity dispersion correlation. This, together with available BH mass measurements for some of the low-mass compact galaxies, supports a stripping origin for the majority of these objects that would contribute to the scatter seen at the low-mass end of the BH-galaxy scaling relations. However, the differences are too large to be explained solely by this scatter, and thus our results suggest that a flattening at such low-masses is also plausible, happening at a velocity dispersion of 20-40 km s.
keywords:
galaxies: evolution – galaxies: formation – galaxies: kinematics and dynamics – galaxies: stellar content – galaxies: supermassive black hole – galaxies:AGN1 Introduction
The low-mass end of the realm of early-type galaxies (ETGs) has been populated in the recent years by a series of compact objects found to bridge the gap between globular clusters and massive ETGs (e.g. Brodie et al. 2011; Misgeld & Hilker 2011). With characteristic stellar sizes and stellar masses ( ) defining the transitions from one type to the other, the origin of these families are still strongly debated.
From one side, there are the lowest-mass and most compact galaxies, the so-called ultra compact dwarfs (UCDs), which range from 106 ≲ (M⊙) and have sizes with effective radii () between 10 and 100pc. Following an intrinsic formation channel, UCDs have been proposed to simply be the massive end of the globular cluster family (e.g. Mieske et al. 2012) or to result from young massive star clusters being aggregated during violent gas-rich galaxy mergers (e.g. Fellhauer & Kroupa 2002; Brüns et al. 2011; Mahani et al. 2021). However, UCDs could also be the leftovers of a larger and more massive galaxy that lost the majority of its stellar mass due to external processes, such as tidal or ram-pressure stripping (e.g. Faber 1973; Bekki et al. 2001; Drinkwater et al. 2003). The progenitor galaxy is expected to be typically a dwarf elliptical or a low-mass ETG. The majority of these progenitor galaxies are expected to host a nuclear star cluster (NSC) in their centers. Therefore, what is left behind as UCD would be the threshed NSC (in the case of the low-mass UCDs, M⊙) while for more massive UCDs ( M⊙) it would be NSC surrounded by a diffuse region that contains part of the progenitor galaxy remains (e.g. Evstigneeva et al. 2007; Pfeffer & Baumgardt 2013).
Similar formation channels are also proposed for the slightly more massive counterparts, the compact ellipticals (cEs), coming in both flavours of intrinsic and external processes. cEs populate the regime 108 ≲ (M⊙) and have sizes between 100 (pc) 900. They can also be the result of the removal of stars from a more massive ETG, a spiral galaxy (e.g. Bekki et al. 2003; Graham & Guzmán 2003) or from a compact massive galaxy (Ferré-Mateu et al., 2021). While being the remnant of a NSC+diffuse part is plausible at these higher stellar masses, the occupation fraction of NSC decreases with increasing stellar mass and by M⊙the object that dominates in the center of the galaxy will be a black hole (BH; e.g. Ferrarese et al. 2006; Côté et al. 2006). Therefore, in the case of cEs, whose progenitor tends to be more a massive galaxy, the remnant is more similar to the innermost part of high-redshift red nuggets (e.g. Huang et al. 2013; Zolotov et al. 2015); see Fig. 4 in Ferré-Mateu et al. 2021 for a review on the formation channels of cEs). Alternatively, cEs could also be intrinsically low mass, compact objects that formed as we see them today (Wirth & Gallagher 1984; Kormendy et al. 2009; Kormendy & Bender 2012).
Observational evidence for these different origins have been found, from compact galaxies caught in the act of being stripped (e.g. Chilingarian et al. 2009; Huxor et al. 2011; Paudel et al. 2013; Chilingarian & Zolotukhin 2015; Ferré-Mateu et al. 2018a) to the existence of them in isolated places that would make the stripping process impossible (e.g. Paudel & Ree 2014; Ferré-Mateu et al. 2018a; Kim et al. 2020). In terms of simulations, Bekki et al. (2001), Pfeffer & Baumgardt (2013); Pfeffer et al. (2016) and Goodman & Bekki (2018) have reproduced the stripping path for UCDs, whereas Martinović & Micic (2017), Du et al. (2019) and Urrutia Zapata et al. (2019) have shown that both being formed in-situ as low-mass galaxies but also being the result of stripping larger galaxies can reproduce the observed properties of cEs. Although the numbers of both families are still very limited, understanding their nature is vital to understand the complete baryonic budget of the Universe, and thus obtaining the proportion of in-situ formed (intrinsic) vs external processes (stripping) objects in each family is a critical effort. Some works have already tried to address these different origins via the study of their kinematics, stellar populations and other relevant properties (e.g. Chilingarian et al. 2008, 2009; Norris et al. 2014; Janz et al. 2015; Chilingarian & Zolotukhin 2015; Ferré-Mateu et al. 2018a; Kim et al. 2020; Ferré-Mateu et al. 2021).
However, one characteristic still remains quite elusive to date: the existence or not of BHs at their centers. Typically, both UCDs and cEs show enhanced ratios of dynamical-to-stellar masses (e.g. Chilingarian et al. 2008; Mieske et al. 2013; Forbes et al. 2014; Janz et al. 2015; Ferré-Mateu et al. 2018a; Ferré-Mateu et al. 2021). While this could be the effect of a different initial mass function (e.g. Mieske et al. 2008; Ferré-Mateu et al. 2013) or accounted by the presence of large dark matter halos (e.g. Hasegan 2007; Chilingarian et al. 2008), the most plausible explanation is that they host a BH at their centers. If UCDs and cEs are formed intrinsically, it is expected that they will host BHs that follow the scaling relations: ranging from the elusive intermediate-mass BHs (IMBHs; –105M⊙) in the case of UCDs, up to the lower limit of super-massive BHs (SMBHs; M⊙) for the cEs. Although the presence of IMBHs could also be expected as the result of runaway merging (Shi et al., 2020), it would not be expected if low-mass compact objects follow a stripping formation channel. In such cases, one would expect to find SMBHs of –109M⊙. As the progenitor galaxy is expected to follow the scaling relations governing massive galaxies up to the stripping event, the aftermath will be an untouched BH in the center. Therefore, these galaxies will appear as outliers in the local BH-galaxy scaling relations (e.g. Ferré-Mateu et al. 2015; van Son et al. 2019).
Tens of IMBH candidates have been found in dwarf galaxies as low-mass ( M⊙) active galactic nuclei (AGN); however, most of these dwarf galaxies are either star-forming or of late-type (e.g. Jiang et al. 2011; Mezcua et al. 2016, 2018a; Mezcua & Domínguez Sánchez 2020; Chilingarian et al. 2018; Kimbrell et al. 2021; see Mezcua 2017; Greene et al. 2020 for reviews). Therefore, the number of detected BHs in low-mass compact galaxies is extremely scarce. The majority of such detections have been reported in UCDs (e.g. Seth et al. 2014; Ahn et al. 2017, 2018; Afanasiev et al. 2018 and Voggel et al. 2018; Voggel et al. 2019), with the caveat that they are limited to UCDs with relatively high stellar masses (M⊙ ) and therefore the measured BH masses measured to date are compatible with being all SMBHs ( M⊙). The number of cEs with reported BHs is even lower (e.g. M32, van der Marel et al. 1997; J085431.18+173730.5, Paudel et al. 2016; or NGC 741, Schellenberger et al. 2017).
Motivated by these findings, we aim at searching for AGN signatures indicative of the presence of an active BHs at the centers of UCDs and cEs. This can help further discriminate between the possible origins for these galaxies and pose constraints on the formation channels of the objects in the compact low-mass end. We first search for X-ray signatures, following a similar approach as in Pandya et al. (2016) and Hou & Li (2016). They both found a detection rate of 3, consistent in all cases with low-mass X-ray binaries. Here, we complement these works by extending the search in a larger sample of spectroscopically confirmed UCDs and include, for the first time, a number of known cEs. The search is thus done to a total sample of 937 objects, making this the largest dataset of low-mass compact galaxies to date (Section §2). In addition to the search in X-rays, we also search for AGN signatures in the optical, infrared, and radio regimes (Section §3). The results obtained are presented in Section §4, and we discuss on the implications for the type of BHs in these objects in Section §5. Final conclusions are provided in Section §6.
2 Sample
We compile the largest available sample of low-mass compact galaxies comprising fiducial UCDs and cEs that can be found in the literature, checking for duplicates within compilations. We have focused on those samples with spectroscopic identifications to confirm their galaxy type. Most of the sources included have also other relevant information available, such as the stellar mass and galaxy size. Although UCDs are less massive and more compact than cEs, they have been detected in larger numbers and therefore our sample is biased towards larger numbers of UCDs.
This way, we build our sample by considering the UCDs from Pandya et al. (2016), the largest compilation to date. While it consists of 578 UCDs, several of them are only candidates as they are not spectroscopically confirmed. For this work we select only the confirmed cases (227). We then add those in Fahrion et al. (2019) that are not found in common (137 UCDs more). We note that the sample of Hou & Li (2016) is not included here as there is no information separating the UCDs from the extended stellar clusters, but there is a large overlap in objects from the previous catalogues. We also include UCDs in the Virgo cluster from different works (Liu et al. 2015; Zhang et al. 2018; Forbes et al. 2020; 96 UCDs) and a sample of 20 UCDs around NGC 3115 (Dolfi et al., 2020). We also consider those compact galaxies from the compilation of Norris et al. (2014), which is a mixture of both UCDs (97) and cEs (39). We also add cEs from the Sloan Digital Sky Survey (SDSS) compilations, from both Chilingarian & Zolotukhin (2015) and Kim et al. (2020) (195 and 101, respectively, private communication for the Kim et al. 2020 catalogue). Furthermore, we include cEs in the Virgo cluster from Guérou et al. (2015) and other new cEs from Ferré-Mateu et al. (2018a) and Ferré-Mateu et al. (2021). Some other individual objects that have well studied properties have also been included in our search, such as NGC7727-Nuc2 (Schweizer et al., 2018), NGC5044-UCD1 (Faifer et al., 2017), and one cE which is a known AGN (Paudel et al., 2016).
We have to warn here about a possible caveat regarding the Norris et al. (2014) sample, which is that it does not differentiate between globular clusters and UCDs. While globular clusters are typically selected as having log M 5 M⊙, the fact that some UCDs are expected to be the massive tail of globular clusters results in the 6 log ( /M⊙) 7 regime being a mixture of both types, in what is known as a transition zone (e.g. Brodie et al. 2011; Norris et al. 2014). Therefore, a stellar mass cut alone is not enough to separate them. A size cut is not recommended either as, although UCDs have been typically described as having a size 10 pc, many have been found with smaller sizes (e.g. Forbes et al. 2014). Because of this, we apply a magnitude cut in addition to the one following Mieske et al. (2012), with UCDs having M10.25. This ensures that no globular clusters are included in the sample.
Table 1 summarizes the different works used to create our sample, with the number of galaxies of each type used. In total, we consider 937 low-mass compact galaxies (357 cEs and 580 UCDs). The sampled galaxies span out to z=0.113.
| #UCDs | #cEs | |
| Chilingarian & Zolotukhin (2015) | - | 195 |
| Guérou et al. (2015) | - | 7 |
| Ferré-Mateu et al. (2018a), (2021) | - | 15 |
| Kim et al. (2020) | - | 101 |
| Norris et al. (2014) | 97 | 39 |
| Liu et al. (2015); Zhang et al. (2018) | 87 | - |
| Pandya et al. (2016); Fahrion et al. (2019) | 364 | - |
| Dolfi et al. (2020) | 20 | - |
| Forbes et al. (2020) | 9 | - |
| Other literature | 3 | 1 |
| TOTAL = 937 | 580 | 357 |
| ID | Separation | ||
|---|---|---|---|
| (arcsec) | (erg s-1 cm-2) | (erg s-1) | |
| (1) | (2) | (3) | (4) |
| FCOS0-2023 | 0.3 | 1.3 | 8.4 |
| FCOS1-2095 | 0.1 | 1.3 | 6.1 |
| FCOS1-060 | 0.3 | 1.9 | 5.1 |
| VHH81-C3 | 0.6 | 9.1 | 7.0 |
| Sombrero-UCD1 | 0.5 | 1.0 | 4.2 |
| NGC4649_J67 | 2.8 | 9.2 | 2.8 |
| NGC0821-AIMSS1 | 0.7 | 1.5 | 1.1 |
| NGC0821-AIMSS2 | 0.5 | 2.5 | 1.9 |
| M60-UCD1 | 0.6 | 8.2 | 2.5 |
| M87-UCD2 | 1.3 | 3.4 | 1.4 |
| M87-UCD6 | 0.9 | 8.0 | 3.2 |
| HCH99-18 | 0.1 | 2.1 | 1.5 |
| J124352.42+112534.2 | 1.1 | 4.5 | 1.4 |
| gregg22 | 1.3 | 9.1 | 4.5 |
| gregg31 | 1.9 | 5.4 | 2.7 |
| gregg41 | 2.2 | 2.0 | 9.8 |
| VCC1499 | 2.3 | 1.1 | 3.2 |
| HCH99-16 | 0.2 | 4.4 | 3.2 |
| M85-HCC1 | 0.2 | 3.3 | 4.4 |
| UCD20 | 0.7 | 2.7 | 2.9 |
| HHH86-C15 | 0.8 | 3.2 | 2.3 |
| HCH99-21 | 0.9 | 4.7 | 3.5 |
| Nuc2_NGC7727 | 0.4 | 7.3 | 6.3 |
| NGC4486B | 0.5 | 4.6 | 2.8 |
| PCG012519 | 3.8 | 6.7 | 1.8 |
| VCC1178 | 0.2 | 3.0 | 1.1 |
| VCC1192 | 0.2 | 1.1 | 5.5 |
| M32 | 0.5 | 2.5 | 1.8 |
| NGC 741 | 5.5 | 4.5 | 3.5 |
| NGC 2970 | 0.8 | 4.0 | 2.2 |
Column designation: (1) Galaxy Name; (2) separation between the optical and X-ray position; (3) X-ray flux at 0.5-7 keV; (4) X-ray luminosity at 0.5-7 keV. The solid line separates the UCDs (top) from the cEs (bottom).
3 Data Analysis
3.1 X-ray emission
To look for X-ray emission we use the Chandra Source Catalog (Evans et al., 2010) Version 2 (CSC 2.0) Master Source Catalog. In CSC 2.0 the detection of a source is based on a Maximum Likelihood Estimation 111https://cxc.cfa.harvard.edu/csc/columns/significance.html. We use a rather wide initial search radius of 10 arcsec to account for the range of sizes of the objects (Pandya et al. 2016 used a more restrictive matching radius of 1.5 arcsec because their sample was limited to UCDs, unlike in this work where cEs are also included). However, we later perform an independent visual inspection of each of the CSC detections to ensure that the position of the X-ray emission falls within the optical extent of the host galaxy in either SDSS, Hubble Space Telescope, or DESI Legacy Survey DR8222https://www.legacysurvey.org/dr8/description/ images, upon availability. We discard those detections that are clearly not related to the compact galaxy, as is the case of all the UCDs with optical-X-ray position separations above 3 arcsec. For those sources with multiple observations, the data of all the in the best Bayesian Block (within which the source is considered to have a constant photon flux333http://cxc.harvard.edu/csc/data_products/master/blocks3.html) are merged in order to measure Point Spread Function (PSF) sizes and model simultaneously the spectral fits. Those sources located in the field or loose groups are fitted by a power-law model with column density free to vary and with i) photon index =1.8, typical of AGN and X-ray binaries (e.g. Corral et al. 2011; Mezcua et al. 2018a), and ii) thawed. The model that provides the best statistics (in terms of the reduced statistic rstat parameter) within a realistic range of when thawed (i.e. =0-4) is used to compute the spectral flux in the 0.57 keV band. For those sources located in a cluster we follow the same approach but adding a thermal background model defined by the Astrophysical Plasma Emission Code (APEC; Raymond & Smith 1977; Smith et al. 2001) that describes an emission spectrum from collisionally-ionized diffuse gas with the plasma temperature (kT) free to vary. The models we fit are redshifted models, so that the best fit parameters represent values intrinsic to the source and background. These are then used to get flux corrections to compute rest-frame fluxes. We note that using this approach we are able to derive a spectral flux for sources for which CSC does not provide an aperture flux. The X-ray luminosities in the 0.5-7 keV band are then computed from the spectral flux using the redshift of each source or cluster/group where the source is located (see Table 2).
3.2 Optical spectroscopy, mid-infrared and radio emission
We also check whether the sample of low-mass compact galaxies have SDSS spectra available in the DR14 444https://www.sdss.org/dr14/. We note that while it is very unlikely that there will be spectra available for the UCDs, cEs have been found in SDSS in large number (e.g. Chilingarian & Zolotukhin 2015; Kim et al. 2020) and the majority have spectra available. This allows us to identify AGN based on emission-line diagnostic diagrams such as the [OIII]/Hβ versus [NII]/Hα or [OIII]/Hβ versus [SII]/Hα (i.e. BPT diagram; Baldwin et al. 1981; Kewley et al. 2001, 2006; Kauffmann et al. 2003). To apply these diagnostics, we consider only those sources whose Hα, Hβ, [NII]6583, [SII]6717,6731, and [OIII]5007 emission lines have a signal-to-noise ratio 3. The remaining sources are considered as quiescent (e.g. Mezcua & Domínguez Sánchez 2020).
To identify AGNs in the mid-infrared regime we search for WISE counterparts at 3.6m, 4.5m and 5.8m or all the low-mass compact galaxies in our sample and apply the mid-infrared color-color cut of Jarrett et al. (2011) and Stern et al. (2012). We also search for radio emission at 1.4 GHz in the FIRST555Faint Images of the Radio Sky at Twenty Centimeters. (Becker et al., 1995) survey using a search radius of 5 arcsec, which is the angular resolution of the survey. In all cases, as done for the X-ray detections, those objects with detections have been visually inspected to confirm that the signature belongs to the compact source and not neighbouring or background objects.
4 Results
Out of the 937 low-mass compact galaxies compiled in this paper, 566 have Chandra observations (90 cEs and 476 UCDs). Of these, 30 are detected by the CSC 2.0, being 7 of them X-ray detections in cEs and 23 in UCDs. Before discussing the detection rates, we must caution about the selection bias that is inherent to our sample. The majority of UCDs in our sample belong to clusters because these are the places where most works have looked for them. Nearly 70% (16 out of 23) of the X-ray detected UCDs are in dense environments, which could explain the possible presence of gas available for accretion. Instead, the majority of the cEs belong to SDSS compilations and thus are more biased towards the field environment. Nearly 86% (6 out of 7) of the X-ray detected cEs are in the field or belong to loose groups, where they should be less prone to have gas available for accretion.
Nevertheless, the X-ray detection rates amongst UCDs and cEs are remarkably similar, being 7/90=7.8% for the cEs and of 23/476=4.8% for the UCDs assuming a detection limit erg s-1 (the lowest value detectable in our sample). A detection rate of 3 was found for the UCDs in Pandya et al. (2016), which is lower than our value. Hou & Li (2016) also report a detection rate of 3, but they include both UCDs and extended stellar clusters. Considering the same conditions as in Pandya et al. (completeness limit of erg s-1 and optical-to-X-ray position separations within 1.5 arcsec) we would obtain an X-ray detection rate of 1.5% for UCDs, closer to that of Pandya et al. (2016) but slightly lower given our larger number of UCDs even when applying their conditions (461 sources compared to the 149 of Pandya et al. 2016).
4.1 Origin of the X-ray emission
To search for AGNs amongst the 30 X-ray detected cEs and UCDs of Table 2, we apply a luminosity threshold of erg s-1, of the same order as the X-ray luminosity of the faintest AGN in dwarf galaxies (e.g. Baldassare et al. 2017; Mezcua et al. 2018a) and of those ultraluminous X-ray sources hosting IMBHs (e.g. Kim et al. 2015; Mezcua et al. 2018b). This results in one source: the cE NGC 741, which is a well-studied AGN at X-ray, optical, and radio wavelengths (e.g. Schellenberger et al. 2017; Kim et al. 2019) with a BH mass upper limit of log 8.67 derived from gas dynamics using Hubble Space Telescope/STIS spectroscopy (Beifiori et al. 2009; van den Bosch 2016).
The remaining sources have X-ray luminosities in the range erg s-1, and are thus consistent with being either X-ray binaries or ultraluminous X-ray sources powered by stellar-mass BHs or neutron stars with super-Eddington accretion (e.g. Bachetti et al. 2014; Fürst et al. 2016; Israel et al. 2017). This would be in agreement with the previous findings that the X-ray emission of UCDs is consistent with that from (low-mass) X-ray binaries (e.g. Pandya et al. 2016; Hou & Li 2016). We caution, however, that a weak level of SMBH accretion cannot be fully discarded at such X-ray luminosities. Assuming that low-mass compact galaxies with erg s-1 could be SMBHs accreting at an Eddington ratio of , as confirmed for M60-UCD1 (Hou & Li 2016), we can use the relation = (, where , assuming a bolometric correction factor of = 10 (e.g. Duras et al. 2020). We caution the reader about using these estimates as they rely on some assumptions that cannot be tested here. Comparing the estimated values with those for which there is a literature measurement, we find that while many are in fair agreement, others show almost two orders of magnitude difference, being our estimate typically larger than the measured. This means that these values should be treated, at most, as an upper limit. With this in mind, we find that the low-mass compact galaxies have BH masses in the range log = 6.5–9.0 M⊙, this is, more compatible with being a SMBH rather than an IMBH. This would support the stripped origin for the UCDs but is less clear for the seven cEs, which have BH estimates of –M⊙. We will further discuss these assumptions in Section 5.
| ID | SDSS | ||
|---|---|---|---|
| (erg s-1) | (erg s-1) | ||
| (1) | (2) | 3) | (4) |
| NGC 741 | – | 3.5 | 1.4 |
| J085431.18+173730.5 | QSO | – | – |
| J122427+271407 | – | – | 1.1 |
| k12 | AGN | – | – |
| k28 | AGN | – | – |
| k30 | AGN | – | – |
| k41 | AGN | – | – |
| k55 | AGN | – | – |
| k123 | – | – | 1.7 |
| k134 | AGN | – | – |
| VCC165-cE1 | AGN | – | – |
4.2 Other wavelengths
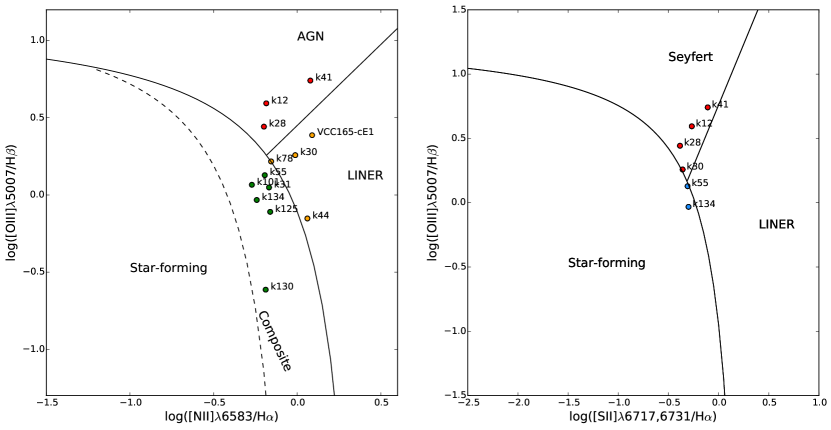
Of the 937 low-mass compact galaxies 312 have SDSS data, with only three of them being UCDs. This bias towards cEs is due to cEs being more massive and brighter than UCDs. Therefore, in most cases there are SDSS images available for them but not spectroscopy. Additionally, UCDs are found in large numbers inside clusters, so there is also the inherent bias of SDSS towards observations in the field. The different emission-line diagnostic diagrams are shown in Figure 1. Of the 312 low-mass compact galaxies with SDSS spectra, 13 have emission lines that would fulfill the signal-to-noise criteria required for the [OIII]/Hβ vs. [NII]/Hα diagram (left panel). 6 of them also fulfill the signal-to-noise criteria required for the [OIII]/Hβ vs. [SII]/Hα diagram (right panel), and one (J085431.18+173730.5) is a known quasar with broad emission lines (Paudel et al., 2016).
Three sources qualify as AGN in the [OIII]/Hβ versus [NII]/Hα, all of them being also an AGN in the [OIII]/Hβ versus [SII]/Hα (k12, k28, k41; shown in red in Figure 1). Three additional sources are classified as LINERs666Low Ionisation Emission Line Region. in the [OIII]/Hβ versus [NII]/Hα (k30, k44, VCC165-cE1), one of which is an AGN in the [OIII]/Hβ versus [SII]/Hα. Because the LINER emission can be produced not only by AGN but also by hot old stars with typically an Hα equivalent width EW(H) 3Å, we apply a diagnostic diagram EW(H) vs [NII]/Hα (i.e. the WHAN diagram; Cid Fernandes et al. 2010) to distinguish between the two processes. According to the WHAN diagram, two of the three LINERs qualify as AGN (k30 and VCC165-cE1). We also check how many of the Composite objects in the [OIII]/Hβ versus [NII]/Hα BPT, this is, those whose emission lines are ionized by a combination of both AGN and star formation processes, are classified as AGN in the WHAN diagram. We find that two of the Composites (k55 and k134) qualify as AGN according to the WHAN diagram.
The three BPT AGN and the four WHAN AGN are all cEs and have been also identified as AGN by Rey, Oh, & Kim (2021, submitted) and Bär et al. (2017). We refer the reader to these publications for a more detailed study of these AGN. They have not been observed by Chandra.
The total number of SDSS AGN candidates from our sample is thus of eight (seven based on the BPT and WHAN diagrams, one classified as a QSO with broad emission lines; Paudel et al. 2016), being all of them cEs (marked as AGN or QSO in Table 3). For J085431.18+173730.5, Paudel et al. (2016) derive a BH mass of 2.1 M⊙from the luminosity and width of the broad H emission line in the SDSS spectrum. For the remaining sources, we can estimate the BH mass using the scaling relation between the narrow line ratio and the width of the broad H emission line of Baron & Ménard (2019), which allows estimating BH masses from narrow emission lines only and has an uncertainty of at least 0.5 dex. Combining eqs. 1, 5, and 6 of Baron & Ménard (2019) we find:
| (1) |
where we use a scale factor =1.075 as in Baron & Ménard (2019). The bolometric luminosity is derived as (Netzer 2009):
| (2) |
where has been extinction-corrected using the reddening curves of Calzetti et al. (2000). Using eq. 1 we find a range of BH masses for the SDSS AGN candidates of log = 4.6-7.0 M⊙. Note that these values are on average lower than the ones obtained from the for the seven X-ray detected cEs in Section 4. Unfortunately, none of the cEs classified as AGN based on SDSS spectroscopy has an X-ray detection to compare the results. As with the BH mass estimated from the X-ray luminosity above, we caution the reader about using the values derived here in Eq. 1 and should only be considered as first order approximations.
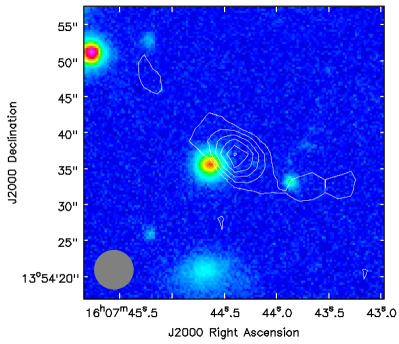
In the mid-infrared regime, 38 out of the 937 galaxies have a WISE counterpart; however, none of them qualifies as an AGN according to the color-color cuts of Jarrett et al. (2011) and Stern et al. (2012). Three out of the 937 galaxies have a FIRST counterpart within 5 arcsec: the cEs NGC 741-AIMSS1, k123 and J122427+271407. The radio emission is resolved in the three sources, with NGC 741-AIMSS1 and k123 showing extended, jet-like radio structures suggestive of AGN radio emission (see Fig. 2). NGC 741-AIMSS1 is indeed a known radio galaxy (e.g. Schellenberger et al. 2017). k123 and J122427+271407 have integrated fluxes at 1.4 GHz of 4.43 mJy and 2.34 mJy, respectively, which correspond to radio luminosities of erg s-1 and erg s-1, respectively, at the distance of the galaxies (see Table 3). They have a negligible star-formation rate from SDSS spectra. We note that the radio luminosities are of the same order as that of radio AGN in dwarf galaxies after removing the contribution from star formation to the radio emission ( erg s-1; e.g. Mezcua et al. 2019; Reines et al. 2020). Based on all the above, we thus consider k123 and J122427+271407 as strong AGN candidates. Our sample of possible AGN candidates thus contains a total of eleven objects (Table 3).
| Galaxy | RA | DEC | X-ray | AGN | Re | Lit | Eq.1 | G20 | |||
|---|---|---|---|---|---|---|---|---|---|---|---|
| (J2000) | (J2000) | det. | SDSS | (pc) | (km s) | (M⊙) | (M⊙) | (M⊙) | (M⊙) | (M⊙) | |
| (1) | (2) | (3) | (4) | (5) | (6) | (7) | (8) | (9) | (10) | (11) | (12) |
| FCOS0-2023 | 03:38:12.70 | -35:28:57.0 | Y | N | 4.0 | 15.3 | 6.7 | – | 8.3 | – | 3.9 |
| FCOS1-2095 | 03:38:33.82 | -35:25:57.0 | Y | N | 3.3 | 28.0 | 6.7 | – | 8.2 | – | 5.1 |
| FCOS1-060 | 03:39:17.67 | -35:25:30.2 | Y | N | 10.0 | 29.1 | 7.0 | – | 9.1 | – | 5.2 |
| VHH81-C3 | 13:24:58.21 | -42:56:10.0 | Y | N | 4.2 | 16.1 | 6.5 | – | 7.2 | – | 4.1 |
| Sombrero-UCD1 | 12:40:03.13 | -11:40:04.3 | Y | N | 14.7 | 31.9 | 7.2 | – | 8.0 | – | 5.4 |
| NGC4649_J67 | 12:43:38.50 | +11:33:02.7 | Y | N | 9.8 | – | 6.2 | – | 6.8 | – | – |
| NGC0821-AIMSS1 | 02:08:20.70 | +10:59:26.6 | Y | N | 6.5 | – | 6.7 | – | – | – | – |
| NGC0821-AIMSS2 | 02:08:20.70 | +10:58:55.5 | Y | N | 8.4 | – | 6.9 | – | 6.4 | – | – |
| M60-UCD1 | 02:43:36.00 | +11:32:04.6 | Y | N | 27.2 | 71.0 | 8.3 | 7.3 | – | – | 6.9 |
| M87-UCD2 | 02:30:48.00 | +12:24:33.0 | Y | N | – | – | – | – | 7.5 | – | – |
| M87-UCD6 | 02:30:47.54 | +12:24:24.1 | Y | N | – | – | – | – | 7.9 | – | – |
| HCH99-18 | 03:25:31.60 | -43:00:02.8 | Y | N | – | – | – | – | 7.6 | – | – |
| J124352.42+112534.2 | 12:43:52.42 | +11:25:34.2 | Y | N | – | – | – | – | 7.5 | – | – |
| gregg22 | 03:38:09.27 | -35:35:07.0 | Y | N | – | – | – | – | 8.0 | – | – |
| gregg31 | 03:38:21.84 | -35:25:13.8 | Y | N | – | – | – | – | 6.8 | – | – |
| gregg41 | 03:38:36.99 | -35:25:44.2 | Y | N | – | – | – | – | 7.4 | – | – |
| VCC1499 | 12:33:19.80 | +12:51:12.0 | Y | N | – | – | – | – | 7.9 | – | – |
| HCH99-16 | 13:25:30.29 | -42:59:34.8 | Y | N | 6.5 | – | 6.7 | – | 6.9 | – | – |
| M85-HCC1 | 12:25:22.84 | +18:10:53.7 | Y | N | – | – | – | – | 7.0 | – | – |
| UCD20 | 10:05:17.02 | -07:43:52.7 | Y | N | – | – | – | – | 6.8 | – | – |
| HHH86-C15 | 13:25:30.41 | -43:11:49.6 | Y | N | – | – | – | – | 6.8 | – | – |
| HCH99-21 | 13:25:34.65 | -43:03:27.7 | Y | N | – | – | – | – | 6.9 | – | – |
| Nuc2_NGC7727 | 23:39:53.80 | -12:17:34.0 | N | N | 27.4 | 79.0 | 8.2 | 6.5 | 8.2 | – | 7.1 |
| FornaxUCD3 | 03:38:54.0 | -35:33:34.0 | N | N | 87.2 | 25.0 | – | 6.1 | – | – | 4.9 |
| S999 | 12:30:45.91 | +12:25:01.8 | N | N | 21.3 | 26.0 | 6.6 | 7.4 | 8.2 | – | 5.0 |
| VUCD3 | 12:30:57.40 | +12:25:44.8 | N | N | 18.6 | 33.0 | 7.6 | 6.6 | 6.8 | – | 5.4 |
| M59cO | 12:41:55.33 | +11:40:03.7 | N | N | 32.1 | 29.0 | 8.3 | 6.8 | – | – | 5.2 |
| M59UCD3 | 12:42:11.05 | +11:38:41.3 | N | N | 25.0 | 78.0 | 8.6 | 6.6 | – | – | 7.1 |
| UCD320 | 13:25:52.70 | -43:05:46.6 | N | N | 6.8 | 19.0 | 6.4 | 6.0 | – | – | 4.4 |
| UCD330 | 13:25:54.30 | -43:05:46.6 | N | N | 3.3 | 30.5 | 6.7 | 5.0 | – | – | 5.3 |
| NGC4546-UCD1 | 12:35:28.70 | -03:47:21.1 | N | N | 25.5 | 21.8 | 7.6 | 6.0 | – | – | 4.6 |
| NGC4486B | 12:30:31.97 | +12:29:24.6 | Y | N | 180.0 | 170.0 | 9.5 | 7.9 | 7.8 | – | 8.5 |
| PCG012519 | 03:20:32.90 | +41:34:26.8 | Y | N | 390.0 | 222.1 | 10. | – | 7.6 | – | 9.0 |
| VCC1178 | 12:29:21.29 | +08:09:23.8 | Y | N | 486.0 | 125.0 | 9.9 | 7.4 | 8.4 | – | 7.9 |
| VCC1192 | 12:29:30.25 | +07:59:34.3 | Y | N | 409.0 | 16.5 | 9.1 | 6.0 | 8.1 | – | 4.1 |
| M32 | 00:42:41.80 | +40:51:55.0 | Y | N | 113.0 | 76.0 | 9.0 | 6.5 | 8.6 | – | 7.0 |
| NGC 741 | 01:56:21.30 | +05:37:46.8 | Y | Y | 311.7 | 86.2 | 9.8 | 8.7 | 9.9 | – | 7.2 |
| NGC 2970 | 09:43:31.10 | +31:58:37.1 | Y | N | 793.0 | 47.4 | 9.1 | – | 7.7 | – | 6.1 |
| J085431.18+173730.5 | 08:54:31.18 | +17:37:30.5 | N | Y | 490.0 | – | 9.2 | 6.3 | – | – | – |
| J122427+271407 | 12:24:27.57 | +27:14:07.5 | N | Y | – | – | – | – | – | – | – |
| k12 | 03:43:30.26 | -07:35:07.4 | N | Y | 381.2 | 89.1 | 9.2 | – | 8.6 | 6.3 | 7.3 |
| k28 | 09:37:14.74 | +37:17:30.5 | N | Y | 255.3 | 96.7 | 9.2 | – | 8.7 | 6.1 | 7.5 |
| k30 | 09:44:51.02 | +12:30:44.3 | N | Y | 397.8 | 77.7 | 9.0 | – | 8.8 | 5.3 | 7.0 |
| k41 | 10:39:18.55 | +17:11:17.2 | N | Y | 385.3 | 75.7 | 9.2 | – | 8.9 | 7.0 | 6.9 |
| K55 | 11:27:30.82 | +03:09:58.0 | N | Y | 582.0 | 67.5 | 9.3 | – | – | 4.8 | 6.8 |
| k123 | 16:07:44.64 | +13:54:35.6 | N | Y | 281.1 | 102.9 | 8.9 | – | – | – | 7.6 |
| k134 | 22:59:58.34 | +17:55:16.0 | N | Y | 528.0 | 167.7 | 9.5 | – | 8.9 | 4.6 | 8.5 |
| VCC165-cE1 | 12:15:51.26 | +13:13:03.4 | N | Y | 200.0 | 88.8 | 9.6 | – | 8.6 | 5.5 | 7.3 |
Column designation: (1) Galaxy Name; (2,3) RA, DEC coordinates of the optical galaxy; (4,5) If the object has been detected in the X-ray section; (5) if the object is an AGN candidate from the indicators in Section 4; (6) Literature effective radii; (7) Literature velocity dispersion; (8) Literature stellar mass; (9) Literature BH mass ( should be considered as upper limits); (10) BH mass estimated from Eq. 1(this work); (11) BH estimated from the Baron &
Ménard 2019 relation (this work); (12) BH estimated from the - relation of G20. The solid line separates the UCDs (top) from the cEs (bottom).)
We highly caution the reader to not use them as proper values but estimates.
4.3 AGN fraction
Amongst the 937 low-mass compact galaxies analyzed in this paper, 11 out of 357 cEs (but none of the UCDs) qualify as AGN from different indicators (see Table 3). Albeit of completeness effects, the AGN fraction amongst low-mass compact galaxies is therefore 1.2% (11/937). This is significantly lower than that of red massive galaxies at low redshifts (10%; e.g. Gu et al. 2018) and than that of galaxies hosting both NSCs and AGN (10%; e.g. Seth et al. 2008), as expected given the higher stellar masses covered by these studies (log M M⊙). When considering only the X-ray selected AGN, the AGN fraction in low-mass compact galaxies is 0.1% (1/937), which is of the same order as that of X-ray selected AGN in dwarf galaxies at z 0.3 (0.4%; Mezcua et al. 2018a; Birchall et al. 2020). Adding the weakly accreting SMBHs already published for the cE M32 (Peng et al. 2020) and the UCDs M60-UCD1, M59-UCD3, and NGC7727-Nuc 2 (Schweizer et al. 2018), the AGN fraction amongst compact galaxies rises to 1.6% (15/937).
.
5 Black holes in low-mass compact galaxies: super-massive or intermediate-mass?
ETGs are known to follow several scaling relations. One of these is the mass-size relation, which suggests that more massive ETGs tend to be larger than low-mass ones. This is tightly followed at the high-mass end in particular (e.g. Gallazzi et al. 2005, 2020), but it branches out into two different regimes at a characteristic stellar mass scale of M⊙ (e.g. Baldry et al. 2012; Cappellari 2016). The branch corresponding to the more extended low-mass galaxies (dwarf ellipticals and dwarf spheroidals) flattens from that point down, while the branch of low-mass compact galaxies covering cEs, UCDs and down to globular clusters seems to follow the trend of the massive ETGs downwards (albeit showing a larger scatter; e.g. Drinkwater et al. 2000; Brodie et al. 2011).
Furthermore, ETGs follow rather tight relations for some of the main galaxy properties (like stellar mass, stellar velocity dispersion, bulge luminosity or NSC mass) with their BH mass (e.g. Kormendy & Ho 2013). Because all these properties are correlated, a Fundamental Plane for the BH scaling relations was defined in van den Bosch (2016) (vdB16 hereafter; eq. 5), correlating the BH mass with the mass–size relation mentioned above. However, the behaviour of this fundamental plane at the low-mass end is a matter of high debate and unfortunately, the number of low-mass compact objects with measured BH masses, necessary to tackle this issue, is rather scarce.
To circumvent this, we have compiled a sample of low-mass compact object with measured and/or estimated BH masses by using several scaling relations and methods. They are presented in Table 4, along with their most relevant properties for this study: their sizes, stellar masses, and BH masses from both direct measurements reported in the literature and the new estimates performed here (although, as mentioned before, we caution the reader about using these estimates as BH measurements). The table contains all the low-mass compact galaxies we have found to have an X-ray detection (Sect. 4.1), those compatible with being an AGN (Sect. 4.2) and also includes other low-mass compact galaxies that have direct measurements of their BHs. This gives a total of 31 UCDs and 16 cEs that will be used in this section.
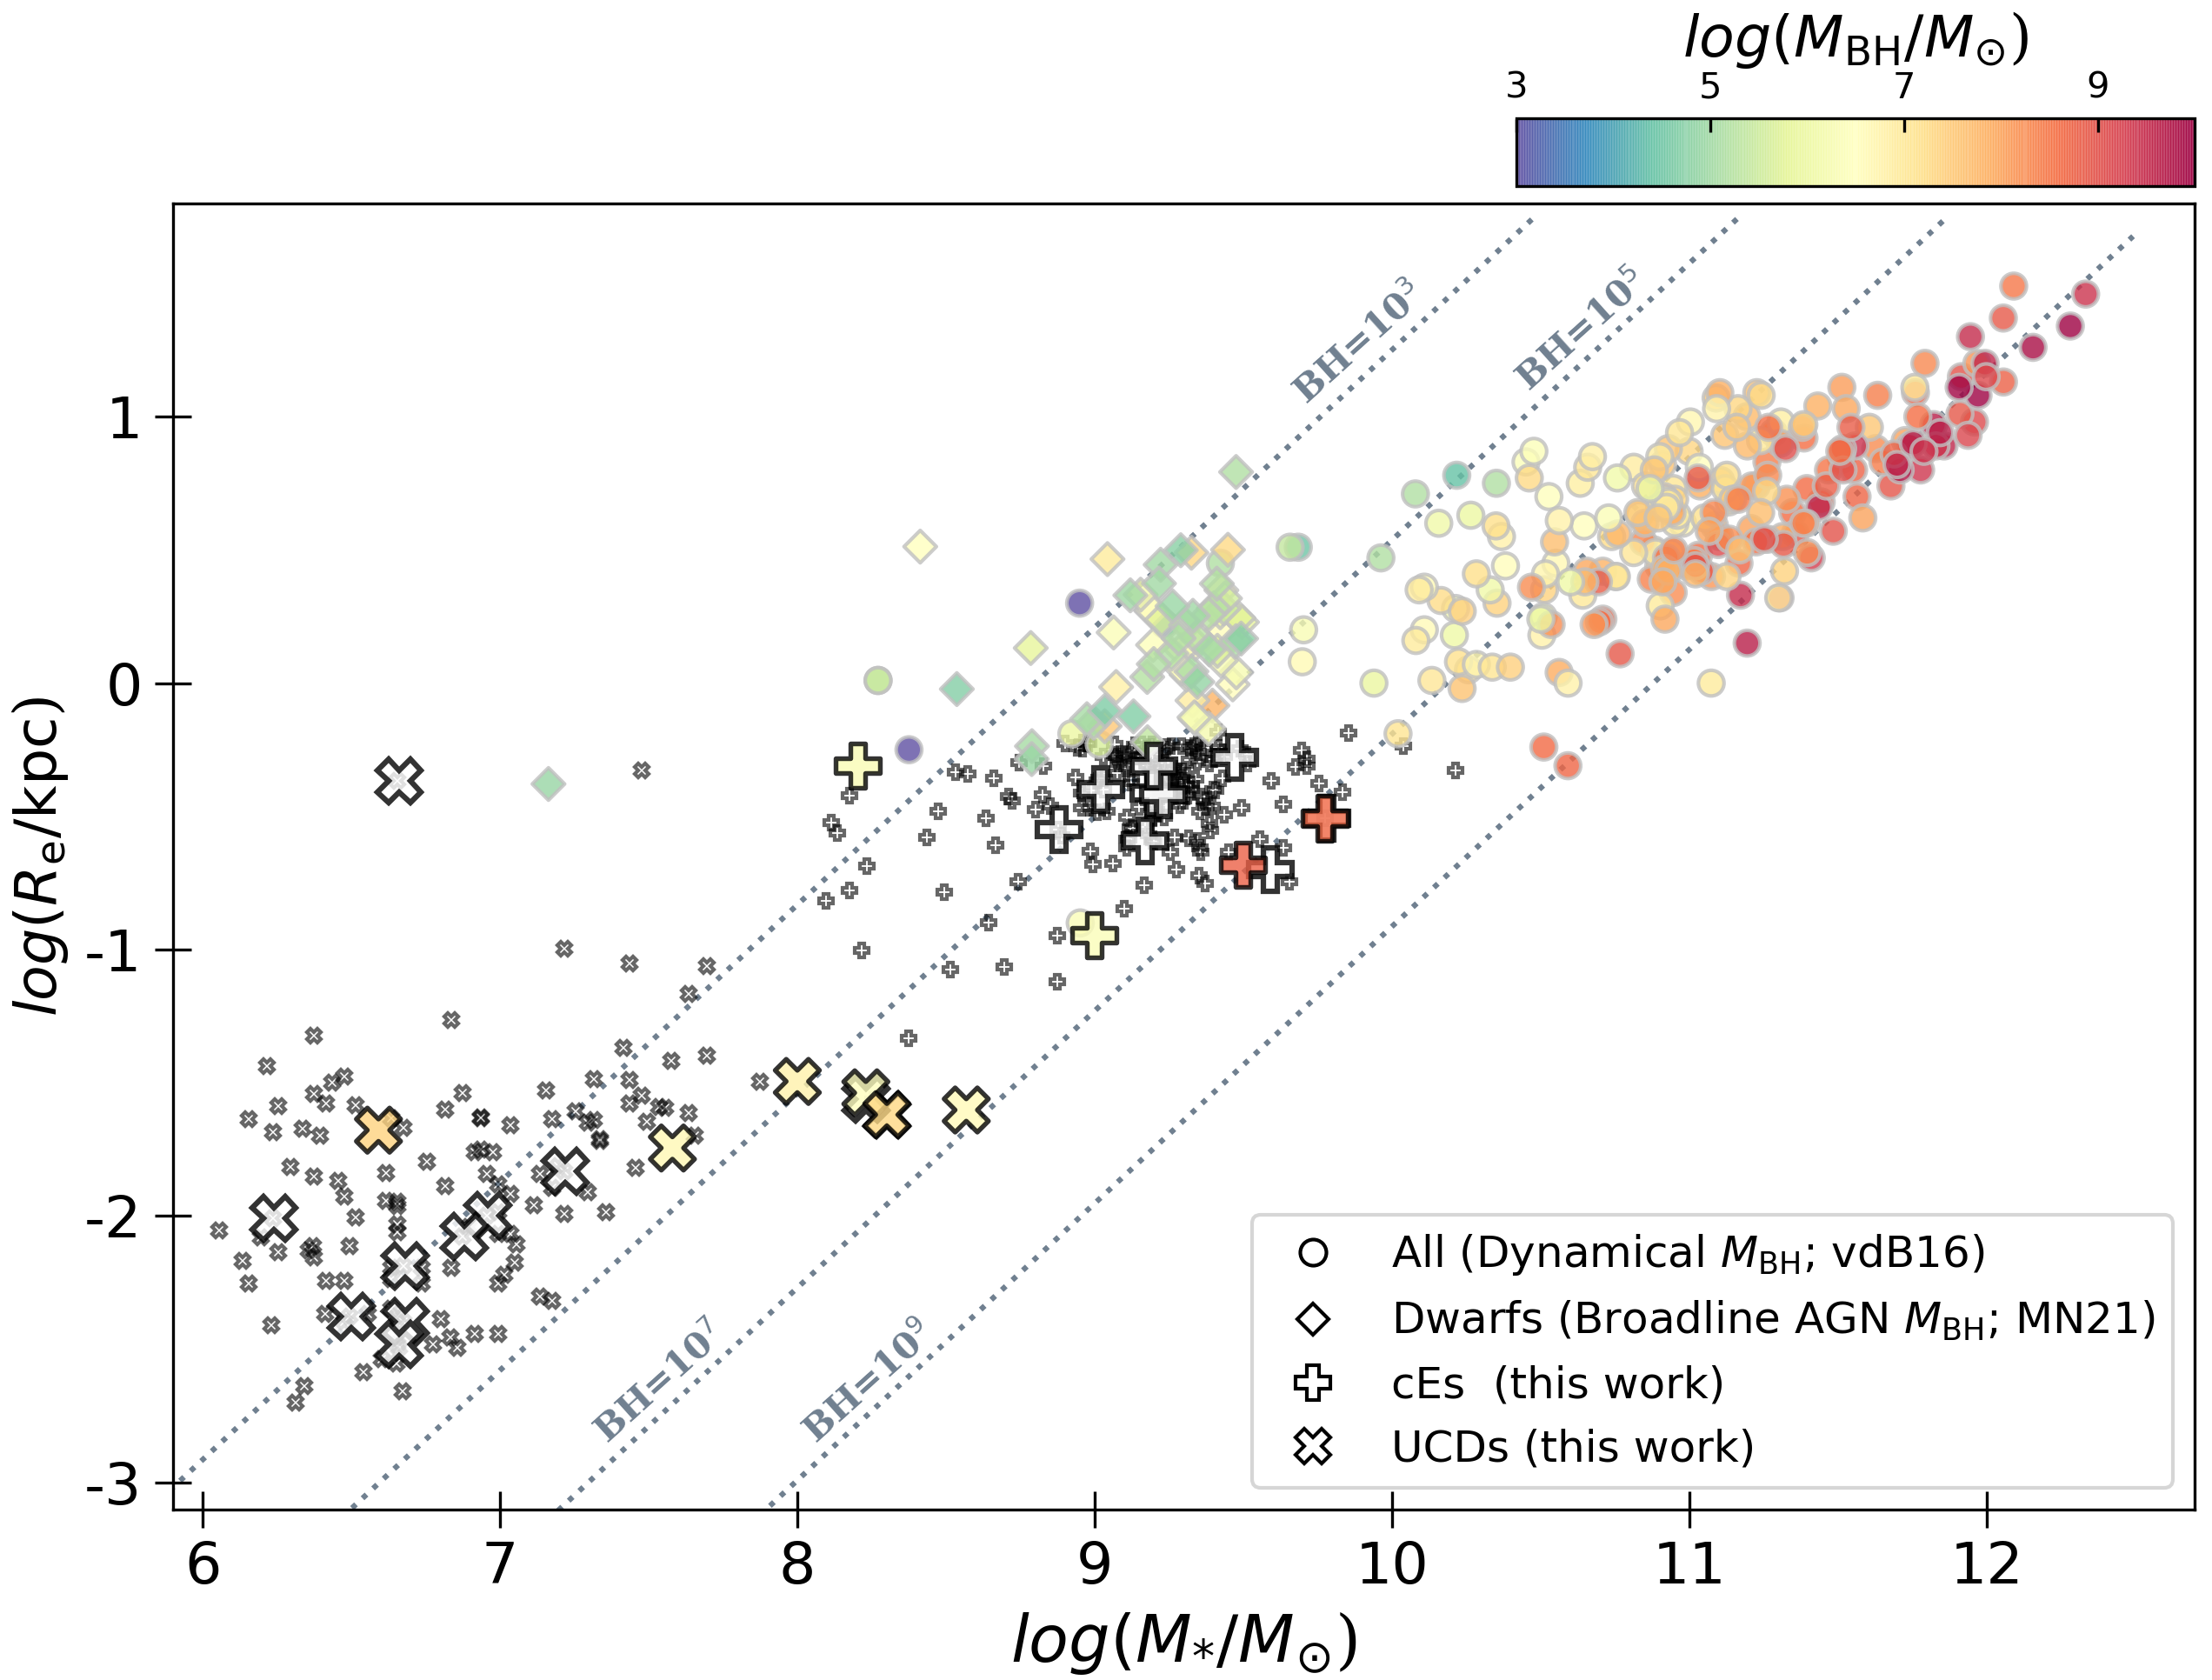
Figure 3 shows the -- fundamental plane, marked by the dotted lines, increasing from left to right from M⊙ to M⊙. Overplotted with filled dots we show a sample of ETGs, mostly comprising massive ellipticals and some dwarfs ellipticals. They are color-coded by the BH mass measurement published in vdB16. These are direct measurements, not estimates, but it is clear that they closely follow the lines marked by the fundamental plane. Dwarf galaxies with BH masses measured from AGN broad emission lines (from Martín-Navarro et al. submitted; MN21 hereafter) are also included and shown by filled diamonds. Small symbols (crosses for the cEs, exes for the UCDs) correspond to the compilation presented in Section 2, when size and mass are available. The larger symbols of crosses and exes correspond to the final sample of low-mass compact galaxies from Table 4, selected because they are an X-ray detection, AGN candidates, or objects for which a BH mass has already been measured. For the latter, they are color-coded accordingly following the color-bar.
If low-mass compact galaxies were to be formed intrinsically (and thus follow the scaling relations at the low-mass end), the expectations are that UCDs should roughly follow the M⊙ dotted lines and cEs the M⊙ ones. However, it is clear that low-mass compact galaxies overall present BH masses that are ubiquitously larger than expected from such relations. See, for example, the compact galaxies around the 103M⊙ line, which can show up to 4 orders of magnitude difference between the measured and the expected BH mass. We note the caveat that most of the measured BH masses have been found so far in high-mass UCDs ( M⊙), with values of BH mass more compatible with a SMBH than an IMBH. Overall, cEs seem to be less extreme, being roughly one order of magnitude larger, which is still compatible with a stripped origin. In fact, some of them follow closely the lines of iso- , which would suggest an intrinsic origin for these cases. This supports what has been seen from the study of their stellar populations and kinematic: cEs are mixed-bag of both origins (e.g. Ferré-Mateu et al. 2018a; Kim et al. 2020; Ferré-Mateu et al. 2021).
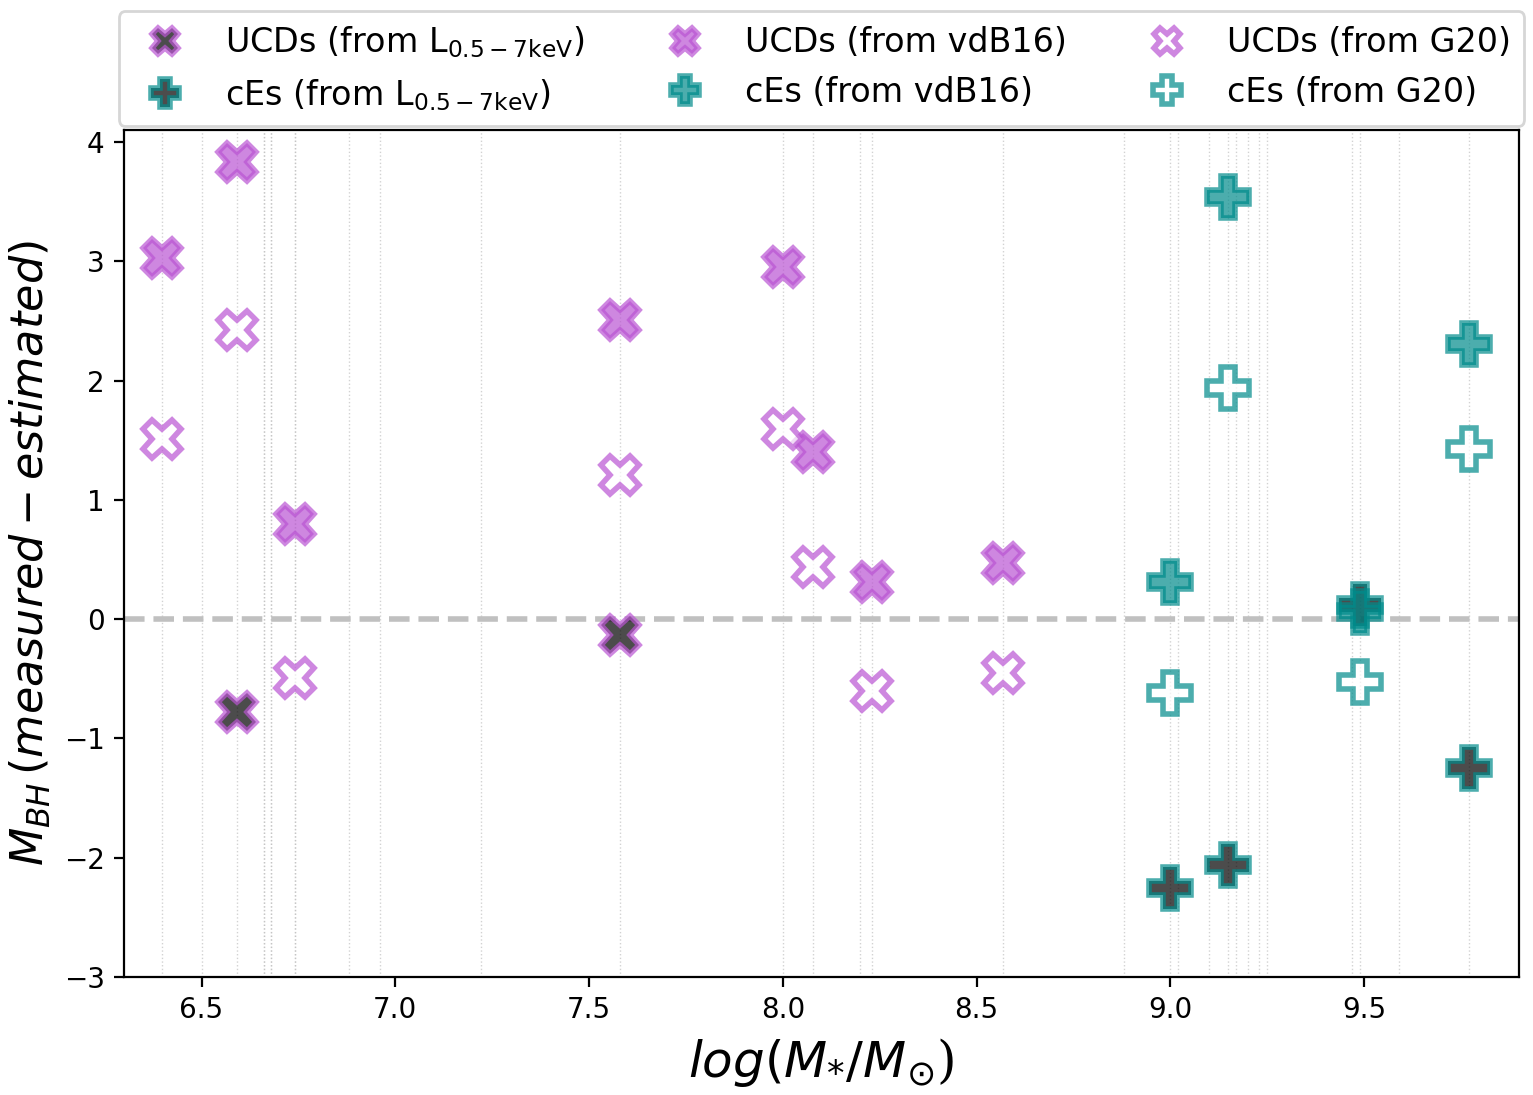
The differences between the measured an the estimated BH masses is better seen in Figure 4. It shows, at a given galaxy’s stellar mass, the difference between the direct measurement and the estimate for the BH mass. We consider the BH mass estimates for the galaxies with an X-ray detection assuming they could host a BH (Sect. 4.1, black-filled symbols). We also look for differences with estimates from the - relation: the one described by vdB16 (colour-filled symbols) and the one by Greene et al. 2020 (G20 hereafter; open symbols). This figure shows that the BH mass estimates using the correlation of vdB16 are those with the largest differences, followed by the G20 ones. This means that the BH mass expected for these galaxies is much smaller than what it is measured. Instead, those estimated from the X-ray luminosities tend to give smaller differences, being in some cases almost the same as the measured value.
There are two possible explanations to account for such differences between the measured and the estimated BH masses. On one hand, large BH masses are expected if the objects are formed via external process. The progenitor, which is a larger and more massive galaxy, will already host a more massive BH. It is expected that as it loses most of its stellar mass it will leave the galaxy’s nucleus ’naked’ with an untouched BH in the center. This makes the galaxy to move diagonally downwards to the left in the mass-size plane of Figure 3, as it also shrinks in size. The only property that remains virtually unchanged during this process is the velocity dispersion (e.g. Bekki et al. 2003, Pfeffer & Baumgardt 2013; Pfeffer et al. 2016).
Depending on the characteristics of the progenitor galaxy (e.g. size, stellar mass, gas content, morphology), the resulting low-mass compact object will be either a UCD or a cE. For the UCDs, it is highly probable that what is left is the NSC that was residing in the center of the progenitor galaxy. For the lowest mass UCDs, it can purely be the NSC, while for more massive UCDs it is possible that it is the naked NSC plus a diffuse region with part of the progenitor galaxy remains (e.g. Evstigneeva et al. 2007; Pfeffer & Baumgardt 2013). Such progenitor are galaxies of M⊙, mostly either a low-mass galaxy or a dwarf elliptical (e.g. Mieske et al. 2013; Pfeffer et al. 2016). However, the recent discovery of the so-called ultradiffuse galaxies, which are nucleated in many cases, also points them as plausible progenitors (Janssens et al. 2017, 2019; Ferré-Mateu et al. 2018b). In the case of the cEs, they are commonly the result of stripping even more massive galaxies, of M⊙. Such progenitors can be either an extended massive galaxy or a massive but compact one (Ferré-Mateu et al., 2021).
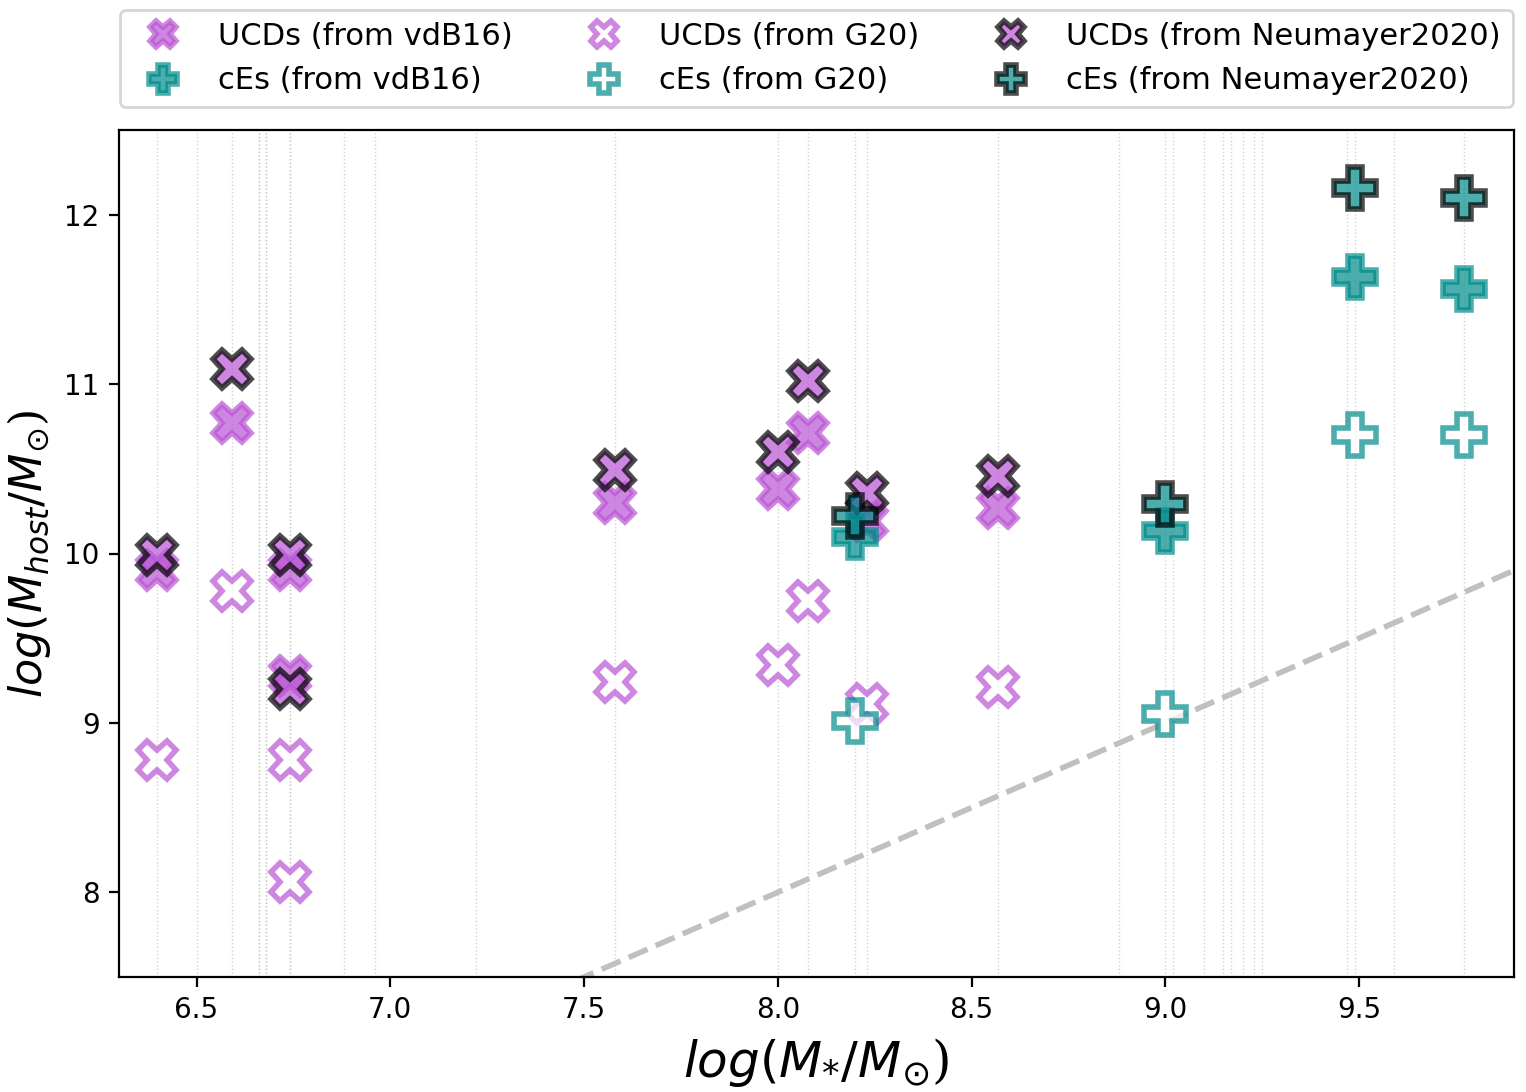
One could back-track the BH mass scaling relations to obtain a first approximation of the progenitor stellar mass. If the estimated progenitor stellar mass is similar to the one of the low-mass compact galaxy, then the galaxy could have an intrinsic origin. If the estimated galaxy mass is instead larger than what it is measured, that would be a clear indicator for a stripping origin. This has been previously used to estimate the mass of the possible progenitor for some of the UCDs with direct BH mass measurements (e.g. Mieske et al. 2013; Ahn et al. 2017; Fahrion et al. 2019; Graham 2020). Figure 5 shows the stellar mass of the low-mass compact galaxies in our sample with direct BH mass measurements compared to the stellar mass estimated for the progenitor following different relations. We use the - relation from vdB16 (color-filled symbols) and the one from G20 (open symbols). Alternatively, we also use the relation between NSC mass and BH mass (e.g. Scott & Graham 2013; Georgiev et al. 2016; Graham 2020) and then convert the NSC mass into galaxy stellar mass as in Neumayer et al. (2020). We use this approach instead of directly assuming that the stellar mass measured from the UCDs is equivalent to the mass of the NSC, because as mentioned before, it could also be the case that it is still surrounded by part of the progenitor galaxy.
We thus use the relation with the BH mass to estimate the NSC masses of the UCDs in our sample, finding NSC masses ranging 106-7M⊙ , which translates into progenitor masses of M⊙ , which is too massive for a UCD progenitor. Similar results are obtained if we use the vdB16 relation, but those are about one order of magnitude lower if the relation from G20 is used. In that case, progenitors of 109-10M⊙ are found, compatible with the expected type of progenitor for UCDs (Bekki et al. 2003, Pfeffer & Baumgardt 2013). We can now compare our new estimates for the progenitor with those discussed in the literature. For example, for the two UCDs in Virgo from Ahn et al. (2017), the authors infer progenitor galaxies of M⊙ following the BH scaling relations of Saglia et al. (2016). Seth et al. (2014) estimated a bulge mass of M⊙ for M60-UCD1 following the scaling relations of Kormendy & Ho (2013), and Afanasiev et al. (2018) infers a progenitor mass of 2M⊙ for Fornax-UCD3. These are all more similar to the BH mass estimates we obtain from the - relation of G20 than the other estimates.
What is clear from Figure 5 is that, regardless of the scaling relation employed, low-mass compact galaxies have progenitors larger than expected, suggesting a stripping origin for them. Nonetheless, there are some galaxies around M⊙ that do not deviate much from the 1:1 relation, which means that these could be good candidates for having an intrinsic origin. In summary, we find that the UCDs in the sample require progenitors that are much more massive than expected by their formation channels. Although their high BH masses can be mostly accounted by the stripping process, something else needs to be considered to match the high values obtained.
The other possibility to explain this effect, although it is still highly debated, is that the scaling relations with BH mass are not universal and therefore can not be extrapolated to the low-mass end. While some works show a particularly tight relation for the - that simply becomes more scattered at the low-mass end (e.g. Kormendy & Ho 2013; vdB16; Baldassare et al. 2020; G20; Shankar et al. 2020), some others suggest that there is a flattening of the - relation, which creates a plume at the low-mass end (e.g. Greene & Ho 2006; Mezcua 2017; Martín-Navarro & Mezcua 2018, MM18 hereafter). In the latter, it was suggested that such change in the slope of the - relation happens at a 100km s, which roughly corresponds to a stellar mass of 31010M⊙. This is the characteristic mass scale where low-mass compact galaxies separate from the branch of more extended dwarf galaxies (e.g. Baldry et al. 2012). This means that, for 100km s, the estimated BH mass should be higher when using the MM18 relation than a universal one like that of e.g. G20 or vdb16.
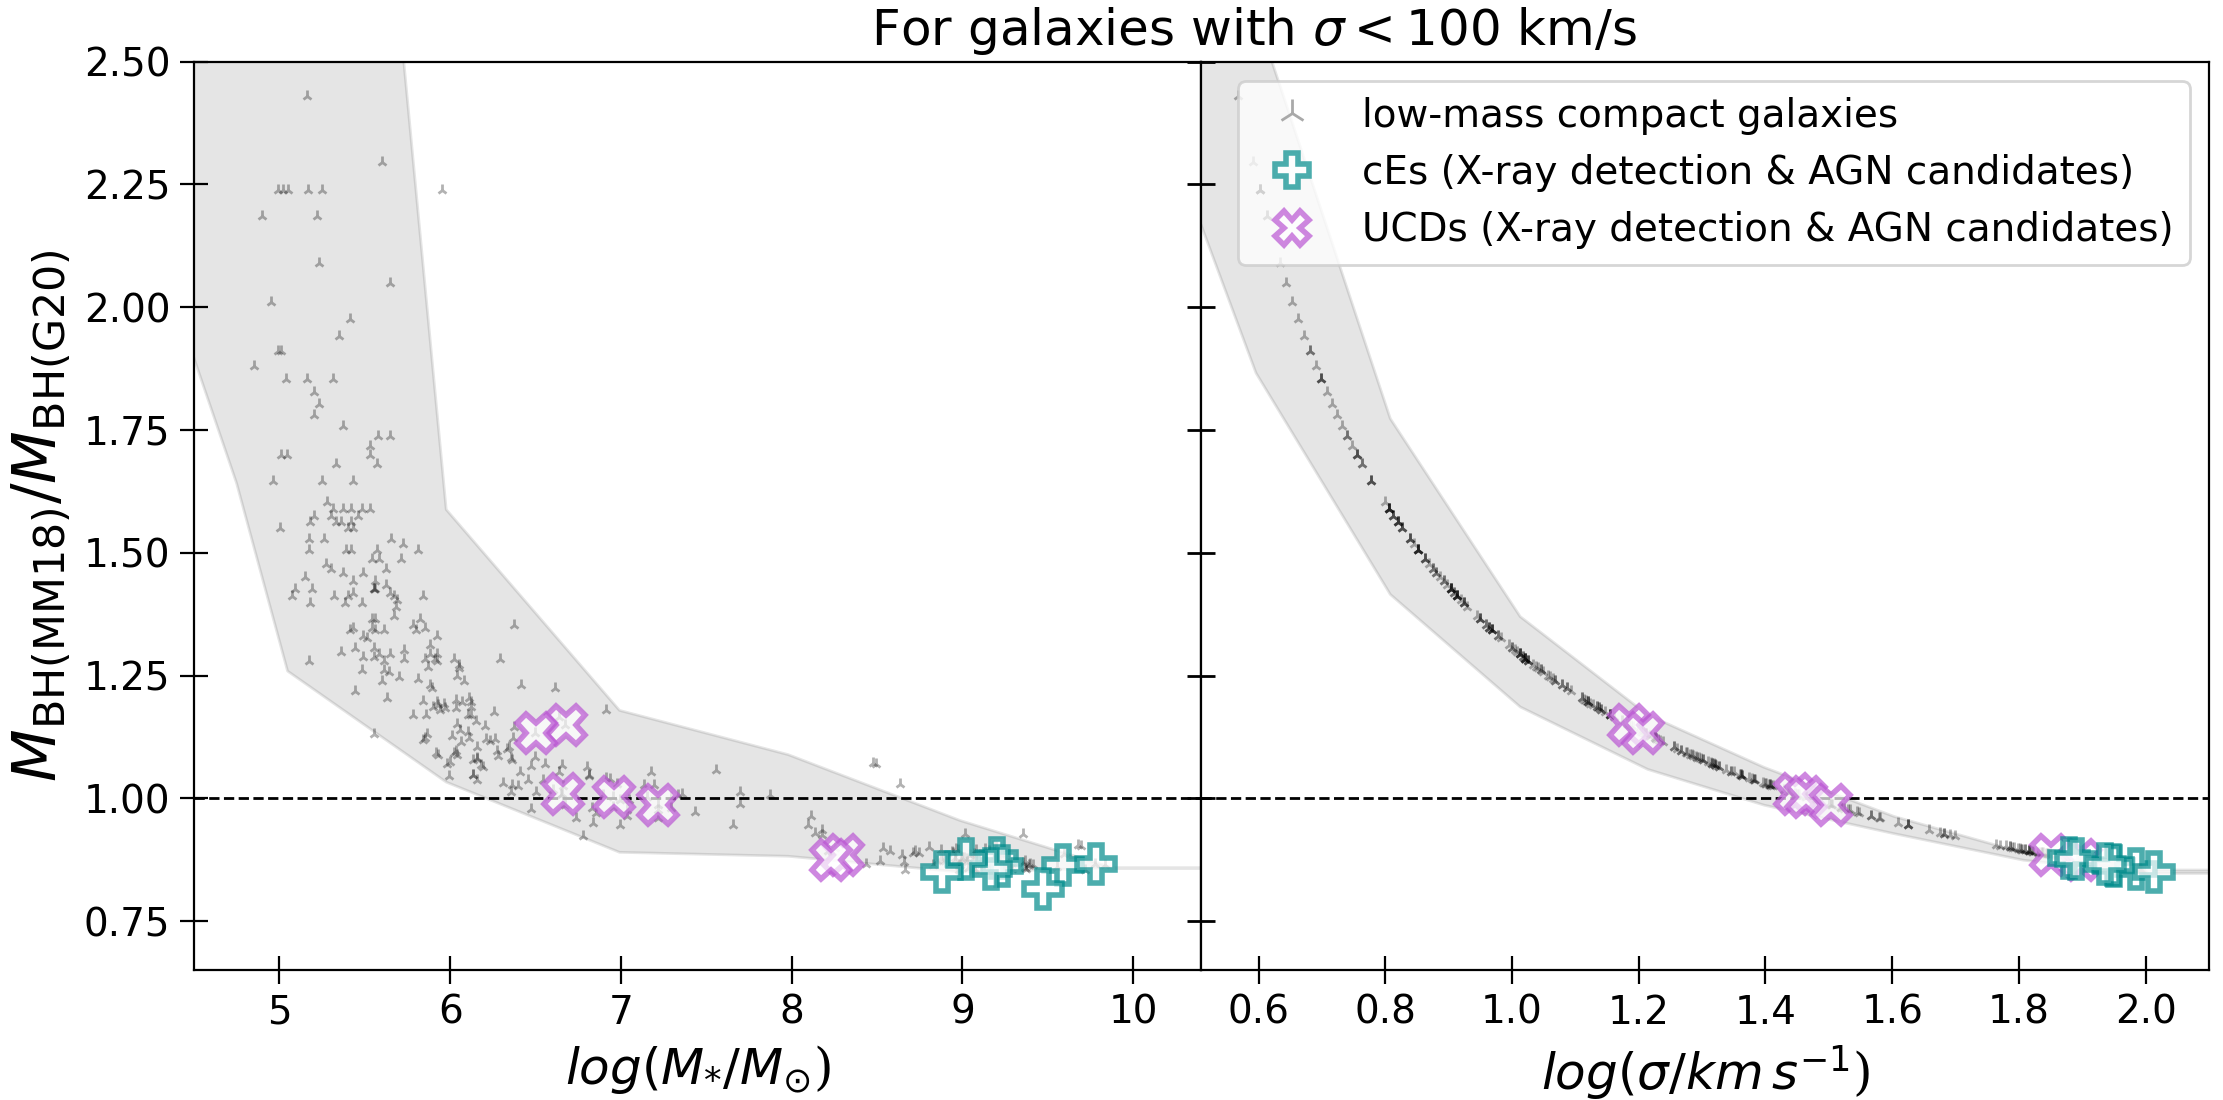
However, we note that the differences between the measured and expected BH masses happen regardless of the type of - relation used to estimate them (e.g. universal vs flattened). To further investigate on the possible effect of using one relation or another, Figure 6 shows the ratio between the estimated BH mass for the low-mass compact galaxies of our sample (limited to 100km s) using the BH mass scaling relation of G20 and the one from MM18 (the reader can also refer to Figure 7 for a visualization of such relations). One first thing that should be noted is the difference between the left and right panel uncertainties. While it is largely assumed that the - relation is extremely tight, the scatter for the - relation is intrinsically larger, in particular at lower stellar masses. One thing we have not accounted for in our estimates of the previous sections are the proper handling of the uncertainties. This is because, as highlighted in several places, our aim is not to provide exact values but provide averaged estimates to test the hypothesis of a scatter+flattening at the low-mass end. For this reason, we have approximated all our estimates with 0.1 dex accuracy at most. The left panel, which presents the dependence with the stellar mass, shows that for masses log 6.5 M⊙ it does not make much difference which scaling relation is used, with galaxies being around the 1:1 relation within the intrinsic scatter. This is also seen in the right panel for the velocity dispersion, where it becomes relevant at log1.4 km s(or 30km s). Therefore, we find that the impact of using a universal versus a flattened relation is only relevant when going to really low masses.
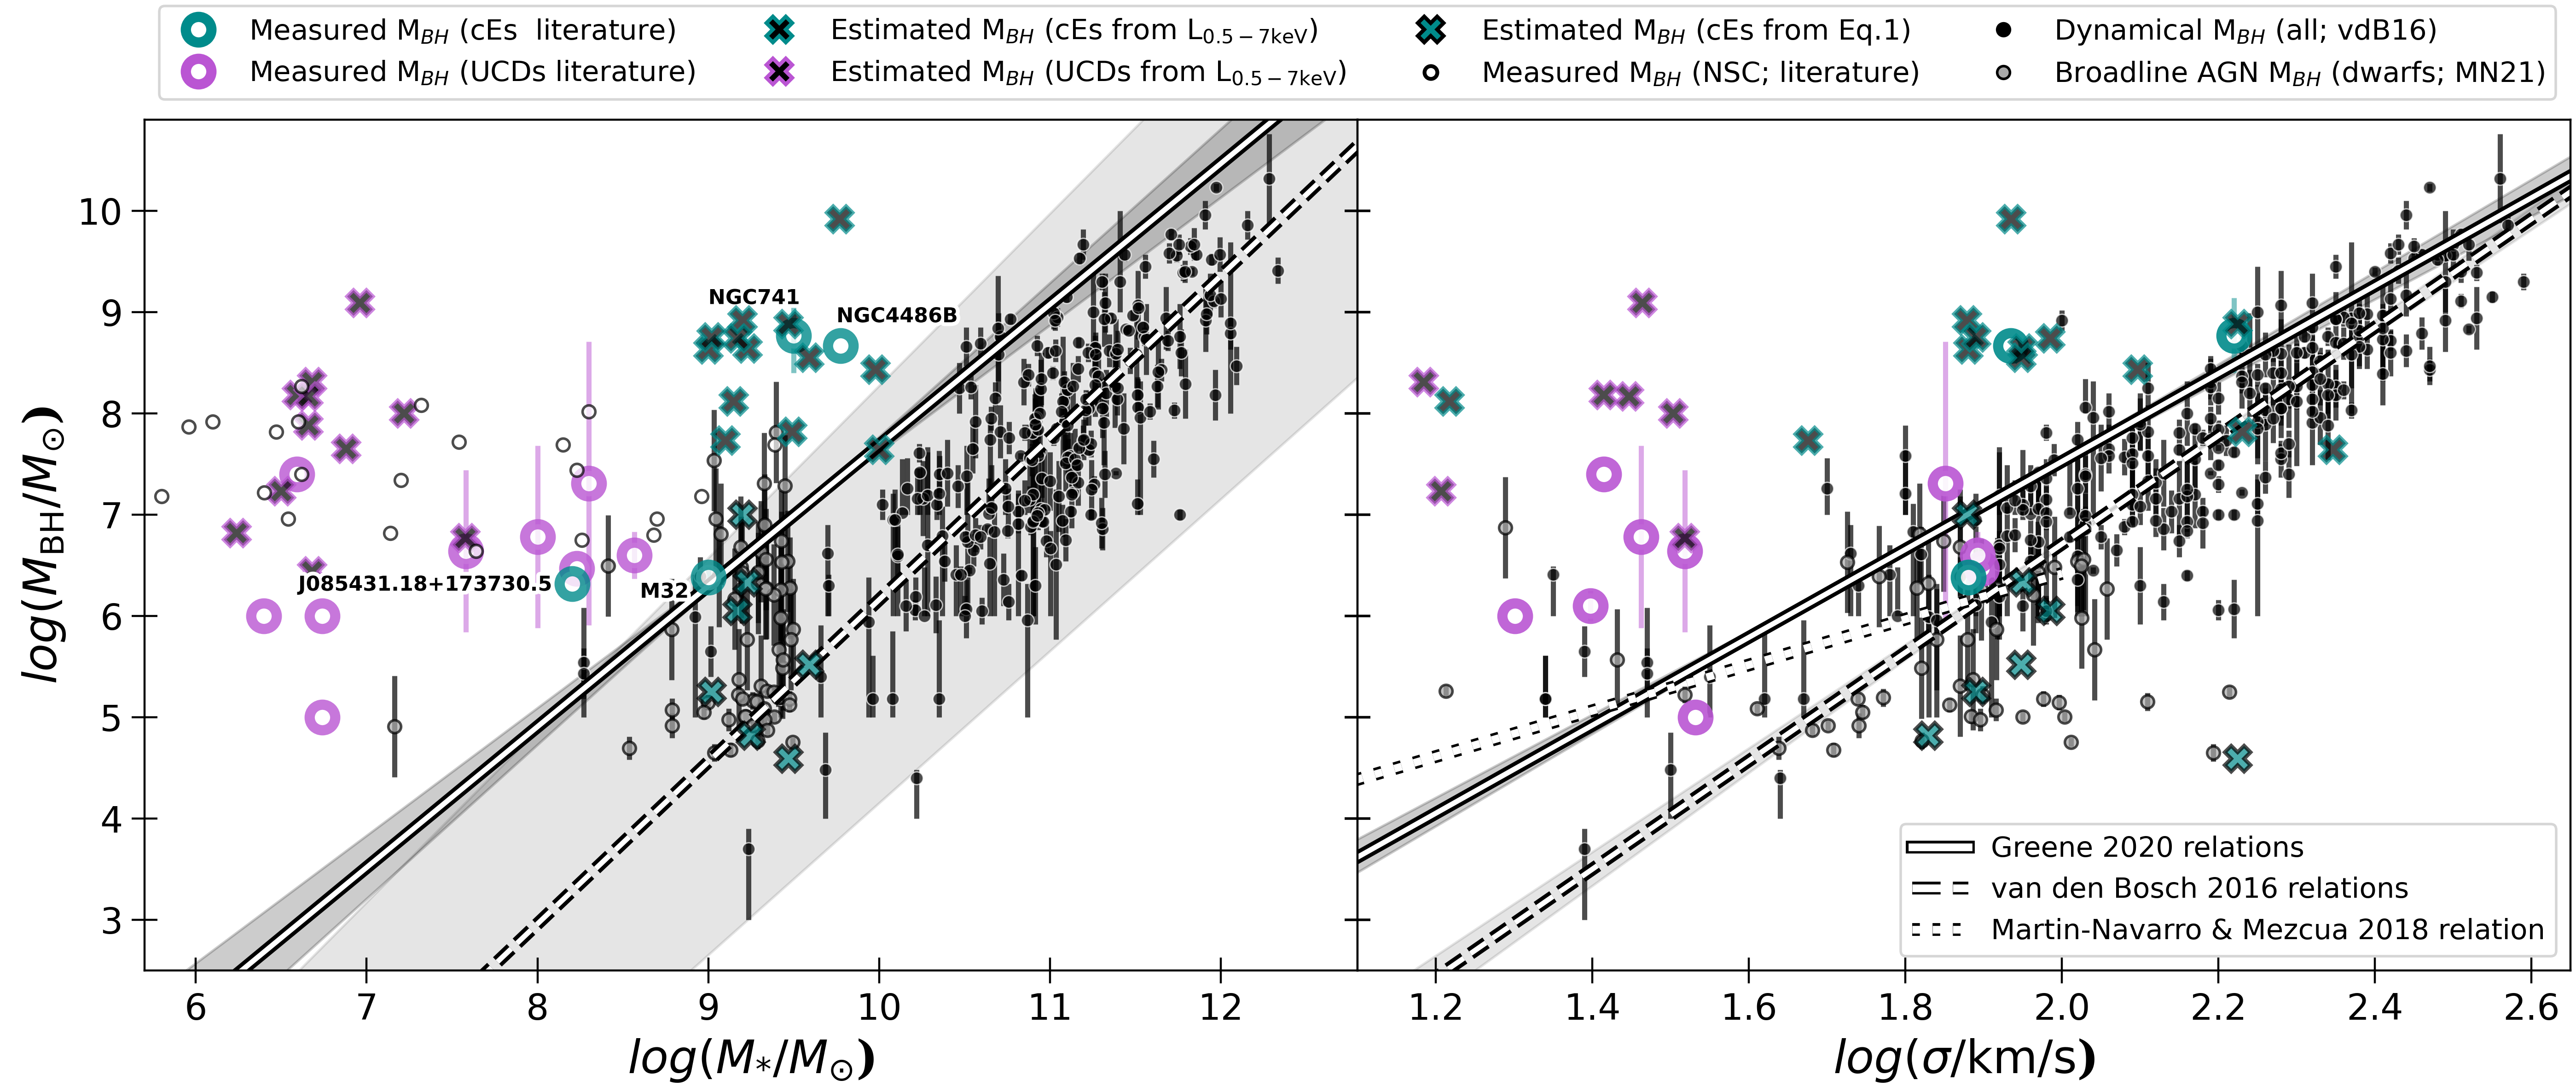
Lastly, we study the scaling relations of BH mass with the velocity dispersion and the stellar mass of galaxies ranging from the high-mass to the low-mass end and including low-mass compact galaxies for the first time, as shown in Figure 7. Different relations with are shown: the one from G20 as a solid black and white line, the one from vdB16 as dashed black and white, and the one from MM18 (up to =100km s; left panel only). The vdB16 and G20 relations have similar slopes, in particular for the stellar mass panel, but are only compatible at the highest-mass end of the relation. Black dots correspond to the dynamical BH masses from vdB16, grey dots are the sample dwarfs with measured from the broad emission lines of their AGN (MN21), and white dots are a sample of NSCs from Graham & Spitler (2009) and Neumayer et al. (2020). Turquoise and purple symbols are cEs and UCDs, respectively, with the direct measurements from the literature shown in open circles. We also include the estimated using the (black crosses with colored edge-line) and the from eq. 1 for the cEs that are SDSS AGN candidates (turquoise filled crosses; see Section 4).
For the UCDs with M⊙ the values of the BH mass estimates from the X-ray detections are very similar to the values measured for the BHs in NSCs. However, they are both a couple of orders larger than the few BH measurements of low-mass UCDs available. For more massive UCDs ( M⊙), we find that these objects share the same location as most NSCs. This would further support the idea that more massive UCDs will be, in most of the cases the remnant NSC of a stripped larger galaxy, while lower mass ones can be the result of stripping non-nucleated dwarfs. In the middle of the UCD mass regime there is VUCD3, the only UCD with values for the measured BH mass, an estimated one from the and a BH mass estimated from the BH of the NSC. All the three BH masses match remarkably well. However, the BH mass estimates from the X-ray detection seem to provide larger values for the cEs, with only a couple of them having BH masses in the range of some of the measured ones (e.g. similar to NGC 741 and NGC 4486B). We find that for cEs the estimates from Eq 1 seem to provide more similar values to the measurements of lower-mass cEs (i.e. M32). These are located in the same region occupied by the dwarfs from MN21. Overall, we find that at stellar masses of log M⊙ (or log1.8 km s) low-mass compact objects tend to be located around the scaling relations, but as we move to lower masses (log M⊙; log1.5 km s) they become clear outliers in both panels of Figure 7.
Are they outliers simply because of their stripping origin, contributing to the scatter at the low-mass end? Or are they outliers because there is a flattening of the relations? Considering the stripping effect, which is the expected formation channel for the majority of low-mass compact galaxies, and reverse-tracking it, low-mass galaxies would move upwards by 1-2 orders of magnitude in stellar mass (as we have seen in Figure 5), while remaining almost unchanged in the plane (e.g. Pfeffer & Baumgardt 2013; Pfeffer et al. 2016; van Son et al. 2019). Applying these factors to the UCDs in Figure 7, low-mass UCDs are expected to have progenitors that are similar to the dwarf galaxies of MN21 (with M⊙ ), compatible with the expected progenitors for the known UCDs with BH masses (e.g. Mieske et al. 2013). However, for more massive UCDs, their progenitors would be galaxies with M⊙ , supporting the idea that they can also be formed as the result of stripping these more massive galaxies, leaving in many cases a naked NSC as a result. cEs would instead move towards the low-mass end of the realm of ETGs with M⊙.
In more detail, for example, NGC 4486B and M32 (labelled in the left panel of Fig. 7) are both close to the scaling relations in the velocity dispersion panel, but are outliers in the stellar mass one. This suggests that they are threshed galaxies coming from a more massive galaxy. NGC 741 is a clear outlier in both panels but instead J085431.18+173730.5 falls on top of the scaling relation with the stellar mass. This suggests that for this cE an intrinsic nature is plausible, which is in agreement with the original discovery paper Paudel et al. (2016). UCDs, instead, are all clear outliers in the stellar mass panel, although some of the more massive ones seem to be close to the - relations. These are M60-UCD1, M59cO and M59UCD3 and they have all been previously suggested to be the result of stripping a more massive galaxy, most likely a low-mass ETG given their stellar populations with elevated alpha-enhancements (e.g. Seth et al. 2014; Ahn et al. 2017; Afanasiev et al. 2018). Therefore, those galaxies that fall around the scaling relations in both panels will most likely be of intrinsic origin, while those galaxies that are only outliers in the stellar mass panel are most likely of stripped origin. However, the fact that some of them are outliers in both panels might indicate that stripping alone is not enough to account for the scatter in the relations. To date, most of the works that have investigated the low-mass end of the BH scaling relations have focused in the regime of dwarf galaxies (e.g. MM18; Baldassare et al. 2020; G20; Shankar et al. 2020). Here we are showing that, if the low-mass objects in the compact branch (cEs and UCDs) are also included, the possibility for the flattening being real becomes more relevant.
We can account for this flattening in the plane that is less affected by the stripping effect, the . We find that if the flattening is real, it seems to happen at lower masses than previously reported by MM18. The right panel of Figure 7 shows a flattening around 20-40 km s(log km s), similar to where the change in the 1:1 relation of Figure 6 happens. Paired with the previous results of the extremely large BH masses for UCDs, this could indicate that the flattening in the BH scaling relations is real, but happening at lower masses than previously thought. This would thus suggest an even flatter slope for low-mass galaxies than the one presented in MM18. Therefore, we suggest that the behaviour of the low-mass galaxies is a combination of a flattening and high scatter due to the stripping nature of some of the low-mass galaxies.
In order to put tighter constraints on the existence of this flattening, it is crucial to populate that low-mass end with a large number of compact galaxies. Unfortunately, due to their extremely small sizes proper studies of their dynamics are both time consuming and limited by the current instrumental resolution. However, with the superb resolution and sensitivity of incoming instruments such as MAVIS and GRAVITY+ at VLT (McDermid et al. 2020; Eisenhauer 2019) we envision that many more BH measurements in low-mass compact galaxies will be possible. The location of these measurements in the scaling relations will provide additional information regarding the origin of the low-mass compact galaxies (stripped vs. intrinsic) without the need of other discriminants like the stellar populations and kinematics.
6 Conclusions
We have searched for AGN signatures in a sample of low-mass compact objects (580 UCDs and 357 cEs) to probe the origin of these galaxies. If the low-mass compact galaxy is formed intrinsically we expect the BH mass to fall in the IMBH regime (or very low SMBH), whereas if it comes from stripping it could host either an IMBH (if the progenitor galaxy was a dwarf, like some UCDs) or a SMBH (if the progenitor is a more massive galaxy).
We have searched for signatures in X-rays in the CSC 2.0 catalog and determined the X-ray luminosity. We find that 7 cEs and 23 UCDs have an X-ray detection, corresponding to a detection rate of 7.8% and 4.8% respectively. Only one source has an X-ray luminosity indicative of AGN emission, the cE NGC 741, which is a well-studied AGN at several wavelengths. The remaining sources all have X-ray luminosities of erg s-1. While this is consistent with X-ray binaries or ultraluminous X-ray sources, a low level of SMBH accretion cannot be fully discarded.
We also investigate which low-mass compact galaxies have SDSS spectra available in order to identify AGN based on emission-line diagnostic diagrams. We find that only eight cEs can be considered AGN based on their emission line properties. We note the caveat that UCDs have practically no spectra available in SDSS or they have very low S/N. Additionally, we check whether there are any counterparts in the mid-infrared (in WISE) or radio (FIRST). While none of the WISE detections are compatible with an AGN origin, three of the FIRST galaxies are good AGN candidates. Altogether, this translates into an AGN fraction in low-mass compact galaxies of 1.2% (11/937), which is similar to that found in dwarf galaxies. It increases to a 1.6% if those objects with weakly accreting SMBHs from the literature are also included.
Finally, we have studied the BH-galaxy scaling relations for the first time for galaxies of all stellar masses from both the dwarf and the compact branches. We find that compact galaxies tend to be outliers in all local BH-galaxy scaling relations, with larger than expected. This effect is emphasized in the stellar-mass plane, while it is milder and sometimes even negligible for some galaxies in the - plane. Moreover, from existing BH measurements for some of the low-mass compact galaxies, we have inferred how massive their progenitor could have been following different assumptions. We find that in the majority of cases the required progenitor is always more massive than what is expected, regardless of the relation used. Although all these are all strong indicators in favour of a stripping origin for these objects, it also suggests that a flattening in the scaling relations could be real. In fact, it would alleviate the extreme differences found between the measured BH masses and those estimated from the scaling relations. If the flattening is real, we find that it seems to occur at around 20-40 km s(log1.3-1.6 km s), which is a lower value than the one previously reported of 100 km s(log2.0 km s).
Our results indicate that those UCDs/cEs that are of intrinsic type (i.e. formed naturally as low-mass, compact galaxies rather than being the result of stripping a more massive galaxy) are excellent targets for follow-up studies aimed at populating the low-mass end of the BH scaling relations and posing final constrains on its shape and the existence of IMBHs.
Data Availability
All data is public through the original works in Table 1.
Acknowledgements
We thank Soo-Chang Rey and Suk Kim for providing their list of cEs from Kim et al. (2020) and Aaron Romanowsky for insightful discussions. AFM has received financial support through the Postdoctoral Junior Leader Fellowship Programme from ’La Caixa’ Banking Foundation (LCF/BQ/LI18/11630007). MM acknowledges support from the Beatriu de Pinos fellowship (2017-BP-00114) and the Ramon y Cajal fellowship (RYC2019-027670-I). AFM and MM both acknowledge support from the RAVET project PID2019-107427GB-C32 from the Spanish Ministry of Science and Innovation.
References
- Afanasiev et al. (2018) Afanasiev A. V., et al., 2018, MNRAS, 477, 4856
- Ahn et al. (2017) Ahn C. P., et al., 2017, ApJ, 839, 72
- Ahn et al. (2018) Ahn C. P., et al., 2018, ApJ, 858, 102
- Bachetti et al. (2014) Bachetti M., et al., 2014, Nature, 514, 202
- Baldassare et al. (2017) Baldassare V. F., Reines A. E., Gallo E., Greene J. E., 2017, ApJ, 836, 20
- Baldassare et al. (2020) Baldassare V. F., Dickey C., Geha M., Reines A. E., 2020, ApJ, 898, L3
- Baldry et al. (2012) Baldry I. K., et al., 2012, MNRAS, 421, 621
- Baldwin et al. (1981) Baldwin J. A., Phillips M. M., Terlevich R., 1981, PASP, 93, 5
- Bär et al. (2017) Bär R. E., Weigel A. K., Sartori L. F., Oh K., Koss M., Schawinski K., 2017, MNRAS, 466, 2879
- Baron & Ménard (2019) Baron D., Ménard B., 2019, MNRAS, 487, 3404
- Becker et al. (1995) Becker R. H., White R. L., Helfand D. J., 1995, ApJ, 450, 559
- Beifiori et al. (2009) Beifiori A., Sarzi M., Corsini E. M., Dalla Bontà E., Pizzella A., Coccato L., Bertola F., 2009, ApJ, 692, 856
- Bekki et al. (2001) Bekki K., Couch W., Drinkwater M., 2001, Astrophys. J. Lett., 552, L105
- Bekki et al. (2003) Bekki K., Couch W. J., Drinkwater M. J., Shioya Y., 2003, MNRAS, 344, 399
- Birchall et al. (2020) Birchall K. L., Watson M. G., Aird J., 2020, MNRAS, 492, 2268
- Brodie et al. (2011) Brodie J., Romanowsky A., Strader J., Forbes D., 2011, Astron. J., 142, 199
- Brüns et al. (2011) Brüns R., Kroupa P., Fellhauer M., Metz M., Assmann P., 2011, Astron. Astrophys., 529, A138
- Calzetti et al. (2000) Calzetti D., Armus L., Bohlin R. C., Kinney A. L., Koornneef J., Storchi-Bergmann T., 2000, ApJ, 533, 682
- Cappellari (2016) Cappellari M., 2016, ARA&A, 54, 597
- Chilingarian & Zolotukhin (2015) Chilingarian I., Zolotukhin I., 2015, Science (80-. )., 348, 418
- Chilingarian et al. (2008) Chilingarian I. V., Cayatte V., Bergond G., 2008, MNRAS, 390, 906
- Chilingarian et al. (2009) Chilingarian I., Cayatte V., Revaz Y., Dodonov S., Durand D., Durret F., Micol A., Slezak E., 2009, Science (80-. )., 326, 1379
- Chilingarian et al. (2018) Chilingarian I. V., Katkov I. Y., Zolotukhin I. Y., Grishin K. A., Beletsky Y., Boutsia K., Osip D. J., 2018, ApJ, 863, 1
- Cid Fernandes et al. (2010) Cid Fernandes R., Stasińska G., Schlickmann M. S., Mateus A., Vale Asari N., Schoenell W., Sodré L., 2010, MNRAS, 403, 1036
- Corral et al. (2011) Corral A., Della Ceca R., Caccianiga A., Severgnini P., Brunner H., Carrera F. J., Page M. J., Schwope A. D., 2011, A&A, 530, A42
- Côté et al. (2006) Côté P., et al., 2006, ApJS, 165, 57
- Dolfi et al. (2020) Dolfi A., et al., 2020, MNRAS, 495, 1321
- Drinkwater et al. (2000) Drinkwater M. J., Jones J. B., Gregg M. D., Phillipps S., 2000, Publ. Astron. Soc. Australia, 17, 227
- Drinkwater et al. (2003) Drinkwater M., Gregg M., Hilker M., Bekki K., Couch W., Ferguson H., Jones J., Phillipps S., 2003, Nature, 423, 519
- Du et al. (2019) Du M., et al., 2019, Astrophys. J., 875, 58
- Duras et al. (2020) Duras F., et al., 2020, A&A, 636, A73
- Eisenhauer (2019) Eisenhauer F., 2019, in The Very Large Telescope in 2030. p. 30, doi:10.5281/zenodo.3356274
- Evans et al. (2010) Evans I. N., et al., 2010, ApJS, 189, 37
- Evstigneeva et al. (2007) Evstigneeva E. A., Gregg M. D., Drinkwater M. J., Hilker M., 2007, AJ, 133, 1722
- Faber (1973) Faber S., 1973, Astrophys. J., 179, 423
- Fahrion et al. (2019) Fahrion K., et al., 2019, A&A, 625, A50
- Faifer et al. (2017) Faifer F. R., Escudero C. G., Scalia M. C., Smith Castelli A. V., Norris M., De Rossi M. E., Forte J. C., Cellone S. A., 2017, A&A, 599, L8
- Fellhauer & Kroupa (2002) Fellhauer M., Kroupa P., 2002, Astrophys. Space Sci., 281, 355
- Ferrarese et al. (2006) Ferrarese L., et al., 2006, Astrophys. J. Lett., 644, L21
- Ferré-Mateu et al. (2013) Ferré-Mateu A., Vazdekis A., de la Rosa I., 2013, Mon. Not. R. Astron. Soc., 431, 440
- Ferré-Mateu et al. (2015) Ferré-Mateu A., Mezcua M., Trujillo I., Balcells M., van den Bosch R., 2015, Astrophys. J., 808, 79
- Ferré-Mateu et al. (2018a) Ferré-Mateu A., Forbes D. A., Romanowsky A. J., Janz J., Dixon C., 2018a, Mon. Not. R. Astron. Soc., 473, 1819
- Ferré-Mateu et al. (2018b) Ferré-Mateu A., et al., 2018b, MNRAS, 479, 4891
- Ferré-Mateu et al. (2021) Ferré-Mateu A., Durré M., Forbes D. A., Romanowsky A. J., Alabi A., Brodie J. P., McDermid R. M., 2021, MNRAS, 503, 5455
- Forbes et al. (2014) Forbes D. A., Norris M. A., Strader J., Romanowsky A. J., Pota V., Kannappan S. J., Brodie J. P., Huxor A., 2014, MNRAS, 444, 2993
- Forbes et al. (2020) Forbes D. A., Ferré-Mateu A., Durré M., Brodie J. P., Romanowsky A. J., 2020, MNRAS, 497, 765
- Fürst et al. (2016) Fürst F., et al., 2016, ApJ, 831, L14
- Gallazzi et al. (2005) Gallazzi A., Charlot S., Brinchmann J., White S., Tremonti C., 2005, Mon. Not. R. Astron. Soc., 362, 41
- Gallazzi et al. (2020) Gallazzi A. R., Pasquali A., Zibetti S., La Barbera F., 2020, arXiv e-prints, p. arXiv:2010.04733
- Georgiev et al. (2016) Georgiev I. Y., Böker T., Leigh N., Lützgendorf N., Neumayer N., 2016, MNRAS, 457, 2122
- Goodman & Bekki (2018) Goodman M., Bekki K., 2018, MNRAS, 478, 3564
- Graham (2012) Graham A. W., 2012, MNRAS, 422, 1586
- Graham (2020) Graham A. W., 2020, MNRAS, 492, 3263
- Graham & Guzmán (2003) Graham A., Guzmán R., 2003, Astron. J., 125, 2936
- Graham & Spitler (2009) Graham A. W., Spitler L. R., 2009, MNRAS, 397, 2148
- Greene & Ho (2006) Greene J. E., Ho L. C., 2006, ApJ, 641, L21
- Greene et al. (2020) Greene J. E., Setton D., Bezanson R., Suess K. A., Kriek M., Spilker J. S., Goulding A. D., Feldmann R., 2020, ApJ, 899, L9
- Gu et al. (2018) Gu Y., Fang G., Yuan Q., Cai Z., Wang T., 2018, ApJ, 855, 10
- Guérou et al. (2015) Guérou A., et al., 2015, Astrophys. J., 804, 70
- Hasegan (2007) Hasegan I., 2007, PhD thesis, Rutgers The State University of New Jersey - New Brunswick
- Hou & Li (2016) Hou M., Li Z., 2016, ApJ, 819, 164
- Huang et al. (2013) Huang S., Ho L. C., Peng C. Y., Li Z.-Y., Barth A. J., 2013, ApJ, 766, 47
- Huxor et al. (2011) Huxor A., Phillipps S., Price J., Harniman R., 2011, Mon. Not. R. Astron. Soc., 414, 3557
- Israel et al. (2017) Israel G. L., et al., 2017, MNRAS, 466, L48
- Janssens et al. (2017) Janssens S., Abraham R., Brodie J., Forbes D., Romanowsky A. J., van Dokkum P., 2017, ApJ, 839, L17
- Janssens et al. (2019) Janssens S. R., Abraham R., Brodie J., Forbes D. A., Romanowsky A. J., 2019, ApJ, 887, 92
- Janz et al. (2015) Janz J., Forbes D. A., Norris M. A., Strader J., Penny S. J., Fagioli M., Romanowsky A. J., 2015, Mon. Not. R. Astron. Soc., 449, 1716
- Jarrett et al. (2011) Jarrett T. H., et al., 2011, ApJ, 735, 112
- Jiang et al. (2011) Jiang Y.-F., Greene J. E., Ho L. C., Xiao T., Barth A. J., 2011, ApJ, 742, 68
- Kauffmann et al. (2003) Kauffmann G., et al., 2003, MNRAS, 346, 1055
- Kewley et al. (2001) Kewley L. J., Dopita M. A., Sutherland R. S., Heisler C. A., Trevena J., 2001, ApJ, 556, 121
- Kewley et al. (2006) Kewley L. J., Groves B., Kauffmann G., Heckman T., 2006, MNRAS, 372, 961
- Kim et al. (2015) Kim M., et al., 2015, ApJ, 814, 8
- Kim et al. (2019) Kim D.-W., et al., 2019, ApJS, 241, 36
- Kim et al. (2020) Kim S., Jeong H., Rey S.-C., Lee Y., Lee J., Joo S.-J., Kim H.-S., 2020, ApJ, 903, 65
- Kimbrell et al. (2021) Kimbrell S. J., Reines A. E., Schutte Z., Greene J. E., Geha M., 2021, arXiv e-prints, p. arXiv:2103.06289
- Kormendy & Bender (2012) Kormendy J., Bender R., 2012, Astrophys. J. Suppl. Ser., 198, 2
- Kormendy & Ho (2013) Kormendy J., Ho L. C., 2013, ARA&A, 51, 511
- Kormendy et al. (2009) Kormendy J., Fisher D., Cornell M., Bender R., 2009, Astrophys. J. Suppl. Ser., 182, 216
- Liu et al. (2015) Liu C., et al., 2015, ApJ, 812, 34
- Mahani et al. (2021) Mahani H., Zonoozi A. H., Haghi H., Jeřábková T., Kroupa P., Mieske S., 2021, MNRAS, 502, 5185
- Martín-Navarro & Mezcua (2018) Martín-Navarro I., Mezcua M., 2018, ApJ, 855, L20
- Martinović & Micic (2017) Martinović N., Micic M., 2017, preprint (arXiv:1706.04022)
- McDermid et al. (2020) McDermid R. M., et al., 2020, arXiv e-prints, p. arXiv:2009.09242
- Mezcua (2017) Mezcua M., 2017, International Journal of Modern Physics D, 26, 1730021
- Mezcua & Domínguez Sánchez (2020) Mezcua M., Domínguez Sánchez H., 2020, ApJ, 898, L30
- Mezcua et al. (2016) Mezcua M., Civano F., Fabbiano G., Miyaji T., Marchesi S., 2016, ApJ, 817, 20
- Mezcua et al. (2018a) Mezcua M., Civano F., Marchesi S., Suh H., Fabbiano G., Volonteri M., 2018a, MNRAS, 478, 2576
- Mezcua et al. (2018b) Mezcua M., Kim M., Ho L. C., Lonsdale C. J., 2018b, MNRAS, 480, L74
- Mezcua et al. (2019) Mezcua M., Suh H., Civano F., 2019, MNRAS, 488, 685
- Mieske et al. (2008) Mieske S., Dabringhausen J., Kroupa P., Hilker M., Baumgardt H., 2008, Astronomische Nachrichten, 329, 964
- Mieske et al. (2012) Mieske S., Hilker M., Misgeld I., 2012, Astron. Astrophys., 537, A3
- Mieske et al. (2013) Mieske S., Frank M., Baumgardt H., Lützgendorf N., Neumayer N., Hilker M., 2013, Astron. Astrophys., 558, A14
- Misgeld & Hilker (2011) Misgeld I., Hilker M., 2011, Mon. Not. R. Astron. Soc., 414, 3699
- Netzer (2009) Netzer H., 2009, MNRAS, 399, 1907
- Neumayer et al. (2020) Neumayer N., Seth A., Böker T., 2020, A&ARv, 28, 4
- Norris et al. (2014) Norris M. A., et al., 2014, Mon. Not. R. Astron. Soc., 443, 1151
- Pandya et al. (2016) Pandya V., Mulchaey J., Greene J. E., 2016, ApJ, 819, 162
- Paudel & Ree (2014) Paudel S., Ree C., 2014, Astrophys. J. Lett., 796, L14
- Paudel et al. (2013) Paudel S., et al., 2013, Astrophys. J., 767, 133
- Paudel et al. (2016) Paudel S., Hilker M., Ree C. H., Kim M., 2016, ApJ, 820, L19
- Peng et al. (2020) Peng S., Li Z., Sjouwerman L. O., Yang Y., Xie F., Yuan F., 2020, ApJ, 894, 61
- Pfeffer & Baumgardt (2013) Pfeffer J., Baumgardt H., 2013, MNRAS, 433, 1997
- Pfeffer et al. (2016) Pfeffer J., Hilker M., Baumgardt H., Griffen B., 2016, Mon. Not. R. Astron. Soc., 458, 2492
- Raymond & Smith (1977) Raymond J. C., Smith B. W., 1977, ApJS, 35, 419
- Reines et al. (2020) Reines A. E., Condon J. J., Darling J., Greene J. E., 2020, ApJ, 888, 36
- Saglia et al. (2016) Saglia R. P., et al., 2016, ApJ, 818, 47
- Schellenberger et al. (2017) Schellenberger G., Vrtilek J. M., David L., O’Sullivan E., Giacintucci S., Johnston-Hollitt M., Duchesne S. W., Raychaudhury S., 2017, ApJ, 845, 84
- Schweizer et al. (2018) Schweizer F., Seitzer P., Whitmore B. C., Kelson D. D., Villanueva E. V., 2018, ApJ, 853, 54
- Scott & Graham (2013) Scott N., Graham A. W., 2013, ApJ, 763, 76
- Seth et al. (2008) Seth A., Agüeros M., Lee D., Basu-Zych A., 2008, ApJ, 678, 116
- Seth et al. (2014) Seth A. C., et al., 2014, Nature, 513, 398
- Shankar et al. (2020) Shankar F., et al., 2020, MNRAS, 493, 1500
- Shi et al. (2020) Shi Y., Grudić M. Y., Hopkins P. F., 2020, arXiv e-prints, p. arXiv:2008.12290
- Smith et al. (2001) Smith R. K., Brickhouse N. S., Liedahl D. A., Raymond J. C., 2001, ApJ, 556, L91
- Stern et al. (2012) Stern D., et al., 2012, ApJ, 753, 30
- Urrutia Zapata et al. (2019) Urrutia Zapata F., Fellhauer M., Alarcón Jara A. G., Matus Carrillo D. R., Aravena C. A., 2019, Mon. Not. R. Astron. Soc., 489, 2746
- Voggel et al. (2018) Voggel K. T., et al., 2018, ApJ, 858, 20
- Voggel et al. (2019) Voggel K. T., Seth A. C., Baumgardt H., Mieske S., Pfeffer J., Rasskazov A., 2019, ApJ, 871, 159
- Wirth & Gallagher (1984) Wirth A., Gallagher J., 1984, Astrophys. J., 282, 85
- Zhang et al. (2018) Zhang H.-X., et al., 2018, ApJ, 858, 37
- Zolotov et al. (2015) Zolotov A., et al., 2015, MNRAS, 450, 2327
- van Son et al. (2019) van Son L. A. C., et al., 2019, MNRAS, 485, 396
- van den Bosch (2016) van den Bosch R. C. E., 2016, ApJ, 831, 134
- van der Marel et al. (1997) van der Marel R. P., de Zeeuw P. T., Rix H.-W., Quinlan G. D., 1997, Nature, 385, 610