anna.roslawska@ipcms.unistra.fr
tomas.neuman@ipcms.unistra.fr††thanks: These two authors contributed equally
anna.roslawska@ipcms.unistra.fr
tomas.neuman@ipcms.unistra.fr††thanks: guillaume.schull@ipcms.unistra.fr
Mapping Lamb, Stark and Purcell effects at a chromophore-picocavity junction with hyper-resolved fluorescence microscopy
Abstract
The interactions between the excited states of a single chromophore with static and dynamic electric fields confined to a plasmonic cavity of picometer dimensions are investigated in a joint experimental and theoretical effort. In this configuration, the spatial extensions of the confined fields are smaller than the one of the molecular exciton, a property that is used to generate fluorescence maps of the chromophores with intra-molecular resolution. Theoretical simulations of the electrostatic and electrodynamic interactions occurring at the chromophore-picocavity junction are able to reproduce and interpret these hyper-resolved fluorescence maps, and reveal the key role played by subtle variations of Purcell, Lamb and Stark effects at the chromophore-picocavity junction.
pacs:
78.67.-n,78.60.Fi,68.37.EfI Introduction
Seminal experiments demonstrating the possibility to study optical properties of individual molecular chromophores [1, 2] gave rise to the development of super-resolution fluorescence techniques, revolutionizing the field of optical microscopy [3, 4], and inspired the engineering of molecule-based quantum-optical devices [5, 6]. At the core of many of these applications stands the possibility to control the optical and electronic properties of molecules via static and dynamical electromagnetic interactions. In the weak-coupling limit, the presence of electromagnetic field fastens the radiative decay rate of the emitter (Purcell effect [7, 8]) and shifts its emission energy to the red (Lamb shift) [9, 10, 11, 12]. Electrostatic fields, on the other hand, cause Stark shifts [13, 14] of the emission lines. These effects are nowadays well-understood in settings where the chromophore can be treated as a point-like emitter exposed to homogeneous external electromagnetic fields. The opposite limit, where the physical dimensions of the fields confinements are small or comparable with the size of the molecular emitter, remains largely unexplored. Here, we address this extreme limit of light-matter interaction by analysing the spectra of light emission from a single electrically driven molecule in an atomically sharp tunneling junction. We further show how these effects can be exploited to elucidate the electronic and optical properties of individual molecules and their interaction with a plasmonic cavity enabling ultimate spatial resolution by combining scanning tunneling microscopy (STM) and optical spectroscopy.
In the respect of optical imaging of single molecules, scanning near-field optical microscopy [15, 16, 17, 18, 19, 20, 21, 22] has proven to be a valuable tool thanks to its ability to confine electromagnetic fields at the extremity of the microscope tip. This path has been explored to its limits in tip-enhanced Raman spectroscopy (TERS) [23, 24] and tip-enhanced photoluminescence (TEPL) [25] to investigate vibronic and fluorescence signals with sub-molecular precision. Scanning tunneling microscope-induced luminescence (STML), which uses tunneling electron as an excitation source rather than photons, provided similar if not better, spatial resolution over fluorescence signals of chromophores [26, 27, 28, 29, 30, 31, 32, 33, 34, 35, 36, 37, 38, 39, 40]. In typical STML experiments, hyper-resolved fluorescence microscopy (HRFM) maps are recorded by collecting the intensity of the photon emission as a function of atomic-scale variations of the STM tip position with respect to the molecule. These HRFM maps, however, are challenging to interpret because the excitation and emission mechanisms driven by electronic and optical processes are simultaneously at play.
In contrast to these previous STML experiments, we show that HRFM maps of molecular electroluminescence lines embed information on the electromagnetic and electrostatic environment of the molecule encoded in the atomically-resolved line widths and line shifts. Based on a comparison between experimental data and theoretical calculations obtained for a free-base phthalocyanine (H2Pc) chromophore, we demonstrate that line-width maps directly reflect the large Purcell effect generated by the coupling between the chromophore and gap plasmons at the tunneling junction, providing an access to variations of the molecular excited state lifetime with tip position. This signal therefore solely reflects the optical characteristics of the chromophore and can be used to generate sub-nanometric fluorescence maps. On the other hand, the energy of the chromophore fluorescence line depends on a subtle interplay between Lamb- [35] and Stark-shifts [41] induced by the presence of the tip. Whereas the former provides intimate details of the exciton-plasmon coupling, the latter reveals information about the transfer of charges associated with the chromophore electronic transition. In addition, our theoretical calculations highlight the decisive role played by the extreme confinement of the electromagnetic fields at the tip apex – eventually acting as a cavity of atomic dimensions, or plasmonic picocavity [42, 43, 44, 45, 25, 46, 47] – that is responsible for the ultimate spatial resolution in HRFM maps. The main advantage of our approach based on the mapping of the Purcell, Lamb, and Stark effects is that it is not hampered by the excitation probability of the chromophore, and solely reflects the optical (line-width maps) and electronic (line-shift map) characteristics of the exciton. Overall, this approach provides simultaneously electronic and optical signals of chromophores with close-to-atomic resolution, and decisive atomic-scale information on fundamental plasmon-exciton interactions in the limit where the spatial scales of the confined fields are comparable to that of the quantum emitter.
II Purcell, Lamb and Stark effects in STML
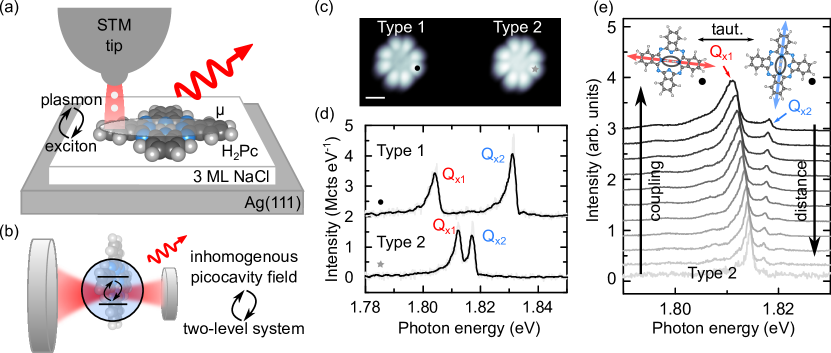
The experimental approach [Fig. 1(a)] consists in using the tunneling electrons of an STM to excite the fluorescence of individual H2Pc molecules separated from a Ag(111) surface by three insulating monolayers of NaCl. In this configuration, the insulating layer is sufficiently thick to prevent the quenching of the fluorescence due to the direct contact between chromophores and metallic surfaces. The sketch also represents the interaction between plasmons confined at the extremity of the STM tip and the transition dipole moment of the H2Pc molecule. In this configuration, the electromagnetic field confined at the plasmonic picocavity created by the atomically sharp tip couples with a molecular two-level system of larger spatial dimensions [Fig. 1(b)], in strong contrast to the homogeneous field distribution generally obtained in more standard electromagnetic cavities.
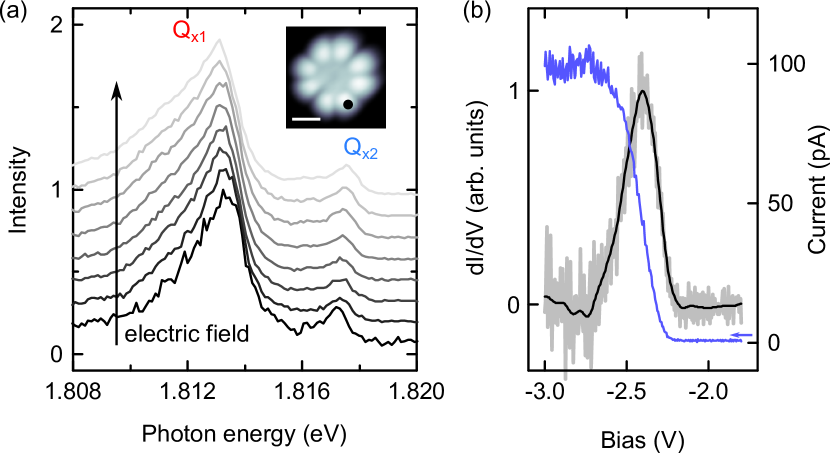
The topographic STM image in Fig. 1(c) shows two H2Pc molecules adsorbed on a NaCl island. This image reveals a slightly dimmer contrast in the center of the left molecule (labelled type 1), as compared to the right molecule (labelled type 2). This behaviour has been attributed to slightly different geometries of the two molecules adsorbed on top of the NaCl ionic crystal [39]. The difference in adsorption geometries also affects the fluorescence properties of the molecules as can be seen in the STML spectra of type 1 and 2 molecules provided in Fig. 1(d). Here, the molecules were driven to their excited states by tunneling electrons at = -2.5 V applied to the sample and the tip-assisted light emission of these molecular excitons was detected in the far field. These high-resolution spectra show the main fluorescence transition, Qx, of H2Pc, which is associated with a dipole moment oriented along the two hydrogens of the central core of the molecule. In Fig. 1(d), this transition appears as a doublet of lines labelled Qx1 and Qx2, whose energy separation is different for type 1 and type 2 molecules. This duplication of the Qx line has been attributed to the fast tautomerization of the central hydrogens within H2Pc during the acquisition of an STML spectrum [Fig. 1(e)] [39]. The positions of hydrogen atoms are marked by ellipses in the inset of Fig. 1(e). When recording time-integrated spectra, one simultaneously records the fluorescence of both tautomers. The STML spectra of type 1 molecules feature a large difference between the Qx1 and Qx2 excitonic lines which has been attributed to substantially different adsorption configurations of the two tautomers on the NaCl surface [39]. Type 1 molecules can therefore be used to unambiguously separate the spectral contributions of Qx1 and Qx2, a property which we exploit in Section III. As we detail in this paper (Section IV), the small energy difference in the case of type 2 molecules finds its origin in the coupling of the exciton with the electromagnetic fields induced in the presence of the STM tip. The first evidence of the influence of this coupling is provided in Fig. 1(e), where the spectral characteristics of a type 2 molecule are monitored as a function of the tip-molecule distance. By laterally positioning the tip as marked in Fig. 1(e) we ensure that Qx1 and Qx2 experience non-equivalent interaction with the electromagnetic environment induced by the tip. Similarly to what was reported in [35], this distance-dependent spectrum reveals a shift of the Qx1 line towards lower energies when the tip-molecule distance is reduced [Fig. 1(e)]. In contrast, we observe a shift of the Qx2 line towards higher energies. In both cases, these energy shifts are accompanied by a systematic enlargement of the Qx1 and Qx2 line widths.
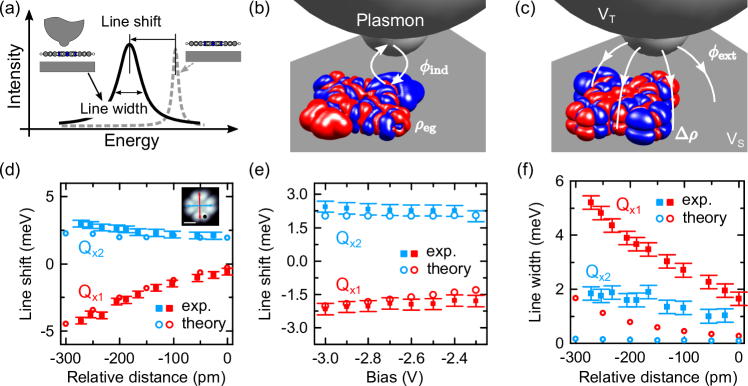
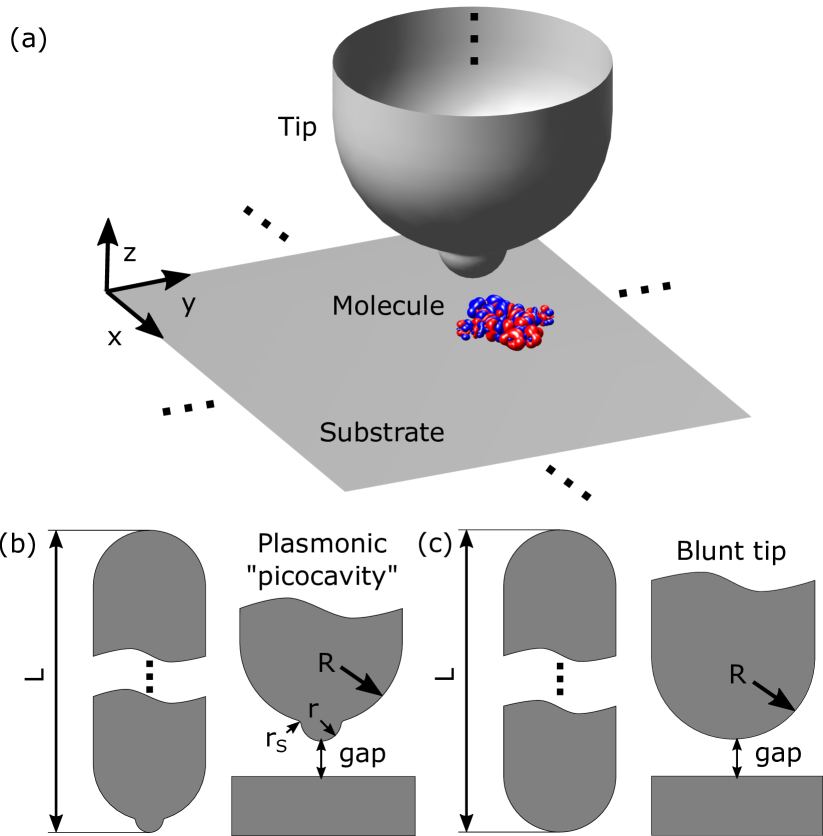
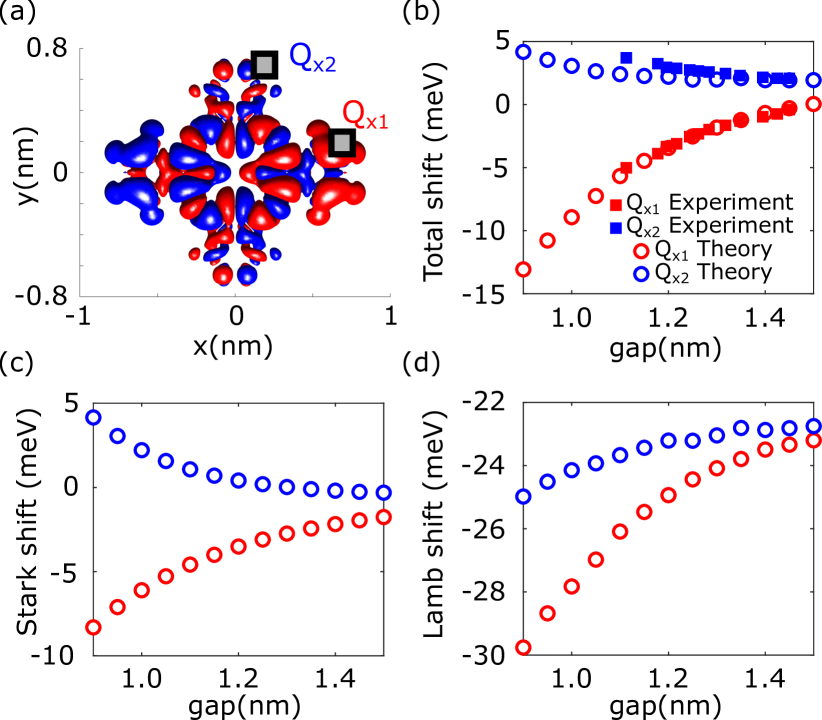
To interpret these line shifts and line broadening we developed a theoretical approach accounting for the electromagnetic interactions occurring between the molecular chromophore and the plasmonic picocavity [Fig. 2(a)]. Additional details are provided in Appendix A. First we consider the electron transition charge density for the optical transition at frequency between the ground (g) and excited (e) electronic states of the molecule, calculated using time-dependent density-functional theory (TD-DFT) [48]. The transition charge density can be viewed as an oscillating electron charge acting as a source stimulating the plasmonic response of the cavity, which here takes the form of the induced plasmonic potential [Fig. 2(b)]. This potential then acts back on the exciton causing a line shift (Lamb shift), and broadens the excitonic emission line by (Purcell effect). We additionally consider that the molecule is exposed to a strong inhomogeneous electrostatic potential resulting from the bias applied between the tip and the substrate [Fig. 2(c)]. This potential modifies the energies of the electronic ground and excited states via the DC Stark effect resulting in another shift of the excitonic energy , which is merely the energy difference resulting from the redistribution of charge (charge transfer) associated with the electronic excitation in the molecule. Here, is the difference charge density shown in Fig. 2(c), and () is the ground (excited) state charge density.
Armed with this theoretical framework, we compare the line shifts and line widths recorded experimentally (full squares) with the theoretical prediction (empty circles) and plot them as a function of the relative tip-sample distance in Fig. 2(d) and (f). These approach curves are plotted for two excitons Qx1 and Qx2, whose orientations with respect to the tip are non-equivalent, in the case of a type 2 H2Pc molecule. We obtain the experimental data by fitting the spectra shown in Fig. 1(e) using the procedure described in Appendix B.
As the experimentally available tip-sample distance and line shifts are relative, in the theoretically calculated data we choose the origin of the tip-substrate distance (i.e. the gap size) guided by the measured values and infer from the experimental data that the frequency of the exciton of the molecule on the substrate unperturbed by the tip is eV as detailed in Appendix C. We observe two qualitatively different trends for the total line shift shown in Fig. 2(d) for Qx1 (red markers) and Qx2 (blue markers) excitons as a function of the relative tip-sample distance. The excitonic line of Qx1 is red shifting as the tip approaches while the opposite trend is observed for Qx2. As we detail in Appendix C, in our setup the Lamb shift always redshifts the exciton frequency irrespective of the tip position. The Stark shift can either red- or blue-shift the exciton frequency depending on the STM tip position. In Appendix C we show that the Stark and Lamb shift jointly lower the frequency of Qx1 for the tip position marked by a black dot in the inset of Fig. 2(d). For the same tip position, the Stark effect blue shifts the Qx2 exciton and overrides the Lamb effect. The role played by the Stark shift is confirmed experimentally [see Fig. 2(e) and Appendix D] by monitoring the Qx1 and Qx2 line positions as a function of voltage while keeping the tip-molecule distance fixed. In this configuration, the plasmon-exciton coupling is constant. The line shifts in that situation are therefore exclusively related to the increasing electrical field, and thus directly measure the Stark shift. This effect is accounted for by our model [empty circles in Fig. 2(e)].
In Fig. 2(f), experiment and theory also report an increasing line width with decreasing tip-sample distance for Qx1 and Qx2. In the theory, this reflects the increased decay rate of the exciton into plasmons by the Purcell effect. The experiments reveal a similar behaviour, with an offset of 1 meV suggesting an additional decoherence channel not accounted for in the simulations (e.g., interaction of the excitons with substrate phonons or low-energy vibrations). As the experimental tendencies are well reproduced by our theoretical predictions, we can tentatively assign the component of the line broadening that depends on the tip position to the plasmonic Purcell effect. Overall, this indicates an excited state lifetime of the order of 1 ps, about three orders of magnitude faster than what is expected for the free molecule [49, 50], and highlights the strong amplification of the chromophore emission provided by the plasmonic picocavity. The plasmon-induced line broadening recorded for Qx1 is considerably larger than for Qx2 as the relative orientations of the excitonic dipolar moments with respect to the tip differ for the two excitons, resulting in larger plasmon-exciton coupling strengths for Qx1 than for Qx2. Importantly, the plasmon-induced broadening of the excitonic line is expected to be free of the influence of the electrostatic field (which only results in the energy shift of the line). The modification of the line width therefore provides a direct measure of the plasmon-exciton coupling.
III Mapping the Purcell, Lamb and Stark effect
The shifts and broadening of the fluorescence lines induced by the Stark, Lamb, and Purcell effects suggest a modality of STML based on the mapping of these signals. This technique could be used to acquire hyper-resolved information on the molecular excitons and their coupling to the picocavity plasmons.
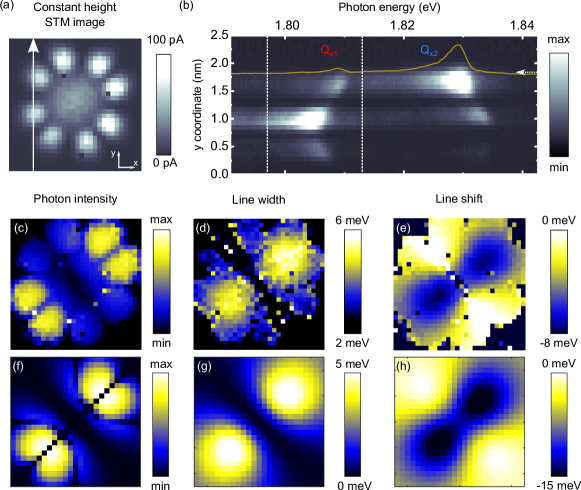
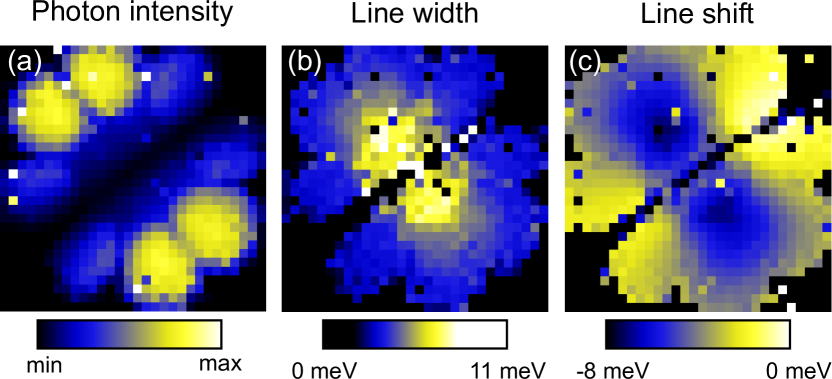
To demonstrate this capability, we have recorded fluorescence spectra at each pixel of a constant height STM current image [Fig. 3(a)] of a type 1 H2Pc. As only the effect of the lateral position of the tip is of interest here, the map was recorded in constant height mode to avoid any changes of the tip-molecule distance that would affect the measurement of the line shift and line width.
Fig. 3(b) is a 2D representation of successive spectra acquired along the vertical arrow in Fig. 3(a) where the Qx1 and Qx2 contributions can be identified. Similarly to what was reported in Fig. 1(e), the intensity, energy position and width of the fluorescence lines vary as a function of the lateral position of the tip with respect to the molecule. As the energy separation between the Qx1 and Qx2 lines of type 1 molecules is substantially larger than their line shifts, the analysis of one peak is not perturbed by the presence of the other. In Fig. 3(c) to (e) we show the position-dependent maps of the Qx1 line characteristics recorded simultaneously with the current map in Fig. 3(a). The spectral range of the emission is marked by the white dashed lines in Fig. 3(b). In Fig. 3(c) one first identifies lobes that are characteristic of the highest occupied molecular orbital (HOMO) of the molecule. One also notices a dark node that crosses the molecule from the top left to the bottom right corner of the Fig. 3(c) photon intensity map. In Fig. 3(d) and (e) we display the evolution of the line width and the energy of the Qx1 exciton, respectively, for each position of the tip with respect to the molecule. These images reveal similar two-lobe patterns oriented along the Qx1 transition dipole moments of the molecule where the width of the emission line is broader and the line red-shifted compared to spectra recorded aside from the lobes. However, while these lobes appear rather homogeneous and round in the line-width map, they adopt a more elongated shape in the line-shift one. Similar data, tilted by 90∘, are recorded for the Qx2 contribution (see Appendix E).
To interpret these results, we apply our theoretical model considering the picocavity formed between the silver substrate and an atomic scale protrusion on the silver STM tip (see Appendix A) and calculate constant-height maps of the light intensity emitted by the electrically pumped molecule [Fig. 3(f)], plasmon-induced line width [Fig. 3(g)], and line shift [Fig. 3(h)]. The theoretically calculated maps are in excellent agreement with the experiment. As we discussed in [39], in the intensity maps [Fig. 3(c,f)] the information about the plasmon-exciton interaction is inherently convoluted with experimental features arising from the electron tunneling, which are proportional to the density of states associated with the HOMO of the H2Pc molecule. Our theoretical Purcell map reproduces both the pattern and the amplitude of the changes of our experimental line-width maps. Based on this agreement, we attribute the line-width maps in Fig. 3(d,g), to the changes of the chromophore’s excited state lifetime as a function of tip position. The line-width maps can therefore be interpreted as an artefact-free optical image of the chromophore. Finally, the maps of the relative line shifts shown in Fig. 3(e,h) reveal an elongated two-lobe pattern featuring the same symmetry as the one obtained in Fig. 3(d,g). However, in this map, the electrostatic and electrodynamic contributions to the exciton energy shift are entangled.
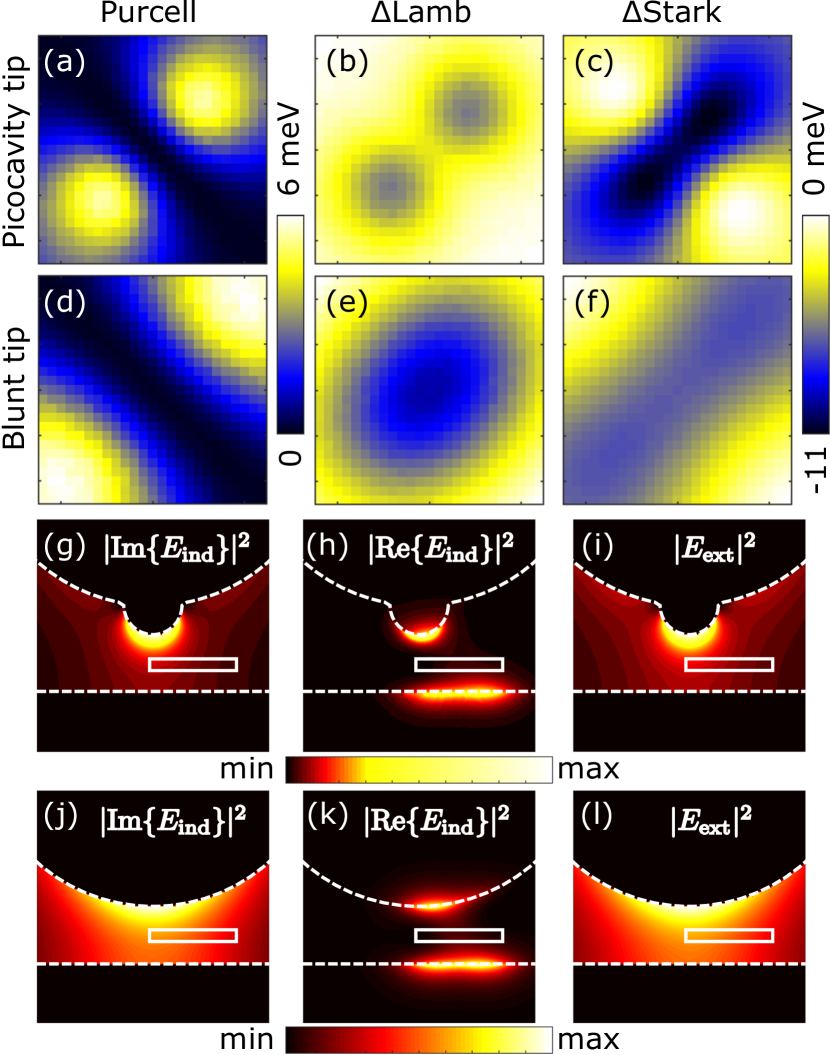
To further elucidate the physical effects underlying experimental and theoretical maps in Fig. 3, we analyze the respective role of the plasmonic Purcell effect, the Lamb shift, and the Stark effect for both a sharp picocavity tip [Fig. 4(a-c)], and a blunt tip missing the sharp protrusion [Fig. 4(d-f)]. The line broadening due to the Purcell effect [Fig. 4(a,d)] features the two-lobe structure for both tip shapes but is considerably delocalised when the blunt tip is considered. This points towards the importance of the picocavity in achieving HRFM. In [Fig. 4(b,e)] and [Fig. 4(c,f)] we show the Lamb and Stark contributions to the relative line-shift maps, respectively. For the picocavity tip, the Lamb shift map features a two-lobe pattern whereas the Stark shift map reports a more elongated structure that strongly resembles the experimental data. These data also reveal the smaller magnitude of the Lamb shift variations and indicates the prevalence of the Stark effect in the line-shift map. On the other hand, when the blunt tip is considered, the Lamb and Stark shift variations are comparable in magnitude. As for the Purcell effect, their maps revealed considerably less resolved patterns than for the picocavity tip, where the two-lobe structures cannot be recognized anymore.
Despite both being the result of the plasmon-exciton interaction, the patterns observed in the maps of the Lamb shift are qualitatively different from the maps of the line width. This is especially apparent for the blunt tip. The origin of this effect can be understood from the spatial distribution of the imaginary part of the induced plasmonic field in the cavity (, with ) responsible for the line broadening [Fig. 4(g,j)], and its real part () responsible for the Lamb shift [Fig. 4(h,k)]. We consider the picocavity tip in Fig. 4(g-i), and the blunt tip in Fig. 4(j-l). The spatial distribution of the imaginary part of the induced plasmonic field corresponds to the field intensity generated by the dipolar plasmonic mode oscillating along , which we tune to be resonant with the exciton by adjusting the tip geometry as detailed in Appendix A. This field distribution is an intrinsic property of the plasmonic picocavity and is therefore independent of the position of the source molecule. This single resonant dipolar plasmonic mode thus dominantly contributes to the Purcell effect and in turn mediates the far-field excitonic radiation recorded in STML. On the contrary, the real part of the induced field is strongly concentrated on the metal surfaces closely surrounding the molecule (see the bright spot on the metal surfaces below and above the molecule) and depends strongly on the molecular position (marked by the white rectangle). This localization is caused by the blue-detuned higher-order surface plasmon modes acting collectively as a plasmonic pseudomode that red-shifts the excitonic peak [51, 52]. The role of the picocavity, in this case, is to further localize the plasmonic response to the protrusion which is thus sensitive to the spatial variation of the excitonic transition-charge density, highlighting that the chromophore cannot be considered as a simple point dipole [52, 45]. Finally, features a strong gradient (electric field) in the direction due to the bias voltage. We show the magnitude of the electric field in Fig. 4(i) for the picocavity tip and Fig. 4(l) for the blunt tip. The protrusion of the picocavity tip additionally generates a strong gradient of in the plane of the substrate which is significant even across the geometrical extent of the molecule ( nm). It is this spatial inhomogeneity that results in the strong dependence of the DC Stark shift on the relative position of the molecule with respect to the tip.
IV HRFM of degenerate excitons
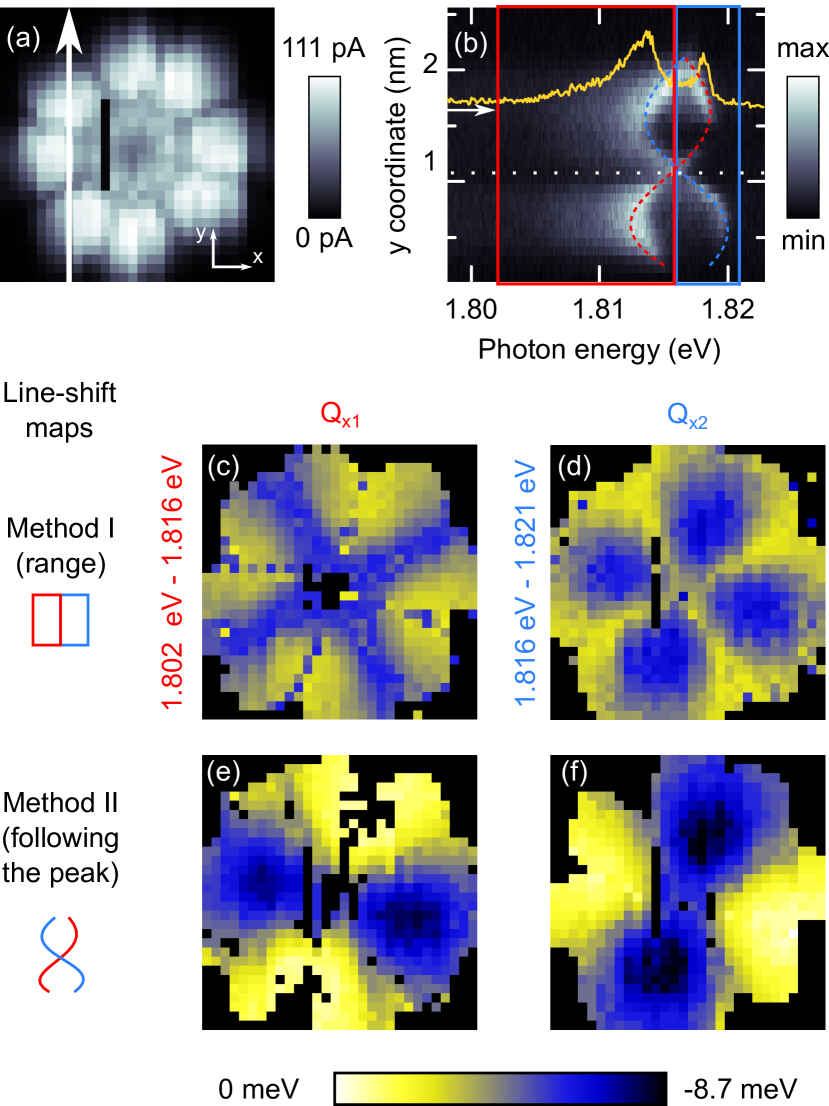
Having fully addressed the nature of the contrasts in HRFM maps of a type 1 molecule, we eventually apply this approach to a H2Pc molecule of type 2 [Fig. 5(a)] that displays a smaller energy separation between the Qx1 and Qx2 lines. Fig. 5(b) is the 2D representation of successive spectra acquired along the vertical arrow in Fig. 5(a), analogue to that in Fig. 3(b) for the type 1 molecule. The yellow curve overlaid on the plot represents the STML spectrum indicated by a short white arrow where Qx1 and Qx2 contributions are identified. Similarly to what is reported for the type 1 molecule, the 2D plot in Fig. 5(b) reveals an energy shift of the Qx1 and Qx2 lines as a function of the tip position. However, as the energy separation between the Qx1 and Qx2 lines is smaller for type 2 molecule, a configuration is reached (white dotted line) where the two contributions are degenerate. For larger and smaller values of , the two spectral contributions can be separated again. Following an approach similar to that used in Fig. 3, in Fig. 5(c) and (d) we generated two line-shift maps by estimating the energy of the intensity maxima in the red and blue energy windows overlaid on Fig. 5(b). In this case, one assumes that the energy of the Qx1 line (Qx2 line) in Fig. 5(b) is always smaller (higher) than 1.816 eV, the energy at which the two peaks appear degenerate. In contrast with the maps obtained on type 1 H2Pc, the line-shift maps reveal two different patterns of an unexpected four-fold symmetry. We also generated line-shift maps assuming that the Qx1 line (Qx2 line) keeps shifting to higher (lower) energy after crossing the position corresponding to degenerate Qx1 and Qx2 contributions [marked by a dashed line in Fig. 5(b)]. This means considering that the energy of the Qx1 line (Qx2 line) follows the red (blue) dashed curve. Line-shifts maps generated with this method reveal the characteristic two-fold symmetry patterns, tilted 90∘ from each other, expected for the Qx1 and Qx2 contributions. From this analysis, we conclude that type 2 molecules naturally exhibit degenerate Qx1 and Qx2 transitions, a degeneracy that is lifted by the couplings of the tip with each of the two excited states whose strengths vary as a function of the lateral tip position.
V Conclusions and outlook
In this manuscript, we decipher the role played by electrostatic and electromagnetic interactions contributing to the unmatched spatial resolution obtained in STM-induced luminescence measurements of single molecules. This enables realizing hyper-resolved fluorescence mapping of two quantities: the width and the shift of fluorescence lines that, in contrast to more standard intensity maps, provide information completely free of features related to the electron excitation efficiency. These line-shift and width maps unravel the interaction between the excited states of a chromophore with the electrodynamic fields confined at the plasmonic picocavity, revealing the emergence of the Purcell, Lamb, and Stark effects. Their respective impact on the fluorescence maps is dissected with an approach that combines ab-initio and electrodynamical calculations.
We foresee that these approaches may be used to reveal new characteristics of molecular systems studied in former STML works discussing line intensity mapping, in particular those where emission lines are very close in energy. They may also open a venue to understand and design correlated studies of optical and electrical properties mediated by a single molecule in a junction. In addition to the information provided by standard STM, the HRFM photon intensity maps reflect the microscopic mechanism of electrical exciton pumping [39], the maps of line widths reveal optical properties of the exciton, and the Stark shift maps probe the redistribution of the electron charge between the ground and the excited state and can be well adapted to the study of molecular charge-transfer excitons. This strong Stark effect can be further employed to either gate the energy of individual excitons, for example in coupled multi-molecular architectures [30, 31, 53], or sense local electrostatic fields. Similarly, sensing of the electromagnetic environment can be obtained by monitoring the Purcell effect. Microscopically controlled Stark shift of excitons has also been proposed to be at the core of molecular optomechanical devices [54], quantum transducers between superconducting qubits and optical photons [55] or demonstrated to control strong coupling [56]. The tool set provided by the modalities of STML demonstrated in this Article is therefore particularly suited to study the basic building blocks of next-generation organic light-emitting diodes, organic solar cells, or even molecular sources of non-classical light and molecular quantum technologies in general [6].
VI Methods
The STM data were acquired with a low temperature (4.5 K) ultrahigh-vacuum Omicron setup adapted to detect the light emitted at the tip-sample junction. The optical detection setup is composed of a spectrograph coupled to a CCD camera and provides a spectral resolution of 0.2 nm [39]. Tungsten STM-tips were introduced in the sample to cover them with silver to tune their plasmonic response. The Ag(111) substrates were cleaned with successive sputtering and annealing cycles. Approximately 0.5 monolayer of NaCl was sublimed on Ag(111) kept at room temperature, forming square bi- and tri-layers after mild post-annealing. Free-base Phthalocyanine (H2Pc) molecules were evaporated on the cold ( 5 K) NaCl/Ag(111) sample in the STM chamber. As the acquisition of each optical spectrum of the HRFM maps requires a long accumulation time, an atomic tracking procedure is used to correct the x,y,z position of the STM tip between the acquisition of each pixel, ensuring a full correction of residual thermal drifts that may have detrimental effects on STM measurements requiring long acquisition time.
Acknowledgements
The authors thank Virginie Speisser for technical support and Alex Boeglin and Hervé Bulou for discussions. This project has received funding from the European Research Council (ERC) under the European Union’s Horizon 2020 research and innovation program (grant agreement No 771850) and the European Union’s Horizon 2020 research and innovation program under the Marie Skłodowska-Curie grant agreement No 894434. The Labex NIE (Contract No. ANR-11-LABX-0058_NIE), the International Center for Frontier Research in Chemistry (FRC), the Spanish Ministry of Science (Project No PID2019-107432GB-I00) and the Department of Education of the Basque Government (Project No IT1164-19) are acknowledged for financial support.
Appendices
Appendix A Theoretical modelling of the Lamb, Stark, and Purcell effect in a plasmonic picocavity
The electronic structure of a free-base phthalocyanine is approximated as an electronic two-level system composed of electronic ground and excited states. The excited electronic state in this case represents the Qx electronic transition of the molecule. We assume that the 90∘ tilted exciton of the molecule, Qy, is sufficiently energetically separated from the Qx excitonic transition so that neither the plasmonic interactions nor the Stark effect cause significant mixing of the two. The molecular excited and ground electronic states interact (i) with the static potential due to the bias voltage applied between the tip and the substrate, and (ii) with the dynamical plasmonic potential induced at the junction between the tip and substrate electrodes via their induced charge density. The electron charge density is represented by the operator , which can be expressed in the second quantization as:
| (1) |
where () are the fermionic single-particle annihilation (creation) operators with the indexes running over spatial orbitals and runs over the spin indices and . The densities are defined as with being the respective single-electron spatial orbitals, and the electron charge.
To calculate the molecular ground and excited states we use the linear-response time-dependent density functional theory using the B3LYP functional and 6-31g* basis set, as implemented in NWChem [48]. We obtain the excitations in the Tamm-Dancoff (configuration interaction singles – CIS) approximation. In this approximation the excited states are defined as linear combinations of electron-hole pairs created on top of the filled Fermi sea defined by the ground state:
| (2) |
where is the empty vacuum state. Further on we use the convention that , ,… run over the occupied states of the ground state, and , , … run over the unoccupied states. The excited state is generated from the ground state in the Tamm-Dancoff approximation as:
| (3) |
Here are coefficients fulfilling , and for singlet excitations we have .
A.1 The DC Stark effect in plasmonic picocavities
The DC Stark effect commonly refers to the shift of the energies of quantum states of a system exposed to an external static electric field. The interaction energy of this external field with the electron density of the system can be expressed by the Hamiltonian:
| (4) |
The external field usually acts as a perturbation to the potential of the quantum system and thus leads to energy shifts that can be obtained using the Rayleigh-Schrödinger perturbation theory. Using Eq. (4) we calculate the Stark shift experienced by the electronic excitation between the electronic ground state of energy and the excited state of energy using the first-order of perturbation theory as:
with .
We calculate the difference charge density by using the definition of the electronic excited state [Eq. (3)] and the definition of the density operator [Eq. (1)]. The electron density of is:
| (5) |
The electron density of the excited state can be shown to be:
| (6) |
The difference density therefore becomes:
| (7) |
We calculate the external potential due to the bias voltage applied between the tip and the substrate using the finite-element method as implemented in the AC/DC module of COMSOL Multiphysics. The geometry used for the calculation is schematically shown in Fig. 6. The tip is modelled as an elongated cylinder with hemispherical caps whose bottom surface additionally supports a sharp protrusion of radius nm conservatively accounting for the atomic sharpness of the tip. In the practical implementation we extract the molecular orbitals in the form of Gaussian cube files and use them as inputs for further post processing. In the sum given by Eq. (7) we consider the dominant coefficients .
A.2 The plasmon-induced Lamb shift and Purcell effect
We describe the plasmon-induced Lamb shift and broadening of the excitonic emission spectral lines of single molecules in STML in hybrid framework which combines the quantum properties of the molecular emitter with the classical linear-response description of the surface plasmons. The molecular emitter is represented by the position-dependent excitonic transition charge density which acts as a source of quasi-static electric field which triggers the plasmonic response in the surrounding material. The induced plasmonic potential can then be calculated using the linear-response theory, which can be expressed by defining a general response function of the dielectric environment as follows:
| (8) |
The response function relates at position and time with the time-dependent induced plasmonic potential at position and time . In the semi-classical approximation we assume that this potential is related to the mean value of the transition-charge density operator:
| (9) |
where is a mean value of the oscillating lowering operator of the molecular exciton , with the ground and the excited electronic state of the molecule, respectively, and is the time-independent distribution of the transition charge density:
| (10) |
In our calculation is extracted from NWChem in the form of a Gaussian cube file. We note that the transition dipole moment of the molecule is linked to the transition-charge density via . Using the rotating-wave approximation we can write an effective Hamiltonian of the molecule under the influence of the induced field as:
| (11) |
where H.c. stands for the Hermitian conjugate. We further assume that the electronic transition in the unperturbed molecule is described by the Hamiltonian :
| (12) |
with being the transition frequency of the unperturbed exciton. Under the influence of the exciton of the molecule experiences time-harmonic oscillation so that . The mean value of the operator , , evolving according to is thus governed by the linearized equation:
| (13) |
Next we assume that the induced potential acts in a perturbative way and induces only a minor change to the time evolution of . We therefore evaluate the time integral in the adiabatic approximation:
| (14) |
Where we have defined the Fourier transform of the response function , and the Fourier transform of the induced potential (i.e. the induced potential calculated in the frequency domain).
The time dependence of the mean value thus becomes:
| (15) |
with
| (16) |
The spectral response of the exciton can be obtained from the quantum regression theorem relating the dynamics of to the dynamics of the two-time correlation function [57], yielding
| (17) |
Here the frequency shift (Lamb shift), , and line broadening (Purcell effect), , induced by the plasmons is related to as
| (18) | |||
| (19) |
We use the expressions in Eq. (18) and Eq. (19) to calculate the Lamb shift and Purcell effect.
A.3 Quasi-static calculation of the plasmonic induced electric potential
We calculate the induced potential in the quasi-static approximation using the finite-element method implemented in the AC/DC module of COMSOL Multiphysics and describe the dielectric response of the silver tip and the substrate using the silver dielectric function obtained from [58]. In the calculations, we simplify the geometry of the tip as shown in Fig. 6. The geometry of the tip is tailored to provide a dipole plasmonic resonance along the long axis of the tip resonant with the molecular exciton. In this way, we account for the resonant plasmonic effects associated with the bright plasmonic mode of the tip that efficiently transmit the excitonic emission into the far field. We import the excitonic transition charge density from the TD-DFT calculation and use it as a source of the classical potential generated in the geometry defined by the tip and the substrate. We impose zero-potential on the boundary of the simulation domain ensuring convergence of the results.
A.4 Spectral response of the plasmonic cavity
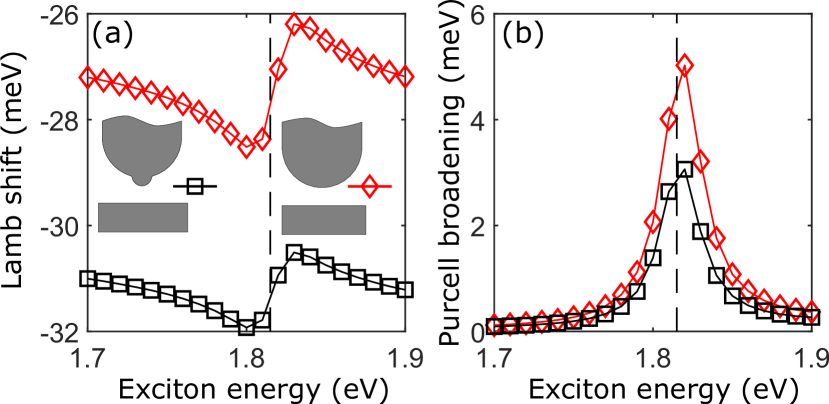
We show the spectral response of the plasmonic picocavity and the cavity formed by the blunt tip and the substrate shown in Fig. 6. To that end we place the molecule at the position nm and 0.5 nm above the substrate and fix the gap size to 1 nm. We consider that the plasmonic response is stimulated by the Qx exciton and treat the frequency of the exciton as a free parameter. For each frequency of the exciton we calculate the plasmonic Lamb shift and Purcell effect (broadening) and plot the results in Fig. 7. Figure 7(a) shows the spectral dependence of the Lamb shift, and Fig. 7(b) depicts it for the broadening of the exciton peak due to the plasmonic Purcell effect. The results for the picocavity are shown as red diamonds and for the blunt tip as black squares. A resonance feature is observed for the exciton energy around 1.815 eV which appears as a dip followed by a peak in the Lamb-shift spectra, and has the form of a peak in the Purcell-broadening spectra. This spectral feature can be attributed to the longitudinal dipole plasmon resonance of the tip described in the main text. We further notice that the resonance feature in the Lamb-shift spectra is strongly offset by a background shift induced by higher-order plasmon modes which dominate the overall shift. Furthermore, for the exciton energy corresponding to 1.815 eV, the shift caused resonantly by the dipole mode completely vanishes. On the other hand, the spectral response of the Purcell broadening is exclusively formed by the resonance feature caused by the interaction of the exciton with the resonant dipole plasmon mode. This supports the analysis introduced in Sec.III.
Appendix B Lorentzian fits of the Qx1 and Qx2 fluorescence lines.
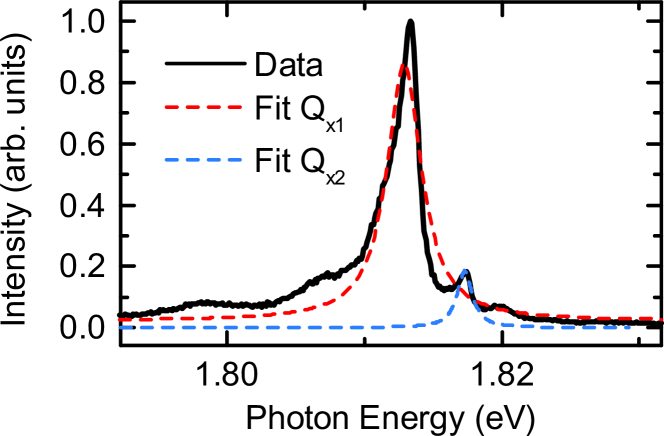
Figure 8 displays Lorentzian fits to the Qx1 and Qx2 lines. While these fits provide values for the light intensities, the peak widths and the peak positions of the two contributions that are easy to compare from one spectrum to the next, they fail to capture the asymmetric nature of the lines. As stated in the main text, this asymmetry may find its origin in different interactions (exciton-phonon, exciton-vibration, exciton-plasmon) whose spectral contributions to the STML spectra should be considered each time in a different manner. In the absence of a definitive statement regarding the peak asymmetry, we favor adjusting our spectra with simple Lorentzians that do not presume the origin of the phenomena.
Appendix C Stark and Lamb Shift as a function of gap size
We calculate the Stark shift and the Lamb shift as a function of the gap between the tip and the substrate and show the result in Fig. 9. In the numerical calculation we account for the experimentally nonequivalent orientation of Qx1 and Qx2 with respect to the tip by considering two positions of the tip nm (for Qx1), and nm (for Qx2) with respect to the transition charge density of Qx as shown in Fig. 9(a). In Fig. 9(b) we show the numerically calculated total shift of the exciton as a function of the gap between the tip and the substrate for Qx1 (red circles) and Qx2 (blue circles). Notice that in the theory we only determine the energy shift, but not the absolute value of the exciton energy. That is why in Fig. 9(b) we offset the theoretical and experimental data. We add a constant value of meV to the numerically calculated shift (the sum of Stark and Lamb shift). For comparison, we also display the experimentally recorded data shown in Fig. 2(d) from which we subtract the value of eV, which we interpret as the energy of the exciton on the substrate, unperturbed by the tip. Finally, we measure the relative distance shown in Fig. 2(d) with respect to gap nm. The contributions to the total shift originating from the Stark effect and the Lamb shift are shown in Fig. 9(c) and Fig. 9(d), respectively. This decomposition shows that the Stark shift gives rise to a decrease of the energy corresponding to Qx1 and an increase of the energy of Qx2 as the gap size is decreased. On the other hand, the Lamb shift leads to lowering of the excitonic energy for both Qx1 and Qx2 with decreasing gap size, as discussed in the main text.
Appendix D Probing Stark effect at a single-molecule level
In Fig. 10 we display normalized STML spectra acquired on the type 2 molecule discussed in Fig. 1(e) for the position marked by a black dot in the STM image in the inset, at a fixed tip-molecule distance (i.e., open feed-back loop) and for an increasing bias applied between the STM electrodes. As such, the plasmon-exciton interactions are kept constant, and the spectral shift of the Qx1 and Qx2 STML spectra can be readily associated to changes in the electrical field, i.e., the Stark effect. Here, one observes a subtle red-shift (blue-shift) of the Qx1 (Qx2) line with increasing electric field, an effect that is discussed in Fig. 2(e). Fig. 10(b) shows a constant height scanning tunneling spectroscopy measurement and the corresponding tunneling current recorded with the same tip position as the data in (a), showing how the density of states of the molecule changes over the considered voltage range.
Appendix E HRFM mapping of the Qx2 mode of a type 1 H2Pc molecule
In Fig. 11 we show the photon intensity, line-width and line-shift maps of the Qx2 line (1.797 eV h 1.837 eV) associated to the type 1 molecule of Fig. 3. As expected, these maps reveal similar patterns to the one of the Qx1 spectral line but tilted by 90∘. One also notices that the line-width maxima and line-shift minima are located slightly closer to the center of the molecule compared to the Qx1 maps, a behaviour that we tentatively associate to an environmental effect linked to different molecular dipole-substrate configurations.
References
- Moerner and Kador [1989] W. E. Moerner and L. Kador, Optical detection and spectroscopy of single molecules in a solid, Physical Review Letters 62, 2535 (1989).
- Orrit and Bernard [1990] M. Orrit and J. Bernard, Single pentacene molecules detected by fluorescence excitation in a p-terphenyl crystal, Physical Review Letters 65, 2716 (1990).
- Huang et al. [2009] B. Huang, M. Bates, and X. Zhuang, Super-resolution fluorescence microscopy, Annu. Rev. Biochem. 78, 993 (2009).
- Hell et al. [2015] S. W. Hell, S. J. Sahl, M. Bates, X. Zhuang, R. Heintzmann, M. J. Booth, J. Bewersdorf, G. Shtengel, H. Hess, P. Tinnefeld, A. Honigmann, S. Jakobs, I. Testa, L. Cognet, B. Lounis, H. Ewers, S. J. Davis, C. Eggeling, D. Klenerman, K. I. Willig, G. Vicidomini, M. Castello, A. Diaspro, and T. Cordes, The 2015 super-resolution microscopy roadmap, Journal of Physics D: Applied Physics 48, 443001 (2015).
- Lounis and Moerner [2000] B. Lounis and W. E. Moerner, Single photons on demand from a single molecule at room temperature, Nature 407, 491 (2000).
- Toninelli et al. [2020] C. Toninelli et al., (2020), arXiv:2011.05059 [quant-ph] .
- Purcell et al. [1946] E. M. Purcell, H. C. Torrey, and R. V. Pound, Resonance absorption by nuclear magnetic moments in a solid, Phys. Rev. 69, 37 (1946).
- Novotny and Hecht [2006] L. Novotny and B. Hecht, Principles of Nano-Optics (Cambridge University Press, 2006).
- Lamb and Retherford [1947] W. E. Lamb and R. C. Retherford, Fine structure of the hydrogen atom by a microwave method, Phys. Rev. 72, 241 (1947).
- Bethe [1947] H. A. Bethe, The electromagnetic shift of energy levels, Phys. Rev. 72, 339 (1947).
- Bethe et al. [1950] H. A. Bethe, L. M. Brown, and J. R. Stehn, Numerical value of the lamb shift, Phys. Rev. 77, 370 (1950).
- Power [1966] E. A. Power, Zero-point energy and the lamb shift, American Journal of Physics 34, 516 (1966).
- Stark [1914] J. Stark, Beobachtungen über den effekt des elektrischen feldes auf spektrallinien. i. quereffekt, Annalen der Physik 348, 965 (1914).
- Krems [2018] R. V. Krems, DC stark effect, in Molecules in Electromagnetic Fields (John Wiley & Sons, Ltd, 2018) Chap. 2, pp. 35–58.
- Betzig and Chichester [1993] E. Betzig and R. J. Chichester, Single molecules observed by near-field scanning optical microscopy, Science 262, 1422 (1993).
- Keilmann and Hillenbrand [2004] F. Keilmann and R. Hillenbrand, Near-field microscopy by elastic light scattering from a tip, Phil. Trans. R. Soc. A 362, 787 (2004).
- Frey et al. [2004] H. G. Frey, S. Witt, K. Felderer, and R. Guckenberger, High-resolution imaging of single fluorescent molecules with the optical near-field of a metal tip, Phys. Rev. Lett. 93, 200801 (2004).
- Novotny and Stranick [2006] L. Novotny and S. J. Stranick, Near-field optical microscopy and spectroscopy with pointed probes, Annu. Rev. Phys. Chem. 57, 303 (2006).
- Kühn et al. [2006] S. Kühn, U. Håkanson, L. Rogobete, and V. Sandoghdar, Enhancement of single-molecule fluorescence using a gold nanoparticle as an optical nanoantenna, Phys. Rev. Lett. 97, 017402 (2006).
- Hartschuh [2008] A. Hartschuh, Tip-enhanced near-field optical microscopy, Angew. Chem. Int. Ed. Engl. 47, 8178 (2008).
- Mauser and Hartschuh [2014] N. Mauser and A. Hartschuh, Tip-enhanced near-field optical microscopy, Chem. Soc. Rev. 43, 1248 (2014).
- Park et al. [2018] K.-D. Park, T. Jiang, G. Clark, X. Xu, and M. B. Raschke, Radiative control of dark excitons at room temperature by nano-optical antenna-tip purcell effect, Nature Nanotech. 13, 59 (2018).
- Zhang et al. [2013] R. Zhang, Y. Zhang, Z. C. Dong, S. Jiang, C. Zhang, L. G. Chen, L. Zhang, Y. Liao, J. Aizpurua, Y. Luo, J. L. Yang, and J. G. Hou, Chemical mapping of a single molecule by plasmon-enhanced raman scattering, Nature 498, 82 (2013).
- Lee et al. [2019] J. Lee, K. T. Crampton, N. Tallarida, and V. A. Apkarian, Visualizing vibrational normal modes of a single molecule with atomically confined light, Nature 568, 78 (2019).
- Yang et al. [2020] B. Yang, G. Chen, A. Ghafoor, Y. Zhang, Y. Zhang, Y. Zhang, Y. Luo, J. Yang, V. Sandoghdar, J. Aizpurua, Z. Dong, and J. G. Hou, Sub-nanometre resolution in single-molecule photoluminescence imaging, Nat. Photonics 14, 693 (2020).
- Qiu et al. [2003] X. H. Qiu, G. V. Nazin, and W. Ho, Vibrationally resolved fluorescence excited with submolecular precision, Science 299, 542 (2003).
- Chen et al. [2010] C. Chen, P. Chu, C. A. Bobisch, D. L. Mills, and W. Ho, Viewing the interior of a single molecule: Vibronically resolved photon imaging at submolecular resolution, Phys. Rev. Lett. 105, 217402 (2010).
- Chong et al. [2016a] M. C. Chong, G. Reecht, H. Bulou, A. Boeglin, F. Scheurer, F. Mathevet, and G. Schull, Narrow-line single-molecule transducer between electronic circuits and surface plasmons, Phys. Rev. Lett. 116, 036802 (2016a).
- Chong et al. [2016b] M. C. Chong, L. Sosa-Vargas, H. Bulou, A. Boeglin, F. Scheurer, F. Mathevet, and G. Schull, Ordinary and Hot Electroluminescence from Single-Molecule Devices: Controlling the Emission Color by Chemical Engineering, Nano Letters 16, 6480 (2016b).
- Zhang et al. [2016] Y. Zhang, Y. Luo, Y. Zhang, Y.-J. Yu, Y.-M. Kuang, L. Zhang, Q.-S. Meng, Y. Luo, J.-L. Yang, Z.-C. Dong, and J. G. Hou, Visualizing coherent intermolecular dipole-dipole coupling in real space, Nature 531, 623 (2016).
- Imada et al. [2016] H. Imada, K. Miwa, M. Imai-Imada, S. Kawahara, K. Kimura, and Y. Kim, Real-space investigation of energy transfer in heterogeneous molecular dimers, Nature 538, 364 (2016).
- Große et al. [2017] C. Große, P. Merino, A. Rosławska, O. Gunnarsson, K. Kuhnke, and K. Kern, Submolecular Electroluminescence Mapping of Organic Semiconductors, ACS Nano 11, 1230 (2017).
- Doppagne et al. [2017] B. Doppagne, M. C. Chong, E. Lorchat, S. Berciaud, M. Romeo, H. Bulou, A. Boeglin, F. Scheurer, and G. Schull, Vibronic Spectroscopy with Submolecular Resolution from STM-Induced Electroluminescence, Phys. Rev. Lett. 118, 127401 (2017).
- Imada et al. [2017] H. Imada, K. Miwa, M. Imai-Imada, S. Kawahara, K. Kimura, and Y. Kim, Single-Molecule Investigation of Energy Dynamics in a Coupled Plasmon-Exciton System, Phys. Rev. Lett. 119, 013901 (2017).
- Zhang et al. [2017a] Y. Zhang, Q.-S. Meng, L. Zhang, Y. Luo, Y.-J. Yu, B. Yang, Y. Zhang, R. Esteban, J. Aizpurua, Y. Luo, J.-L. Yang, Z.-C. Dong, and J. G. Hou, Sub-nanometre control of the coherent interaction between a single molecule and a plasmonic nanocavity, Nat. Commun. 8, 15225 (2017a).
- Zhang et al. [2017b] L. Zhang, Y.-J. Yu, L.-G. Chen, Y. Luo, B. Yang, F.-F. Kong, G. Chen, Y. Zhang, Q. Zhang, Y. Luo, J.-L. Yang, Z.-C. Dong, and J. G. Hou, Electrically driven single-photon emission from an isolated single molecule, Nature Communications 8, 580 (2017b).
- Doppagne et al. [2018] B. Doppagne, M. C. Chong, H. Bulou, A. Boeglin, F. Scheurer, and G. Schull, Electrofluorochromism at the single-molecule level, Science 361, 251 (2018).
- Doležal et al. [2019] J. Doležal, P. Merino, J. Redondo, L. Ondič, A. Cahlík, and M. Švec, Charge Carrier Injection Electroluminescence with CO-Functionalized Tips on Single Molecular Emitters, Nano Lett. 19, 8605 (2019).
- Doppagne et al. [2020] B. Doppagne, T. Neuman, R. Soria-Martinez, L. E. P. López, H. Bulou, M. Romeo, S. Berciaud, F. Scheurer, J. Aizpurua, and G. Schull, Single-molecule tautomerization tracking through space- and time-resolved fluorescence spectroscopy, Nat. Nanotechnol. 15, 207 (2020).
- Rai et al. [2020] V. Rai, L. Gerhard, Q. Sun, C. Holzer, T. Repän, M. Krstić, L. Yang, M. Wegener, C. Rockstuhl, and W. Wulfhekel, Boosting Light Emission from Single Hydrogen Phthalocyanine Molecules by Charging, Nano Lett. 20, 7600 (2020).
- Kuhnke et al. [2017] K. Kuhnke, V. Turkowski, A. Kabakchiev, T. Lutz, T. S. Rahman, and K. Kern, Pentacene Excitons in Strong Electric Fields, Chem. Phys. Chem. 19, 277 (2017).
- Benz et al. [2016] F. Benz, M. K. Schmidt, A. Dreismann, R. Chikkaraddy, Y. Zhang, A. Demetriadou, C. Carnegie, H. Ohadi, B. de Nijs, R. Esteban, J. Aizpurua, and J. J. Baumberg, Single-molecule optomechanics in “picocavities”, Science 354, 726 (2016).
- Barbry et al. [2015] M. Barbry, P. Koval, F. Marchesin, R. Esteban, A. G. Borisov, J. Aizpurua, and D. Sánchez-Portal, Atomistic Near-Field Nanoplasmonics: Reaching Atomic-Scale Resolution in Nanooptics, Nano Letters 15, 3410 (2015).
- Urbieta et al. [2018] M. Urbieta, M. Barbry, Y. Zhang, P. Koval, D. Sánchez-Portal, N. Zabala, and J. Aizpurua, Atomic-scale lightning rod effect in plasmonic picocavities: A classical view to a quantum effect, ACS Nano 12, 585 (2018).
- Rossi et al. [2019] T. P. Rossi, T. Shegai, P. Erhart, and T. J. Antosiewicz, Strong plasmon-molecule coupling at the nanoscale revealed by first-principles modeling, Nat. Commun. 10, 1 (2019).
- Wu et al. [2021] T. Wu, W. Yan, and P. Lalanne, Bright plasmons with cubic nanometer mode volumes through mode hybridization, ACS Photonics 8, 307 (2021).
- Rosławska et al. [2021] A. Rosławska, P. Merino, A. Grewal, C. C. Leon, K. Kuhnke, and K. Kern, Atomic-scale structural fluctuations of a plasmonic cavity (2021), arXiv:2102.11671 [cond-mat.mes-hall] .
- Valiev et al. [2010] M. Valiev, E. J. Bylaska, N. Govind, K. Kowalski, T. P. Straatsma, H. J. Van Dam, D. Wang, J. Nieplocha, E. Apra, T. L. Windus, et al., Nwchem: a comprehensive and scalable open-source solution for large scale molecular simulations, Comput. Phys. Commun. 181, 1477 (2010).
- Sibata et al. [2004] M. Sibata, A. Tedesco, and J. Marchetti, Photophysicals and photochemicals studies of zinc(ii) phthalocyanine in long time circulation micelles for photodynamic therapy use, Eur. J. Pharm. Sci. 23, 131 (2004).
- Caplins et al. [2016] B. W. Caplins, T. K. Mullenbach, R. J. Holmes, and D. A. Blank, Femtosecond to nanosecond excited state dynamics of vapor deposited copper phthalocyanine thin films, Phys. Chem. Chem. Phys. 18, 11454 (2016).
- Delga et al. [2014] A. Delga, J. Feist, J. Bravo-Abad, and F. J. Garcia-Vidal, Theory of strong coupling between quantum emitters and localized surface plasmons, J. Opt. 16, 114018 (2014).
- Neuman et al. [2018] T. Neuman, R. Esteban, D. Casanova, F. J. García-Vidal, and J. Aizpurua, Coupling of Molecular Emitters and Plasmonic Cavities beyond the Point-Dipole Approximation, Nano Lett. 18, 2358 (2018).
- Cao et al. [2021] S. Cao, A. Rosławska, B. Doppagne, M. Romeo, M. Féron, F. Chérioux, H. Bulou, F. Scheurer, and G. Schull, Energy funneling within multi-chromophore architectures monitored with sub-nanometer resolution, Nat. Chemistry 10.1038/s41557-021-00697-z (2021).
- Dutreix et al. [2020] C. Dutreix, R. Avriller, B. Lounis, and F. Pistolesi, Two-level system as topological actuator for nanomechanical modes, Phys. Rev. Research 2, 023268 (2020).
- Das et al. [2017] S. Das, V. E. Elfving, S. Faez, and A. S. Sørensen, Interfacing superconducting qubits and single optical photons using molecules in waveguides, Phys. Rev. Lett. 118, 140501 (2017).
- Laucht et al. [2009] A. Laucht, F. Hofbauer, N. Hauke, J. Angele, S. Stobbe, M. Kaniber, G. Böhm, P. Lodahl, M.-C. Amann, and J. J. Finley, Electrical control of spontaneous emission and strong coupling for a single quantum dot, New Journal of Physics 11, 023034 (2009).
- Breuer and Petruccione [2003] H.-P. Breuer and F. Petruccione, The theory of open quantum systems (Oxford university press, 2003).
- Johnson and Christy [1972] P. B. Johnson and R. W. Christy, Optical constants of the noble metals, Phys. Rev. B 6, 4370 (1972).