The MINERA Collaboration
Constraining the NuMI neutrino flux using inverse muon decay reactions in MINERvA
Abstract
Inverse muon decay, , is a reaction whose cross-section can be predicted with very small uncertainties. It has a neutrino energy threshold of GeV and can be used to constrain the high-energy part of the flux in the NuMI neutrino beam. This reaction is the dominant source of events which only contain high-energy muons nearly parallel to the direction of the neutrino beam. We have isolated a sample of hundreds of such events in neutrino and anti-neutrino enhanced beams, and have constrained the predicted high-energy flux.
I Introduction
Neutrino oscillation experiments [1, 2, 3, 4] depend on measurements of neutrino interactions at a near detector as a companion measurement that probes the flux and neutrino interaction cross sections that affect the experiment. However, there are significant uncertainties both in the cross sections for neutrino interactions and in the reconstruction of neutrino energies of most reactions observed at near detectors. These uncertainties make it difficult to use only measurements at a near detector to measure the neutrino flux and separate it from the effects of neutrino interactions.
One partial solution to this problem is to measure scattering of neutrinos from atomic electrons. Such scattering is accurately predicted in the Standard Model, with uncertainties of a per cent or less primarily due to hadronic effects in radiative corrections [5]. These reactions then provide a measurement of the flux which is independent of interaction uncertainties and can help to break degeneracies between those interaction uncertainties and uncertainties in predictions of the flux. This technique has been demonstrated by the MINERvA experiment in scattering [6, 7] and has been studied for application in the future DUNE [3] experiment [8].
Another neutrino-electron scattering reaction is inverse muon decay (IMD), . The IMD process has a threshold energy of GeV, and a total cross section given at tree level by [9]
| (1) |
where are the masses of the muon and electron, is the Fermi constant, and the relativistic invariant quantity, , is the square of the center-of-mass scattering energy. When is measured in the lab frame, . The spectrum of muons emitted for a fixed neutrino energy in the lab frame, , is approximately uniform with limits between and , with small corrections to the uniformity and the kinematic limits of order and , respectively. Radiative corrections to the process have been calculated, and these decrease the tree level prediction above by several percent, with the largest decreases at the lowest neutrino energies and the kinematic limits [9]. The kinematics of IMD require
| (2) |
where and is the muon angle with respect to the incoming neutrino direction. Practically, this means the muon will be very close in direction to the incoming neutrino. There is a related inverse muon decay process, , with identical kinematics and a practically indistinguishable final state. In our experiment, the number of above threshold is at most a few percent of the number of above threshold, so this contribution is unimportant.
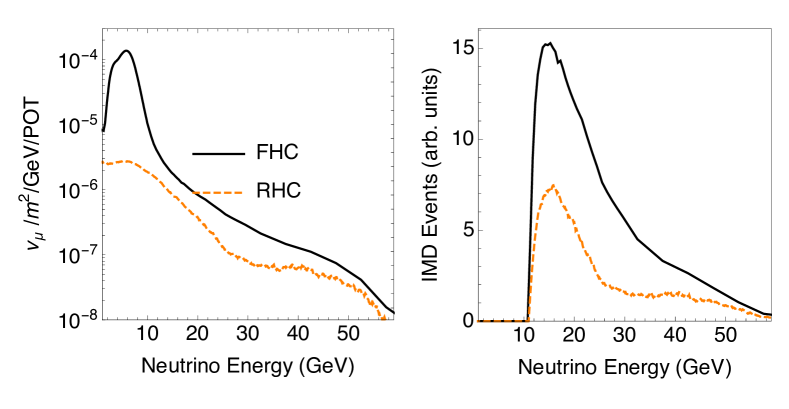
For the purposes of constraining neutrino flux, IMD is only sensitive to a single neutrino type in the beam, muon neutrinos, and is only initiated by neutrinos above the threshold. From just the spectrum of muons alone, there is only a weak correlation between muon energy and neutrino energy. Therefore, the number of IMD events measures some weighted integral of over the reaction threshold. For the NuMI neutrino beam, whose neutrino-dominated (“forward horn current” or FHC) and anti-neutrino-dominated “reverse horn current” or RHC) fluxes are shown in Fig. 1, the focusing peak is below the threshold so IMD is sensitive only to the energies greater than the focusing peak, the “high-energy tail”, of the beam. This tail has a large contribution from neutrinos which are unfocused or under-focused by the beam optics [10, 11].
Backgrounds to the measurement come almost entirely from high-energy neutrino quasielastic scattering on bound neutrons in nuclei, with small contributions from multi-nucleon and inelastic processes. Background models described below will be improved with constraints from “sideband” samples at lower and higher than the IMD signal.
II The MINERvA detector and simulation
The MINERvA experiment employs a fine-grained tracking detector for recording neutrino interactions produced by the NuMI beamline at Fermilab [11, 12]. Neutrinos are created by directing 120 GeV protons from the Main Injector onto a graphite target. The resulting charged pions and kaons are focused by two magnetic horns. Choice of the polarity of the current in the magnetic horns gives either the FHC or RHC beams, as defined above, and this analysis uses data from both beams. Approximately 97 of the muon neutrinos that reach the MINERvA detector are produced by pion decay; the remainder are the result of kaon decay [11, 12]. At the largest neutrino energies, the fraction of neutrinos from kaons increases. For neutrinos produced from the highest energy pions and kaons, the focusing from the horns is generally ineffective, and so the numbers of high-energy in the FHC and RHC beams, particularly those originating from decays, are similar.
The MINERvA detector [13] consists of 120 hexagonal modules that create an active tracking volume preceded by a set of passive nuclear targets. This result includes only those interactions in the active tracking volume with a fiducial mass of 5.48 tons. The active target volume is surrounded by electromagnetic and hadronic calorimeters. Each tracking module has two planes composed of triangular polystyrene scintillator strips with a 1.7 cm strip-to-strip pitch. For three-dimensional reconstruction, planes are oriented in three different directions, 0∘ and 60∘ relative to the vertical axis of the detector. The downstream and side electromagnetic calorimeters consist of alternating layers of scintillator and 2 mm-thick lead planes. The downstream hadronic calorimeter consists of alternating scintillator and 2.54 cm-thick steel planes. Multi-anode photomultiplier tubes read out the scintillator strips via wavelength-shifting fibers. The timing resolution of the readout electronics is 3.0 ns and sufficient to separate multiple interactions within a single NuMI beam spill.
Muons that originate in MINERvA from IMD travel entirely through MINERvA into the MINOS near detector [14] located 2 m downstream of the MINERvA detector. In MINOS, their momentum and electric charge are measured by a magnetized spectrometer composed of scintillator and iron.
This analysis uses data that correspond to protons on target (POT) in the FHC configuration and POT in the RHC configuration taken between September 2013 and February 2019. The beam focusing configuration and target are that of the “medium energy” beam provided for the NOvA experiment.
A GEANT4-based simulation of the NuMI beamline is used to predict the neutrino flux. To improve the prediction, the simulation is reweighted as a function of pion kinematics to correct for differences between the GEANT4 [15] prediction and hadron production measurements of 158 GeV protons on carbon from the NA49 experiment [16] and other relevant hadron production measurements. A description of this procedure is found in Ref. [12]. The in situ measurement of neutrino scattering off atomic electrons described in Ref. [7], is not used in this analysis to constrain the flux prediction. This measurement and the neutrino-electron elastic scattering measurements give independent constraints which may be combined.
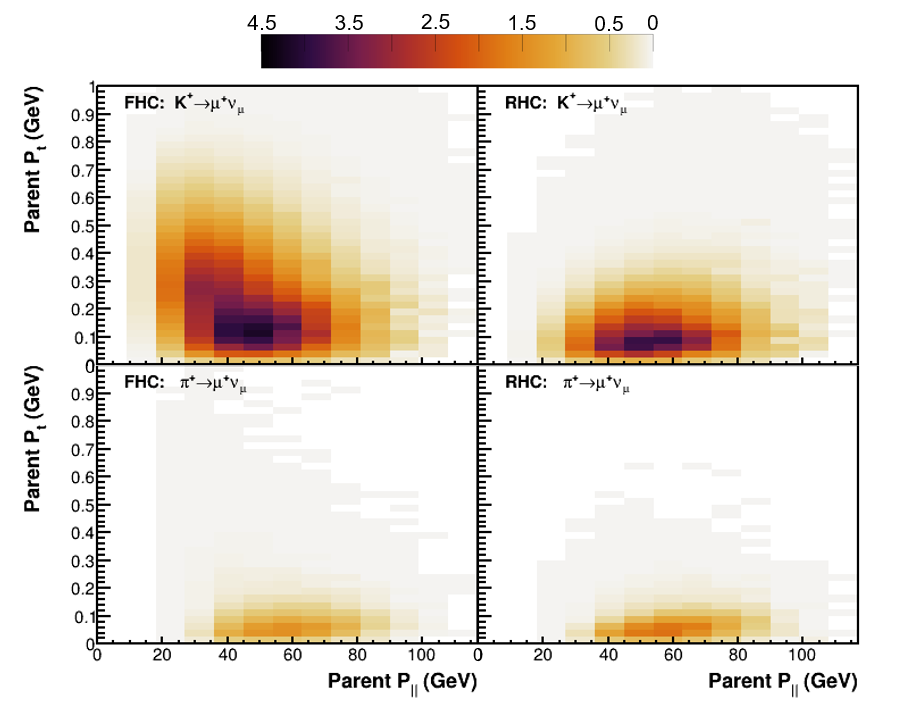
The kinematics of the parent mesons for IMD neutrinos in both FHC and RHC, as predicted by the simulation, are shown in Fig. 2. This simulation predicts two dominant populations of mesons that produce neutrinos with sufficient energy to contribute to the inverse muon decay signal. The fraction of neutrinos from decay is 9 (17)% percent in the FHC (RHC) beam. The first population consists of at moderate longitudinal momentum, GeV, and with a range of magnitudes of momenta transverse to the proton beam direction, . The second population consists of and at higher , GeV and GeV. The second population is dominated by mesons which are underfocused or entirely unfocused by the horns and are common to the FHC and RHC predictions, whereas the first is a unique contribution in the FHC beam since these high- are defocused in the RHC beam.
Neutrino interactions are simulated using the GENIE neutrino event generator [17] version 2.12.6. Quasi-elastic (1p1h) interactions are simulated using the Llewellyn-Smith formalism [18] with the vector form factors modeled using the BBBA05 model [19]. The axial vector form factor uses the dipole form with an axial mass of GeV/c2. Resonance production is simulated using the Rein-Sehgal model [20] with an axial mass of GeV/c2. Higher invariant mass interactions, including Deep Inelastic Scattering (DIS), are simulated using a leading-order pQCD model with the Bodek-Yang prescription [21] for the modification at low square of the momentum transfer, .
A relativistic Fermi gas model [22] with an additional Bodek-Ritchie high momentum tail [23] is used to describe the nuclear environment. The maximum momentum for Fermi motion is assumed to be GeV/c. GENIE models intranuclear rescattering, or final state interactions (FSI), of the produced hadrons using the INTRANUKE-hA package [24].
To better describe MINERvA data, a variety of modifications to the interaction model are made. To better simulate quasielastic events, the cross section is modified as a function of energy and three momentum transfer based on the random phase approximation (RPA) part of the Valencia model [25, 26] appropriate for a Fermi gas [27, 28]. Multi-nucleon scattering (2p2h) is simulated by the same Valencia model [29, 30, 31], but the cross section is increased in specific regions of energy and three momentum transfer based on fits to MINERvA data [32] in a lower energy beam configuration. Integrated over all phase space, the rate of 2p2h is increased by 50% over the nominal prediction. Based on fits done in Ref. [33], we decrease the non-resonant pion production by 43% and reduce the uncertainty compared to the base GENIE model uncertainties. This modified version of the simulation is referred to later in this paper as MINERvA Tune v1.
The response of the MINERvA detector is simulated using GEANT4 [15] version 4.9.3p6 with the QGSP_BERT physics list. The optical and electronics performance is also simulated. Through-going muons are used to set the absolute energy scale of minimum ionizing energy depositions by requiring the average and RMS of energy deposits match between data and simulation as a function of time. A full description is found in Ref. [13]. Measurements using a charged particle test beam [34] and a scaled-down version of the MINERvA detector set the absolute energy response to charged hadrons. The effects of accidental activity are simulated by overlaying hits in both MINERvA and MINOS from data corresponding to random beam spills appropriate to the time periods in the simulation.
III Selection of Inverse Muon Decay Events
A charged-current event is selected by matching a reconstructed muon track in MINERvA with a momentum and charged analyzed muon track in MINOS. The approximately 252(132) event IMD sample, prior to and selections, in FHC(RHC) is a small subsample, approximately of the inclusive charged-current sample with a reconstructed neutrino interaction point in the tracking fiducial volume. For the high-energy muons in the IMD sample, the selection of using the direction of the bend in the magnetic MINOS spectrometer is 99% efficient, and in the RHC sample where most muons are , the purity for selection is over 97%.
Since IMD only produces an energetic forward muon in the final state, the visible energy in the tracker and calorimeters is expected to come only from the muon. By contrast, events from background reactions on nuclei almost always produce some visible recoil, including a recoiling target nucleon. The IMD selection requires visible hadronic energy in tracker and electromagnetic calorimeters be less than MeV and visible energy within mm of the neutrino interaction point be less than MeV. This effectively removes most events with low-energy protons or pions in the final state while retaining all but 4% of the IMD events.
In addition, the reconstructed muon must be a with total energy greater than GeV, a threshold below the kinematic threshold of the IMD process due to the fractional energy resolution in MINOS. Negatively charged muon candidates are also required to have reconstructed energy below GeV, a point beyond which the charge of the muon cannot be reliably measured. From Eq. 2, the kinematics of neutrino scattering from atomic electrons requires that , where is the scattering angle with respect to the initial neutrino direction. In a given event, we measure and , but we do not know a priori, nor do we measure with sufficient precision to extract from the relationship above. However, we have a minimum for IMD events, and we have a maximum relevant set by our flux which falls steeply with energy as shown in Fig. 1. These facts together imply that will typically be a number significantly less than , thus allowing us to place a tighter selection on than the maximum of which is reached in the limit of . We define GeV, and form
| (3) |
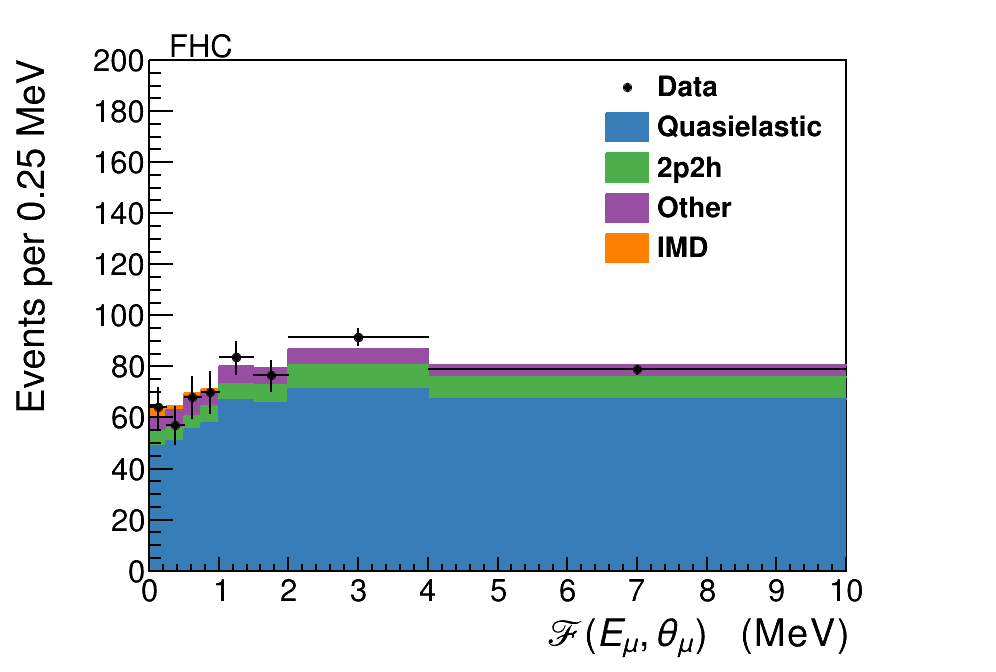
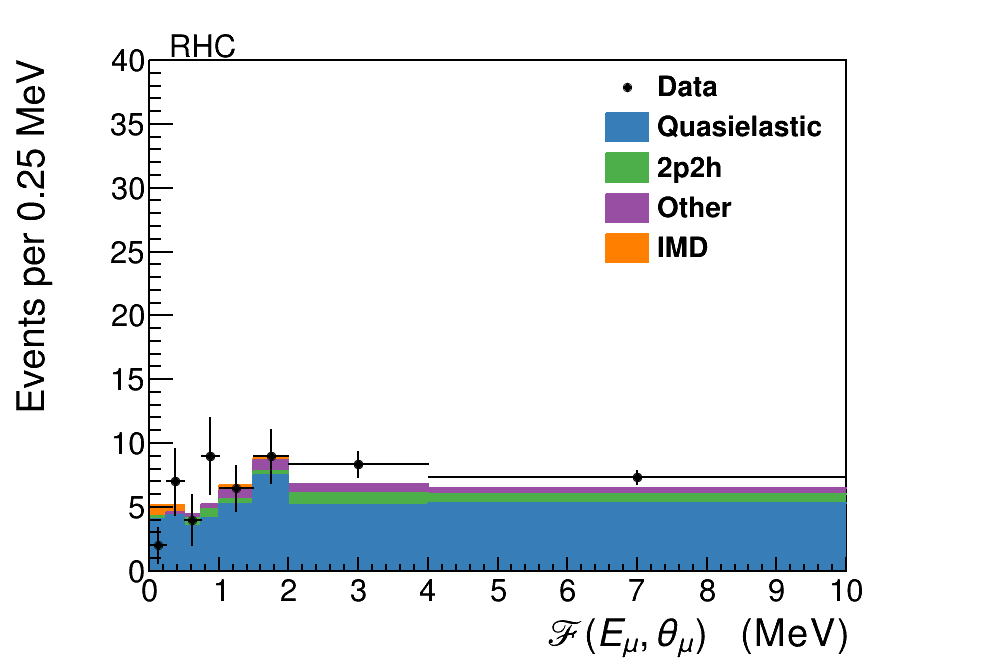
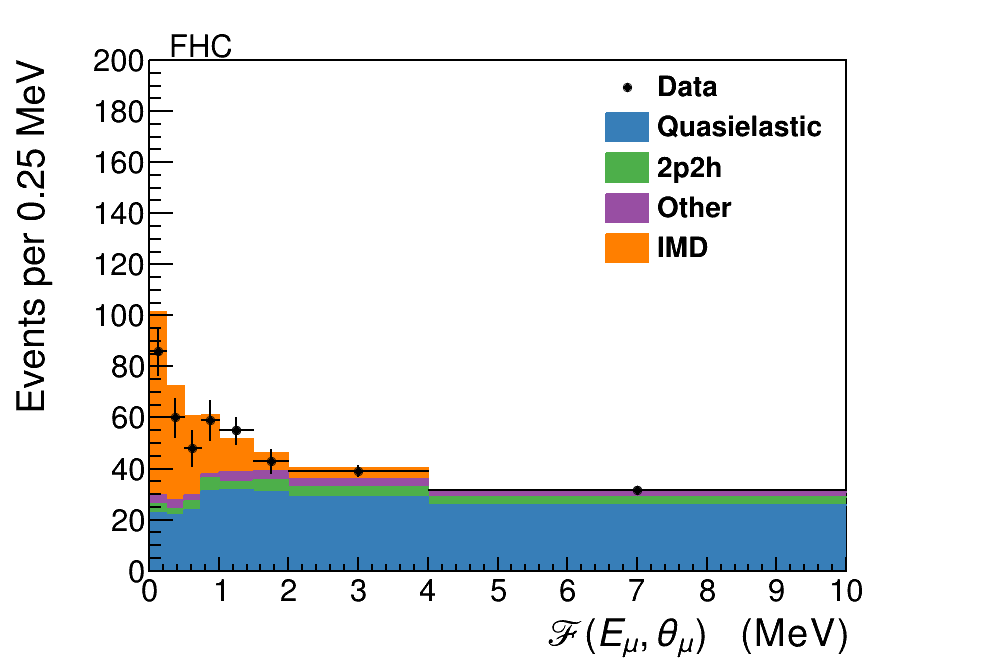
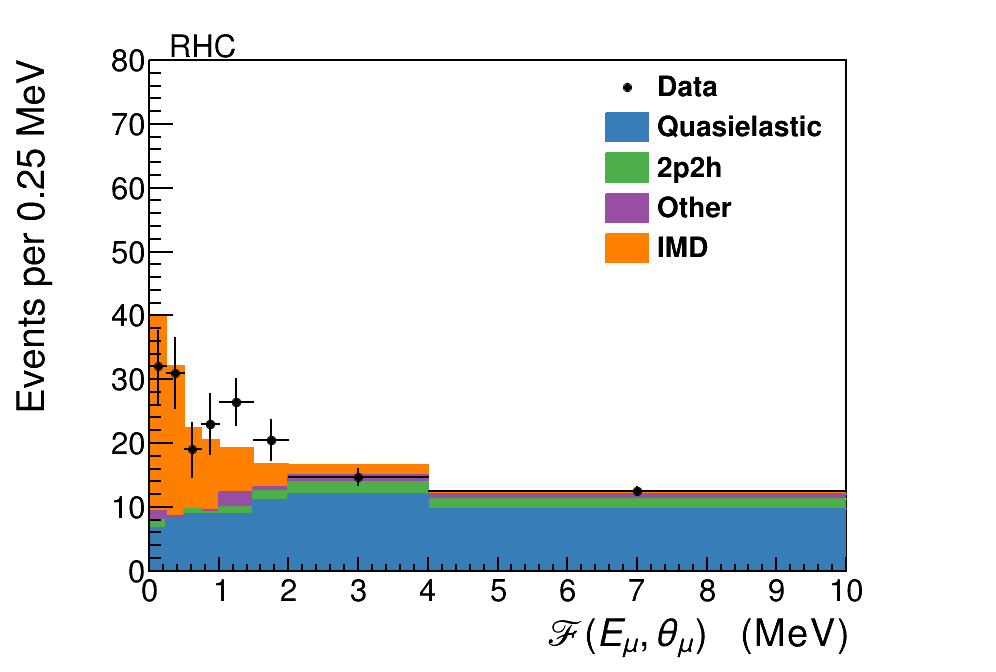
where the small angle expansion has been used to set . The event selection then requires . This cut will be increasingly inefficient for neutrino energies above , but the choice of GeV is predicted to include of the IMD events in the FHC beam and in the RHC beam before accounting for experimental resolutions. The distribution in after all selections and background tuning is shown in Fig. 5.
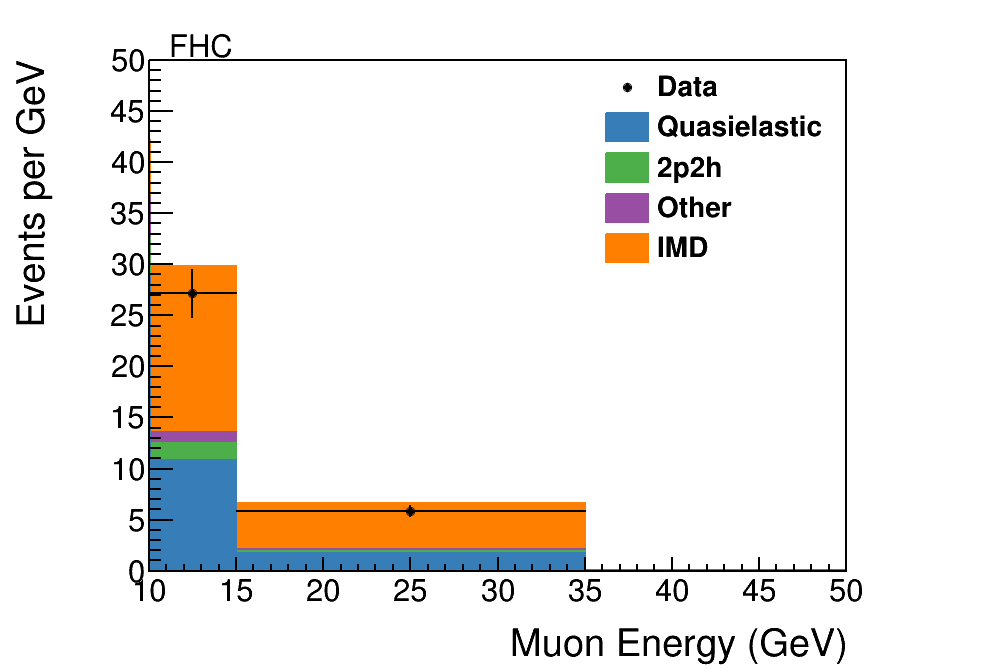
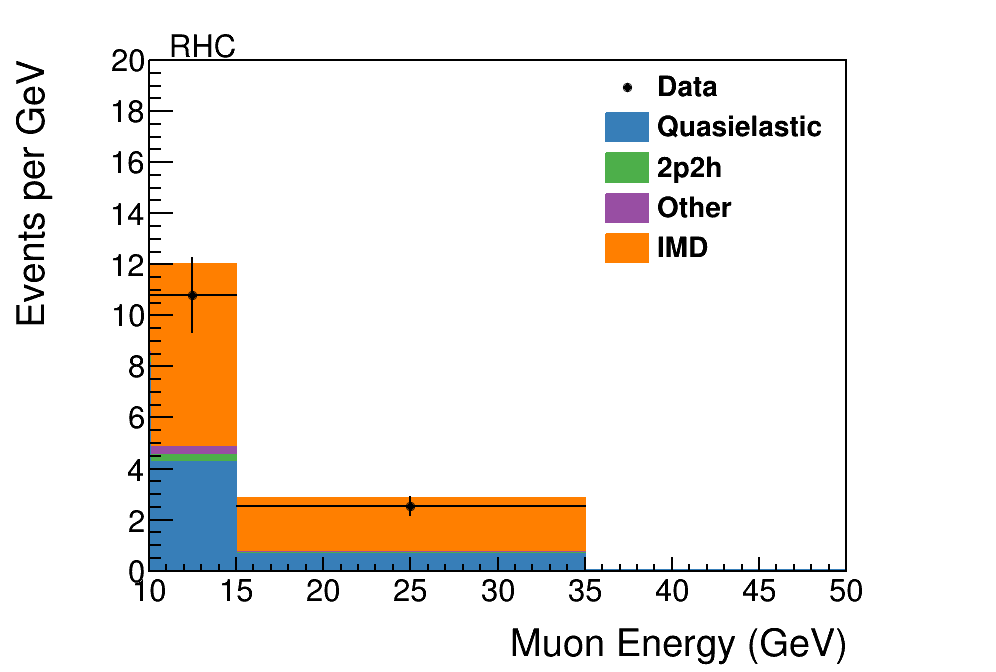
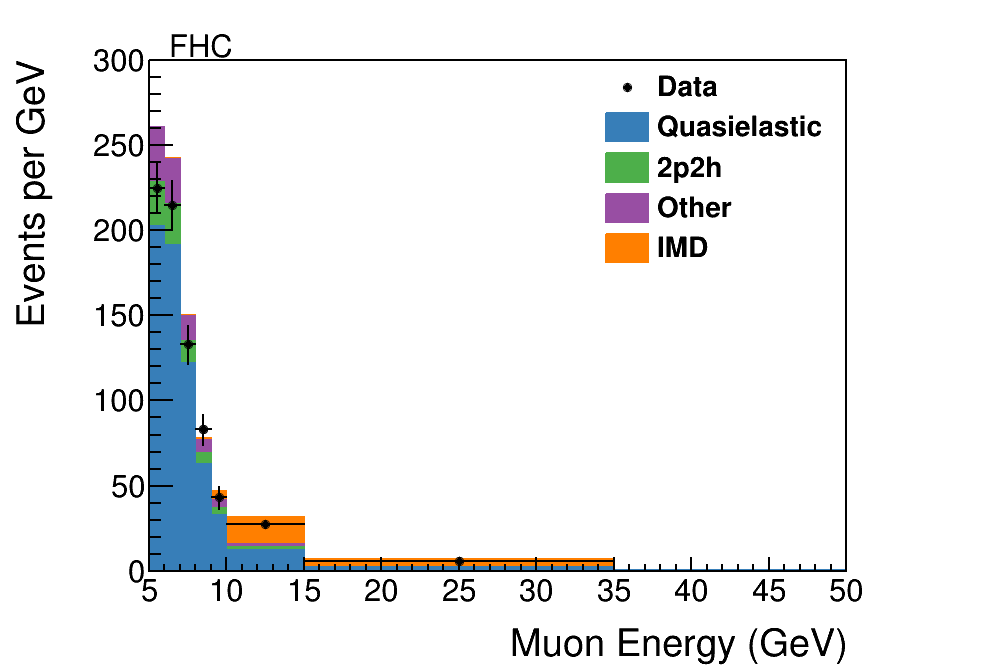
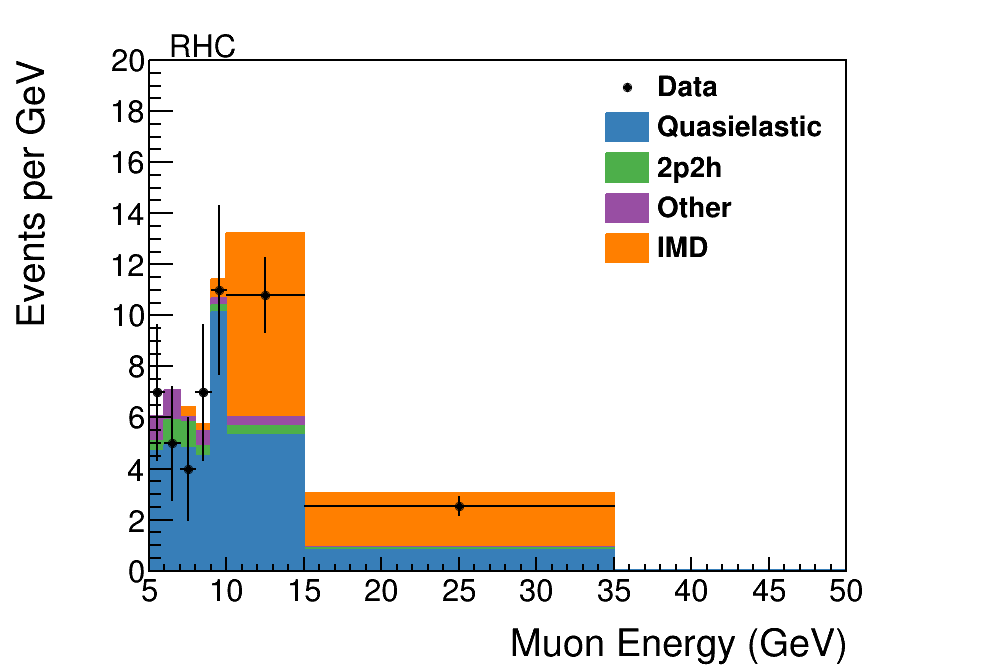
Figure 3 shows the expected and observed signal sample as a function of reconstructed muon energy in the FHC and RHC beams after these selections. The expected signal and background are nearly comparable, and the backgrounds are almost entirely due to charged-current quasielastic scattering, , with a small fraction of events from the multi-nucleon version of this scattering, the 2p2h process described above.
III.1 Background Constraints
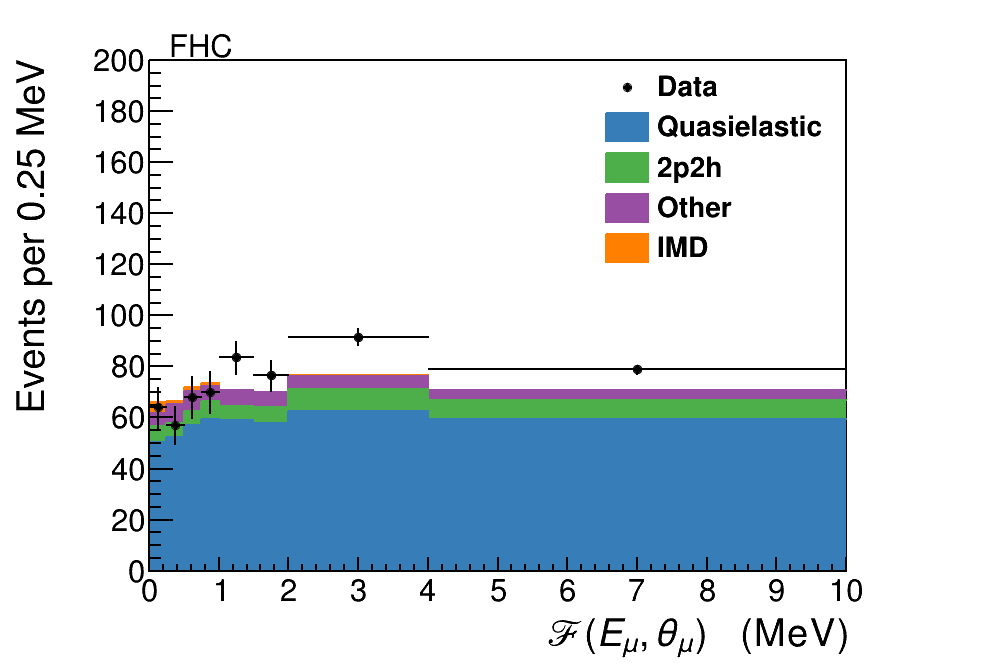
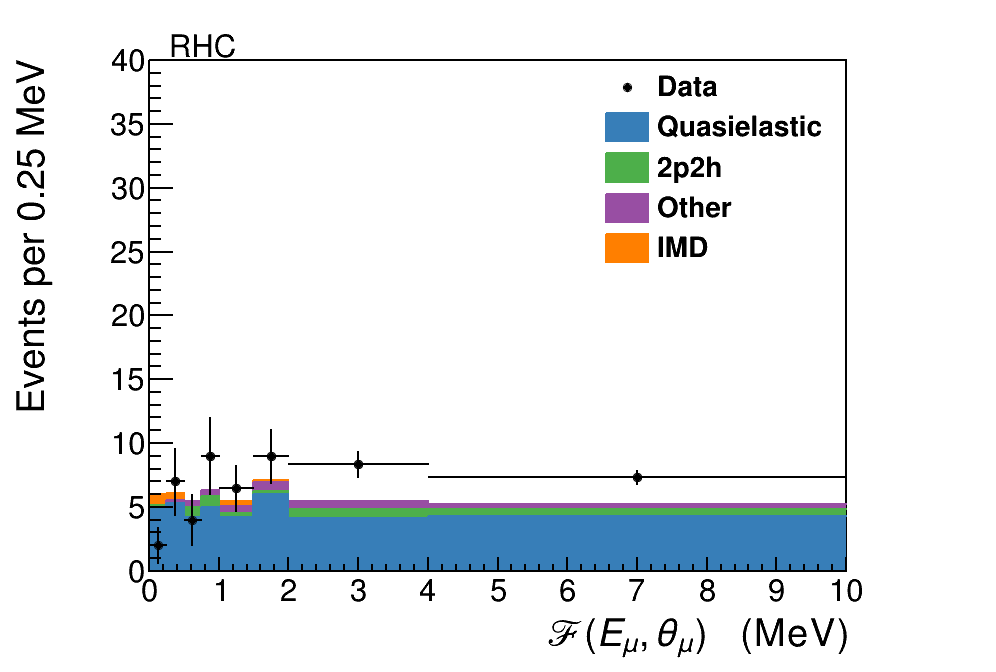
To constrain the remaining background a sideband sample is measured using events which pass the recoil and vertex energy criteria, but have muon energy between and GeV. The sample composition is almost exactly the same as the backgrounds in the signal selection, but this sample has almost no signal component. Figure 4 shows the sideband sample as a function of . As can be seen particularly with the FHC sample, there are two differences between the sideband simulation and data, both likely due to poorly modeled nuclear effects. The first is the overall rate, which will be strongly affected by the probability that outgoing nucleons reinteract to produce neutrons in the final state, which in turn go undetected and allow the events to pass the recoil cuts. The second is that the events at low are suppressed, possibly due to Pauli blocking or nuclear screening. This sideband sample is used to divide the background into events with below and above , where the former is the one that directly enters into the background subtraction for the signal sample. However, the absolute data and simulation differences between the sideband and the signal with GeV are also affected by uncertainties in the flux itself. The flux uncertainties are rapidly changing in the sample since the focusing peak is at GeV. Therefore a second sample of events with GeV but with MeV is added to provide an absolute normalization to the background prediction. The resulting scale factors and their uncertainties are shown in Table 1, and the corrected simulated distributions compared to the sideband data are shown in Fig 4. The net effect is to increase the backgrounds compared to the prediction by approximately in the high region, but to suppress the background in the signal region of .
| GeV and | GeV and | ||
|---|---|---|---|
| Beam | MeV. | ||
| FHC | |||
| RHC | |||
After the sideband fit, the scale factors are applied to the selected signal sample. The resulting distribution is shown as a function of and muon energy in Figs. 5 and 6, respectively.
III.2 Systematic Uncertainties
Systematic uncertainties in this analysis fall under three different categories: flux, detector response, and neutrino interaction model uncertainties. The uncertainties from individual sources are evaluated by re-extracting background subtracted samples using modified simulations. The size of each modification is related to the uncertainty in each source. Neutrino interaction model uncertainty in the result is solely due to the background interactions since the signal interaction model is well known.
The flux uncertainty is a typical leading uncertainty in neutrino cross section measurements, but since in this analysis the output is just a count of the number of events, the flux uncertainty enters only through the background constraint which is extrapolated from lower muon and presumably neutrino energy, to higher energy. The resulting small uncertainties from the input flux on the background subtraction are compared with the a priori flux when this result is applied as a flux constraint. A related uncertainty which must be factored into the predicted number of events is the normalization uncertainty of 1.4% from uncertainty in the number of electrons in the target, based on material assays and weight measurements of scintillator planes.
The uncertainty in the detector response to hadrons is evaluated using shifts determined by in situ measurements of a smaller version of the detector in a test beam [34]. Uncertainties in inelastic interaction cross sections for particles in the detector material are independently varied based on data-Monte Carlo differences between GEANT particle cross sections and world data on neutrons [35, 36, 37, 38], pions [39, 40, 41, 42], and protons [43, 44, 45]. The muon reconstruction uncertainty is dominated by uncertainty in the energy scale, which is constrained by a combination of data and simulation described in Ref. [46] to . The uncertainty in the matching efficiency is from imperfect modeling of the efficiency loss from accidental activity in the MINOS near detector when matching muon tracks from MINERvA to MINOS. This last efficiency is also determined by a data-simulation comparison as a function of instantaneous neutrino beam intensity.
The interaction model uncertainties are evaluated using the standard GENIE reweighting infrastructure with additional uncertainties from MINERvA Tune v1. The sideband constraint reduces those uncertainties by more than a factor of two.
The final samples have 127(56) selected events in data for the FHC(RHC) configurations. Due to the limited size of the sample, each is only reported as total number of events. The statistical and systematic uncertainties in the background subtracted samples are shown in Tab. 2. In the both beams, the prediction is larger than the observed number of events as shown in Fig. 7. Both results are dominated by statistical uncertainty with subleading contributions from the uncertainties in the interaction cross section model and the muon reconstruction. The initiated reaction described above is predicted by the cross-section in Ref. [47] to be () of the signal rates above, and for convenience was treated as a background in this analysis.
| FHC | RHC | |
|---|---|---|
| Total Uncertainty | 20.4 | 11.4 |
| Individual Uncertainties | ||
| Statistical | 16.7 | 11.0 |
| Background Interaction Model | 6.9 | 0.9 |
| Final State Interaction Model | 6.9 | 1.0 |
| Flux | 5.2 | 1.8 |
| Muon Reconstruction | 3.8 | 1.0 |
| Others | 1.9 | 1.6 |
| IMD Events in Sample | 127. | 56. |
IV Flux constraints from IMD
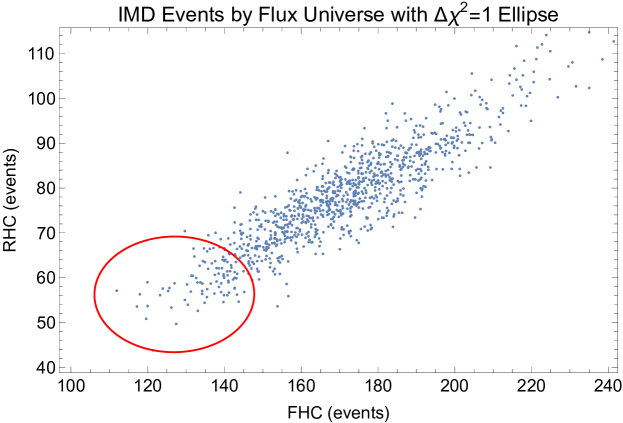
The prediction of the MINERvA flux [12, 6, 7] described in Section II gives a nominal flux prediction, the “central value”, and a series of flux “universes” that describe the uncertainties and covariances in those uncertainties by the Monte Carlo method. The consistency of each flux universe, denoted by with a universe index, , with the number of IMD events, , is measured by the probability of the measurement given this flux, . Since this measurement consists of two weakly correlated measurements in the two beams, the consistency of these measurements with a given flux universe is given by
| (4) |
where is a vector of the difference between the number of measured and predicted events in the FHC and RHC beams, and is the covariance matrix of these measurements. Figure 7 shows the predicted number of IMD events in the FHC and RHC beams with the measurement superimposed. It is evident from this that some flux universes are significantly less consistent with the measurement than others. The a priori prediction of the flux can then be modified, according to Bayes’ Theorem, by weighting the flux universes by the probability given in Eq. 4 when forming the central value prediction or the variance of the ensemble of universes. The evident correlation between the FHC and RHC predictions is in part due to the common source of high-energy in the two beams of unfocused low parent mesons, as discussed in Sec. II.
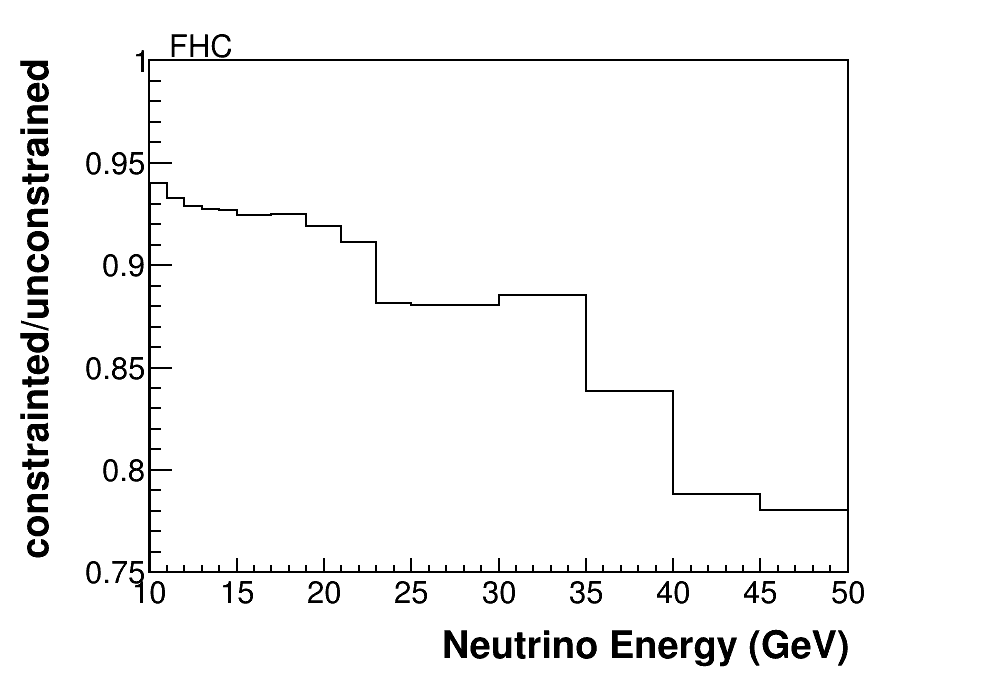
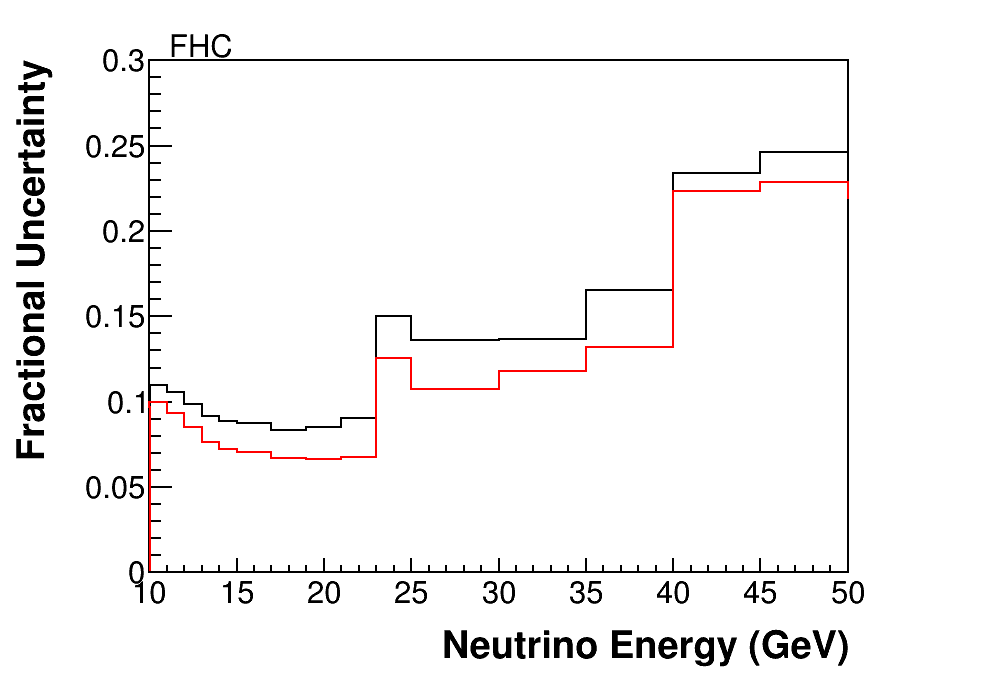
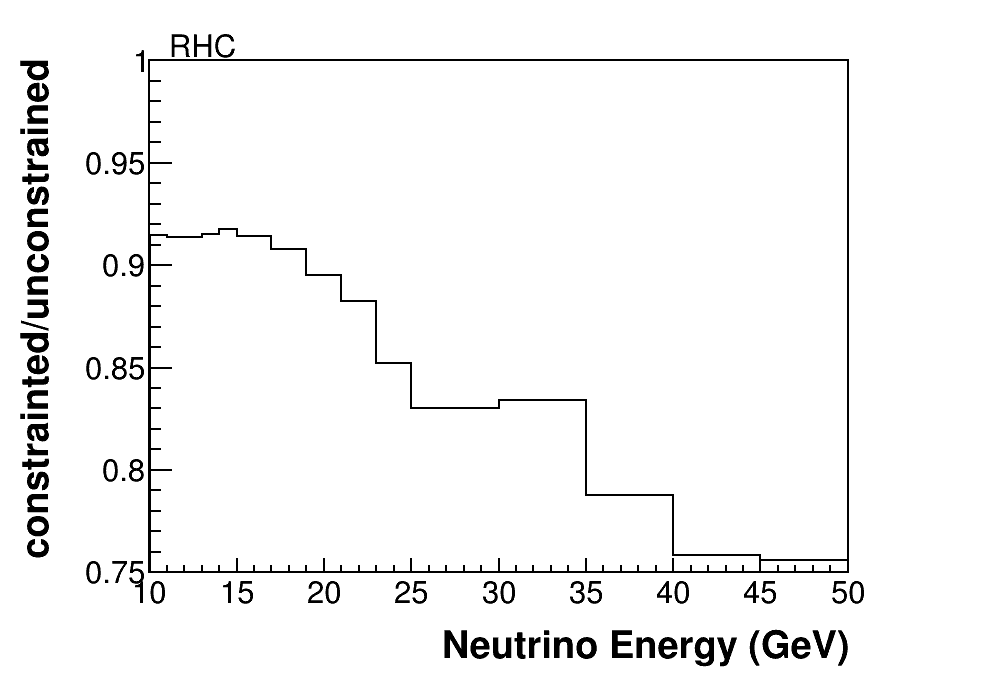
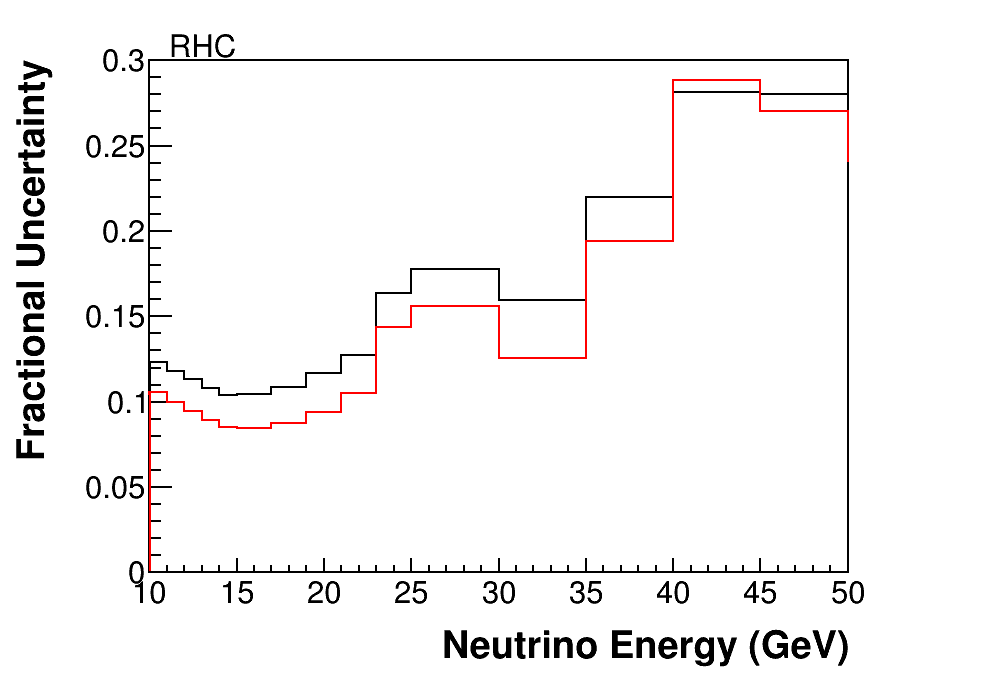
The predicted RHC and FHC fluxes and their uncertainties, before and after the IMD constraints are applied, are shown in Fig. 8. As expected, the IMD sample provides a significant constraint for the highest energy neutrinos in the NuMI beams. The flux is modified and constrained at neutrino energies below the threshold of GeV because high-energy mesons that decay to make these neutrinos may also decay at larger angles with respect to the beam axis to produce lower energy neutrinos. Therefore, even though we only measure the IMD rate above threshold, we are constraining flux universes that encode the physics that leads to that high-energy part of the neutrino spectrum. The integral flux above GeV in the FHC beam is predicted to be /POT/m2 before the constraint and is evaluated as /POT/m2 after.
V Conclusions
The MINERvA experiment has successfully isolated a sample of inverse muon decay events, , and has used those events to constrain the flux of high-energy neutrinos in its beam. The constraint provides an in situ way to reduce uncertainties from its high-energy flux. Such a method can be applied to any accelerator neutrino beam produced by protons of energies much greater than the GeV threshold for inverse muon decay, and in particular can be used for a similar purpose in the planned DUNE experiment.
Acknowledgements.
This document was prepared by members of the MINERvA Collaboration using the resources of the Fermi National Accelerator Laboratory (Fermilab), a U.S. Department of Energy, Office of Science, HEP User Facility. Fermilab is managed by Fermi Research Alliance, LLC (FRA), acting under Contract No. DE-AC02-07CH11359. These resources included support for the MINERvA construction project, and support for construction also was granted by the United States National Science Foundation under Award No. PHY-0619727 and by the University of Rochester. Support for participating scientists was provided by NSF and DOE (USA); by CAPES and CNPq (Brazil); by CoNaCyT (Mexico); by Proyecto Basal FB 0821, CONICYT PIA ACT1413, and Fondecyt 3170845 and 11130133 (Chile); by CONCYTEC (Consejo Nacional de Ciencia, Tecnología e Innovación Tecnológica), DGI-PUCP (Dirección de Gestión de la Investigación - Pontificia Universidad Católica del Peru), and VRI-UNI (Vice-Rectorate for Research of National University of Engineering) (Peru); NCN Opus Grant No. 2016/21/B/ST2/01092 (Poland); by Science and Technology Facilities Council (UK); by EU Horizon 2020 Marie Skłodowska-Curie Action. D. Ruterbories gratefully acknowledges support from a Cottrell Postdoctoral Fellowship, Research Corporation for Scientific Advancement award number 27467 and National Science Foundation Award CHE2039044. We thank the MINOS Collaboration for use of its near detector data. Finally, we thank the staff of Fermilab for support of the beam line, the detector, and computing infrastructure.References
- Abe et al. [2015] K. Abe et al. (T2K Collaboration), Measurements of neutrino oscillation in appearance and disappearance channels by the T2K experiment with 6.6×10²⁰ protons on target, Phys. Rev. D 91, 072010 (2015), arXiv:1502.01550 [hep-ex] .
- Adamson et al. [2016a] P. Adamson et al. (NOvA), First measurement of electron neutrino appearance in NOvA, Phys. Rev. Lett. 116, 151806 (2016a), arXiv:1601.05022 [hep-ex] .
- Acciarri et al. [2015] R. Acciarri et al. (DUNE), Long-Baseline Neutrino Facility (LBNF) and Deep Underground Neutrino Experiment (DUNE): Conceptual Design Report, Volume 2: The Physics Program for DUNE at LBNF, Tech. Rep. (2015) arXiv:1512.06148 [physics.ins-det] .
- Abe et al. [2011] K. Abe, T. Abe, H. Aihara, Y. Fukuda, Y. Hayato, et al., Letter of Intent: The Hyper-Kamiokande Experiment — Detector Design and Physics Potential —, Tech. Rep. (2011) arXiv:1109.3262 [hep-ex] .
- Tomalak and Hill [2020] O. Tomalakand R. J. Hill, Theory of elastic neutrino-electron scattering, Phys. Rev. D 101, 033006 (2020), arXiv:1907.03379 [hep-ph] .
- Park et al. [2016] J. Park et al. (MINERvA), Measurement of Neutrino Flux from Neutrino-Electron Elastic Scattering, Phys. Rev. D93, 112007 (2016), arXiv:1512.07699 [physics.ins-det] .
- Valencia et al. [2019] E. Valencia et al. (MINERvA), Constraint of the MINERA medium energy neutrino flux using neutrino-electron elastic scattering, Phys. Rev. D100, 092001 (2019), arXiv:1906.00111 [hep-ex] .
- Marshall et al. [2020] C. M. Marshall, K. S. McFarland, and C. Wilkinson, Neutrino-electron elastic scattering for flux determination at the DUNE oscillation experiment, Phys. Rev. D 101, 032002 (2020), arXiv:1910.10996 [hep-ex] .
- Bardin and Dokuchaeva [1987] D. Y. Bardinand V. A. Dokuchaeva, Muon Energy Spectrum in Inverse Decay, Nucl. Phys. B 287, 839 (1987).
- Anderson et al. [1998] K. Anderson, B. Bernstein, D. Boehnlein, K. R. Bourkland, S. Childress, et al., The NuMI Facility Technical Design Report, FERMILAB-DESIGN-1998-01 (1998).
- Adamson et al. [2016b] P. Adamson et al., The NuMI Neutrino Beam, Nucl. Instrum. Meth. A 806, 279 (2016b), arXiv:1507.06690 [physics.acc-ph] .
- Aliaga et al. [2016] L. Aliaga et al. (MINERvA), Neutrino Flux Predictions for the NuMI Beam, Phys. Rev. D 94, 092005 (2016), [Addendum: Phys.Rev.D 95, 039903 (2017)], arXiv:1607.00704 [hep-ex] .
- Aliaga et al. [2014] L. Aliaga et al. (MINERvA Collaboration), Design, Calibration, and Performance of the MINERvA Detector, Nucl. Instrum. Meth. A 743, 130 (2014), arXiv:1305.5199 [physics.ins-det] .
- Michael et al. [2008] D. G. Michael et al. (MINOS Collaboration), The Magnetized steel and scintillator calorimeters of the MINOS experiment, Nucl. Instrum. Meth. A 596, 190 (2008), arXiv:0805.3170 [physics.ins-det] .
- Agostinelli et al. [2003] S. Agostinelli et al. (GEANT4), GEANT4: A Simulation toolkit, Nucl. Instrum. Meth. A506, 250 (2003).
- Alt et al. [2007] C. Alt et al. (NA49 Collaboration), Inclusive production of charged pions in p+C collisions at 158-GeV/c beam momentum, Eur. Phys. J. C 49, 897 (2007), arXiv:hep-ex/0606028 [hep-ex] .
- Andreopoulos et al. [2010] C. Andreopoulos et al., The GENIE Neutrino Monte Carlo Generator, Nucl. Instrum. Meth. A614, 87 (2010), arXiv:0905.2517 [hep-ph] .
- Llewellyn Smith [1972] C. H. Llewellyn Smith, Neutrino Reactions at Accelerator Energies, Phys. Rept. 3, 261 (1972).
- Bradford et al. [2006] R. Bradford, A. Bodek, H. S. Budd, and J. Arrington, A New parameterization of the nucleon elastic form-factors, Nucl. Phys. Proc. Suppl. 159, 127 (2006), arXiv:hep-ex/0602017 [hep-ex] .
- Rein and Sehgal [1981] D. Reinand L. M. Sehgal, Neutrino Excitation of Baryon Resonances and Single Pion Production, Annals Phys. 133, 79 (1981).
- Bodek et al. [2005] A. Bodek, I. Park, and U.-K. Yang, Improved low Q**2 model for neutrino and electron nucleon cross sections in few GeV region, Nucl. Phys. Proc. Suppl. 139, 113 (2005), arXiv:hep-ph/0411202 [hep-ph] .
- Smith [1972] E. J. Smith, R. A. and Moniz, NEUTRINO REACTIONS ON NUCLEAR TARGETS, Nucl. Phys. B 43, 605 (1972).
- Bodek and Ritchie [1981] A. Bodekand J. L. Ritchie, Further Studies of Fermi Motion Effects in Lepton Scattering from Nuclear Targets, Phys. Rev. D 24, 1400 (1981).
- Dytman [2007] S. Dytman, Neutrino event generators, AIP Conf. Proc. 896, 178 (2007), [,178(2007)].
- Nieves et al. [2004] J. Nieves, J. E. Amaro, and M. Valverde, Inclusive quasi-elastic neutrino reactions, Phys. Rev. C 70, 055503 (2004), arXiv:nucl-th/0408005 [nucl-th] .
- Gran [2017] R. Gran, Model uncertainties for Valencia RPA effect for MINERvA, Tech. Rep. (2017) arXiv:1705.02932 [hep-ex] .
- Martini et al. [2016] M. Martini, N. Jachowicz, M. Ericson, V. Pandey, T. Van Cuyck, and N. Van Dessel, Electron-neutrino scattering off nuclei from two different theoretical perspectives, Phys. Rev. C94, 015501 (2016), arXiv:1602.00230 [nucl-th] .
- Nieves and Sobczyk [2017] J. Nievesand J. E. Sobczyk, In medium dispersion relation effects in nuclear inclusive reactions at intermediate and low energies, Annals Phys. 383, 455 (2017), arXiv:1701.03628 [nucl-th] .
- Nieves et al. [2011] J. Nieves, I. Ruiz Simo, and M. J. Vicente Vacas, Inclusive Charged–Current Neutrino–Nucleus Reactions, Phys. Rev. C 83, 045501 (2011), arXiv:1102.2777 [hep-ph] .
- Gran et al. [2013] R. Gran, J. Nieves, F. Sanchez, and M. J. Vicente Vacas, Neutrino-nucleus quasi-elastic and 2p2h interactions up to 10 GeV, Phys. Rev. D 88, 113007 (2013), arXiv:1307.8105 [hep-ph] .
- Schwehr et al. [2016] J. Schwehr, D. Cherdack, and R. Gran, GENIE implementation of IFIC Valencia model for QE-like 2p2h neutrino-nucleus cross section, Tech. Rep. (2016) arXiv:1601.02038 [hep-ph] .
- Rodrigues et al. [2016a] P. A. Rodrigues et al. (MINERvA), Identification of nuclear effects in neutrino-carbon interactions at low three-momentum transfer, Phys. Rev. Lett. 116, 071802 (2016a), arXiv:1511.05944 [hep-ex] .
- Rodrigues et al. [2016b] P. Rodrigues, C. Wilkinson, and K. McFarland, Constraining the GENIE model of neutrino-induced single pion production using reanalyzed bubble chamber data, Eur. Phys. J. C76, 474 (2016b), arXiv:1601.01888 [hep-ex] .
- Aliaga et al. [2015] L. Aliaga et al. (MINERvA Collaboration), MINERvA neutrino detector response measured with test beam data, Nucl. Instrum. Meth. A 789, 28 (2015), arXiv:1501.06431 [physics.ins-det] .
- Abfalterer et al. [2001] W. P. Abfalterer, F. B. Bateman, F. S. Dietrich, R. W. Finlay, R. C. Haight, and G. L. Morgan, Measurement of neutron total cross-sections up to 560-MeV, Phys. Rev. C 63, 044608 (2001).
- Schimmerling et al. [1973] W. Schimmerling, T. J. Devlin, W. W. Johnson, K. G. Vosburgh, and R. E. Mischke, Neutron-nucleus total and inelastic cross-sections - 900 to 2600 mev/c, Phys. Rev. C 7, 248 (1973).
- Voss and Wilson [1956] R. G. P. Vossand R. Wilson, Proc.Roy.Soc. A236, 41 (1956).
- Zanelli et al. [1981] C. I. Zanelli, P. P. Urone, J. L. Romero, F. P. Brady, M. L. Johnson, G. A. Needham, J. L. Ullmann, and D. L. Johnson, Total non-elastic cross sections of neutrons on C, O, Ca, and Fe at 40.3 and 50.4 MeV, Phys. Rev. C 23, 1015 (1981).
- Ashery et al. [1981] D. Ashery, I. Navon, G. Azuelos, H. K. Walter, H. J. Pfeiffer, and F. W. Schlepütz, True Absorption and Scattering of Pions on Nuclei, Phys. Rev. C 23, 2173 (1981).
- Allardyce et al. [1973] B. Allardyce, C. Batty, D. Baugh, E. Friedman, G. Heymann, et al., Pion reaction cross-sections and nuclear sizes, Nucl. Phys. A 209, 1 (1973).
- Wilkin et al. [1973] C. Wilkin, C. Cox, J. Domingo, K. Gabathuler, E. Pedroni, J. Rohlin, P. Schwaller, and N. Tanner, A comparison of pi+ and pi- total cross-sections of light nuclei near the 3-3 resonance, Nucl. Phys. B 62, 61 (1973).
- Clough et al. [1974] A. Clough et al., Pion-Nucleus Total Cross-Sections from 88-MeV to 860-MeV, Nucl. Phys. B 76, 15 (1974).
- Menet et al. [1971] J. Menet, E. Gross, J. Malanify, and A. Zucker, Total-Reaction-Cross-Section Measurements for 30-60-MeV Protons and the Imaginary Optical Potential, Phys. Rev. C 4, 1114 (1971).
- Dicello and Igo [1970] J. Dicelloand G. Igo, Proton Total Reaction Cross Sections in the 10-20-MeV Range: Calcium-40 and Carbon-12, Phys. Rev. C 2, 488 (1970).
- McGill et al. [1974] W. McGill, R. Carlson, T. Short, J. Cameron, J. Richardson, I. Slaus, W. T. Van Oers, J. Verba, D. Margaziotis, and P. Doherty, Measurements of the proton total reaction cross section for light nuclei between 20 and 48 MeV, Phys. Rev. C 10, 2237 (1974).
- Carneiro et al. [2020] M. Carneiro et al. (MINERvA), High-Statistics Measurement of Neutrino Quasielasticlike Scattering at 6 GeV on a Hydrocarbon Target, Phys. Rev. Lett. 124, 121801 (2020), arXiv:1912.09890 [hep-ex] .
- Marciano and Parsa [2003] W. J. Marcianoand Z. Parsa, Neutrino electron scattering theory, J. Phys. G 29, 2629 (2003), arXiv:hep-ph/0403168 .