Fermi LAT observations of Sagittarius A*: Imaging Analysis
Abstract
Sagittarius A* (Sgr A∗)—the supermassive black hole (SMBH) in the center of our galaxy—has been observed in most of the electromagnetic spectrum, from radio to X-rays. Diffuse -ray emission has been observed around Sgr A∗ and a -ray point source has been detected coinciding with the SMBH’s position, although there is no definitive association between the two. In this work, we have used 11 years of Fermi Large Area Telescope (LAT) observations of the point source 4FGL J1745.62859 and performed a detailed imaging analysis across four energy bands. Our goal is to elucidate the nature of the -ray emission at the Galactic Center (GC) and whether it is associated with the SMBH. We find that the centroid of the emission approaches Sgr A∗’s location as the energy increases. Assuming that the -ray point source is located at the GC, we estimate a luminosity of in the 100 MeV to 500 GeV energy range. This is consistent with Sgr A∗’s bolometric luminosity. Based on the point source properties, we ruled out several potential candidates for its nature and favor a cosmic ray origin either from protons, electrons or both, accelerated by—or in the vicinity of—the SMBH. Our results indicate that the point source at the GC is indeed the -ray counterpart of Sgr A∗ in the GeV range.
1 Introduction
The center of our galaxy hosts a SMBH with a mass of (Ghez et al., 2008; Genzel et al., 2010; Boehle et al., 2016) located at a distance of 8.2 kpc (Abuter et al., 2019). Like the Milky Way, it is believed that every sufficiently massive galaxy harbors a SMBH in its center (Lynden-Bell, 1969; Kormendy & Richstone, 1995; Miyoshi et al., 1995; Heckman & Best, 2014). The first observations of a source that would later be associated with Sgr A∗—the SMBH in our GC—were made by Balick & Brown (1974) in radio wavelengths. Almost fifty years later, there are several observations that confirm the presence of the SMBH. The most convincing are those obtained by Eisenhauer et al. (2005) and Gillessen et al. (2009) monitoring stellar orbits and the detection of orbital motions of a “hot spot” in the accretion flow near the last stable circular orbit of Sgr A∗ (Gravity Collaboration et al., 2018). Results of the Event Horizon Telescope observational campaign to reveal the image of the shadow of Sgr A∗ on the accretion flow are still anxiously anticipated (e.g. Event Horizon Telescope Collaboration et al. 2019).
The electromagnetic radiation from Sgr A∗ has been seen in several wavelengths (e.g. Genzel et al. 2010; Morris et al. 2012; Eckart et al. 2018). It is highly variable in the infrared (Genzel et al., 2003; Ghez et al., 2004; Hornstein et al., 2007; Dodds-Eden et al., 2009; Witzel et al., 2012; Hora et al., 2014; Witzel et al., 2018; von Fellenberg et al., 2018; Fazio et al., 2018; Boyce et al., 2019) and X-rays (Baganoff et al., 2001; Nowak et al., 2012; Neilsen et al., 2013; Barrière et al., 2014; Neilsen et al., 2015; Ponti et al., 2015; Fazio et al., 2018; Boyce et al., 2019), which suggests a compact source. Variability has also been reported in longer wavelengths (Zhao et al., 2003; Miyazaki et al., 2004; Mauerhan et al., 2005; Macquart et al., 2006; Yusef-Zadeh et al., 2006; Marrone et al., 2008; Yusef-Zadeh et al., 2009; Plambeck et al., 2014; Brinkerink et al., 2015; Stone et al., 2016).
Following the H.E.S.S. TeV detections of the GC (Aharonian et al., 2004), several candidates have been proposed for this -ray flux: Sgr A∗ itself, either from its immediate vicinity (Aharonian & Neronov, 2005a) or from a “plerion” produced by the SMBH winds (Atoyan & Dermer, 2004; Kusunose & Takahara, 2012); the interaction between the dense molecular clouds in the GC with cosmic rays accelerated by Sgr A∗ and/or by some other nearby source (Aharonian & Neronov, 2005b; Ballantyne et al., 2011; Chernyakova et al., 2011; Linden et al., 2012; Fatuzzo & Melia, 2012; Guo et al., 2013); the pulsar wind nebula (PWN) G359.95-0.04 (Wang et al., 2006; Hinton & Aharonian, 2007); the supernova remnant (SNR) Sagittarius A East (Crocker et al., 2005) (but see Aharonian et al. 2009; Acero et al. 2010); self-annihilating dark matter particles accumulating at the GC (Hooper & Goodenough, 2011; Hooper & Linden, 2011) and an as-yet undetected pulsar (or population of pulsars) (Hooper & Linden, 2011). The GC -ray flux does not seem to be variable (Chernyakova et al., 2011; Malyshev et al., 2015; Ahnen et al., 2017).
It is believed that the quiescent state of Sgr A∗, observed from radio to X-rays, is due to a radiatively inefficient accretion flow (RIAF) (e.g. Narayan et al. 1995; Yuan & Narayan 2014). The broadband spectrum is dominated by the radio-to-submm emission which is understood as synchrotron radiation from a thermal population of electrons, with temperatures between 520 MeV, as well as a small fraction (a few percent) of nonthermal electrons (Yuan et al., 2003). In its steady state, Sgr A∗ emits 10 (e.g. Genzel et al. 2010). There is evidence that the X-ray flare emission is due to synchrotron processes (Dodds-Eden et al., 2009; Barrière et al., 2014; Ponti et al., 2017) although they have also been interpreted as Inverse Compton (IC) upscattered photons by the mildly relativistic, nonthermal electrons (Yusef-Zadeh et al., 2009; Ball et al., 2016).
Prominent gamma-ray emission from MeV to TeV energies coincident with Sgr A∗’s position is observed by Fermi-LAT. Since the beginning of Fermi’s operations, a point source has been observed coinciding with the position of Sgr A∗. This source was studied by Chernyakova et al. (2011) with 25 months of Fermi observations. They found no temporal variability at GeV energies and proposed a model in which the -ray emission in the inner 10 pc of the Galaxy arises from relativistic proton interactions. Later, Malyshev et al. (2015) analyzed the same source using 74 months of data and the Second Catalog of Fermi-LAT Sources (Nolan et al., 2012). They also found no variability in the flux, and considered the observed spectrum as consistent with IC scattering of high-energy electrons.
Ahnen et al. (2017) collected several models for the MeV to TeV emission from Sgr A∗. The list includes leptonic (Kusunose & Takahara, 2012), hadronic (Fatuzzo & Melia, 2012; Linden et al., 2012; Ballantyne et al., 2011; Chernyakova et al., 2011) and hybrid (Guo et al., 2013) models. We call the models in this list “Fermi-era”, since they were all constructed taking in consideration Fermi-LAT’s data.
The TeV emission observed by H.E.S.S. indicates the presence of PeV protons within the central tens of pc of the Galaxy (HESS Collaboration et al., 2016). They propose that a more active phase of Sgr A∗ in the past could have accelerated this population of high-energy protons. There is also tantalizing evidence for an enhanced level of activity in the recent past of Sgr A∗ through the Fermi Bubbles (Su et al., 2010) which should have formed 1–3 Myr ago and endured for 0.1–0.5 Myr (Guo & Mathews, 2012; Yang et al., 2018). The origin of the bubbles is still debated and could be also due to a previous starburst in addition to the activity of the SMBH. Further evidence for higher levels of activity in Sgr A∗ comes from X-ray observations of circumnuclear clouds (Ponti et al., 2010). Concretely, X-ray observations since the 1990s show rapid variations in the 6.4 keV of Fe K line propagating through molecular clouds in the inner Galactic regions. These variations are likely the result of a highly variable active phase of Sgr A∗ within the past few hundred years, which is echoing through the clouds. Models indicate at least two luminous outbursts (100 and 400 years ago) on few-year timescales during which the luminosity of Sgr A∗ went up to at least 1039 erg s-1 (Ponti et al., 2010; Clavel et al., 2013). In summary, it seems that Sgr A∗ was 103 times more active within the past few centuries compared to current levels.
The GC is the closest example of a galactic nucleus and a compelling laboratory to investigate the physical processes responsible for accelerating particles to TeV and PeV energies. Of the several sources near the GC in the Fourth catalog of Fermi-LAT sources (4FGL, Abdollahi et al. 2020), 4FGL J1745.62859 is the brightest and the closest to Sgr A∗, at a distance of . Furthermore, it has been shown that low-luminosity active galactic nuclei, of which Sgr A∗ is an example, can be efficient -ray emitters (de Menezes et al., 2020). Hence, it is logical to propose Sgr A∗ as a contributor to the GC -ray flux. Here, we report an imaging analysis for this point source. In section 2 we describe the observations and data analysis procedure. In section 3 we describe the results from the imaging analysis for the point source in four different energy ranges between 60 MeV–500 GeV. In section 4 we discuss the possible candidates that can explain the observed -ray emission. Finally, in section 5 we summarize our main findings.
2 Observations and Data Analysis
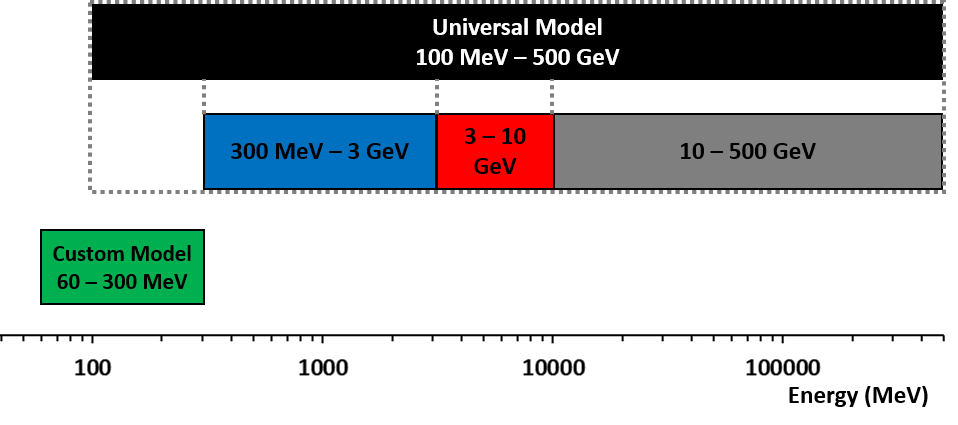
In this work, we divided the analysis into four energy bands: 60–300 MeV, 300 MeV–3 GeV, 3–10 GeV and 10–500 GeV. The goals were to study the impact of photon energy on the location of the source, to measure 4FGL J1745.62859’s -ray emission in different parts of the electromagnetic spectrum to allow comparisons with predictions of several models that try to explain the GC’s -ray flux (Section 4) and also to take advantage of the better Fermi-LAT point-spread function (PSF) at higher energies.
The investigations of the three highest-energy bands are based on an analysis (which we call “universal model”) performed with energies between 100 MeV and 500 GeV. The lowest-energy band used a custom model. Figure 1 shows how we split the analysis into different energy bands and models.
This study has some similarities to the work of Malyshev et al. (2015), with several improvements. The most obvious is the longer time baseline of the photon data—more than 10.5 years of observations versus 6 years—which provides better statistics. This allows for sharper images and better modelling with reduced source confusion. Also, we are using updated versions of the analysis tools and a more-recent version of the Fermi catalog (accompanied with improved versions of the diffuse models), all of which were released after their work. Finally, we chose to use a stricter event type selection than Malyshev et al. (2015).
In this Section we show how the universal model (and its descendants) and the low-energy custom model were created and how they were used to assess 4FGL J1745.62859’s -ray flux and position in different energies.
2.1 The universal model and its descendants
Here we describe the process for the creation of a spatial/spectral model with photons between 100 MeV and 500 GeV. This model was used to evaluate the -ray photon and energy fluxes of the source. Also, it was used as the basis for three different analyses considering only photons with energies between 300 MeV–3 GeV, 3–10 GeV and 10–500 GeV.
In this part of the work, we used 11.3 years (from 2008 August to 2019 December) of Fermi-LAT (Atwood et al., 2009) data. We considered a region of square centered on the point source 4FGL J1745.62859 coincident with Sgr A∗ and rotated to the East in Galactic coordinates. In this work, we use photons classified as SOURCE.
Fermi-LAT photons are classified in different event types. They can be categorized according to the location where they converted in the detector (photons converted in the front of the equipment have better-measured directions than those converted in the back) or according to the quality of the reconstructed direction (the photons are divided in quartiles depending on the quality of this reconstruction). In this work we chose to consider only the 75 photons with the best-reconstructed directions (event types PSF1, PSF2 and PSF3).
Data were binned to a pixel size of 0∘.08. We chose the recommended111https://fermi.gsfc.nasa.gov/ssc/data/analysis/documentation/
Cicerone/CiceroneDataExploration/Datapreparation.html value of for the zenith angle cut.
The region was modeled based on the sources’ positions and spectral models in the preliminary release of 4FGL (gll_psc_v20.fit, Abdollahi et al. 2020), the updated model of interstellar -ray emission, gll_iem_v07.fits, and standard isotropic spectral templates selected according to the event types and event class used in this work. We performed a binned likelihood analysis using Fermitools conda package version 1.2.1, Fermipy python package version 0.17.4 (Wood et al., 2017) and Pass 8 release 3 Version 2 response functions (Atwood et al., 2013). Energy dispersion was disabled for the isotropic diffuse component only.
To perform a likelihood analysis with Fermi-LAT data, it is necessary to create a model of the -ray emitting sources in the region of interest (RoI). To generate the model, we included the 4FGL sources inside a square larger than the size of the RoI (with side) to account for Fermi-LAT’s PSF. Its PSF varies considerably with photon energy. It ranges from 10∘ (68 containment for the photon selection used in this work) for photons at 60 MeV to 0∘.2 for 10 GeV photons.
We performed a joint likelihood analysis with three components accounting for the isotropic emission because event types PSF1, PSF2 and PSF3 have different isotropic spectral templates. We started by creating the universal model with energies between 100 MeV and 500 GeV. In the 4FGL Catalog, the 4FGL J1745.62859 spectral model is a log-parabola:
| (1) |
where is the differential photon flux, is the normalization, is a scale parameter, is the spectral slope at and gives the curvature of the spectrum.
We began the analysis using Fermipy’s optimize method. This tool fits the spectral models of all sources within the RoI through an iterative strategy: it starts by simultaneously fitting the normalization parameters of the brightest sources, then individually fits the normalization of every source not included in the first step, and finishes by individually fitting the normalizations and indexes of sources with the largest TS. After that we started fitting the sources in the RoI. Since the GC region is very rich in sources—there are 196 4FGL sources in the central of the Galaxy—we used an iterative approach for fitting of the RoI, always taking care to limit the number of free parameters to as recommended by the optimizer’s (MINUIT) manual. Several iterations were performed in order to fit the brightest sources closest to 4FGL J1745.62859. In all iterations, the normalization of our source of interest was allowed to vary as well as the normalizations of the Galactic diffuse emission model (galdiff) and of the isotropic spectral template (isodiff). The normalizations of selected sources were also iteratively freed based on their proximity to the center of the RoI and their brightness in -rays, measured by the number of predicted photons in each energy interval. We performed several iterations to fit the desired sources. Only the best-quality fits (Quality: 3, Status: 0) were considered. Fits that did not converge or with lower quality were disregarded. In this case we would go back to the previous step of the fitting procedure and continue from there with fewer free sources.
The next step was to use the Fermipy function find_sources. Twenty-nine new sources were found with this tool in the energy range between 100 MeV and 500 GeV. We used power-law spectral models for each of the new sources. This spectral model was selected because it is typically adequate for relatively faint sources, and in fact the majority of sources in 4FGL are modeled with a power-law spectrum. Finding and characterizing new sources is not a goal of this work. The aim of this source-finding step was to improve the quality of the model. Some of the newly found sources are likely spurious detection due to unmodeled background emission. The new sources are listed in Appendix A.
In between these steps we evaluated the quality of our fitting procedures by two approaches:
-
•
Residual maps: built by subtracting the modeled counts from the data and searching for regions with significant residuals222For a description on how the significance is calculated:
https://fermipy.readthedocs.io/en/latest/advanced/residmap.html. -
•
Test Statistic (TS, Mattox et al. 1996) maps: searching for the presence of an additional source component in each spatial bin of the RoI.
Maps that show no regions with TS 25 and Residuals were considered well modeled. Regions with excesses above these levels were fit again. In these cases, the normalizations of sources close to excesses in those maps were allowed to vary, together with the normalizations of 4FGL J1745.62859 and of the diffuse components. Usually, mainly in the case of negative residuals, this additional round of fitting was enough to lessen the excesses in the maps while also increasing the likelihood of the model. In the case of regions with positive TS, some of the excesses were reduced only after using the find_sources tool.
The last step was fitting the spectral indexes of the central source. The approach was the same as described above. We performed different iterations of fitting, always with the normalization and the indexes of 4FGL J1745.62859 as free parameters together with other free parameters that usually included the normalization and the spectral indexes of nearby bright sources and the Galactic and isotropic diffuse models. Only iterations with the best fit quality were considered.
These steps led to the creation of the universal model with photons between 100 MeV and 500 GeV. Then, it was used as an initial model for the analysis in three energy bands (300 MeV–3 GeV, 3–10 GeV and 10–500 GeV). In each energy band, the only sources that were allowed to vary in a new round of fitting were 4FGL J1745.62859 (normalization and index) and the Galactic and isotropic diffuse models (normalization only). This “minimal fitting” was used with the objective of keeping a similar model in the three energy bands.
To determine the centroid of the -ray emission of the central point source for each energy range and calculate the likelihood of it being spatially extended, we used Fermipy’s extension method. In addition to finding the location of the point source, it computes the likelihood of the source being extended with respect to it being pointlike. Also, it gives the best-fit model for extension. We chose to use a 2D Gaussian as the putative extended spatial model for the central source.
2.2 The low-energy model
Using the universal model as a starting point for a new model at lower energies proved to be challenging. We could not obtain a good-quality model with the same minimal fitting used to “split” the universal model in 3 energy bands (described at the end of Section 2.1) nor with several additional rounds of fitting: in both cases we ended up with models whose Residuals and TS maps showed many regions with excesses above the acceptable levels. So we decided to use a model created specifically for the 60–300 MeV energy band. We already had this model prepared from previous studies. As will be described below, some features of this model’s data are different from the universal model’s. This is not a serious issue because, in this work, we treat the results for each energy band independently, avoiding comparisons between each other.
We considered data inside a square also centered on the point source 4FGL J1745.62859 and with the same orientation as the one used to the universal model. This choice of size for the RoI is appropriate for modeling the distribution of lower-energy photons given the broad PSF. We used 0∘.1 pixel size and the recommended value of for the zenith angle cut. About 10.5 years of Fermi-LAT data was considered (from 2008 August to 2019 February).
We modeled the region using the preliminary release of 4FGL (gll_psc_v17.fit, Abdollahi et al. 2020), the updated model of interstellar -ray emission, gll_iem_v07.fits, and standard isotropic spectral templates. We included in the model all 4FGL sources in a region with side to account for Fermi-LAT’s PSF. Energy dispersion was disabled for the isotropic and Galactic diffuse components.
As for the analysis described in Section 2.1 we used event class SOURCE, event types PSF1, PSF2 and PSF3 and performed a joint likelihood analysis with three components accounting for the isotropic emission.
Before starting the analysis we changed the Spectrum Type of 4FGL J1745.62859. It is cataloged as log-parabola but we adopted a power-law in this low-energy model (Equation 2, where is the spectral slope.). We used results obtained in previous analysis using the Third Fermi LAT catalog (3FGL, Acero et al. 2015) as the starting values for the parameters that were later refit with the new data. The main reason for the change was the ease of fitting power-law spectra, which have one less parameter compared to log-parabolas. This change is appropriate since in narrow energy bands (like the ones we are using here) a log-parabola can be approximated by a power law:
| (2) |
After this, we followed the same process described in Section 2.1 to fit the model. During this process, we found 14 new sources with Fermipy’s function find_sources in regions associated with TS 25. But in new rounds of fitting, several of them showed a reduction of their TS to values below 25. Since Fermi-LAT’s PSF is broader at lower energies, we decided to exclude—one at a time—the new sources in this condition from the model to avoid them interfering in the results of our source of interest. We started by excluding the farthest from the center of the RoI and refit the model. The normalizations of the sources closest to the excluded one were left free, together with the normalizations of the Galactic diffuse emission model, of the isotropic spectral template and of 4FGL J1745.62859. We repeated this process until there were no new sources with TS 25 in the model. After excluding these sources, we ended up with 5 new sources. They are listed in Appendix B. As we mentioned in Section 2.1, these new sources may be spurious detections due to inaccuracies in the models. Finally, we used Fermipy’s extension method to assess the location of 4FGL J1745.6-2859 in this energy range.
3 Results
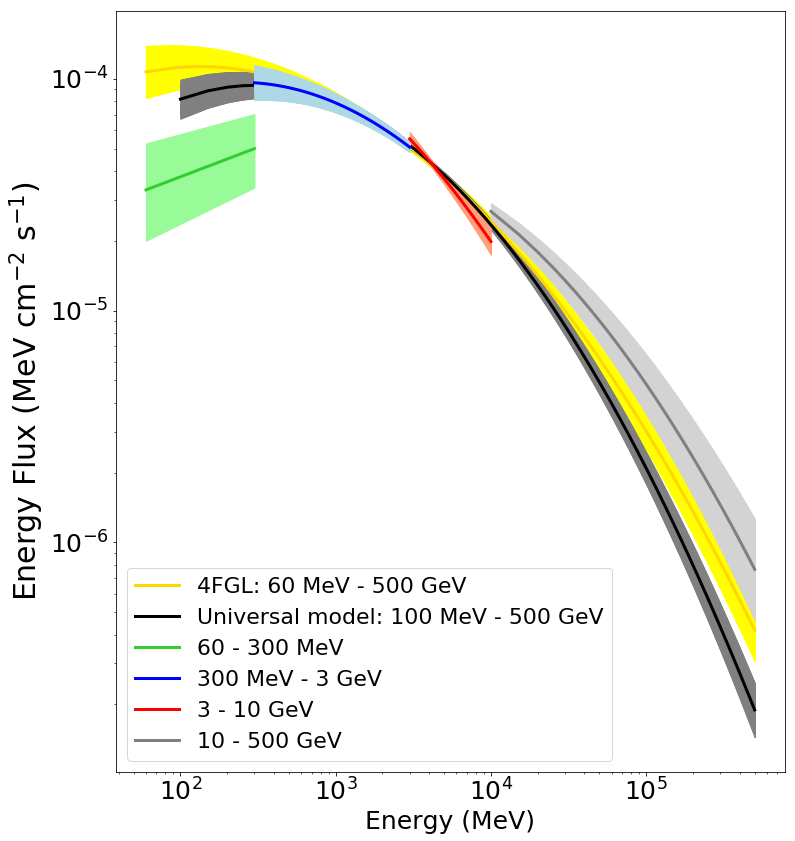
In our work, we subdivided the analysis into four energy ranges. In Figure 2 we compare the results of these four models with the log-parabola spectral model adopted in the 4FGL Catalog for 4FGL J1745.62859. We can see there is a considerable discrepancy between the low (60–300 MeV) and higher energy (300 MeV) spectral models. This is the result of the different modelling for the 60–300 MeV band, as discussed in Section 2. Only part of this difference can be explained by the addition in our 60–300 MeV model of a new source (not included in 4FGL but listed as PS J1750.6-2723 in Appendix B) at a distance 2∘ from 4FGL J1745.62859. This difference means that the -ray flux for this energy band might be underestimated. It is important to notice that the GC is among the most complicated regions in the sky to study with Fermi data: in addition to the high density of sources, the region is also engulfed by the Galactic diffuse emission. These factors are enhanced in lower energies due to the large PSF.
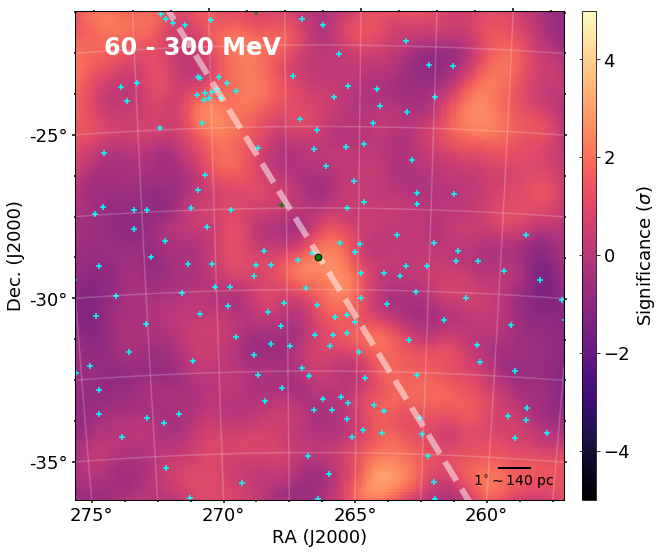
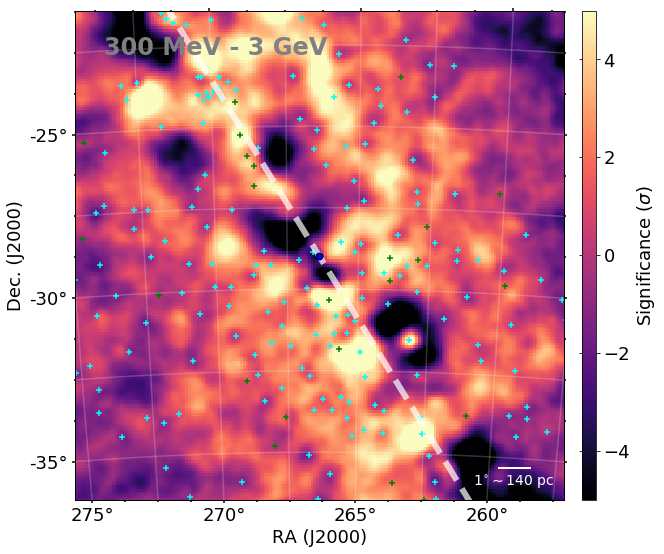
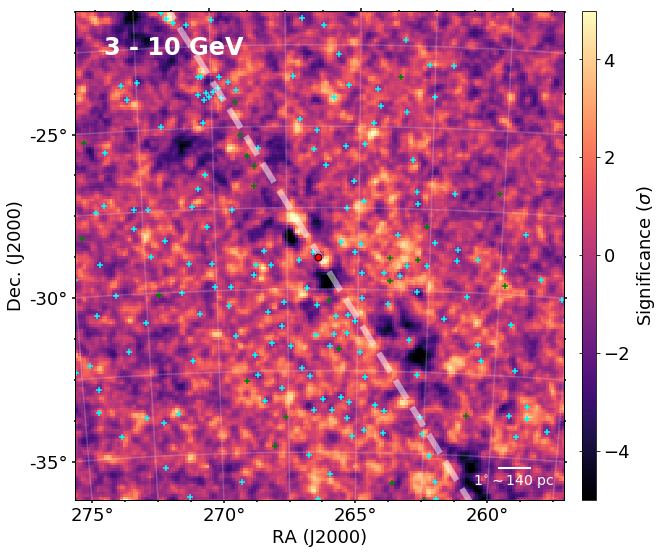
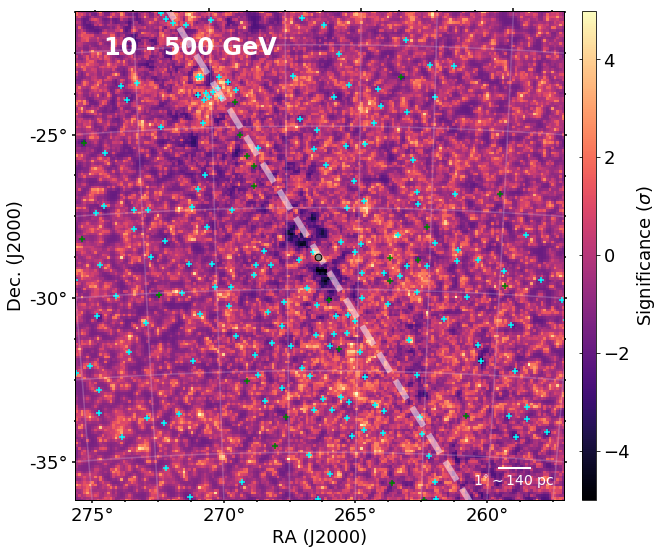
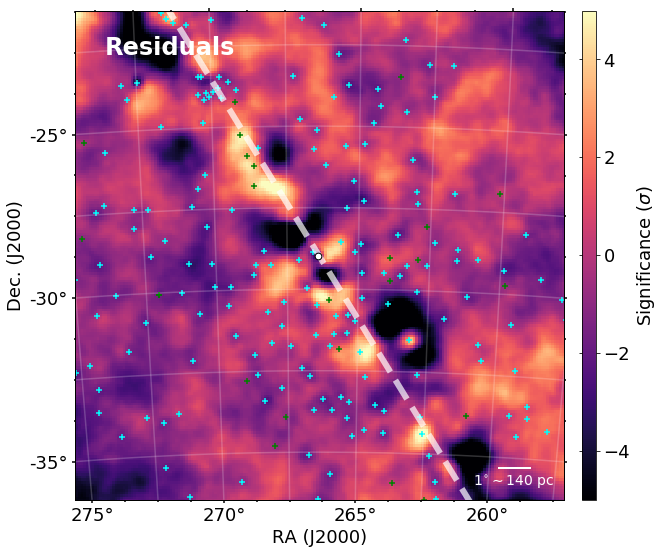
In Table 1 we show the spectral parameters for 4FGL J1745.62859 obtained from the fitting process detailed in Section 2 and shown in Figure 3. These residual maps are useful to assess goodness-of-fit. The colors indicate the significance () of the residual (calculated as the difference between the data and the model) in each energy band used in this work. Positive residuals indicate regions that are underpredicted whereas negative ones indicate overpredicted regions. The means of the significance distribution shown in the residual maps of Figure 3 are (for the 60–300 MeV energy band); (300 MeV–3 Gev); (3–10 GeV) and (10–500 GeV).
There are some regions with in the models with energies 300 MeV, especially in the 300 MeV–3 GeV energy band. They are the result of the minimal fitting we did when splitting the analysis in the different energy bands. This prevented us from getting better models but provided models that are comparable between the 3 highest-energy bands. To assess whether the results we obtained were, instead of a precise representation of the data, an artifact of the minimal fitting, we developed a simple test. We created unique models from scratch (instead of starting with the universal model) for each of the 3 highest-energy bands and performed the same analysis. In the tests, the results for each energy band were compatible within 1 with the ones presented in this work, both in terms of the -ray fluxes and the position of the source.
| Model’s | Spectral parameter | ||||
|---|---|---|---|---|---|
| energy range | |||||
| (GeV) | (10-12 cm-2 s-1 MeV-1) | (MeV) | |||
| 0.06–0.3 | 13.3 2.7 | 2545 | - | - | -1.745 0.073 |
| 0.3–3 | 4.49 0.09 | 4134 | 2.58 0.03 | 0.234 0.022 | - |
| 3–10 | 2.52 0.07 | 4134 | 2.79 0.10 | 0.234 0.021 | - |
| 10–500 | 2.27 0.06 | 4134 | 2.33 0.06 | 0.234 0.021 | - |
| 0.1–500 | 2.53 0.05 | 4134 | 2.59 0.03 | 0.260 0.011 | - |
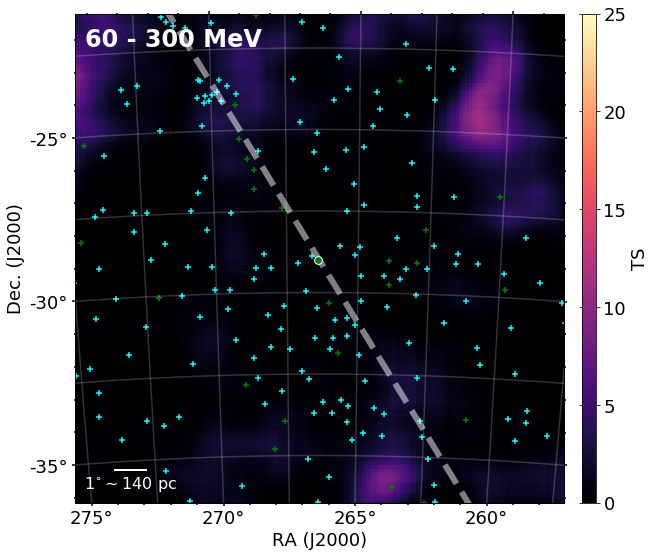
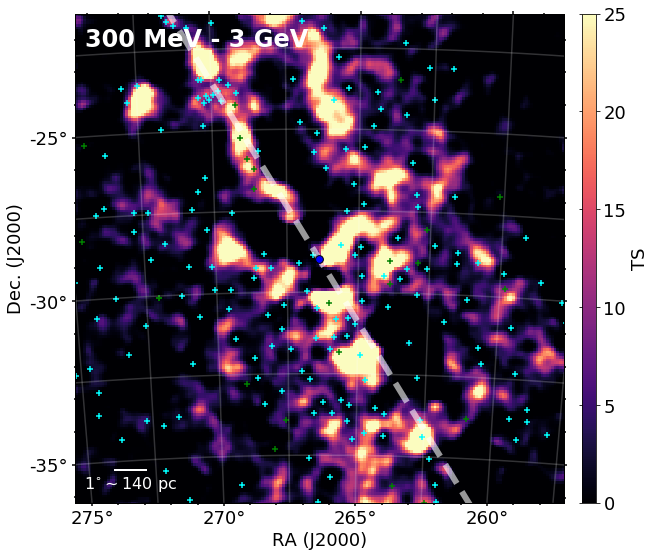
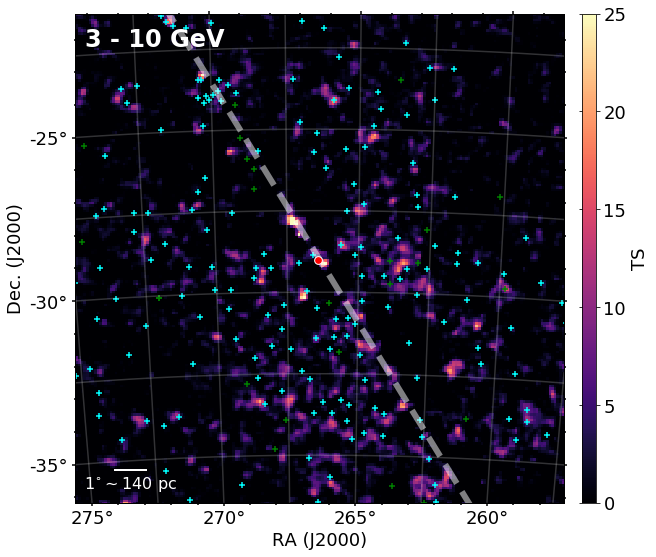
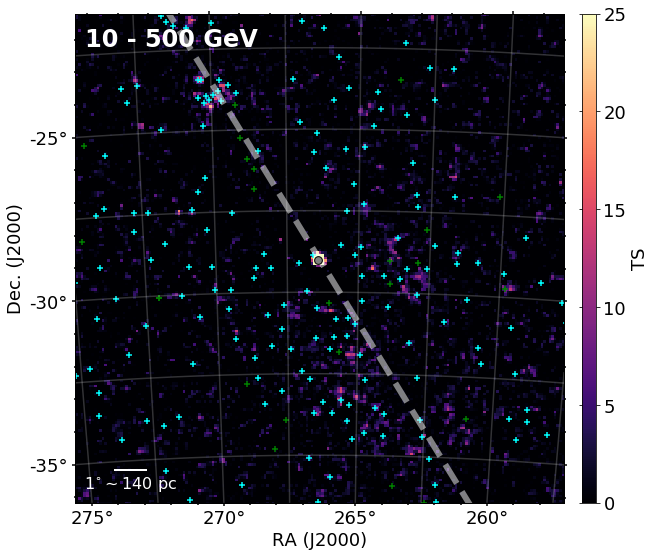
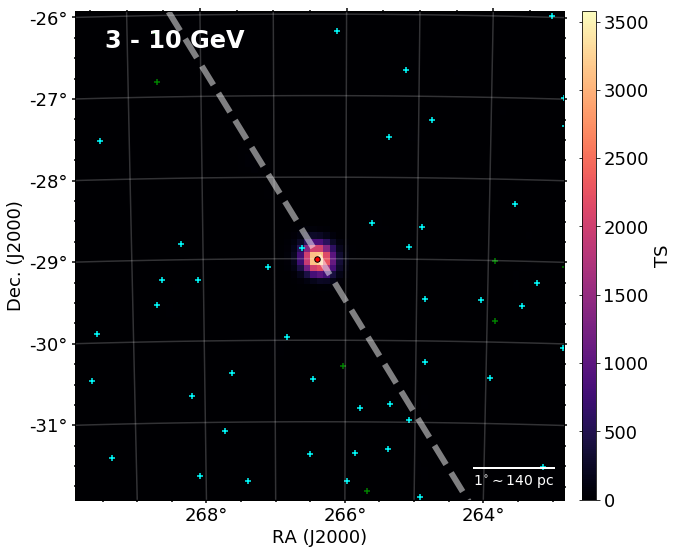
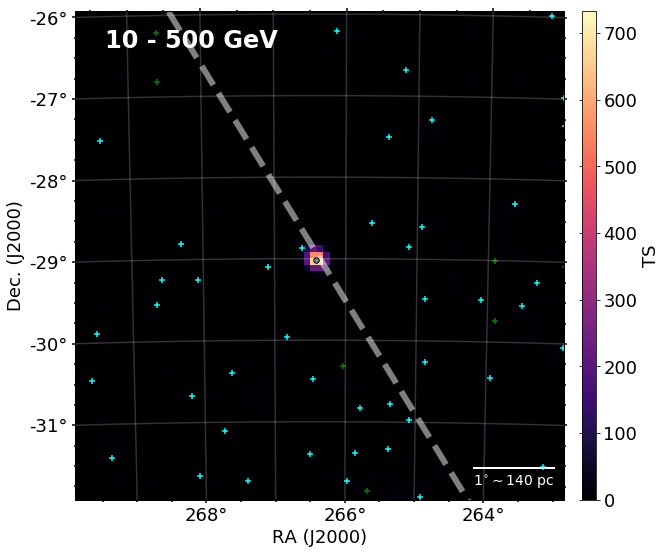
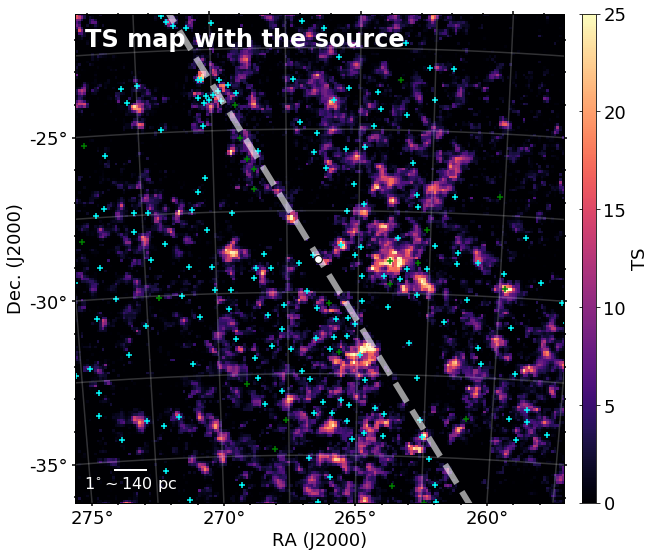
The four panels in Figure 4 show the TS map for each energy range. They were constructed using the tsmap tool. This tool moves a putative point source through the RoI and performs a maximum likelihood fit at each point. We used a power-law spectral model with a spectral index of (with where is the differential photon flux and is the spectral index). In the maps, the source position in each energy range is marked by a colored circle in the center of the images. The central point source itself is not visible in the maps since it is part of the model. For the 60–300 MeV range there is no region with TS 25 (i.e. no emission consistent with a point source with a power-law spectrum with index has significance ). This shows that the models include all significant sources in this field. But in the maps of the high-energy ( 300 MeV) models this is not true. These models were created with minimal fitting based on the universal model (Section 2.1) which led to regions that could be better modeled if its sources were refit. Nevertheless, the results we got for these energy models are compatible within 1 with the ones obtained through models created specifically for each energy band (and that had no residual TS ).
The central source was detected in the four energy ranges used in the analysis with TS varying from to , corresponding to detections with significance above background ranging from to . Its photon and energy flux were also measured and the results are shown in Table 2.
Assuming a distance to 4FGL J1745.62859 of 8.2 kpc (Abuter et al., 2019) and isotropic emission, the energy flux of measured in the 100 MeV to 500 GeV energy range corresponds to a -ray luminosity of . This luminosity is comparable to the observed radio-to-X-ray luminosity of Sgr A∗ (Genzel et al., 2010).
The energy flux we measured in the 60–300 MeV is smaller than the results obtained by other works focused on previous versions of the cataloged GC -ray source: Chernyakova et al. (2011) observed the Fermi-LAT source 1FGL J1745.62900 and Malyshev et al. (2015) studied 2FGL J1745.62858. The energy fluxes we observe are about a factor of 2 lower than the ones reported by the former and only marginally consistent with the latter. This difference can be explained by two reasons. Firstly, in the following version of the Fermi Catalog, the 2FGL J1745.6-2858 source was split into two different sources: 3FGL J1745.62859c and 3FGL J1745.32903c. The former was subsequently renamed to 4FGL J1745.62859. Chernyakova et al. (2011) and Malyshev et al. (2015) were, then, considering the summed emission of what is now described as two different sources. The 3FGL J1745.32903c is softer than 3FGL J1745.62859c (and 4FGL J1745.62859), hence the greater difference between the results in lower energies. Another reason to explain this difference is the improvement of the Galactic diffuse emission model through the years333https://fermi.gsfc.nasa.gov/ssc/data/analysis/software/aux/4fgl/
GalacticDiffuseEmissionModelforthe4FGLCatalogAnalysis.pdf. In comparison to ours, their observations were potentially more contaminated with the diffuse emission associated with gas in the Galaxy, which is more prominent at lower energies.
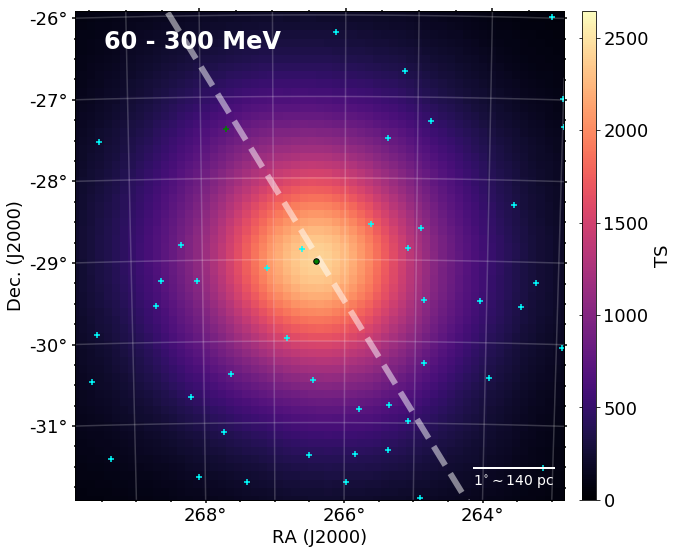
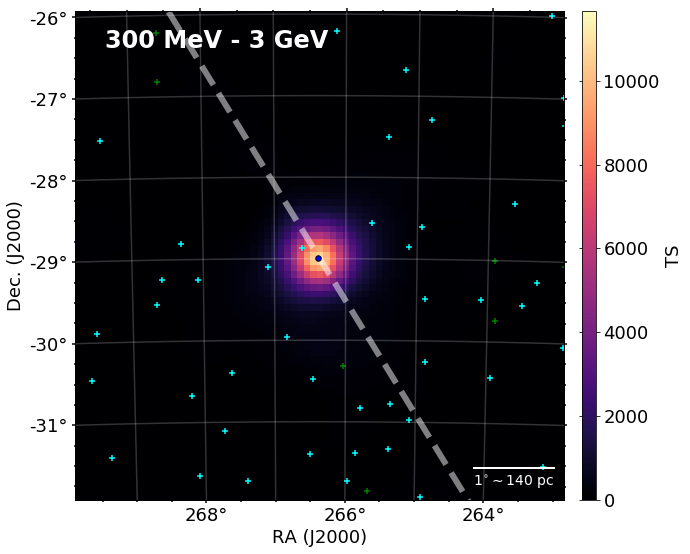
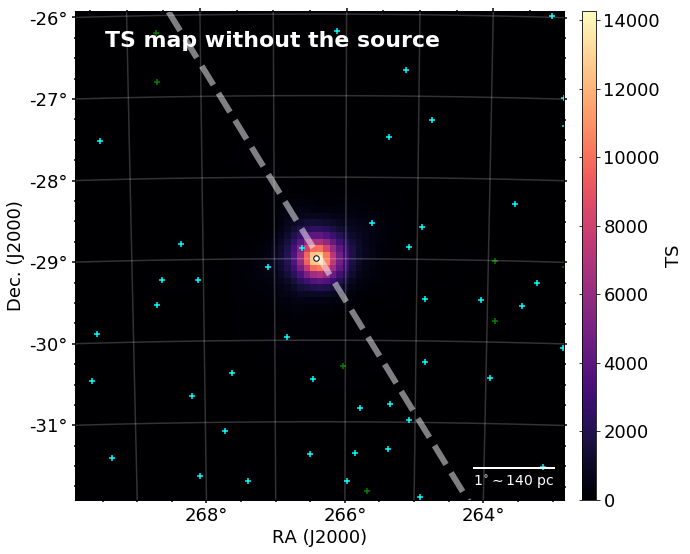
The four panels of Figure 5 show the TS maps of the inner of the RoI, showing the presence of the central point source. They were constructed using the tsmap tool (again considering a putative point with a spectral index of ) and excluding the source 4FGL J1745.62859 from the models. TS excesses are observed in every panel and are always coincident with 4FGL J1745.62859’s position. The apparent size of the excess in the TS maps seems to decrease with energy, but this does not correspond to any variation of the physical extension of the source. It is, instead, an outcome of the improvement of Fermi-LAT’s PSF with energy, as mentioned in Section 2.
The same diagnostic plots shown in Figures 3, 4 and 5 for the different energy bands were used to evaluate the quality of the fit of the universal model. They are shown in Appendix C.
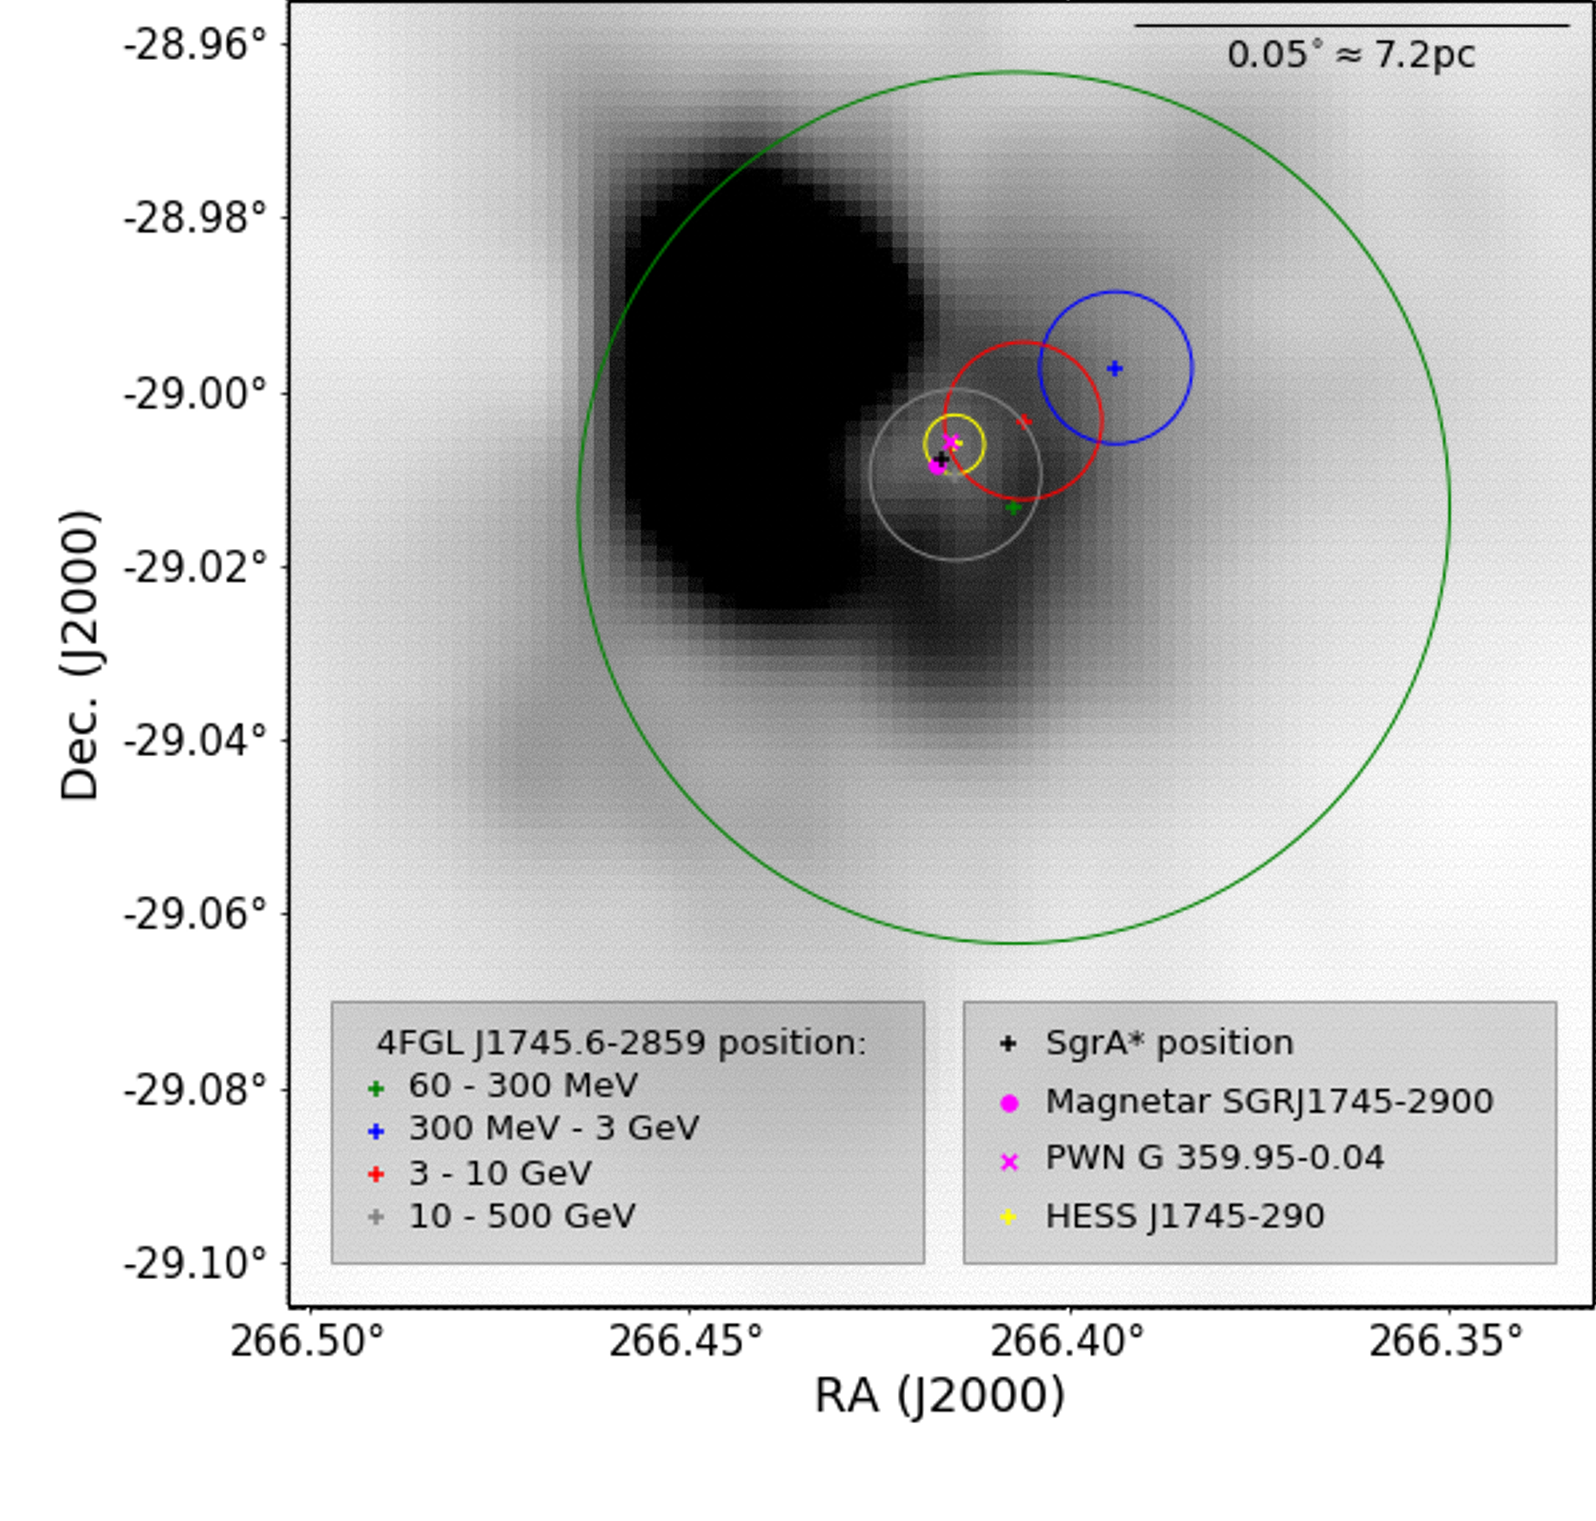
We used the localize tool to constrain the point source location in each energy range. Figure 6 shows the dependence of the source location on energy, together with the radio position of Sgr A∗ as measured by the Very Long Baseline Array (Petrov et al., 2011) and locations of other potential -ray emitters in the GC.
To calculate the total errors on the location of the source we followed the approach used by Abdollahi et al. (2020) for the creation of the 4FGL Catalog:
| (3) |
|
|
|
|
| Energy | TS1 | Photon flux | Energy flux | Centroid2 | Positional Uncertainty3 | Extension | |
|---|---|---|---|---|---|---|---|
| range (GeV) | (10-7 cm-2 s-1) | (10-10 erg cm-2 s-1) | (∘) | statistical (∘) | total (∘) | UL4 (∘) | |
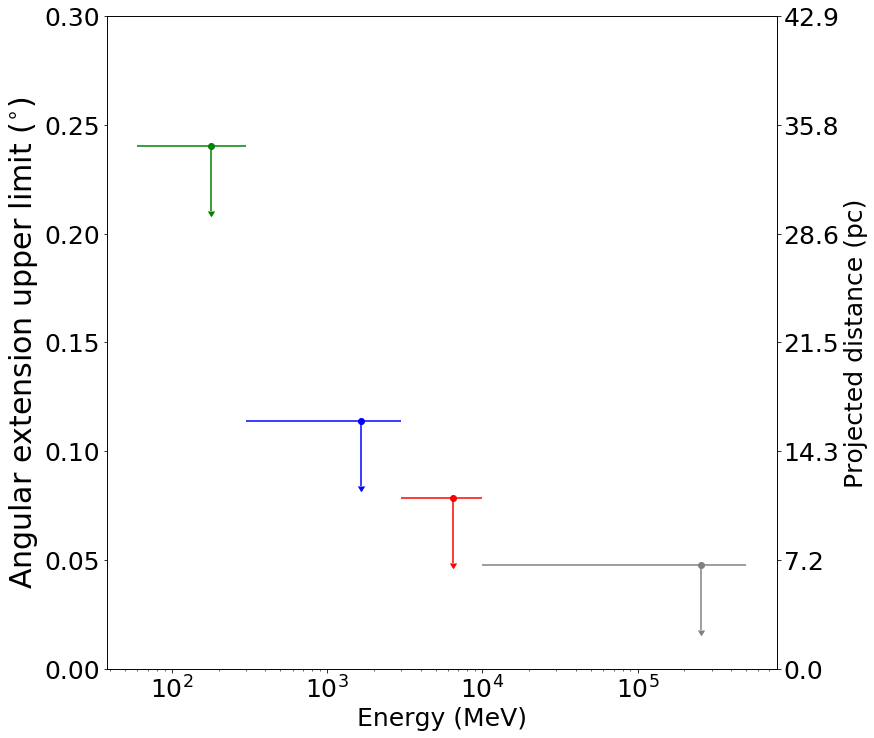
| 0.06 – 0.3 | 2246 | 5.17 0.16 | 1.06 0.03 | 266.407, | 0.045 | 0.050 | 0.24 |
| 0.3 – 3 | 10522 | 1.49 0.17 | 1.99 0.20 | 266.394, | 0.005 | 0.009 | 0.11 |
| 3 – 10 | 3618 | 0.0894 0.0022 | 0.669 0.017 | 266.406, | 0.005 | 0.009 | 0.08 |
| 10 – 500 | 321 | 0.0123 0.0011 | 0.345 0.035 | 266.415, | 0.005 | 0.010 | 0.05 |
| 0.1 – 500 | 14724 | 2.83 0.08 | 3.26 0.05 | ||||
-
1
1 detection significance of the source in each energy range
-
2
2 RA and Dec (in the J2000 epoch) corresponding to the emission centroid in degrees
-
3
3 68% confidence level positional uncertainty
-
4
4 95% confidence level extension upper limit
|
|
For the absolute precision we used the value of (Abdollahi et al., 2020) in the two energy bands below 3 GeV and (Ajello et al., 2017) for higher-energy bands. For the systematic factor we used 1.1 for the three lower-energy bands and 1.2 for the 10–500 GeV band, these are conservative values based on Fermi-LAT’s reported PSF systematic uncertainty444https://fermi.gsfc.nasa.gov/ssc/data/analysis/
LATcaveats.html. The statistical errors are the 68% positional uncertainties obtained reported by the localize tool.
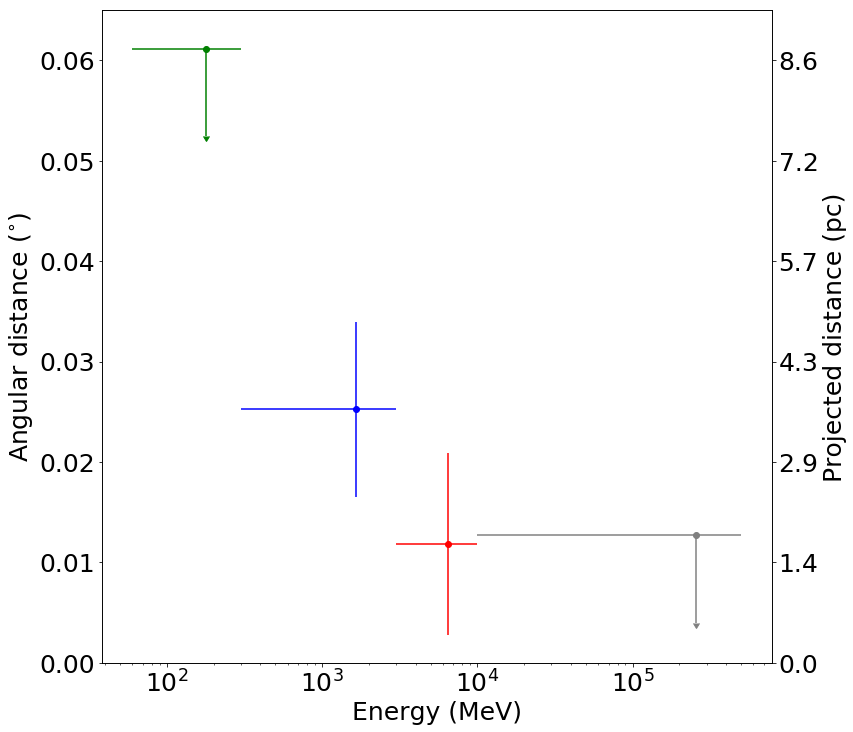
In Figure 6 we can see that the position uncertainty of the source in the lowest energy range is the largest. This is the result of a combination of factors: the broadening of Fermi-LAT’s PSF at lower energies, the energy dependence of the instrument’s field of view and effective area, the central source’s spectrum and the impact of the Galactic diffuse emission which is more prominent at lower energies. The position of the source is consistent within with Sgr A∗in the energy ranges 60–300 MeV and 10–500 GeV. The -centroid recedes from Sgr A∗ as the energy decreases. This is also seen in Figure 7, which shows the distance between 4FGL J1745.62859 and Sgr A∗ as a function of energy.
We also tested the likelihood of the source being extended versus a point source using the extension tool. Figure 8 shows the 95% upper limits on the spatial extension of the source for each energy range. We find no conclusive evidence for any spatially extended emission from the central source.
4 Discussion
By assuming a distance of 8.2 kpc for 4FGL J1745.6
2859 (i.e., that it is located at the GC) we obtain the interesting result that its -ray luminosity is similar to Sgr A∗’s radio to X-ray luminosity, about .
Even though this -ray luminosity is not unusual among Fermi sources555For instance, the point source 4FGL J1746.42852 lies just from Sgr A∗with a luminosity of . It is associated with a pulsar wind nebula and was included in our source model. the strong similarity between the electromagnetic energetics of 4FGL J1745.62859 and Sgr A∗, combined with the positional coincidence, naturally suggests that the -ray point source investigated in this work is associated with the accreting SMBH. Nevertheless, the PSF of Fermi-LAT encompasses a region of size pc around the GC. Even the more constraining limit of 0∘.24 for the central source’s extension upper limit (Figure 8) corresponds to 35 pc at the distance of Sgr A∗, thus allowing for several other potential candidates for the -ray production site. Here, we list the most promising ones and discuss their likelihood at accounting for 4FGL J1745.62859.
The SMBH: Aharonian & Neronov (2005a) argue that due to Sgr A∗’s low bolometric luminosity compared to other SBMHs, the -rays produced close to the event horizon—or in the inner parts of the accretion flow—can escape the source and be detected by Fermi-LAT because the absorption through photon-photon pair production is low. Aharonian & Neronov (2005a) considered three scenarios for the TeV photons detected by H.E.S.S., two being hadronic and one leptonic. The first hadronic model considers emission related to accelerated protons producing -rays through synchrotron and curvature radiation. It predicts an energy flux lower than a few 10-12 erg cm-2 s-1 in the energy range studied in this work, below the values we observed. The second hadronic scenario considers lower energy protons accelerated by the electric field close to the event horizon or by shocks in the accretion disks. Some parametrizations of this model predict very peaked spectral energy distributions (SEDs) in the energy ranges used in this work. Since these SEDs are very narrow, the energy fluxes they predict are consistent only with the observations in one of the four energy ranges we used in this work. Their leptonic model, in its turn, also fails to explain Fermi-LAT’s observation of 4FGL J1745.62859: its SED shows erg cm-2 s-1 at 1 GeV, thus overpredicting our observed energy flux around this energy. On the other hand, Kusunose & Takahara (2012) used 25 months of Fermi-LAT’s data for the GC (reported by Chernyakova et al. 2011) and proposed another leptonic model in which electrons escaping from the vicinity of Sgr A∗ accumulate in a region with a size of 1018 cm where the -rays are produced by IC scattering of soft photons emitted by stars and dust around the GC. Importantly, they obtain energy fluxes similar (10-10 erg cm-2 s-1) to the values observed here.
A “plerion” produced by electrons in Sgr A∗’s winds: Atoyan & Dermer (2004) propose a model for Sgr A∗ in which the quiescent radio and the flaring NIR and X-ray emissions are generated by synchrotron radiation from the RIAF. The wind from the RIAF, in a process similar to pulsar-powered plerions, generates the quiescent X-ray and TeV emissions at the wind termination shock at about 3 1016 cm from the SMBH. Although it can explain H.E.S.S.’ TeV observations, their model is not sufficient to explain the MeV-GeV reported in this work. Even if we consider Sagittarius A West bremsstrahlung emission and the emission from a larger plerion (inflated to pc scales), which are prominent in the energy range used in this work (e.g., their Figure 1), the energy flux we detected is still about one order of magnitude higher. Atoyan & Dermer (2004) assume that the quiescent X-ray emission detected from Sgr A∗ is the result of synchrotron radiation from electrons accelerated in the termination shocks of a wind of magnetized plasma from the accretion flow. But deep Chandra observations have shown that this emission is thermal and arises from the hot accretion flow (Wang et al., 2013). Though these observations do not completely rule out the possibility of such a “plerion”, this model now faces additional constraints from our Fermi-LAT observations.
The interaction between the dense molecular clouds with cosmic rays: As an explanation for the -ray emission from the GC, Aharonian & Neronov (2005b) presented a model of proton-proton interactions between the protons accelerated near the SMBH and the dense gas in the central 10 pc of the Galaxy which are followed by decay to -rays. Aharonian & Neronov’s work was published before the beginning of operations of Fermi-LAT. Their results are inconsistent with our observations.
More recent models take into account Fermi-LAT observations. For instance, Chernyakova et al. (2011) use the first 25 months of Fermi-LAT and H.E.S.S. data to create a hadronic model in which relativistic protons (presumably accelerated near Sgr A∗) interact with the gas in the inner parsecs of the Galaxy. Linden et al. (2012) developed a similar model. Another hadronic model is proposed by Fatuzzo & Melia (2012) where they consider a two-phase environment surrounding Sgr A∗: an inner high-density “torus” and the surrounding interstellar medium filled with shocked stellar winds which they call the “wind zone”. Fermi -rays would be produced in the “torus” and the higher energies would come mostly from the “wind zone”. Guo et al. (2013) propose a hybrid model. In their scenario, protons and electrons are accelerated in the GC (possibly around Sgr A∗). Collisions between the protons and the interstellar gas would produce the TeV -rays and the electrons would IC scatter the soft background photons.
The four “Fermi-era” models mentioned above—namely, Chernyakova et al. 2011; Linden et al. 2012; Fatuzzo & Melia 2012; Guo et al. 2013—are consistent with our observations, except in the lower energy band we used. This energy band is the one most subject to source confusion and to the impacts of the Galactic diffuse emission. This could explain why we observe greater energy fluxes in the 60–300 MeV energy band than the prediction of these models: in addition to the -rays created by the interaction between cosmic rays originated by (or nearby) Sgr A∗, there is also a contribution from other sources. When Ahnen et al. (2017) compared Fermi-LAT’s data reported by Malyshev et al. (2015) with the “Fermi-era” models, the lower energy data ( 200 MeV) also showed greater fluxes than the models’ predictions.
The PWN G 359.95-0.04: This X-ray nebula was discovered by Wang et al. (2006) with a projected distance of only 0.32 pc from Sgr A∗ and was proposed as an explanation for the TeV emission observed in the GC. Hinton & Aharonian (2007) constructed theoretical SEDs for this source based on Chandra’s detection and supposing that the TeV emission of the H.E.S.S. source HESS J1745290 is from the PWN. Their models (e.g., their Figure 4) predicts energy fluxes on the order of for the energy ranges studied in this work. This is more than one order of magnitude lower than the energy fluxes we measured for 4FGL J1745.62859. PWN IC emission models are sensitive to the magnetic field intensity. Hinton & Aharonian (2007) adopted a magnetic field of 100 G. Later measurements, obtained thanks to the magnetar SGR J17452900 discovery, indicate that the GC magnetic field strength must be in the mG levels (Eatough et al., 2013). In more intense magnetic fields, synchrotron becomes more important as a path to electron cooling than IC. It means that if the Hinton & Aharonian (2007) model was updated with the newer observational data, its -ray output would be even more displaced from our observations. This indicates that G 359.95-0.04 is not a good candidate to explain 4FGL J1745.62859’s emission.
The SNR Sagittarius A East: Sagittarius A East is an SNR usually explained as a supernova remnant, although other interpretations have also been suggested (Yusef-Zadeh & Morris, 1987; Mezger et al., 1989; Khokhlov & Melia, 1996). It is located in the inner parsecs of the Galaxy. Crocker et al. (2005) proposed it as the source of the TeV -rays from the GC. On the other hand, Aharonian et al. (2009) and Acero et al. (2010) ruled out this association based on H.E.S.S. observations that show the origin of the TeV emission, although still coincident with Sagittarius A East’s extended radio shell, coming from a region where the radio flux is comparatively low and significantly displaced from the radio maximum, as indicated in Figure 6. The same argument can be used to rule out a physical link between the SNR and the 4FGL J1745.62859 in energies above 300 MeV.
The magnetar SGR J17452900: This object was first detected during a flare in 2013 with Swift’s X-Ray Telescope (Kennea et al., 2013) and NuSTAR (Mori et al., 2013). 4FGL J1745.62859’s -ray light curve shows no sign of variability during this period (Malyshev et al. 2015; Ahnen et al. 2017; Cafardo et al., in preparation). Also, it is predicted that the high-energy portion of the spectra of magnetars peak at a few MeV (Thompson & Beloborodov, 2005), while our work clearly shows emission from 4FGL J1745.62859 at energies 10 GeV.
Self-annihilating dark matter particles accumulating at the GC: Self-annihilating dark matter particles could explain the GC -ray excess (Hooper & Goodenough 2011; Hooper & Linden 2011 and see Di Mauro 2021 for a recent analysis of the GC excess), a surplus of GeV diffuse emission that cannot be explained by the known cataloged sources. Although we did not test different morphologies for 4FGL J1745.62859, we did investigate the likelihood of it being extended, which is expected for the -ray from self-annihilating dark matter. Using a 2D Gaussian profile, we found no evidence of extension, hence decay profiles with similar morphologies are disfavored.
A population of pulsars surrounding the GC: The -ray spectra of pulsars and millisecond pulsars can be described as a power-law with an exponential cutoff above a few GeV (Abdo et al., 2010). de Menezes et al. (2019) studied the -ray emission of globular clusters in the Milky Way—attributed to their large population of millisecond pulsars—and found no significant flux above GeV. In contrast with that, the point source 4FGL J1745.62859 is detected at energies above that as indicated in Table 2 and Figure 5. Its hard spectrum is also not consistent with a pulsar (or population of them) in the line of sight. On the other hand, Bednarek & Sobczak (2013) propose that the GeV -ray emission from the GC is the result of the millisecond pulsar population of several globular clusters captured by Sgr A∗, while the TeV portion is produced by accelerated leptons in their winds via IC process in the soft radiation field. Since the TeV component is harder, it can start to contribute above 10 GeV in their model, which could be compatible with our observations. A detailed spectral analysis of 4FGL J1745.62859 is necessary to test whether Bednarek & Sobczak (2013) model is compatible with the GC -ray source.
The central cluster of massive stars: A young and dense stellar cluster lies in the GC (Do et al., 2013). Quataert & Loeb (2005) propose a model in which shocks from stellar winds can efficiently accelerate electrons to relativistic energies. Then, they IC scatter the ambient radiation field producing -rays from GeV to 10 TeV. Considering a distance of 8.2 kpc to the GC, their model predicts energy flux one order of magnitude lower than our observations. Aharonian et al. (2019) have discussed young stellar clusters as sources of cosmic rays. They suggest that the cosmic rays responsible for the diffuse very high energy -ray form the GC are accelerated by the local stellar clusters. This emission, though, is extended while we find no evidence for 4FGL J1745.62859.
Except for the models constructed around Fermi-LAT’s data, most of the candidates listed above are unlikely to be solely responsible (if responsible at all) for 4FGL J1745.62859’s emission. It is possible that some of them could explain, individually or together, the lower energy emission where Fermi-LAT’s PSF is broadest. One way to separate the contributions of different candidates at lower energies is through modeling the MeV-to-GeV SED of the point source. This is beyond the scope of the present paper, and left for a forthcoming work.
If we consider only the three highest-energy ranges used in this analysis, the centroid emission moves in the direction of Sgr A∗ as the photon energy is increased (Figures 6 and 7). Assuming a distance of 8.2 kpc, the projected distances to Sgr A∗ as a function of energy varies from 3.6 1.3 pc (300 MeV–3 GeV) to 0.4 pc (10–500 GeV). The location centroid for the lower-energy band is also consistent within 1 with Sgr A∗’s. The absence of a significant offset of the centroids with Sgr A∗—and with each other—is consistent with an origin close to the SMBH. One possible interpretation is that the particle populations responsible for the -rays detected in the three bands between 300 MeV and 500 GeV are accelerated by the same process, originating in the surroundings of Sgr A∗.
As discussed in Section 2, the impact of source confusion on Fermi-LAT observations is greater at lower energies due to the PSF broadening. The localization uncertainties are considerably larger at low energies, as well as the limit on the angular extension, which creates the possibility that several other sources and processes are contributing to the lower-energy flux.
We performed extension analysis of the source in the four energy bands used in this work. In Figure 8, we report the 95% confidence level upper limit for the spatial extension of the source. Again, we observe the impact of energy on the results: at lower energies the spatial extent is less well constrained due to the increasing PSF.
The association between 4FGL J1745.62859 and the GC’s TeV source, although likely, is not yet established. Assuming they are not related, the hard spectrum of the TeV source is expected to contribute in the highest energy band used in this work. This would make the Fermi source’s spectrum to appear harder than it really is, preventing the elimination of emitting candidates based on the 10–500 GeV energy range results. This will be investigated in a future work.
5 Summary
Sgr A∗—the accreting SMBH at the center of our galaxy—has been observed in virtually every band of the electromagnetic spectrum. In -rays, H.E.S.S. and Fermi-LAT detected point sources coincident with Sgr A∗. Nevertheless the connection between these point sources and Sgr A∗ remained inconclusive. In this work we have used about 10.5 years of Fermi-LAT observations of the point source 4FGL J1745.62859 at the Galactic Center with the aim of constraining the nature of its emission. We divided the analysis into four different energy bands between 60 MeV and 500 GeV, performing a detailed imaging analysis of the surroundings of the point source. Our main conclusions can be summarized as follows:
(i) The 0.1–500 GeV luminosity of the point source is assuming it is located at the Galactic Center; this value is comparable to the observed luminosity of Sgr A∗ from radio to X-rays.
(ii) The point source location approaches Sgr A∗’s position as the photon energy is increased. For instance, at energies GeV the source location is consistent with Sgr A∗ within .
(iii) Among several possible candidates to the -ray flux of the point source, the models invoking cosmic rays—either hadronic or leptonic—accelerated by Sgr A∗ or a nearby source are the most likely to explain our observations.
(iv) Other processes not associated with the SMBH, such as a population of pulsars in the GC, could be contributing to the flux, especially at energies 300 MeV.
Taken together, our results support the picture in which the point source 4FGL J1745.62859 observed by Fermi-LAT at the GC is the manifestation of Sgr A∗ in the MeV-to-GeV range.
The advent of the Cherenkov Telescope Array (CTA, Cherenkov Telescope Array Consortium et al. 2019) will allow for a deep exposure of the GC in energies up to 300 TeV. This will permit studies in spatial and spectral details unavailable today, with arc-minute resolution at energies above Fermi’s operational range, potentially enabling a firmer association between the very high-energy point source in the GC with Sgr A∗ or other nearby candidate. Correspondingly, proposed -ray missions focusing on MeV bands such as the AMEGO mission (McEnery et al., 2019) and e-ASTROGAM (de Angelis et al., 2018) should improve the observational sensitivity, helping to better constrain the properties of the GC emission in the 60–300 MeV energy band and shed light on the contribution of Sgr A∗.
In a forthcoming work, we will analyze the -ray variability and SED of 4FGL J1745.62859 in order to further constrain its physical origin.
Acknowledgments
We thank the anonymous referee for their questions, comments and suggestions that greatly improved the quality of this work. We acknowledge useful discussions with John W. Hewitt, Raniere de Menezes, Teddy Cheung, Matthew Kerr, Regina Caputo, Aion Viana, Julia C. Santos, Giacomo Principe, Jeremy S. Perkins, Seth Digel and Pablo Araya-Araya. This work was supported by CNPq (Conselho Nacional de Desenvolvimento Científico e Tecnológico) under grant 142320/2016-1 and FAPESP (Fundação de Amparo à Pesquisa do Estado de São Paulo) under grant 2017/01461-2.
The Fermi-LAT Collaboration acknowledges generous ongoing support from a number of agencies and institutes that have supported both the development and the operation of the LAT as well as scientific data analysis. These include the National Aeronautics and Space Administration and the Department of Energy in the United States, the Commissariat à l’Energie Atomique and the Centre National de la Recherche Scientifique / Institut National de Physique Nucléaire et de Physique des Particules in France, the Agenzia Spaziale Italiana and the Istituto Nazionale di Fisica Nucleare in Italy, the Ministry of Education, Culture, Sports, Science and Technology (MEXT), High Energy Accelerator Research Organization (KEK) and Japan Aerospace Exploration Agency (JAXA) in Japan, and the K. A. Wallenberg Foundation, the Swedish Research Council and the Swedish National Space Board in Sweden.
Additional support for science analysis during the operations phase is gratefully acknowledged from the Istituto Nazionale di Astrofisica in Italy and the Centre National d’Études Spatiales in France. This work performed in part under DOE Contract DE-AC02-76SF00515.
Appendix A New sources found in the analysis between 100 MeV and 500 GeV
Here we present the new sources encountered in the RoI with Fermipy’s find_sources function in the energy range between 100 MeV and 500 GeV. The maximum likelihood parameters for the power-law (Equation 2) used to model their spectra are also shown, together with their TS and position.
Some of these newly detected sources might be spurious due to unmodeled or inadequately modeled background emission.
| Source name | Index | Prefactor | TS | RA | Dec |
|---|---|---|---|---|---|
| PS J1719.12945† | 2.810-14 | 236 | 259.80 | ||
| PS J1720.62655 | 4.510-13 | 40 | 260.16 | ||
| PS J1723.83347 | 5.810-13 | 31 | 260.95 | ||
| PS J1729.53623 | 4.710-13 | 40 | 262.39 | ||
| PS J1730.52801 | 3.810-13 | 31 | 262.64 | ||
| PS J1731.62903 | 2.910-13 | 34 | 262.92 | ||
| PS J1733.82114 | 2.810-13 | 30 | 263.47 | ||
| PS J1734.43555 | 5.810-13 | 34 | 263.62 | ||
| PS J1734.62328 | 4.910-13 | 37 | 263.66 | ||
| PS J1735.52944 | 3.310-13 | 31 | 263.88 | ||
| PS J1735.62900† | 1.610-14 | 36 | 263.91 | ||
| PS J1742.73150 | 8.010-13 | 50 | 265.68 | ||
| PS J1744.13019 | 2.710-12 | 124 | 266.03 | ||
| PS J1747.22114 | 5.810-13 | 40 | 266.81 | ||
| PS J1750.43355 | 5.610-13 | 40 | 267.61 | ||
| PS J1752.03447 | 4.110-13 | 34 | 268.02 | ||
| PS J1752.62105† | 4.010-14 | 303 | 268.15 | ||
| PS J1754.42612 | 7.610-13 | 32 | 268.60 | ||
| PS J1754.42649 | 5.810-13 | 30 | 268.60 | ||
| PS J1754.73730 | 3.710-13 | 38 | 268.70 | ||
| PS J1755.32553 | 9.310-13 | 49 | 268.83 | ||
| PS J1756.03248 | 4.110-13 | 31 | 269.02 | ||
| PS J1756.32515 | 2.110-12 | 99 | 269.08 | ||
| PS J1756.82413 | 5.410-13 | 36 | 269.21 | ||
| PS J1758.02421 | 1.110-12 | 38 | 269.52 | ||
| PS J1808.23003 | 4.510-13 | 45 | 272.06 | ||
| PS J1817.42516 | 5.710-13 | 50 | 274.35 | ||
| PS J1818.62812 | 5.010-13 | 57 | 274.65 | ||
| PS J1823.92341 | 5.110-13 | 47 | 275.99 |
Appendix B New sources found in the analysis with the custom model between 60 and 300 MeV
Five new sources were encountered in the RoI with Fermipy’s find_sources function in the energy range between 60 and 300 MeV. They are listed in Table 4. The best parameters for the power-law (Equation 1) used to model their spectra are also shown, together with their TS and position.
These might be spurious findings due to imperfections in the model.
| Source name | Index | Prefactor | TS | RA | Dec |
|---|---|---|---|---|---|
| PS J1639.52448 | 4.410-12 | 37 | 249.90 | ||
| PS J1750.62723 | 4.810-12 | 27 | 267.65 | ||
| PS J1753.72127 | 2.910-12 | 57 | 268.44 | ||
| PS J1820.52113 | 4.310-12 | 61 | 275.14 | ||
| PS J1835.01804† | 8.810-15 | 183 | 278.76 |
Appendix C Diagnostic plots for the universal model
We present the residual map, the TS maps with and without 4FGL J1745.62859 in the universal model created in the 100 MeV to 500 GeV energy range.
 |
 |
 |
References
- Abdo et al. (2010) Abdo, A. A., Ackermann, M., Ajello, M., et al. 2010, ApJS, 187, 460, doi: 10.1088/0067-0049/187/2/460
- Abdollahi et al. (2020) Abdollahi, S., Acero, F., Ackermann, M., et al. 2020, The Astrophysical Journal Supplement Series, 247, 33, doi: 10.3847/1538-4365/ab6bcb
- Abuter et al. (2019) Abuter, R., Amorim, A., Bauboeck, M., et al. 2019, arXiv e-prints, arXiv:1904.05721. https://arxiv.org/abs/1904.05721
- Acero et al. (2010) Acero, F., Aharonian, F., Akhperjanian, A. G., et al. 2010, MNRAS, 402, 1877, doi: 10.1111/j.1365-2966.2009.16014.x
- Acero et al. (2015) Acero, F., Ackermann, M., Ajello, M., et al. 2015, ApJS, 218, 23, doi: 10.1088/0067-0049/218/2/23
- Aharonian & Neronov (2005a) Aharonian, F., & Neronov, A. 2005a, ApJ, 619, 306, doi: 10.1086/426426
- Aharonian & Neronov (2005b) —. 2005b, Astrophysics and Space Science, 300, 255, doi: 10.1007/s10509-005-1209-4
- Aharonian et al. (2019) Aharonian, F., Yang, R., & de Oña Wilhelmi, E. 2019, Nature Astronomy, 3, 561, doi: 10.1038/s41550-019-0724-0
- Aharonian et al. (2004) Aharonian, F., Akhperjanian, A. G., Aye, K. M., et al. 2004, A&A, 425, L13, doi: 10.1051/0004-6361:200400055
- Aharonian et al. (2009) Aharonian, F., Akhperjanian, A. G., Anton, G., et al. 2009, A&A, 503, 817, doi: 10.1051/0004-6361/200811569
- Ahnen et al. (2017) Ahnen, M. L., Ansoldi, S., Antonelli, L. A., et al. 2017, A&A, 601, A33, doi: 10.1051/0004-6361/201629355
- Ajello et al. (2017) Ajello, M., Atwood, W. B., Baldini, L., et al. 2017, ApJS, 232, 18, doi: 10.3847/1538-4365/aa8221
- Atoyan & Dermer (2004) Atoyan, A., & Dermer, C. D. 2004, ApJ, 617, L123, doi: 10.1086/427390
- Atwood et al. (2013) Atwood, W., Albert, A., Baldini, L., et al. 2013, arXiv preprint arXiv:1303.3514
- Atwood et al. (2009) Atwood, W. B., Abdo, A. A., Ackermann, M., et al. 2009, ApJ, 697, 1071, doi: 10.1088/0004-637X/697/2/1071
- Baganoff et al. (2001) Baganoff, F. K., Bautz, M. W., Brandt, W. N., et al. 2001, Nature, 413, 45, doi: 10.1038/35092510
- Balick & Brown (1974) Balick, B., & Brown, R. L. 1974, ApJ, 194, 265, doi: 10.1086/153242
- Ball et al. (2016) Ball, D., Özel, F., Psaltis, D., & Chan, C.-k. 2016, ApJ, 826, 77, doi: 10.3847/0004-637X/826/1/77
- Ballantyne et al. (2011) Ballantyne, D. R., Schumann, M., & Ford, B. 2011, Monthly Notices of the Royal Astronomical Society, 410, 1521, doi: 10.1111/j.1365-2966.2010.17533.x
- Barrière et al. (2014) Barrière, N. M., Tomsick, J. A., Baganoff, F. K., et al. 2014, The Astrophysical Journal, 786, 46, doi: 10.1088/0004-637x/786/1/46
- Bednarek & Sobczak (2013) Bednarek, W., & Sobczak, T. 2013, Monthly Notices of the Royal Astronomical Society: Letters, 435, L14, doi: 10.1093/mnrasl/slt084
- Boehle et al. (2016) Boehle, A., Ghez, A. M., Schödel, R., et al. 2016, ApJ, 830, 17, doi: 10.3847/0004-637X/830/1/17
- Boyce et al. (2019) Boyce, H., Haggard, D., Witzel, G., et al. 2019, The Astrophysical Journal, 871, 161, doi: 10.3847/1538-4357/aaf71f
- Brinkerink et al. (2015) Brinkerink, C. D., Falcke, H., Law, C. J., et al. 2015, A&A, 576, A41, doi: 10.1051/0004-6361/201424783
- Cherenkov Telescope Array Consortium et al. (2019) Cherenkov Telescope Array Consortium, Acharya, B. S., Agudo, I., et al. 2019, Science with the Cherenkov Telescope Array, doi: 10.1142/10986
- Chernyakova et al. (2011) Chernyakova, M., Malyshev, D., Aharonian, F. A., Crocker, R. M., & Jones, D. I. 2011, ApJ, 726, 60, doi: 10.1088/0004-637X/726/2/60
- Clavel et al. (2013) Clavel, M., Terrier, R., Goldwurm, A., et al. 2013, A&A, 558, A32, doi: 10.1051/0004-6361/201321667
- Crocker et al. (2005) Crocker, R. M., Fatuzzo, M., Jokipii, J. R., Melia, F., & Volkas, R. R. 2005, ApJ, 622, 892, doi: 10.1086/427972
- de Angelis et al. (2018) de Angelis, A., Tatischeff, V., Grenier, I. A., et al. 2018, Journal of High Energy Astrophysics, 19, 1, doi: 10.1016/j.jheap.2018.07.001
- de Menezes et al. (2019) de Menezes, R., Cafardo, F., & Nemmen, R. 2019, Monthly Notices of the Royal Astronomical Society, 486, 851, doi: 10.1093/mnras/stz898
- de Menezes et al. (2020) de Menezes, R., Nemmen, R., Finke, J. D., Almeida, I., & Rani, B. 2020, Monthly Notices of the Royal Astronomical Society, 492, 4120, doi: 10.1093/mnras/staa083
- Di Mauro (2021) Di Mauro, M. 2021, arXiv e-prints, arXiv:2101.04694. https://arxiv.org/abs/2101.04694
- Do et al. (2013) Do, T., Lu, J. R., Ghez, A. M., et al. 2013, ApJ, 764, 154, doi: 10.1088/0004-637X/764/2/154
- Dodds-Eden et al. (2009) Dodds-Eden, K., Porquet, D., Trap, G., et al. 2009, ApJ, 698, 676, doi: 10.1088/0004-637X/698/1/676
- Eatough et al. (2013) Eatough, R. P., Falcke, H., Karuppusamy, R., et al. 2013, Nature, 501, 391, doi: 10.1038/nature12499
- Eckart et al. (2018) Eckart, A., Zajacek, M., Parsa, M., et al. 2018, arXiv e-prints, arXiv:1806.00284. https://arxiv.org/abs/1806.00284
- Eisenhauer et al. (2005) Eisenhauer, F., Genzel, R., Alexander, T., et al. 2005, The Astrophysical Journal, 628, 246, doi: 10.1086/430667
- Event Horizon Telescope Collaboration et al. (2019) Event Horizon Telescope Collaboration, Akiyama, K., Alberdi, A., et al. 2019, ApJ, 875, L1, doi: 10.3847/2041-8213/ab0ec7
- Fatuzzo & Melia (2012) Fatuzzo, M., & Melia, F. 2012, ApJ, 757, L16, doi: 10.1088/2041-8205/757/1/L16
- Fazio et al. (2018) Fazio, G. G., Hora, J. L., Witzel, G., et al. 2018, ApJ, 864, 58, doi: 10.3847/1538-4357/aad4a2
- Genzel et al. (2010) Genzel, R., Eisenhauer, F., & Gillessen, S. 2010, Reviews of Modern Physics, 82, 3121, doi: 10.1103/RevModPhys.82.3121
- Genzel et al. (2003) Genzel, R., Schödel, R., Ott, T., et al. 2003, Nature, 425, 934, doi: 10.1038/nature02065
- Ghez et al. (2004) Ghez, A. M., Wright, S. A., Matthews, K., et al. 2004, ApJ, 601, L159, doi: 10.1086/382024
- Ghez et al. (2008) Ghez, A. M., Salim, S., Weinberg, N. N., et al. 2008, ApJ, 689, 1044, doi: 10.1086/592738
- Gillessen et al. (2009) Gillessen, S., Eisenhauer, F., Trippe, S., et al. 2009, ApJ, 692, 1075, doi: 10.1088/0004-637X/692/2/1075
- Gravity Collaboration et al. (2018) Gravity Collaboration, Abuter, R., Amorim, A., et al. 2018, A&A, 618, L10, doi: 10.1051/0004-6361/201834294
- Guo & Mathews (2012) Guo, F., & Mathews, W. G. 2012, ApJ, 756, 181, doi: 10.1088/0004-637X/756/2/181
- Guo et al. (2013) Guo, Y.-Q., Yuan, Q., Liu, C., & Li, A.-F. 2013, Journal of Physics G Nuclear Physics, 40, 065201, doi: 10.1088/0954-3899/40/6/065201
- Heckman & Best (2014) Heckman, T. M., & Best, P. N. 2014, ARA&A, 52, 589, doi: 10.1146/annurev-astro-081913-035722
- HESS Collaboration et al. (2016) HESS Collaboration, Abramowski, A., Aharonian, F., et al. 2016, Nature, 531, 476, doi: 10.1038/nature17147
- Hinton & Aharonian (2007) Hinton, J. A., & Aharonian, F. A. 2007, ApJ, 657, 302, doi: 10.1086/510283
- Hooper & Goodenough (2011) Hooper, D., & Goodenough, L. 2011, Physics Letters B, 697, 412, doi: 10.1016/j.physletb.2011.02.029
- Hooper & Linden (2011) Hooper, D., & Linden, T. 2011, Phys. Rev. D, 84, 123005, doi: 10.1103/PhysRevD.84.123005
- Hora et al. (2014) Hora, J. L., Witzel, G., Ashby, M. L. N., et al. 2014, The Astrophysical Journal, 793, 120, doi: 10.1088/0004-637x/793/2/120
- Hornstein et al. (2007) Hornstein, S. D., Matthews, K., Ghez, A. M., et al. 2007, The Astrophysical Journal, 667, 900, doi: 10.1086/520762
- Kennea et al. (2013) Kennea, J. A., Burrows, D. N., Kouveliotou, C., et al. 2013, The Astrophysical Journal, 770, L24, doi: 10.1088/2041-8205/770/2/l24
- Khokhlov & Melia (1996) Khokhlov, A., & Melia, F. 1996, ApJ, 457, L61, doi: 10.1086/309895
- Kormendy & Richstone (1995) Kormendy, J., & Richstone, D. 1995, ARA&A, 33, 581, doi: 10.1146/annurev.aa.33.090195.003053
- Kusunose & Takahara (2012) Kusunose, M., & Takahara, F. 2012, ApJ, 748, 34, doi: 10.1088/0004-637X/748/1/34
- LaRosa et al. (2000) LaRosa, T. N., Kassim, N. E., Lazio, T. J. W., & Hyman, S. D. 2000, AJ, 119, 207, doi: 10.1086/301168
- Linden et al. (2012) Linden, T., Lovegrove, E., & Profumo, S. 2012, ApJ, 753, 41, doi: 10.1088/0004-637X/753/1/41
- Lynden-Bell (1969) Lynden-Bell, D. 1969, Nature, 223, 690, doi: 10.1038/223690a0
- Macquart et al. (2006) Macquart, J.-P., Bower, G. C., Wright, M. C. H., Backer, D. C., & Falcke, H. 2006, The Astrophysical Journal, 646, L111, doi: 10.1086/506932
- Malyshev et al. (2015) Malyshev, D., Chernyakova, M., Neronov, A., & Walter, R. 2015, A&A, 582, A11, doi: 10.1051/0004-6361/201526120
- Marrone et al. (2008) Marrone, D. P., Baganoff, F. K., Morris, M. R., et al. 2008, ApJ, 682, 373, doi: 10.1086/588806
- Mattox et al. (1996) Mattox, J. R., Bertsch, D. L., Chiang, J., et al. 1996, ApJ, 461, 396, doi: 10.1086/177068
- Mauerhan et al. (2005) Mauerhan, J. C., Morris, M., Walter, F., & Baganoff, F. K. 2005, ApJ, 623, L25, doi: 10.1086/429960
- McEnery et al. (2019) McEnery, J., van der Horst, A., Dominguez, A., et al. 2019, in Bulletin of the American Astronomical Society, Vol. 51, 245
- Mezger et al. (1989) Mezger, P. G., Zylka, R., Salter, C. J., et al. 1989, A&A, 209, 337
- Miyazaki et al. (2004) Miyazaki, A., Tsutsumi, T., & Tsuboi, M. 2004, The Astrophysical Journal, 611, L97, doi: 10.1086/424004
- Miyoshi et al. (1995) Miyoshi, M., Moran, J., Herrnstein, J., et al. 1995, Nature, 373, 127, doi: 10.1038/373127a0
- Mori et al. (2013) Mori, K., Gotthelf, E. V., Zhang, S., et al. 2013, The Astrophysical Journal, 770, L23, doi: 10.1088/2041-8205/770/2/l23
- Morris et al. (2012) Morris, M. R., Meyer, L., & Ghez, A. M. 2012, Research in Astronomy and Astrophysics, 12, 995, doi: 10.1088/1674-4527/12/8/007
- Narayan et al. (1995) Narayan, R., Yi, I., & Mahadevan, R. 1995, Nature, 374, 623, doi: 10.1038/374623a0
- Neilsen et al. (2013) Neilsen, J., Nowak, M. A., Gammie, C., et al. 2013, ApJ, 774, 42, doi: 10.1088/0004-637X/774/1/42
- Neilsen et al. (2015) Neilsen, J., Markoff, S., Nowak, M. A., et al. 2015, ApJ, 799, 199, doi: 10.1088/0004-637X/799/2/199
- Nolan et al. (2012) Nolan, P. L., Abdo, A. A., Ackermann, M., et al. 2012, ApJS, 199, 31, doi: 10.1088/0067-0049/199/2/31
- Nowak et al. (2012) Nowak, M. A., Neilsen, J., Markoff, S. B., et al. 2012, The Astrophysical Journal, 759, 95, doi: 10.1088/0004-637x/759/2/95
- Petrov et al. (2011) Petrov, L., Kovalev, Y. Y., Fomalont, E. B., & Gordon, D. 2011, AJ, 142, 35, doi: 10.1088/0004-6256/142/2/35
- Plambeck et al. (2014) Plambeck, R., Dexter, J., Bower, G. C., et al. 2014, Monthly Notices of the Royal Astronomical Society, 442, 2797, doi: 10.1093/mnras/stu1039
- Ponti et al. (2010) Ponti, G., Terrier, R., Goldwurm, A., Belanger, G., & Trap, G. 2010, ApJ, 714, 732, doi: 10.1088/0004-637X/714/1/732
- Ponti et al. (2015) Ponti, G., De Marco, B., Morris, M. R., et al. 2015, MNRAS, 454, 1525, doi: 10.1093/mnras/stv1537
- Ponti et al. (2017) Ponti, G., George, E., Scaringi, S., et al. 2017, Monthly Notices of the Royal Astronomical Society, 468, 2447, doi: 10.1093/mnras/stx596
- Quataert & Loeb (2005) Quataert, E., & Loeb, A. 2005, The Astrophysical Journal, 635, L45, doi: 10.1086/499126
- Robitaille (2019) Robitaille, T. 2019, APLpy v2.0: The Astronomical Plotting Library in Python, doi: 10.5281/zenodo.2567476. https://doi.org/10.5281/zenodo.2567476
- Robitaille & Bressert (2012) Robitaille, T., & Bressert, E. 2012, APLpy: Astronomical Plotting Library in Python, Astrophysics Source Code Library. http://ascl.net/1208.017
- Stone et al. (2016) Stone, J. M., Marrone, D. P., Dowell, C. D., et al. 2016, The Astrophysical Journal, 825, 32, doi: 10.3847/0004-637x/825/1/32
- Su et al. (2010) Su, M., Slatyer, T. R., & Finkbeiner, D. P. 2010, ApJ, 724, 1044, doi: 10.1088/0004-637X/724/2/1044
- Thompson & Beloborodov (2005) Thompson, C., & Beloborodov, A. M. 2005, ApJ, 634, 565, doi: 10.1086/432245
- von Fellenberg et al. (2018) von Fellenberg, S. D., Gillessen, S., Graciá-Carpio, J., et al. 2018, The Astrophysical Journal, 862, 129, doi: 10.3847/1538-4357/aacd4b
- Wang et al. (2006) Wang, Q. D., Lu, F. J., & Gotthelf, E. V. 2006, MNRAS, 367, 937, doi: 10.1111/j.1365-2966.2006.09998.x
- Wang et al. (2013) Wang, Q. D., Nowak, M. A., Markoff, S. B., et al. 2013, Science, 341, 981, doi: 10.1126/science.1240755
- Witzel et al. (2012) Witzel, G., Eckart, A., Bremer, M., et al. 2012, The Astrophysical Journal Supplement Series, 203, 18, doi: 10.1088/0067-0049/203/2/18
- Witzel et al. (2018) Witzel, G., Martinez, G., Hora, J., et al. 2018, The Astrophysical Journal, 863, 15, doi: 10.3847/1538-4357/aace62
- Wood et al. (2017) Wood, M., Caputo, R., Charles, E., et al. 2017, arXiv preprint arXiv:1707.09551
- Yang et al. (2018) Yang, H. Y., Ruszkowski, M., & Zweibel, E. 2018, Galaxies, 6, 29, doi: 10.3390/galaxies6010029
- Yuan & Narayan (2014) Yuan, F., & Narayan, R. 2014, ARA&A, 52, 529, doi: 10.1146/annurev-astro-082812-141003
- Yuan et al. (2003) Yuan, F., Quataert, E., & Narayan, R. 2003, ApJ, 598, 301, doi: 10.1086/378716
- Yusef-Zadeh & Morris (1987) Yusef-Zadeh, F., & Morris, M. 1987, ApJ, 320, 545, doi: 10.1086/165572
- Yusef-Zadeh et al. (2006) Yusef-Zadeh, F., Roberts, D., Wardle, M., Heinke, C. O., & Bower, G. C. 2006, ApJ, 650, 189, doi: 10.1086/506375
- Yusef-Zadeh et al. (2009) Yusef-Zadeh, F., Bushouse, H., Wardle, M., et al. 2009, ApJ, 706, 348, doi: 10.1088/0004-637X/706/1/348
- Zhao et al. (2003) Zhao, J.-H., Young, K. H., Herrnstein, R. M., et al. 2003, ApJ, 586, L29, doi: 10.1086/374581