A Comparison between Nuclear Ring Star Formation
in LIRGs and Normal Galaxies with the Very Large Array
Abstract
Nuclear rings are excellent laboratories for studying intense star formation. We present results from a study of nuclear star-forming rings in five nearby normal galaxies from the Star Formation in Radio Survey (SFRS) and four local LIRGs from the Great Observatories All-sky LIRG Survey (GOALS) at sub-kpc resolutions using VLA high-frequency radio continuum observations. We find that nuclear ring star formation (NRSF) contributes 49 - 60% of the total star formation of the LIRGs, compared to 7 - 40% for the normal galaxies. We characterize a total of 58 individual star-forming regions in these rings, and find that with measured sizes of 10 - 200 pc, NRSF regions in the LIRGs have SFR and up to 1.7 M⊙yr-1 and 402 M⊙yr-1kpc-2, respectively, which are about 10 times higher than NRSF regions in the normal galaxies with similar sizes, and comparable to lensed high- star-forming regions. At pc scales, we estimate low contributions () of thermal free-free emission to total radio continuum emission at 33 GHz in the NRSF regions in the LIRGs, but large variations possibly exist at smaller physical scales. Finally, using archival sub-kpc resolution CO (J=1-0) data of nuclear rings in the normal galaxies and NGC 7469 (LIRG), we find a large scatter in gas depletion times at similar molecular gas surface densities, which tentatively points to a multi-modal star formation relation on sub-kpc scales.
1 Introduction
At least one fifth of disk galaxies host star-forming nuclear rings
(Knapen, 2005). It is commonly accepted that nuclear rings result from a
non-axisymmetric gravitational potential in galaxy centers, which can be induced
by the presence of a stellar bar, strong spiral arms or tidal interaction
(e.g. Combes & Gerin, 1985; Shlosman et al., 1990; Athanassoula, 1994; Buta & Combes, 1996; Combes, 2001). Such
non-axisymmetry can drive large amounts of gas into the central region and
eventually develop a ring of dense gas and intense star formation (SF)
surrounding the galactic nucleus, likely at the location of the Inner Lindblad
Resonance (Kim & Stone, 2012; Li et al., 2015) or Nuclear Lindblad Resonance (Fukuda et al., 1998).
Optical and infrared (IR) studies of nuclear rings in nearby galaxies indicate
that they are prolific in producing young ( 100 Myr) and massive () star clusters in episodic starbursts
(e.g. Maoz et al., 1996; Buta et al., 2000; Maoz et al., 2001). With large reservoirs of dense gas
present, nuclear rings are predicted to be long-lived despite the enhanced
massive SF (Barreto et al., 1991; Regan & Teuben, 2003; Allard et al., 2006; Sarzi et al., 2007). Simulations have been used
to predict that even when subject to supernovae feedback, nuclear rings may
persist at Gyr timescales (Knapen et al., 1995; Seo & Kim, 2013, 2014). Therefore, nuclear rings
provide excellent opportunities to study extreme cases of SF in nearby systems.
As a result of long-lasting SF activity, nuclear rings can account for a
large fraction of the stellar mass and bolometric luminosity in their host
galaxies (e.g. Barreto et al., 1991; Genzel et al., 1995). In the process of secular evolution,
nuclear ring SF (NRSF) often emerges as galactic pseudo-bulges slowly assemble
from disk material (Kormendy & Kennicutt, 2004). Meanwhile, powerful NRSF has also been
seen in high-resolution observations of galaxy mergers
(e.g. Genzel et al., 1995; Knapen et al., 2004; Haan et al., 2013; Herrero-Illana et al., 2014), which is a
comparatively more dramatic evolutionary process. Simulations of galaxy mergers
have also proposed nuclear rings as a potential fueling mechanism of quasars
(Hopkins & Quataert, 2010). Therefore formation of nuclear rings may represent a common and
critical phase in galaxy evolution, and properties of NRSF may provide insights
into the key dynamical processes associated with various evolutionary paths.
While nuclear rings in nearby disk galaxies have been extensively
investigated in the optical and IR, studies of nuclear rings in galaxy
mergers are relatively scarce, making a consistent comparison of the two galaxy populations
difficult. Luminous and Ultra-luminous Infrared Galaxies (LIRGs:
; ULIRGs:
) in the local Universe,
which are often interacting or merging gas-rich spirals, have provided excellent
opportunities to study SF in mergers. However, heavy dust obscuration makes the
centers of these systems elusive at optical wavelengths (Sanders & Mirabel, 1996).
Meanwhile, measurements of the nuclei in U/LIRGs can still be heavily affected
by non-uniform dust extinction even in the IR
(Díaz-Santos et al., 2011; Piqueras López et al., 2013; U et al., 2019).
With the advancement of high-frequency radio interferometry, a highly
detailed, extinction-free view of the heavily obscured hearts of local LIRGs
becomes possible. In the present study, we make use of high-resolution (
100 pc) VLA observations to characterize and compare the SF properties of
nuclear rings hosted in five normal disk galaxies and four LIRGs in the local
Universe. Observations of these LIRGs are part of a new VLA campaign for
the Great Observatories All-sky LIRG Survey (GOALS; Armus et al., 2009) that
contains 68 local U/LIRGs, and the normal galaxies are observed with the Star
Formation in Radio Survey (SFRS; Murphy et al., 2012, 2018; Linden et al., 2020)
of 56 nearby normal star-forming disk galaxies. These two projects together provide a
direct, high-resolution comparison of SF activity in interacting and isolated
galaxies in the local Universe. In this paper, we focus on comparing properties
of NRSF observed in these two surveys using high-frequency radio continuum as an
extinction-free tracer. A full study of the nuclear SF properties in the GOALS
VLA campaign will be presented in a forthcoming paper.
This paper is divided into 7 sections. We present our sample selection,
observations and calibration procedures in Section 2 and
3. In Section 4, we describe the measurements
we perform to characterize the properties of the nuclear rings and the
individual NRSF regions, the results of which are presented in Section
5. In Section 6, we discuss the limitations and
implications of the results. Finally, Section 7 summarizes major
findings and conclusions.
Throughout this work we adopt km/s/Mpc,
and based on the
five-year WMAP result (Hinshaw et al., 2009). These parameters are used with the
3-attractor model (Mould et al., 2000) to calculate the luminosity distances
and physical scales of the LIRGs in the sample.
| Host | RA | Dec | Scale | Type | Survey | Morphology | Merger | |||
|---|---|---|---|---|---|---|---|---|---|---|
| (J2000) | (J2000) | (Mpc) | (pc/) | (%) | Stage | |||||
| (1) | (2) | (3) | (4) | (5) | (6) | (7) | (8) | (9) | (10) | (11) |
| NGC 1097 | 02h46m19.0s | -30d16m30s | 14.2 | 10.56 | 69 | LINER/Sy1 | - | SFRS | SBb | N∗ |
| IC 342 | 03h46m48.5s | +68d05m47s | 3.3 | 9.87 | 16 | HII | - | SFRS | SABcd | N |
| NGC 3351 | 10h43m57.7s | +11d42m14s | 9.3 | 9.77 | 45 | HII | - | SFRS | SBb | N |
| NGC 4321 | 12h22m54.8s | +15d49m19s | 14.3 | 10.33 | 70 | HII/LINER | - | SFRS | SABbc | N |
| NGC 4826 | 12h56m43.6s | +21d40m59s | 5.3 | 9.54 | 26 | LINER | - | SFRS | SAab | N |
| NGC 1614 | 04h33m59.8s | -08d34m44s | 67.8 | 11.65 | 323 | HII | 128 | GOALS | SBc pec | d |
| NGC 1797 | 05h07m44.9s | -08d01m09s | 63.4 | 11.04 | 303 | HII | 63 | GOALS | SBa pec | a |
| NGC 7469 | 23h03m15.6s | +08d52m26s | 70.8 | 11.58 | 332 | Sy1 | 246 | GOALS | SABa | a |
| NGC 7591 | 23h18m16.3s | +06d35m09s | 71.4 | 11.12 | 335 | LINER | 92 | GOALS | SBbc | N |
Note. — (1): Host galaxy of the nuclear ring. (2)&(3): coordinates of the host galaxy. (4): Distance to the host galaxy. For SFRS galaxies, we use redshift-independent distances reported in Kennicutt et al. (2011). For GOALS galaxies, we use luminosity distances reported in Armus et al. (2009) where they adopted the 3-attractor model (Mould et al., 2000). (5): Total infrared luminosity (8-1000m) of the host galaxy in Solar units (), calculated using distances from (4) and IRAS flux densities in Sanders et al. (2003) with recipes given in Sanders & Mirabel (1996). NGC 7469 is in a close interacting pair, so we use instead the value for the resolved major component from Howell et al. (2010). (6): Angular to physical scale conversion factor. For LIRGs, this is calculated using Ned Wright’s Cosmology Calculator (Wright, 2006) in combination with the 3-attractor model (Mould et al., 2000). (7): References for active type classification: NGC 1097: Phillips et al. (1984); Storchi-Bergmann et al. (1993); NGC 3351: Planesas et al. (1997); NGC 4321:Ho et al. (1997); NGC 4826: García-Burillo et al. (2003); NGC 1614: Herrero-Illana et al. (2017); NGC 1797:Balzano (1983); NGC 7469: Osterbrock & Martel (1993); NGC 7591: Pereira-Santaella et al. (2010). (8): AGN contribution to the bolometric luminosity of the host galaxy, estimated by Díaz-Santos et al. (2017) for the GOALS galaxies using five different mid-IR AGN diagnostics. AGN contribution to the bolometric light is expected to be negligible in the SFRS galaxies (e.g. Dale et al., 2009). (9): Survey with which nuclear ring observations were taken. (10): Morphology classification of the host galaxy from the NASA/IPAC Extragalactic Database (NED). (11): Merger stages for the GOALS galaxies are determined by Stierwalt et al. (2013) via visual inspection of the Spitzer IRAC 3.6m observations (N=non-merger, a=pre-merger, d=late-merger). Using the same criteria, we classify all SFRS galaxies as non-mergers, given the lack of massive neighbors in their proximity. ∗However, NGC 1097 is actively interacting with at least one dwarf companion (Bowen et al., 2016).
| Galaxy | Project ID | Band | Configuration | Beam | PA | Physical Resolutiona | |
|---|---|---|---|---|---|---|---|
| (∘) | (pc) | ||||||
| 11B-032 | Ka | D | 26.7 | 107 | 40.4 | ||
| NGC 1097 | 13B-215 | Ku | C | -7.6 | 69 | 20.0 | |
| 13B-215 | S | B | -27.4 | 125 | 46.3 | ||
| 11B-032 | Ka | D | -34.3 | 28 | 35.2 | ||
| IC 342 | 13B-215 | Ku | C | -9.5 | 18 | 15.1 | |
| 13B-215 | S | B | -0.8 | 28 | 38.5 | ||
| 11B-032, 13A-129 | Ka | D | 47.2 | 92 | 17.2 | ||
| NGC 3351 | 13B-215 | Ku | C | -17.5 | 75 | 14.1 | |
| 13B-215 | S | B | 43.6 | 79 | 17.2 | ||
| 13A-129 | Ka | D | 42.3 | 123 | 18.5 | ||
| NGC 4321 | 13B-215 | Ku | C | 17.0 | 82 | 9.7 | |
| 13B-215 | S | B | 30.6 | 120 | 15.0 | ||
| 13A-129 | Ka | D | 65.9 | 51 | 13.4 | ||
| NGC 4826 | 13B-215 | Ku | C | 61.3 | 34 | 10.4 | |
| 13B-215 | S | B | 67.3 | 45 | 14.0 | ||
| 14A-471, 16A-204 | Ka | A,C | 16.8 | 19 | 13.5 | ||
| NGC 1614 | 14A-471 | Ku | A,C | -0.4 | 36 | 18.8 | |
| 14A-471 | S | A,C | 26.8 | 178 | 12.3 | ||
| 14A-471 | Ka | C | 13.7 | 170 | 16.5 | ||
| NGC 1797 | 14A-471 | Ku | A,C | 15.6 | 36 | 10.0 | |
| 14A-471 | S | A,C | 7.6 | 164 | 19.4 | ||
| 14A-471 | Ka | C | 2.4 | 173 | 21.1 | ||
| NGC 7469 | 14A-471 | Ku | C | -30.8 | 372 | 13.5 | |
| 14A-471 | S | A,C | -43.4 | 166 | 40.2 | ||
| 14A-471 | Ka | C | -4.1 | 171 | 17.9 | ||
| NGC 7591 | 14A-471 | Ku | A,C | -17.6 | 37 | 9.4 | |
| 14A-471 | S | A,C | -50.7 | 181 | 27.9 |
Note. — The central frequencies for Ka, Ku and S bands are 33 GHz, 15 GHz, and 3 GHz respectively. The root-mean-square error was measured manually on each image before primary beam correction in an emission-free region. A and C configuration datasets are weighted with 100:1 (A:C) before combined imaging to account for differences in -plane distribution.
| Galaxy | Telescope | Project ID/Reference | Beam | PA | Physical Resolution a | |
|---|---|---|---|---|---|---|
| (∘) | (pc) | |||||
| NGC 1097 | ALMA | 2012.1.00001.S | 72.6 | 178 | 2.8 | |
| IC 342 | NRO10m | Ishizuki et al. (1990) | -31 | 36 | 3.5 | |
| NGC 3351 | ALMA | 2013.1.00885.S | 27.8 | 55 | 0.5 | |
| NGC 4321 | ALMA | 2015.1.00978.S | -31.0 | 156 | 0.4 | |
| ALMA | 2016.1.00972.S | |||||
| NGC 4826 | IRAM | Casasola et al. (2015) | 39.0 | 156 | 0.25 | |
| NGC 7469 | ALMA | 2013.1.00218.S | -48.8 | 169 | 0.2 |
Note. — For NGC 4321, we combined the measurement sets from two different ALMA projects to produce CO(J=1-0) moment 0 maps. For ALMA datasets, the root-mean-square error was measured manually on each continuum-subtracted line cube before primary beam correction in an emission-free region across all channels. For NGC 4826 and IC 342, were taken from the original references. ALMA datasets for NGC 1097 and NGC 4321 are unpublished. Dataset for NGC 3351 is published in Leaman et al. (2019), and dataset for NGC 7469 is published in Zaragoza-Cardiel et al. (2017) and Wilson et al. (2019).
2 Sample Selection
The GOALS “equatorial” VLA
campaign (Linden et al., 2019, ; Song et al. in prep) is a multi-frequency,
multi-resolution snapshot survey designed to map the brightest radio continuum
emission in all 68 U/LIRGs from GOALS that are within declination at Ka (33 GHz), Ku (15 GHz) and S (3 GHz) bands at kpc and
100 pc scales. These observations serve as a companion to SFRS, which
imaged 56 nearby ( Mpc) normal star-forming galaxies (i.e.
non-U/LIRGs) from SINGS (Kennicutt et al., 2003) and KINGFISH (Kennicutt et al., 2011) at
matched frequencies and also at both kpc (Murphy et al., 2012) and
100 pc scales (Murphy et al., 2018; Linden et al., 2020). Using the kpc resolution observations
from the GOALS equatorial survey, Linden et al. (2019) studied extra-nuclear star
formation in 25 local LIRGs, and concluded that the high global SFR of
these systems, relative to the Star Formation Main Sequence
(e.g. Elbaz et al., 2011; Speagle et al., 2014) occupied by normal galaxies in SFRS, must be
driven by extreme nuclear SF.
In this work we focus on studying and comparing star-forming
properties of nuclear rings at 100 pc scales in a sample of nine
galaxies from SFRS and GOALS. While the term “nuclear ring” is traditionally
reserved for rings forming at the Nuclear Lindblad Resonance (Fukuda et al., 1998), it
has also been more broadly used to describe the innermost star-forming rings in
galaxies (e.g. Böker et al., 2008). In this paper, we follow the definition and
size measurements given in a study of 113 nearby nuclear rings by
Comerón et al. (2010), and use “nuclear ring” to describe ring-like emission within
the central 2 kpc of a galaxy detected in our surveys at 3, 15 or 33 GHz in
radio continuum. With the exceptions of the rings in NGC 1797 and NGC 7591,
which are resolved for the first time with the GOALS equatorial survey, all other
rings reported here have previously been identified and separately studied as
“nuclear rings” at various wavelengths (e.g. Mazzuca et al., 2008; Comerón et al., 2010; Ma et al., 2018).
In some other studies, these rings have also been referred to as “circumnuclear
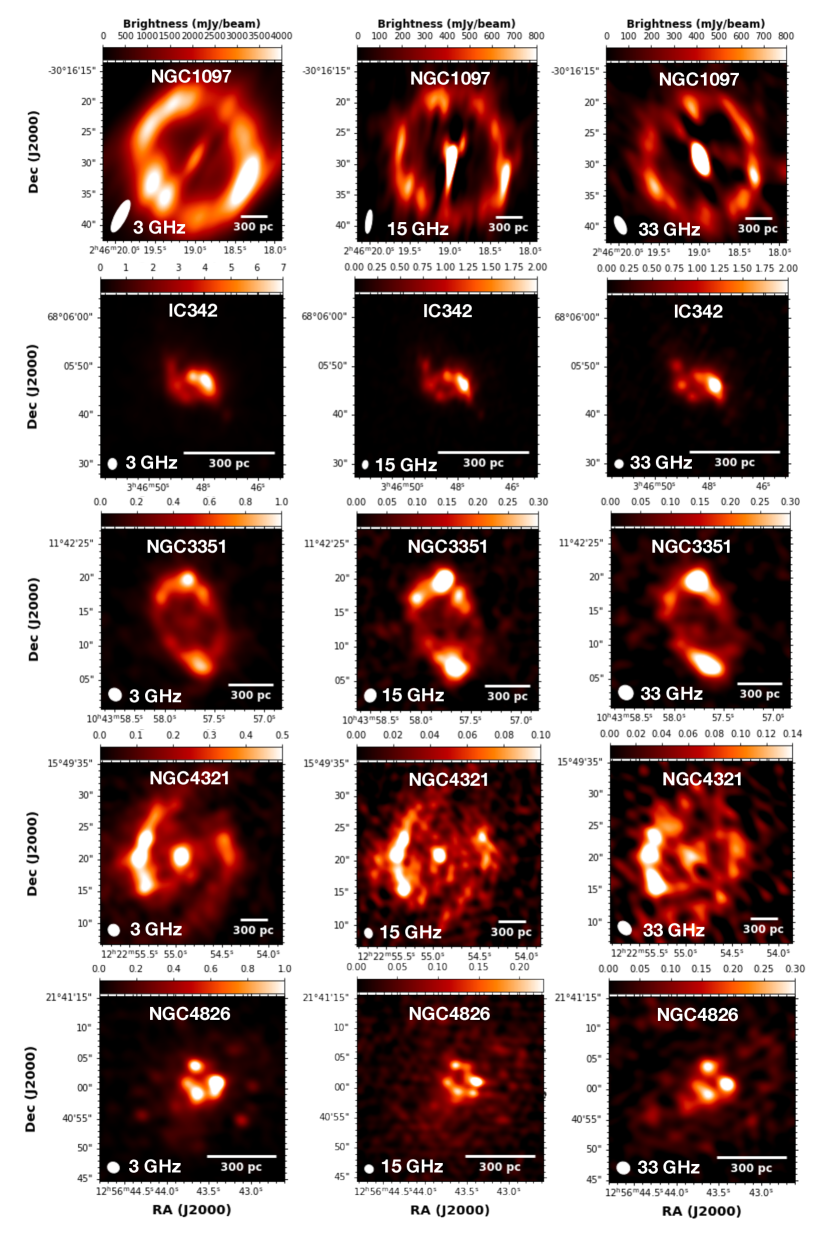
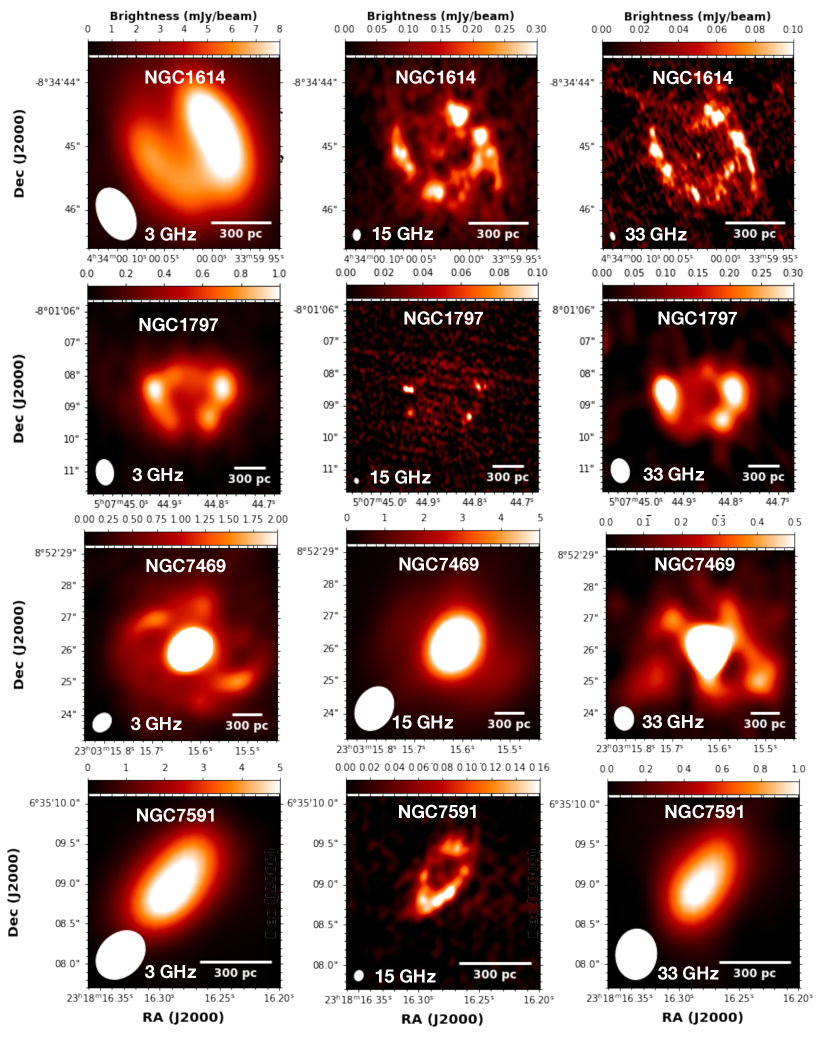
rings” (e.g. Xu et al., 2015; Prieto et al., 2019). Figure 1(a) and
1(b) show the VLA images of the sample, and Table 1
lists the basic properties of the host galaxies.
We note that due to the sensitivity limit of our VLA observations, we
were only able to identify the nine nuclear rings that show consistently bright
(mJy/beam) high-frequency (15 or 33 GHz) emission among the
combined total of 124 targets from SFRS and the GOALS equatorial survey. Several
other galaxies, such as NGC 1068 (LIRG) and NGC 5194 (normal), are also known
nuclear ring hosts from optical studies (e.g. Telesco & Decher, 1988; Laurikainen & Salo, 2002), but
their ring structures were not detected in our observations. We further discuss
the potential biases of the sample selection in Section 6.1.
3 Observations & Data Reduction
3.1 VLA data
Each galaxy was observed with the VLA at S (3 GHz), Ku (15 GHz) and Ka
Band (33 GHz). Observations of the five normal galaxies are acquired from the
SFRS. This survey observed all galaxies at S, Ku, and Ka Band in B, C and
D configuration, respectively, to achieve a common angular resolution of at each frequency. Details of SFRS observations and data calibration procedures are
described in Murphy et al. (2018) and Linden et al. (2020).
The four LIRGs were observed with both A () and C
() configurations at 3, 15 and 33 GHz. The observations
were carried out with projects VLA/14A-471 (PI: A. Evans) and VLA/16A-204 (PI:
S. Linden). The raw VLA datasets were first reduced and calibrated with the
standard calibration pipelines using the Common Astronomy Software Applications
(CASA, v4.7.0; McMullin et al., 2007). Each measurement set was visually
inspected and data related to bad antennas, time and frequency ranges (including
RFI) were manually flagged. The above two steps were repeated until all bad data
were removed.
Before imaging, we performed data combination on the reduced A and C
configuration measurement sets at each frequency using CASAv4.7.0 concat
task with a weighting scale of 100:1 (A:C). This was done to enhance the image
sensitivity while maximizing resolution, as well as maintaining good PSF shapes
(i.e. Gaussian-like), accounting for the fact that the uv-plane
distribution of C configuration data is 100 times denser than A
configuration. The concatenated measurement sets
were then imaged using CASAv4.7.0 tclean task, using Briggs weighting
with a robust parameter of 1.0 and (Multi-Scale) Multi-Frequency Synthesis
deconvolving algorithm.
Due to short on-source times, high resolution A configuration
imaging is unable to recover the nuclear ring emission at 33 GHz for NGC 1797
and NGC 7591, and at both 15 and 33 GHz For NGC 7469. Therefore, in these cases,
we use images made from C configuration measurement sets only, using the
same tclean parameters as above. Additionally, bright nuclear emission
in NGC 7469 allowed for self-calibration of the C Configuration data at 3, 15
and 33 GHz. Native resolution images of all data referred in this work are
displayed in Figure 1(a) and 1(b), and descriptions of
these images and extra information on individual sources are provided in
Appendix A. The characteristics of these images and
associated observation information are listed in Table
2.
3.2 Archival CO(J=1-0) Data
To better understand
the properties of star formation in nuclear rings, it is informative to study
the molecular environments that give rise to this activity. For each host galaxy
in the sample, we searched for archival CO(J=1-0) observations with resolutions
that are comparable to or higher than our VLA observations to directly compare
SF and cold molecular gas properties in its nuclear ring. Four galaxies in our
sample have publicly available archival ALMA data that meet the above criteria,
from ALMA projects 2012.1.00001.S (NGC 1097, PI: K. Sheth; unpublished),
2013.1.00885.S (NGC 3351, PI: K. Sandstrom; Leaman et al., 2019), 2015.1.00978.S
(NGC 4321, PI: K. Sandstrom; unpublished), 2016.1.00972.S (NGC 4321, PI: K.
Sandstrom; unpublished) and 2013.1.00218.S (NGC 7469, PI: T.
Izumi; Zaragoza-Cardiel et al., 2017; Wilson et al., 2019). Each ALMA dataset was first re-processed using the
appropriate CASA version and data calibration pipeline that are specified in the
project’s data calibration note from the archive. Continuum subtraction was
performed using the uvcontsub task in CASA (version consistent with
reduction pipeline). The reduced measurement sets were then re-imaged
using tclean in CASAv4.7.0, using Briggs weighting with robust
parameter of 0.5 and Högbom cleaning algorithm. For NGC 1097, because the
native angular resolution of the dataset is about four times higher than the VLA
data, we also tapered the uv-distribution of the measurement
sets with a 30 Gaussian kernel to better compare with the VLA data. We
then produced moment 0 maps from the continuum-subtracted CO(J=1-0) line cubes
using the immoments task in CASAv4.7.0.
Additionally, we downloaded high-resolution CO (J=1-0) moment 0 maps for
NGC 4826 (Casasola et al., 2015) and IC 342 (Ishizuki et al., 1990) from NED. The map for
NGC 4826 was observed by the IRAM Plateau de Bure Interferometer (PdBI), and
provided in units of M⊙ pc-2. We used information from Table 1 and
Equation 2 in Casasola et al. (2015) to convert the data to units of Jy/beam km/s.
The map for IC 342 was observed using the 10-m sub-millimeter telescope (NRO10m)
at Nobeyama Radio Observatory, and provided in units of Jy/beam m/s in B1950
coordinates. We used the imregrid task in CASA to re-map the datasets
to match the coordinates of our VLA data (J2000), after which we converted the
data to units of Jy/beam km/s.
Characteristics of these moment 0 maps are listed in
Table 3. In Section 4.3, we utilize these moment
0 maps to estimate the cold molecular gas densities and gas depletion times in
these six nuclear rings.


| Galaxy | (GHz) | (pc) | (pc) | (pc) | (mJy) | SFR(M⊙ yr-1) | (M⊙ yr-1 kpc-2) | SFRring/SFRtot(%) |
|---|---|---|---|---|---|---|---|---|
| (1) | (2) | (3) | (4) | (5) | (6) | (7) | (8) | (9) |
| NGC 1097 | 33 | 269 | 599 | 970 | 192.0 | 2.00.20 | 0.730.07 | 394 |
| IC 342 | 33 | - | 43 | 134 | 292.9 | 0.160.02 | 2.900.29 | 71 |
| NGC 3351 | 33 | 109 | 299 | 489 | 4.50.46 | 0.200.02 | 0.510.05 | 242 |
| NGC 4321 | 33 | 229 | 458 | 728 | 3.90.42 | 0.410.04 | 0.270.03 | 131 |
| NGC 4826 | 33 | - | 46 | 138 | 2.50.26 | 0.030.01 | 0.690.07 | 71 |
| NGC 1614 | 33 | 77 | 194 | 319 | 121.3 | 293.0 | 97 9.9 | 608 |
| NGC 1797 | 33 | - | 242 | 485 | 3.00.30 | 6.10.63 | 6.0 0.62 | 495 |
| NGC 7469 | 33 | 208 | 531 | 963 | 8.10.83 | 212.1 | 7.6 0.78 | 577 |
| NGC 7591 | 15 | 47 | 121 | 301 | 4.20.43 | 8.00.82 | 53 5.3 | 596 |
Note. — (1): Host galaxy of the nuclear ring. (2): Frequency at which sizes and SFR are measured. (3)-(5): inner, peak and outer radius of the ring, as defined in Section 4.1. Details on individual source are described in Appendix A.(6): Flux density enclosed by apertures with and . For NGC 4826, off-centered AGN emission is excluded. (7): Star formation rates calculated using Eq.5.1 and values from (6). (8): Star formation rate surface densities of each ring, calculated by dividing (7) over the area the ring extends. See Section 5.1 for details. (9): Fraction of the total SFR of the host galaxy in the nuclear ring. See Section 5.2 and Table 5 for details.
| Galaxy | SFRFUV | SFRIR | SFRtot |
|---|---|---|---|
| (M⊙ yr-1) | (M⊙ yr-1) | (M⊙ yr-1) | |
| (1) | (2) | (3) | (4) |
| NGC 1097 | 0.690.03 | 4.40.0 | 5.10.0 |
| IC 342 | 1.500.07 | 0.90.0 | 2.40.0 |
| NGC 3351 | 0.150.01 | 0.70.0 | 0.860.01 |
| NGC 4321 | 0.70.03 | 2.60.1 | 3.30.1 |
| NGC 4826 | 0.040.01 | 0.40.0 | 0.460.01 |
| NGC 1614 | 1.5∗ | 474.3 | 484 |
| NGC 1797 | -∗ | 120.4 | 120.4 |
| NGC 7469 | 1.70.0 | 373.0 | 393 |
| NGC 7591 | 0.40.1 | 130.3 | 140.3 |
Note. — (1): Host galaxy name. (2): Star formation rates derived from GALEX FUV flux measurements by Clark et al. (2018), Howell et al. (2010) and Brown et al. (2014), using Eq.(3).∗GALEX measurements are not available for NGC 1614 and NGC 1797. For NGC 1614, we use monochromatic UV SFR from U et al. (2012) scaled down by a factor of two as an estimate for FUV SFR. (3): Star formation rates derived from total IR luminosity, accounting for AGN contribution to the bolometric luminosity of the LIRGs (Table 1), using Eq.5. (4): Total star formation rates of the host galaxy. See Section 5.2 for more details.
4 Data Analysis
Here we mainly use the 33 GHz continuum images for our analysis of the nuclear rings and individual NRSF regions because radio continuum emission above 30 GHz has been shown to effectively trace thermal free-free emission associated with ongoing massive SF in both normal galaxies and LIRGs (e.g. Murphy et al., 2012; Linden et al., 2019, 2020). For NGC 7591, we use the 15 GHz image instead because the available 33 GHz image does not resolve the ring structure.
4.1 Integrated ring measurements
To measure the integrated ring properties, we first quantify the spatial
extent of each ring by defining an inner, peak, and outer radius/semi-major axis
(, , ) based on
its azimuthally-averaged light profile, as shown in Figure 4.
These light profiles are measured from the central coordinates of the host
galaxies using 1-pixel wide circular annuli. Elliptical annuli are used for highly
elliptical rings (NGC 3351, NGC 1797, NGC 7591). Details on the relevant
procedures are provided in Appendix B. In general, we
locate at the first local minimum of the light profile, and
define at the local maximum outside of . To
account for diffuse emission from the ring that is not necessarily
axis-symmetric, we define to be where the averaged light
profile flattens towards the image noise level (i.e. in
Table 2). An exception to this is NGC 4826, whose averaged
light profile contains contribution from a faint spiral structure that surrounds
the ring, which we exclude from further analysis by setting at
the local minimum immediately outside . Due to the limited
resolution of the observations, light profiles of IC 342, NGC 4826 and NGC 1797
do not yield a well defined local minimum, therefore we do not use
for rings in these three galaxies. See Appendix
A for more details on individual sources.
The flux of each ring is then measured within the area characterized by
and via aperture photometry. For NGC 4826, a
LINER AGN likely contributes to the ring emission due to perturbation
(García-Burillo et al., 2003), therefore we additionally mask the image at the reported AGN
location (12h56m43.64s, 21d40m
59.30s) with a beam-sized aperture before performing aperture photometry. In
Figure 4, we also mark the locations of known AGN with
“+”. We do not find similar cases of AGN emission contributing to the nuclear
ring in the rest of the sample.
4.2 NRSF Region identification & measurements
Given
the high resolution of our VLA observations, all nine nuclear rings are resolved at
sub-kpc scales at 33 GHz or 15 GHz, thus allowing us to further characterize the
properties of individual star-forming regions in these rings.
To identify and measure the flux of individual NRSF regions in each
nuclear ring, we use the software Astrodendro (Robitaille et al., 2019),
which measures hierarchical structures in an astronomical image using
dendrograms. Astrodendro identifies and categorizes structures in an
image into trunk, branch and leaf, based on three
input parameters: the minimum brightness required for a structure to be
physically meaningful (min_value), the minimum number of pixels in a
structure (min_npix), and the minimum brightness relative to the local
background required for a structure to be considered independent
(min_delta). Structures identified as leaf are of the highest
hierarchical order, which are the individual NRSF regions that we are interested
in, while branch and trunk are the less luminous diffuse ring
emission connecting the SF regions. Therefore here we only focus on the derived
properties of leaf structures.
We run Astrodendro on the 33 GHz image of each nuclear ring (15
GHz for NGC 7591) with min_value and
min_delta= to identify physically meaningful
leaf structures, where is the rms noise measured
in an emission-free region of the image before primary beam correction (see
Table 2). We set min_npix to be 1/4 the area of the
synthesized beam, to avoid identifying noise spikes yet allowing detection of
small, unresolved regions. Afterwards, we manually eliminate regions identified
beyond the outer radius () of the ring, to ensure we only
include NRSF regions or nuclei in subsequent analyses. Figure
5 shows all the identified regions using
Astrodendro. We note that varying min_npix by small
amounts does not significantly alter the population of identified leaf
structures. For example, setting min_npix to be 1/2 or 3/4 of the
beam area only blends together Region 1 and 3 in NGC 1797, and Region 3 and 6 in
NGC 7469, and the rest of region
identification remains exactly the same, in terms of numbers, sizes and shapes.
The flux density and angular area of each identified region are also
measured by Astrodendro, which can be heavily dependent on the
signal-to-noise level of the region. To characterize the effect of image noise
on the region size and flux measurements, we use a Monte Carlo method and
re-run Astrodendro 1000 times randomly adjusting the brightness of each pixel
sampling from a Gaussian distribution defined by the rms noise
and the assumed VLA flux calibration error ( 10%).
The standard deviations of the results from the 1000 runs are used to quantify
the uncertainties in the flux and size measurements. For unresolved
regions that have Astrodendro-measured sizes smaller than the beam areas after accounting
for uncertainties, we instead measure their flux using beam-sized apertures and
use the beam areas as upper-limits for their sizes.
Additionally, to estimate the ratio of thermal free-free emission to
total radio continuum emission in these NRSF regions at 33 GHz, we measure radio
spectral index between 15 and 33 GHz associated with each region. To do so, we
smooth and regrid the native resolution 15 GHz and 33 GHz images of each nuclear
ring (shown in Figure 1(a) and 1(b)) to a common
circular beam and pixel scale for consistent measurements of flux densities
across the two frequencies. Assuming a single power-law model representing the
combination of flat-spectrum thermal emission and steep-spectrum non-thermal
emission , we can calculate the spectral index
associated with each region by measuring the linear slope between flux densities
measured at 15 and 33 GHz with respect to frequency. Due to the coarser
resolutions of the beam-matched images, the exact region areas identified with
Astrodendro using native resolution images cannot be used here to
extract spectral indices. As an approximation, for each region we measure its
beam-matched 15 and 33 GHz flux using a common circular aperture with area
equivalent to the region size as measured by Astrodendro. For regions
with sizes smaller than the matched circular beams, we instead use beam-sized
apertures to extract their associated spectral indices. Uncertainties in the spectral indices
are calculated with error propagation.
4.3 Measurements of CO(J=1-0) maps
For the six galaxies that have high-resolution ancillary CO(J=1-0) data (see Section 3.2), we smooth and regrid the native resolution CO (J=1-0) moment 0 map and 33 GHz radio continuum map of the nuclear ring to a common circular beam and pixel scale for consistent flux measurements. We measure the total CO (J=1-0) and 33 GHz continuum flux of each ring using apertures defined by and (See Section 4.1). These values are used to derive the integrated molecular gas mass, average surface densities and gas depletion times in the ring in Section 5.5. For individual NRSF regions, we measure the CO (J=1-0) and 33 GHz flux using circular apertures with area equivalent to the region size as measured by Astrodendro. For regions with sizes smaller than the matched circular beams, we use beam-sized apertures instead.
5 Results
Here we describe the results of the above measurements and further derive SFR, SFR surface density and gas depletion time for each ring as a whole, as well as for individual NRSF regions identified using Astrodendro. We also use the measured 15 – 33 GHz spectral index to derive the ratio of thermal free-free emission to total radio emission at 33 GHz associated with each NRSF regions. The measured and derived quantities for the nuclear rings are summarized in Table 4, and the ones for individual NRSF regions are reported in Table 6. In total, 63 regions are identified and measured with Astrodendro, as shown in Figure 5, including 58 NRSF regions (22 in normal galaxies, and 35 in LIRGs) and 5 nuclei (4 known AGN and 1 nuclear starburst). For completeness, in Table 6 we report measurements for all 63 identified regions, but only the 58 NRSF regions are included in the final analysis.
5.1 Ring size, SFR & SFR surface density
We use , defined in Section 4.1, as an
estimate for the radius/semi-major axis of the ring. The five nuclear rings in
the sample of normal galaxies have radii of 43 – 599 pc, and the four
nuclear rings in the LIRGs have radii of 121 – 531 pc.
Using flux measured with and , we can
calculate the integrated SFR within each ring using Equation 10 in
Murphy et al. (2012):
| (1) |
where a Kroupa Initial Mass Function (IMF) is assumed. In this equation,
is the spectral luminosity at the observed frequency , given by , where is the measured total flux of the ring in
Jy, is the luminosity distance of the host galaxy (column 4 in Table
1), is the electron temperature and
is the non-thermal spectral index. Here we adopt K and
, which have been extensively used to describe SF
regions in normal galaxies and LIRGs
(e.g. Murphy et al., 2012; Linden et al., 2019, 2020).
The integrated SFR has a range of 0.03 – 2.0 and 6.1 – 29 M⊙
yr-1 for rings in the normal galaxies and in the LIRGs, respectively. For
the normal galaxies, the estimated nuclear ring radii and SFR are in agreement
with previous measurements of the same galaxies at optical and IR wavelengths
(e.g. Mazzuca et al., 2008; Comerón et al., 2010; Hsieh et al., 2011; Ma et al., 2018). Only a handful of similar
measurements exist for the nuclear rings hosted in LIRGs because they are
farther away and more obscured by dust. Our radio measurement is also consistent
with extinction-corrected Pa measurement for the nuclear ring in NGC
1614 by Alonso-Herrero et al. (2001), which confirms the effectiveness of using
high-frequency radio continuum as extinction-free SFR tracer in these nuclear
rings.
We further calculate the average SFR surface density,
, in each ring, by dividing the integrated SFR over the area
of the ring as defined in Figure 4, with
and . For rings with undefined due to lack of
resolution, we use the areas defined by their minus the areas
of the synthesized beams (Table 2) to account for the central
cavities. The resulted range of is 0.27 – 2.90 M⊙
yr-1 kpc-2 for nuclear rings in the normal galaxies, with a median
value of 0.590.21 M⊙ yr-1 kpc-2. For rings in the LIRGs,
is higher by at least a factor of two, with a range of 6.0 –
97 M⊙ yr-1 kpc-2 and a median of 3022 M⊙
yr-1 kpc-2.
5.2 Ring SFR vs. Host SFR
Here we estimate the fraction of total SFR of the host galaxy contributed by the nuclear ring. The relevant results are tabulated in Table 4 and 5. The total SFR of the galaxy is calculated from both FUV and IR emission to account for obscured and unobscured SF (Murphy et al., 2012):
| (2) |
To calculate , we use GALEX FUV measurements from Clark et al. (2018) for the normal galaxies and from Howell et al. (2010) and Brown et al. (2014) for the LIRGs, along with Equation (2) from Murphy et al. (2012) assuming Kroupa IMF:
| (3) |
No GALEX FUV measurements are available for NGC 1614 and NGC 1797. For NGC 1614, SFR based on monochromatic UV measurement (Å) is available from U et al. (2012). Due to the different calibrations adopted, UV SFR from U et al. (2012) are consistently higher than values estimated using FUV measurements from Howell et al. (2010) among U/LIRGs studied in both works, by at least a factor of two. Therefore, for NGC 1614, here we adopt the SFR reported in U et al. (2012), but scaled down by a factor of two as an estimate for its FUV SFR. The FUV contribution to the total SFR is overall very low ( 4%) in local U/LIRGs (Howell et al., 2010) therefore does not affect our estimates significantly. For the IR component, we applied from Table 1 to Equation (15) in Murphy et al. (2012), modified to account for AGN emission:
| (4) | ||||
| (5) |
where is the fraction of the bolometric luminosity of the host galaxy contributed by AGN emission (see Table 1 and Díaz-Santos et al., 2017). Because the above relations presented in Murphy et al. (2012) are calibrated against 33 GHz measurements, we can directly estimate the fraction of total SFR contributed by the nuclear ring by dividing the ring SFR, derived in the last Section, over SFRtot. The fractions are 7% – 39% for rings in the normal galaxies, and 49 – 60% for rings in the LIRGs, with median values of 129% and 56%6%, respectively. We visualize this result in Figure 8 and discuss its implication in Section 6.2. For NGC 1614, a similar fraction has also been estimated by Xu et al. (2015). Even though measurements are made at 15 GHz for NGC 7591, we do not expect new measurements at 33 GHz to significantly alter our result.
5.3 Region size, SFR and SFR surface density
For each identified NRSF region, we calculate its SFR and using the flux density and area measured in Section 4.2, along with Equation 5.1. For regions smaller than the beam areas accounting for uncertainties (i.e. unresolved), calculated here are lower-limits. To compare the region size with values from the literature, we compute and report the effective radius , which has a range of 16 – 184 pc for the 22 NRSF regions in the normal galaxies and 13 – 221 pc for the 35 NRSF regions in the LIRGs. Regions in the normal galaxies have SFR of 0.01 – 0.21 M⊙yr-1, with a median of 0.040.03 M⊙yr-1. Regions in the LIRGs have SFR of 0.08 – 1.7 M⊙yr-1, with a median of 0.250.12 M⊙yr-1. Consequently, for regions in the LIRGs ranges from 7 – 402 M⊙yr-1kpc-2 with a median of 19778 M⊙yr-1kpc-2, about an order of magnitude higher compared to regions in the normal galaxies, whose ranges from 0.4 – 9.2 M⊙yr-1kpc-2 with a median of 1.40.9 M⊙yr-1kpc-2. We discuss the potential effect of resolution on the results in Section 6.3.
5.4 Thermal Fractions at 33 GHz
Radio
continuum captures both non-thermal synchrotron emission of cosmic ray electrons
accelerated by supernovae, and thermal free-free emission associated with HII
regions of massive stars ( 10 Myr). At high radio frequencies, radio
emission has been directly related to ionizing photon produced by young massive
stars (Murphy et al., 2012), with thermal fractions (i.e. ratio of thermal free-free
emission to total radio continuum emission) % at 33 GHz in
individual star-forming regions in nearby spiral galaxies (Linden et al., 2020).
However, it has been shown that even at 33 GHz, radio continuum emission in
local U/LIRGs may be largely non-thermal, due to dust absorption of ionizing
photons (Barcos-Muñoz et al., 2015, 2017).
To understand what is driving the 33 GHz radio continuum
emission in our sample of nuclear rings on sub-kpc scales, we estimate thermal fractions at 33
GHz, , using spectral index measured between 15 and 33 GHz (see
Section 4.2), and Equation (11) from Murphy et al. (2012):
| (6) |
where is the spectral index measured between and (33
and 15 GHz), and is the non-thermal spectral index.
Almost all regions have within uncertainties, therefore
we adopt for our calculations following
Murphy et al. (2012). Out of the total 58 NRSF regions, three have , which means their radio continuum spectra between 15 and 33 GHz are
steeper than the typical non-thermal spectrum. In these cases we set
based on previous measurements of the maximum
dispersion of non-thermal spectral index given by
(Niklas et al., 1997; Murphy et al., 2011, 2012).
Additionally, three NRSF regions have , in which cases we
set to 100%, assuming the spectral flattening is caused by
increasing thermal fraction. Alternatively, it may have originated from
flattening or anomalous microwave emission
(e.g. Dickinson et al., 2018), which will require future
matched-resolution observations at more than two radio frequencies to confirm.
Here we use only 15 and 33 GHz images to estimate
because 3 GHz observations from the GOALS equatorial survey do not resolve the
ring structures except for in NGC 7469. Linden et al. (2020) observed similar
spectral steepness at 3 – 33 GHz and 15 – 33 GHz for the full SFRS sample,
therefore we do not expect to overestimate 33 GHz thermal fractions in NRSF
regions in the normal galaxies by using only 15 and 33 GHz measurements.
However, in a study of extra-nuclear SF regions in local LIRGs, Linden et al. (2019)
observed steeper spectral profile at 3 – 33 GHz compared to 15 – 33 GHz on kpc
scales. Therefore the thermal fractions estimated at 33 GHz for the
sample of NRSF regions in LIRGs may be higher than reported here when
matched-resolution observations at 3 GHz are included, despite that we did not
observe significant spectral flattening at 15 – 33 GHz compared to 3 – 33 GHz
in NGC 7469.
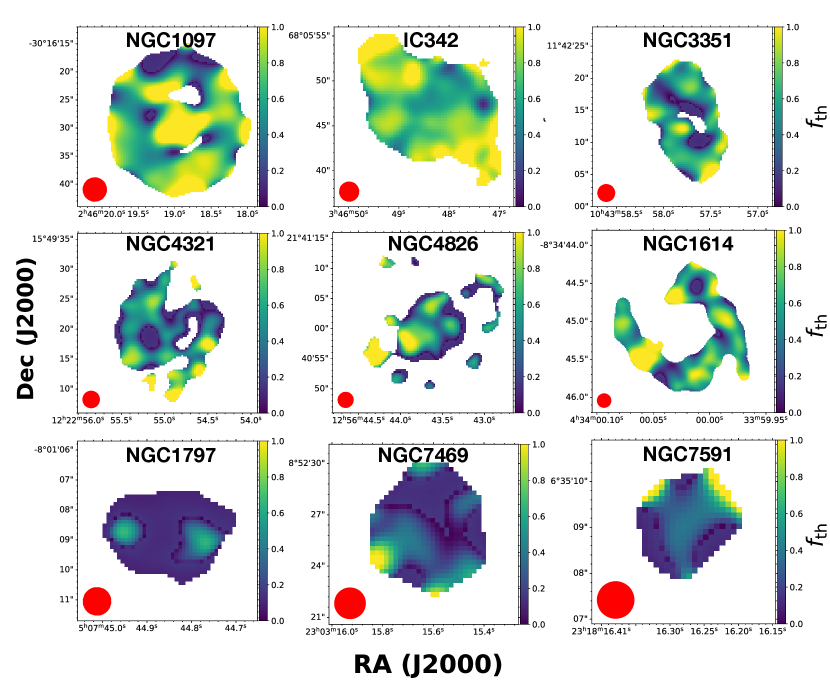
To better visualize the free-free emission distribution in these rings,
we additionally construct pixel-by-pixel maps of , as shown in
Figure 6. We mask all values below 5 for
15 and 33 GHz beam-matched images to ensure reliable outputs, after which we
calculate and at each pixel. These maps show
significant spatial variation in the distribution of thermal emission in these
nuclear rings, with areas of high mostly corresponding to the
identified NRSF regions. Variations in on scales smaller than
the matched beams are highly correlated and therefore not physically
significant.
The estimated has a range of 35 – 100% and 4 – 100%
for NRSF regions in the normal galaxies and in the LIRGs, respectively. We note
that low resolution ( 06 or 200pc) 15 and 33 GHz images were used to
calculate for NGC 1797, NGC 7469 and NGC 7591 because the high
resolution images do not have strong enough detection for robust measurements.
This means that the physical scales at which are measured are
2-5 times larger than the spatial extent of the identified regions,
likely including areas with little SF or diffuse non-thermal emission
(i.e. cosmic rays accelerated by supernovae). This can skew
towards lower values, and therefore values reported in Table 6
may be interpreted as lower-limits. We further discuss the implications of these
results in Section 6.5.
| Galaxy | (GHz) | ID | Sν(mJy) | (pc) | SFR(M⊙ yr-1) | (M⊙yr-1kpc-2) | (%) | Nucleus | |
|---|---|---|---|---|---|---|---|---|---|
| (1) | (2) | (3) | (4) | (5) | (6) | (7) | (8) | (9) | (10) |
| NGC 1097 | 33 | 1 | 0.920.12 | 14222 | 0.100.01 | 1.50.1 | -0.180.23 | 9124 | |
| .. | 33 | 2 | 0.850.16 | 11725 | 0.090.02 | 2.00.1 | -0.250.22 | 8424 | |
| .. | 33 | 3 | 2.000.25 | 18427 | 0.210.03 | 1.90.1 | -0.440.20 | 6226 | |
| .. | 33 | 4 | 1.090.08 | 12312 | 0.110.01 | 2.40.1 | -0.500.21 | 5428 | |
| .. | 33 | 5 | 3.480.04 | 1636 | N/A | N/A | -0.020.19 | 10017 | AGN |
| .. | 33 | 6 | 0.640.11 | 11321 | 0.070.01 | 1.60.1 | -0.520.23 | 5132 | |
| .. | 33 | 7 | 0.890.60 | 12185 | 0.090.06 | 2.00.5 | -0.320.23 | 7727 | |
| .. | 33 | 8 | 0.420.07 | 10418 | 0.040.01 | 1.30.1 | -0.050.30 | 10028 | |
| .. | 33 | 9 | 1.400.08 | 16414 | 0.150.01 | 1.70.1 | -0.400.21 | 6626 | |
| IC 342 | 33 | 1 | 12.30.42 | 493 | 0.070.01 | 9.20.2 | -0.330.18 | 7521 | |
| .. | 33 | 2 | 0.860.12 | 163 | 0.010.01 | 5.90.3 | -0.360.19 | 7223 | |
| .. | 33 | 3 | 2.100.25 | 233 | 0.010.01 | 6.80.3 | -0.270.18 | 8220 | |
| .. | 33 | 4 | 0.860.12 | 173 | 0.010.01 | 5.40.3 | -0.200.19 | 9020 | |
| NGC 3351 | 33 | 1 | 1.500.07 | 16715 | 0.070.01 | 0.780.02 | -0.440.19 | 6224 | |
| .. | 33 | 2 | 0.190.04 | 5813 | 0.010.01 | 0.820.06 | -0.620.22 | 3733 | |
| .. | 33 | 3 | 1.200.05 | 1188 | 0.050.01 | 1.20.1 | -0.430.18 | 6224 | |
| NGC 4321 | 33 | 1 | 0.060.01 | 72 | 0.010.01 | 0.42 | -0.300.35 | 7940 | |
| .. | 33 | 2 | 0.330.03 | 11915 | 0.040.01 | 0.790.04 | -0.350.21 | 7325 | |
| .. | 33 | 3 | 0.200.04 | 11026 | N/A | N/A | -0.630.24 | 3536 | AGN |
| .. | 33 | 4 | 0.170.03 | 8517 | 0.020.01 | 0.800.06 | -0.520.22 | 5131 | |
| .. | 33 | 5 | 0.090.03 | 7725 | 0.010.01 | 0.510.06 | -0.610.29 | 3842 | |
| .. | 33 | 6 | 0.110.03 | 6819 | 0.010.01 | 0.780.07 | -0.470.23 | 5731 | |
| NGC 4826 | 33 | 1 | 0.470.05 | 446 | N/A | N/A | -0.470.19 | 5826 | AGN |
| .. | 33 | 2 | 0.440.03 | 404 | 0.010.01 | 1.30.1 | -0.510.19 | 5326 | |
| .. | 33 | 3 | 0.340.03 | 384 | 0.010.01 | 1.10.1 | -0.300.21 | 7824 | |
| NGC 1614 | 33 | 1 | 0.270.03 | 274 | 0.650.07 | 27547 | -0.550.31 | 4744 | |
| .. | 33 | 2 | 0.060.01 | 153 | 0.140.03 | 21368 | -0.380.39 | 6848 | |
| .. | 33 | 3 | 0.050.04 | 149 | 0.130.08 | 208193 | -0.310.38 | 7744 | |
| .. | 33 | 4 | 0.040.01 | 14 | 0.100.03 | 149 | -0.790.36 | 1060 | |
| .. | 33 | 5 | 0.080.02 | 185 | 0.200.06 | 20483 | -0.280.44 | 8150 | |
| .. | 33 | 6 | 0.170.19 | 2226 | 0.410.45 | 266433 | -0.070.30 | 10029 | |
| .. | 33 | 7 | 0.080.02 | 165 | 0.190.06 | 241110 | -0.330.34 | 7639 | |
| .. | 33 | 8 | 0.080.02 | 164 | 0.190.04 | 24988 | -0.430.32 | 6340 | |
| .. | 33 | 9 | 0.030.02 | 14 | 0.080.03 | 136 | -0.740.34 | 1855 | |
| .. | 33 | 10 | 0.100.06 | 1610 | 0.250.15 | 306277 | -0.390.33 | 6741 | |
| .. | 33 | 11 | 0.040.01 | 14 | 0.090.03 | 135 | -0.850.57 | 1586 | Starburst |
| .. | 33 | 12 | 0.060.01 | 14 | 0.150.03 | 241 | -0.460.29 | 5938 | |
| .. | 33 | 13 | 0.200.03 | 224 | 0.480.08 | 31182 | -0.270.30 | 8233 | |
| .. | 33 | 14 | 0.150.03 | 186 | 0.360.07 | 32794 | -0.360.28 | 7134 | |
| .. | 33 | 15 | 0.450.07 | 314 | 1.10.16 | 36685 | -0.260.25 | 8327 | |
| .. | 33 | 16 | 0.120.02 | 193 | 0.280.05 | 23666 | -0.450.40 | 6052 | |
| .. | 33 | 17 | 0.040.01 | 134 | 0.100.03 | 19783 | -0.030.43 | 10040 | |
| .. | 33 | 18 | 0.070.02 | 176 | 0.170.06 | 207103 | -0.360.33 | 7140 | |
| .. | 33 | 19 | 0.100.03 | 144 | 0.250.06 | 402150 | -0.890.24 | 1534 | |
| .. | 33 | 20 | 0.090.02 | 14 | 0.210.04 | 326 | -0.800.24 | 841 | |
| .. | 33 | 21 | 0.160.03 | 194 | 0.380.07 | 31692 | -0.550.27 | 4738 | |
| NGC 1797 | 33 | 1 | 0.180.02 | 100 | 0.380.05 | 12 | -0.780.21 | 1135 | |
| .. | 33 | 2 | 0.680.03 | 19412 | 1.40.05 | 121 | -0.670.19 | 2830 | |
| .. | 33 | 3 | 0.350.04 | 12617 | 0.730.08 | 143 | -0.680.20 | 2832 | |
| .. | 33 | 4 | 0.110.02 | 99 | 0.230.04 | 7.4 | -1.190.22 | 1226 | |
| NGC 7469 | 33 | 1 | 0.640.11 | 22145 | 1.70.29 | 113 | -0.570.18 | 4327 | |
| .. | 33 | 2 | 0.600.07 | 15724 | 1.60.19 | 204 | -0.790.18 | 1031 | |
| .. | 33 | 3 | 6.060.20 | 26830 | N/A | N/A | -0.740.18 | 1929 | AGN |
| .. | 33 | 4 | 0.170.04 | 9023 | 0.450.11 | 186 | -0.830.18 | 432 | |
| .. | 33 | 5 | 0.240.04 | 9620 | 0.610.11 | 216 | -0.740.18 | 1730 | |
| .. | 33 | 6 | 0.190.03 | 95 | 0.490.07 | 17 | -0.880.18 | 1527 | |
| NGC 7591 | 15 | 1 | 0.140.03 | 215 | 0.270.07 | 19769 | -0.640.18 | 3427 | |
| .. | 15 | 2 | 0.120.04 | 217 | 0.220.07 | 16577 | -0.660.18 | 3028 | |
| .. | 15 | 3 | 0.120.02 | 195 | 0.220.05 | 19763 | -0.630.18 | 3527 | |
| .. | 15 | 4 | 0.090.02 | 195 | 0.170.04 | 13946 | -0.650.18 | 3228 | |
| .. | 15 | 5 | 0.050.01 | 185 | N/A | N/A | -0.630.18 | 3527 | AGN |
| .. | 15 | 6 | 0.110.02 | 226 | 0.210.04 | 13043 | -0.630.18 | 3527 | |
| .. | 15 | 7 | 0.400.24 | 4630 | 0.760.47 | 115103 | -0.640.18 | 3428 |
Note. — (1): Host galaxy of the nuclear ring; (2): Frequency at which regions were identified and SFR and sizes were measured. For NGC 7591, 15GHz image was used instead. (3): Identifier of the region in reference to Figure 5. (4): Flux density of the region. (5): Effective radius of the region assuming region is circular (Section 5.3). Beam areas are used for unresolved regions as upper-limits for their sizes, indicated by “”. (6): SFR calculated using Eq.5.1 and (5) for non-AGN regions; (7): estimated by dividing (6) over region area (in kpc2). Unresolved regions are given lower-limits for their , indicated by “”; (8): Spectral index associated with the region (Section 5.4) measured from 15 to 33 GHz. (9): Fraction of thermal emission at 33 GHz estimated using (Section 4.2). Given the coarser resolution of the beam-matched 15 and 33 GHz images on which were measured, the reported 33 GHz thermal fractions may be considered as lower-limits. See Section 6.5 for discussion. (10): Whether the region corresponds to a galactic nucleus (AGN/starburst), see Table 1 for references.
5.5 Gas depletion times
In the left panels of Figure 7, we show the beam-matched CO
(J=1-0) moment 0 maps (in color) and 33 GHz continuum data (in contour) for the
six nuclear rings in the sample that have archival CO (J=1-0) data at resolutions
comparable to the VLA data (Section 3.2). We can see that the nuclear rings
observed in the radio continuum are largely co-spatial with the cold molecular
gas, and molecular spiral arms are visible beyond the rings in NGC
1097, IC 342, NGC 3351 and NGC 4321. Using the measurements of CO (J=1-0) and 33
GHz continuum emission on these resolution-matched maps, we can calculate the
cold molecular gas mass () and surface densities
() in these six nuclear rings and their individual NRSF
regions, and make direct comparisons with the SFR and to
estimate the timescale at which SF depletes the molecular gas, which is used in
both observational and theoretical studies to quantify star formation
efficiencies (i.e. = 1/SFE =
; e.g. Bigiel et al., 2008; Wilson et al., 2019; Moreno et al., 2021).
We follow Herrero-Illana et al. (2019) and use equation
from Solomon et al. (1992) to convert the measured CO(J=1-0) flux to
molecular gas mass:
| (7) | ||||
| (8) |
where is in units of M⊙,
is the integrated line flux in Jy km/s and
is the luminosity distance in Mpc reported in Table
1 given the redshift . Finally, is the
CO-to-H2 conversion factor, in units of M⊙(K km s-1
pc-2)-1. We adopt 4.3 M⊙(K km s-1
pc-2)-1 for the five nuclear rings hosted in normal galaxies following
previous resolved studies of nearby disk galaxies (Bigiel et al., 2008; Leroy et al., 2013), and
we use the U/LIRG value = 1.8 M⊙(K km s-1
pc-2)-1 from Herrero-Illana et al. (2019) for the nuclear ring in NGC 7469. We
use Equation 5.1 to convert the 33 GHz continuum flux to SFR, and
and are calculated using the
physical areas of the adopted apertures (See Section 4.3).
In Table 6 we summarize the derived quantities for the nuclear rings
and the individual NRSF regions.
Based on calculations using previous global CO (J=1-0)
measurements (Young et al., 1996; Crosthwaite, 2001; Crosthwaite et al., 2001; García-Burillo et al., 2003; Davies et al., 2004), these six
nuclear rings contain 10 – 30% of the total molecular gas mass of their
host galaxies; this gas is available to fuel the active starbursts that are
responsible for 10 – 60% of the total SFR of the host galaxies. The
average has a range of –
M⊙yr-1pc-2 in these nuclear rings, and
– M⊙yr-1pc-2 in the NRSF regions. The gas
depletion times associated with the individual NRSF regions
range from 0.07 – 1.4 Gyr. The median for regions in the
normal galaxies is 0.60.5 Gyr. This is almost an order of magnitude longer
than regions in NGC 7469, which has a median of
0.080.01 Gyr. These values agree with results from previous sub-kpc
studies of normal galaxies (Bigiel et al., 2008; Leroy et al., 2013) and U/LIRGs
(Wilson et al., 2019). Despite that our measurements are made on scales larger than
the region sizes measured using native-resolution radio maps, the median
for the NRSF regions is largely consistent with
measured over the entire ring for each galaxy, therefore
higher-resolution measurements may increase the scatter of
estimated for these regions but will not significantly change the results. In
the right panels of Figure 7, we also show pixel-by-pixel map of
for each nuclear ring for more direct visualization. We note
that derived near AGN is not meaningful as the 33 GHz
emission is not associated solely with star formation, and hence we also do not
report and in Table
6 for regions containing AGN. We further discuss these results
in the context of universal star formation relation (e.g. Kennicutt, 1998)
in Section 6.6.

| Galaxy | ID | Aap() | ( M⊙) | (M⊙yr-1pc-2) | (M⊙yr-1kpc-2) | (Gyr) | |
|---|---|---|---|---|---|---|---|
| (1) | (2) | (3) | (4) | (5) | (6) | ||
| Ring | NGC 1097 | - | 577 | 760100 | 28040 | 0.720.07 | 0.380.06 |
| IC 342 | - | 213 | 475 | 86090 | 2.90.3 | 0.290.04 | |
| NGC 3351 | - | 170 | 19020 | 55060 | 0.550.05 | 1.00.1 | |
| NGC 4321 | - | 312 | 43040 | 28030 | 0.260.03 | 1.10.2 | |
| NGC 4826 | - | 82 | 505 | 79080 | 0.580.06 | 1.40.2 | |
| NGC 7469 | - | 25 | 25001 | 89090 | 8.80.9 | 0.100.01 | |
| Region | NGC 1097 | 1 | 13.4 | 2610 | 41020 | 1.20.1 | 0.350.14 |
| .. | 2 | 10.14 | 4710 | 970200 | 1.60.2 | 0.610.15 | |
| .. | 3 | 22.5 | 4914 | 450130 | 1.50.2 | 0.320.09 | |
| .. | 4 | 10.1 | 6111 | 1260220 | 1.50.2 | 0.820.17 | |
| .. | 5 | 17.6 | 9015 | 1070170 | N/A | N/A | |
| .. | 6 | 10.1 | 3510 | 730190 | 1.20.1 | 0.630.18 | |
| .. | 7 | 10.1 | 149 | 290180 | 1.30.1 | 0.230.15 | |
| .. | 8 | 10.1 | 4.18.7 | 84180 | 0.680.10 | 0.120.27 | |
| .. | 9 | 18.0 | 6313 | 740150 | 1.30.1 | 0.580.14 | |
| IC 342 | 1 | 29.4 | 113 | 1460150 | 7.70.8 | 0.190.03 | |
| .. | 2 | 5.93 | 2.51.1 | 1610160 | 4.60.5 | 0.350.05 | |
| .. | 3 | 6.80 | 1.71.2 | 990100 | 5.10.6 | 0.190.03 | |
| .. | 4 | 5.93 | 3.01.1 | 1970200 | 4.00.5 | 0.490.08 | |
| NGC 3351 | 1 | 43.0 | 546 | 62070 | 0.660.07 | 0.940.14 | |
| .. | 2 | 5.72 | 7.81.1 | 680100 | 0.710.08 | 0.950.17 | |
| .. | 3 | 21.4 | 344 | 78090 | 1.00.1 | 0.750.11 | |
| NGC 4321 | 1 | 6.31 | 202 | 66080 | 0.290.05 | 2.300.46 | |
| .. | 2 | 9.26 | 263 | 58070 | 0.610.07 | 0.940.15 | |
| .. | 3 | 7.86 | 495 | 1270130 | N/A | N/A | |
| .. | 4 | 6.31 | 142 | 44060 | 0.620.07 | 0.700.13 | |
| .. | 5 | 6.31 | 162 | 53070 | 0.380.05 | 1.40.3 | |
| .. | 6 | 6.31 | 182 | 59070 | 0.570.07 | 1.00.2 | |
| NGC 4826 | 1 | 9.39 | 9.20.9 | 1450150 | N/A | N/A | |
| .. | 2 | 7.58 | 5.80.6 | 1140120 | 1.00.1 | 1.10.2 | |
| .. | 3 | 6.94 | 1.90.3 | 42060 | 0.740.07 | 0.570.09 | |
| NGC 7469 | 1 | 1.40 | 28030 | 750100 | 8.50.9 | 0.090.01 | |
| .. | 2 | 0.98 | 29030 | 1130130 | 121 | 0.090.01 | |
| .. | 3 | 2.04 | 80080 | 1480150 | N/A | N/A | |
| .. | 1 | 0.98 | 29030 | 1110130 | 172 | 0.070.01 | |
| .. | 2 | 0.98 | 27030 | 1060120 | 121 | 0.080.01 | |
| .. | 3 | 0.98 | 28030 | 1090130 | 131 | 0.090.01 |
Note. — (1): Host galaxy of the nuclear ring. (2): Identifier of the region in reference to Figure 5. (3): Area of the circular aperture used to measure 33 GHz and CO(J=1-0) flux of the nuclear ring/NRSF region. For IC 342 and NGC 4826, beam areas are subtracted from the ring areas defined by to account for the central unresolved cavities.(4): Molecular gas mass derived from CO (J=1-0) flux measurements (see Section 5.5). (5): Molecular gas surface density over the physical areas of the adopted apertures. (6): Star formation rate surface density over the physical areas of the adopted apertures for non-AGN regions. (7) Gas depletion time calculated using (5) and (6) for non-AGN regions.
6 Discussion
Our selection criteria has resulted in the identification of NRSF in four LIRGs and five normal galaxies. The NRSF in our sample exhibits diverse spatial distributions (Figure 1(a) and 1(b)). For examples, NGC 1097 and NGC 1614 have more randomly distributed NRSF regions along the rings compared to NGC 3351 and NGC 1797, where bright regions occur on opposite sides of the ring. Several studies have discussed the potential mechanisms that may give rise to certain alignments of bright NRSF regions, such as orbit crowding of gas clouds at the ends of nuclear stellar bars (e.g., Kenney & Lord, 1991; Mazzarella et al., 1994; Englmaier & Shlosman, 2004), or specific gas inflow rates into the ring (e.g., Seo & Kim, 2013). Depending on how gas accumulates, NRSF can either take place stochastically in the ring due to gravitational instability, resulting in random spatial distribution of “hot spots”, or close to the contact points between the ring and dust lanes in multiple bursts (e.g. Böker et al., 2008). Given the limited sample size, we do not further discuss the implications associated with the NRSF spatial distribution, but simply provide descriptions of our observations and relevant information from previous studies on individual nuclear rings in Appendix A. Instead, we focus our discussions on the implications of the results in Section 5, and the limitations of the present sample.
6.1 Sample limitation
The sample presented in
this work is limited by several effects. Given the resolution of the
observations, a nuclear ring has to have an angular radius larger than the
synthesized beam in order for the ring structure to be resolved. An example is
NGC 4579, a known nuclear ring host in SFRS, whose ring radius is estimated to
be 1.6″ from HST optical and near-IR observations (Comerón et al., 2010),
which is smaller than the 33 GHz beam size of 2″, and therefore not
included in our sample. Additionally, the surface brightness of the nuclear ring
must be high enough above the sensitivity limits of the observations for the
ring structure to be visually distinct. NGC 4736 and NGC 5194 are two other
galaxies from SFRS that are included in Comerón et al. (2010) but excluded from our
sample because many of their NRSF regions are too faint for the ring structure
to be visually distinct. This may be due to overall lower level of SF activity,
and/or a lack of sensitivity of the observations. For example, with an estimated
angular radius of 50″(1.2 kpc, Comerón et al., 2010), the ring in NGC 4736
is detected close to the edge of the 33 GHz primary beam, where sensitivity is
significantly worse compared to the phase center, which results in incomplete
detection of the ring structure.
For observations from the GOALS equatorial survey, rings at very
close distances such as the one in NGC 1068 become too highly-resolved at A
configuration to be detected given the sensitivity limit and rings that are far
away may either have been unresolved or lack consistent detection of NSRF
regions for the ring structure to be visually identified. The fact that all four
LIRGs in our sample have similar luminosity distances at 70 Mpc may be
the result of such a trade-off between physical resolution and sensitivity.
Finally, rings that are highly inclined may appear linear and therefore are not
represented in our sample. High-resolution kinematics studies are needed to
reveal these edge-on rings.
Given the above, our sample represents a lower-limit of the
number of nuclear rings in both surveys, and thus the results derived in this
study may not represent the full range of NRSF properties in SFRS and the GOALS
equatorial survey.
6.2 The majority of SF in these LIRGs takes place in their nuclear rings
Figure 8 shows the
fraction of total SFR contributed by the nuclear ring with respect to
of the host galaxy, as calculated in Section
5.2. Each galaxy is color-coded by its
, with darker blue and darker red representing the lower and
higher , respectively. Nuclear rings hosted in the LIRGs have up
to six times higher
than the ones
hosted in the normal galaxies. Furthermore, we can also see that high
in general
corresponds to galaxies with high . This result echoes previous
studies which found that local galaxies with higher have more centrally
concentrated emission (Díaz-Santos et al., 2010, 2011), and that the nuclear
SF in LIRGs can dominate the properties of their host galaxies
(e.g. Veilleux et al., 1995; Soifer et al., 2001). However, the nuclear rings we study here
may only represent the most extreme cases, and it is possible that in
many LIRGs, the total star formation is less centrally concentrated. We will
present results on various nuclear SF structures in the entire GOALS equatorial
survey in a upcoming paper to further investigate this.
It is also worth noting that NGC 1097, which is interacting with a dwarf
companion, has both the highest and the highest
among the normal
galaxies. This trend is consistent with studies that observed excess nuclear SFR
in interacting galaxies relative to isolated systems
(e.g. Lonsdale et al., 1984; Bushouse, 1986), which is also predicted in simulations of
galaxy interaction (Moreno et al., 2021).

6.3 High SFR and in NRSF regions in the sample of LIRGs
The consistently higher nuclear ring contribution to
the total SFR, as discussed in the last Section, points to more active NRSF in
our sample of LIRGs. In Figure 9, we show, in filled symbols,
the SFR and of all 58 NRSF regions with respect to their
effective radius (reported in Table 6), and in non-filled
symbols, the integrated values for the entire rings (Table
4). Note that for the integrated values, measures the effective area extended by the ring, and
is different from defined in Section 4.1.
Despite the different angular resolutions of the observations,
the physical resolutions achieved (marked in short vertical lines on the
horizontal axis) and the effective sizes of NRSF regions measured are similar between the
normal galaxies and the LIRGs. We can see that at similar or smaller effective
sizes, the integrated rings and NRSF regions in the LIRGs (triangles) both have
at least an order of magnitude higher SFR and than their
counterparts in the normal galaxies (squares), confirming that NRSF in these
LIRGs are indeed more active than in the normal galaxies. Additionally, most
NRSF regions in these LIRGs have SFR as high as the integrated ring values of
the normal galaxies, with 1–2 dex smaller effective sizes, exhibiting
extremely high spatial concentration of SF activities.
It is worth noting that for both the normal galaxies and the
LIRGs, regions measured at the highest physical resolutions (i.e. those in IC
342 and NGC 1614) have the highest , which demonstrates
the importance of high-resolution observations in accurate characterization of
these regions. Lower resolution observations would likely result in diluted (and
thus lower) measures of the intrinsic . Assuming the extreme
case where is diluted by quiescent regions with no active
SF when measured within larger area (i.e. , hatched in red in Figure 9), NRSF regions
in NGC 1614 may appear to have similar to resolved regions
in the normal galaxies even at 03 resolution (100 pc). The fact that
regions in NGC 1797 and NGC 7469 share similar with
regions in IC 342 is likely a result of such dilution effect, given that
observations of these two galaxies have much lower physical resolutions.
Furthermore, many regions in the LIRGs, especially in NGC 1614 are
unresolved by the beam (marked with arrows), which means that their sizes can be
even smaller, and their can be even higher. Additionally,
the integrated ring values for these LIRGs all lie above the ranges spanned by
their NRSF regions, suggesting that active SF takes place throughout these
nuclear rings, not only in the NRSF regions that we characterized here. Indeed,
the sum of SFR in the NRSF regions only account for about 20 – 50% of the
total SFR of the rings. If higher resolution deep observations
were to be made available for these rings, we
would expect to detect more NRSF regions that are less
luminous or much smaller.
In summary, the NRSF regions studied in our sample of LIRGs
intrinsically have higher SFR and with sizes similar to or
smaller than their counterparts in the sample of normal galaxies. Observations
with consistent, high physical resolution are crucial for accurate
characterization of these extreme, compact NRSF regions.
We note that within our sample, we do not find evidence associating AGN
activity with NRSF, as SFR or in NRSF regions do not
appear consistently higher or lower in AGN hosts. Existing measurements of AGN
strength indicators in the IR and X-ray of the host galaxies
(Stierwalt et al., 2013; Dale et al., 2006; Grier et al., 2011) also do not reveal any correlation with the
NRSF properties studied here.

6.4 NRSF in these LIRGs have SFR and comparable to luminous SF regions at high-
Using high-resolution HST Pa
and Pa observations, Larson et al. (2020) measured the SFR and effective radii
of 751 extra-nuclear SF regions and 59 nuclei in 48 local LIRGs from GOALS. The
authors showed that SF in local LIRGs bridges the gap between the local and the
high- Universe, with a wide range of SFR overlapping with those found in
luminous SF clumps in lensed galaxies. In Figure 10, we
reproduce Figure 5 and 6 from Larson et al. (2020), overlaid with radio measurements
for the individual NRSF regions from this study. Note that the most
luminous regions in Larson et al. (2020) are the nuclei, most of which
have SFR 0.1 M⊙/yr and
0.2 M⊙/yr/kpc2 with effective radii greater than 300 pc. The
dashed vertical line in orange marks the resolution limit of 90 pc for
measurements from Larson et al. (2020). There are several conclusions that can be
drawn from this Figure:
• For the five normal galaxies from SFRS, the NRSF
regions (black squares) have higher SFR and than the
ensemble of SINGS regions (grey dots), which are measured in the disk of normal
galaxies. Similarly, for the sample of LIRGs from the GOALS equatorial survey,
the NRSF regions (red triangles) have higher SFR and
than the ensemble of GOALS regions (orange “+”) detected in the near-IR, over
90% of which are extra-nuclear. These two results together suggest that NRSF
can be more extreme than extra-nuclear SF in the disk of the host galaxy,
supporting findings from Linden et al. (2019).
• At similar measured sizes, NRSF regions in the sample
of normal galaxies overlap with the extra-nuclear GOALS regions in
Larson et al. (2020) and lower-luminosity lensed regions at high- (purple “x”).
On the other hand, NRSF regions in the sample of LIRGs lie above the
extra-nuclear GOALS regions from Larson et al. (2020), and their SFR and
are comparable to many luminous high- regions. Note
that if we consider the same dilution analysis as shown in Figure
9 (in red hatching), we would still find that the NRSF regions
in the LIRGs have comparable to many high- SF regions
with lower resolution measurements. We will investigate whether this applies
more broadly to other nuclear SF regions in the GOALS equatorial survey in the
upcoming paper. Future surveys with the capability of detecting fainter and
smaller NRSF regions will allow a more comprehensive understanding of NRSF in
LIRGs.
We also note that the different SFR tracers used for data
presented in Figure 10 are sensitive to dust obscuration at
different levels, which can affect the above interpretation of our results.
While heavy non-uniform extinction in the nuclei of LIRGs can lead to
underestimation of SFR and by 1 - 1.5 dex even in the
near-IR (U et al., 2019), over 90% of the GOALS regions being compared here are
extra-nuclear and expected to be mildly extincted (Larson et al., 2020). Therefore we
do not expect extinction correction to change our conclusions.

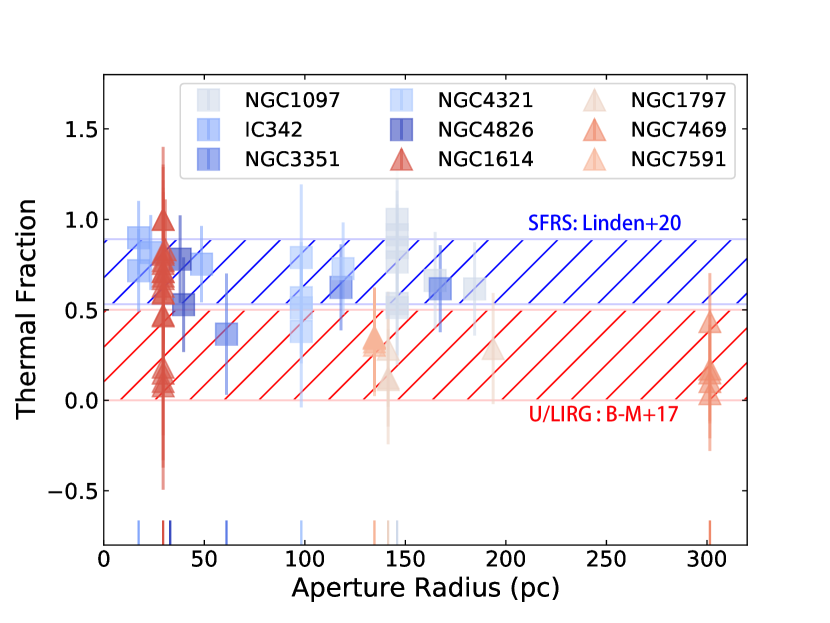
6.5 Thermal fractions in the NRSF regions at 33 GHz
In Figure 11, we show the estimated thermal fractions at
33 GHz, , associated with the NRSF regions in the sample nuclear rings with
respect to the physical radii of the apertures within which these measurements were made
(see Section 4.2 and 5.4).
For context, we also overlay the expected values from Barcos-Muñoz et al. (2017) for
luminous nuclei in U/LIRGs (hatched red), and the median values from
Linden et al. (2020) for the nuclear regions in SFRS (hatched blue), both
measured at sub-kpc scales.
The median value of associated with the NRSF
regions in the sample of normal galaxies is 6919%, in agreement
with the median value of 71% for all nuclear regions (i.e. having
galactocentric radii pc) in the full SFRS sample, reported in
Linden et al. (2020). As discussed in Linden et al. (2020), excess non-thermal emission is
present in the circum-nuclear SF regions in SFRS compared to the extra-nuclear
regions ( kpc; median 90%), likely due to
prolonged SF activities. As illustrated in Figure 7 of Linden et al. (2020) using
Starburst99 models, continuous SF for over 100 Myr can decrease the thermal
fraction to 50% due to accumulation of non-thermal emission from
supernovae, while instantaneous starburst can dramatically bring down thermal
fraction to much lower levels within 10 Myr. Given that nuclear rings have
prolific episodic starbursts (e.g. Buta et al., 2000; Maoz et al., 2001), and can persist at
Gyr timescales (Knapen et al., 1995; Seo & Kim, 2013), the relatively low
observed in the NRSF regions in these normal galaxies may be driven by a
combination of continuous and “bursty” SF.
In Figure 11 we also see that at similar physical
scales, can be even lower for NRSF regions in the sample of
LIRGs compared to those in the normal galaxies, except for NGC 1614, whose NRSF
regions span a wide range in . The median in the
NRSF regions in the sample of LIRGs is 3536% including NGC
1614, and 299% excluding NGC 1614, which are much lower
than the median of 69% measured in the normal galaxies. This is in
agreement with findings from Barcos-Muñoz et al. (2015) and Barcos-Muñoz et al. (2017) that the
nuclear regions in U/LIRGs are mostly dominated by non-thermal emission. These
authors suggest that thermal emission in the nuclei of U/LIRGs may be
suppressed via the absorption of ionizing photons by dust. However, in our case,
the lower can also be explained by beam dilution due to low
resolutions of the beam-matched images, i.e., measurements for most
regions in NGC 1797, NGC 7469 and NGC 7591 are at scales 2 - 5 times larger than
the sizes of the NRSF regions characterized using Astrodendro. The
wide range of observed in the nuclear ring of NGC 1614,
which is measured at physical scales smaller than 50 pc, has also been
observed by Herrero-Illana et al. (2014). The authors conclude that this large
variation reflects the different ages of starbursts in the NRSF regions, with
regions of extremely young starbursts (Myr) having thermal fractions
%, and regions of old starbursts ( Myr) having much lower
thermal fractions. This explanation is also consistent with Figure 7 in
Linden et al. (2020). As demonstrated in previous Sections, the NRSF regions in the
sample of LIRGs are likely more compact than the ones in the normal galaxies.
Therefore, measurements at 100 – 300 pc scales in these LIRGs may average over
areas of young and old starbursts that have drastically different thermal
content. Additionally, as mentioned in Section 5.4, non-thermal
emission associated with supernovae can be more diffuse than thermal emission
(e.g. Condon, 1992), hence low resolution measurements are more likely to
represent non-thermal emission. It is possible that, at high resolutions
(e.g. 100 pc), we may also see very high in some of the
NRSF regions in NGC 1797, NGC 7469 and NGC 7591, as observed in NGC 1614.
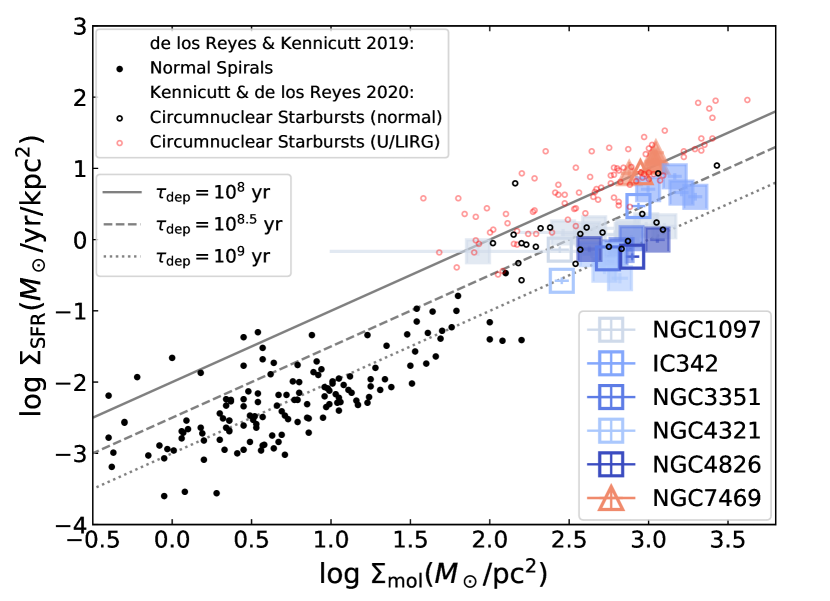
6.6 Star formation relation
Global measurements of
and of galaxies of various types
indicate the existence of a universal SF relation, i.e.
, with 1.4
(e.g. Kennicutt, 1998). According to this relation, SF efficiency increases
(i.e. gas depletion time decreases) towards high for all
types of galaxies. However, several studies argue for a bimodal SF relation
which predicts constant star formation efficiency among galaxies of similar
types, with gas depletion times in normal spiral galaxies 4 - 10 times longer
than in U/LIRGs or high- sub-millimeter galaxies
(e.g. Bigiel et al., 2008; Daddi et al., 2010; Genzel et al., 2010; Kennicutt & de los Reyes, 2020). As we show in Figure
12, this bimodality is also present in our results for the nuclear
rings (non-filled) and the NRSF regions (filled) derived from extinction-free
measurements at sub-kpc scales (see Section 5.5). Despite
having 1 - 2 dex higher , the rings and the NRSF regions in
the normal galaxies (square symbols) have similar gas depletion times
( Gyr) with normal spiral disks. The ring and NRSF
regions in NGC 7469 also show consistent Myr)
with circumnuclear disk measurements for U/LIRGs, being up to an order of
magnitude shorter than rings and NRSF regions in the normal galaxies. This is
similar to values measured in other sub-kpc scale studies of U/LIRGs
(e.g. Xu et al., 2015; Pereira-Santaella et al., 2016), but 4 - 6 times shorter than
estimated from global measurements of GOALS galaxies (Herrero-Illana et al., 2019).
In a resolved study of five U/LIRGs, Wilson et al. (2019) demonstrated that
decreases more rapidly at increasing
above M⊙/pc2 in these extreme systems. In
an upcoming paper, we will present sub-kpc measurements for a larger sample of
nuclear SF regions in the GOALS equatorial survey to further explore the sub-kpc
SF relation in local U/LIRGs.
The nuclear rings in IC 342 and NGC 1097 also have relatively
high SFE compared to spiral disks and other nuclear rings hosted in normal
galaxies, with Gyr. This central enhancement of
SFE has also been observed in other studies of IC 342 (Sage & Solomon, 1991; Pan et al., 2014) and
in surveys of normal galaxies (e.g. Leroy et al., 2013; Utomo et al., 2017). Meanwhile, at
similar , NRSF regions in NGC 1097 span 1 dex in
. Tabatabaei et al. (2018) discovered that this large scatter in
SFE is closely tied to local build-up of the magnetic field that support
molecular clouds against gravitational collapse. Overall, our results show that,
in these nuclear rings, at similar , is
shorter in the LIRG NGC 7469 compared to in the normal galaxies, but it
varies among the normal galaxies as well, likely reflecting variation in local
SF conditions. Tentatively, this supports the idea of a multi-modal star
formation relation on sub-kpc scales. We note that adopting a normal galaxy
for NGC 7469, or environmentally-dependent
(Narayanan et al., 2012; Sandstrom et al., 2013), can potentially produce a
more continuous SF relation among these nuclear rings, but more statistics
are needed to explore this.
7 Summary
In this paper we present analyses of
sub-kpc resolution VLA radio continuum observations of nine nuclear rings hosted
in four local LIRGs from the GOALS equatorial survey (NGC 1614, NGC
1797, NGC 7469, NGC 7591) and five nearby normal galaxies from the Star
Formation in Radio Survey (NGC 1097, IC 342, NGC 3351, NGC 4321, NGC 4826).
These two surveys map the brightest 3, 15 and 33 GHz radio continuum emission in
56 nearby normal galaxies and 68 local U/LIRGs at matched physical resolution,
and hence allow direct, extinction-free comparison of nuclear star formation
across different host environments. Using high-resolution maps of 33 or 15 GHz
continuum, we characterize the size, SFR and of these nine
detected nuclear rings and 58 individual NRSF regions at scales. We
summarize our main findings as follows:
1. The five nuclear rings in normal galaxies contribute 7 -
40% of the total SFR of their host galaxies, with radii, SFR and
in the range of 43 – 599 pc, 0.03 – 2.0 M⊙
yr-1 and 0.27 – 2.90 M⊙ yr-1 kpc-2, respectively. By
comparison, the four nuclear rings in the LIRGs have much more dominant
contributions to the total star formation of their host galaxies, at 49 - 60%,
with radii, SFR and in the range of 121 – 531 pc, 6.1 –
29 M⊙ yr-1 and 6.0 – 97 M⊙ yr-1 kpc-2,
respectively.
2. We identified a total of 58 individual NRSF regions using
Astrodendro, 22 of which are hosted in the five normal galaxies, and 35
are in the LIRGs. NRSF regions in the normal galaxies have effective radii, SFR
and in the range of 16 – 184 pc, 0.01 –
0.21 M⊙yr-1 and 0.4 – 9.2 M⊙yr-1kpc-2,
respectively. NRSF regions in the LIRGs have similar range of effective radii,
of 13 – 221 pc, but their SFR and are an order of
magnitude higher, with a range of 0.08 – 1.7 M⊙yr-1 and 7 –
402 M⊙yr-1kpc-2, respectively. Many of these NRSF regions in
the LIRGs are unresolved by our observations, so they may be more compact with
higher intrinsic . We also found that these NRSF
regions in the LIRGs have SFR and as extreme as measured
in lensed high- SF galaxies from the literature.
3. The median ratio of thermal emission to the total 33 GHz
radio continuum emission (i.e. thermal fraction) associated with the NRSF regions is
6919% in the normal galaxies, and 3536% in the LIRGs, which is lower
than estimates for extra-nuclear SF regions, but consistent with results from
previous studies. The dominant presence of non-thermal emission in the LIRGs may
originate from suppression of thermal emission due to absorption of ionizing
photons by highly concentrated dust in HII regions. In our case, it is more
likely due to insufficient resolution of the measurements that results in the
inclusion of more diffuse non-thermal emission from cosmic rays accelerated by
supernovae. A wide range of thermal fractions were observed in
NGC 1614 at high resolution ( pc), which likely reflects different ages
of the starbursts along the nuclear ring.
4. For all five normal galaxies and one LIRG (NGC 7469), we use
available archival CO(J=1-0) data with comparable resolutions to our 33 GHz
observations to further study star formation efficiencies in these nuclear rings
at sub-kpc scales. The nuclear rings and NRSF regions in the normal galaxies
have gas depletion times 1 Gyr, about an order
magnitude longer than in the nuclear ring and NRSF regions of NGC 7469
( 100 Myr), which is consistent with results from previous
studies on kpc and global scales. However, estimated for
rings and regions with similar have fair amount of
scatter, which may point to a multi-modal star formation relation on sub-kpc
scales. More statistics are needed to explore this.
In this work we have demonstrated the ability to study embedded nuclear
ring star-forming regions on sub-kpc scales in local LIRGs using high frequency
radio continuum as an extinction-free tracer of star formation. This makes it
possible to directly compare star formation properties in the heavily obscured
hearts of local U/LIRGs with those at the center of normal galaxies. We also
show that to fully resolve and characterize these extremely compact NRSF regions
in the local LIRGs, observations at even higher resolutions and better
sensitivity are needed. Future facilities such as the ngVLA will greatly improve
our understanding of deeply embedded compact nuclear structures in these
systems.
This paper makes use of the following ALMA data: ADS/JAO.ALMA#2012.1.00001.S,
ADS/JAO.ALMA#2013.1.00885.S,
ADS/JAO.ALMA#2015.1.00978.S,
ADS/JAO.ALMA#2016.1.00972.S,
ADS/JAO.ALMA#2013.1.00218.S.
ALMA is a partnership of ESO (representing its member states), NSF (USA) and NINS (Japan), together with NRC (Canada), MOST and ASIAA (Taiwan), and KASI (Republic of Korea), in cooperation with the Republic of Chile. The Joint ALMA Observatory is operated by ESO, AUI/NRAO and NAOJ.
References
- Allard et al. (2006) Allard, E. L., Knapen, J. H., Peletier, R. F., & Sarzi, M. 2006, MNRAS, 371, 1087
- Alonso-Herrero et al. (2001) Alonso-Herrero, A., Engelbracht, C. W., Rieke, M. J., Rieke, G. H., & Quillen, A. C. 2001, ApJ, 546, 952
- Armus et al. (2009) Armus, L., Mazzarella, J. M., Evans, A. S., et al. 2009, PASP, 121, 559
- Astropy Collaboration et al. (2013) Astropy Collaboration, Robitaille, T. P., Tollerud, E. J., et al. 2013, A&A, 558, A33
- Athanassoula (1994) Athanassoula, E. 1994, in Mass-Transfer Induced Activity in Galaxies, ed. I. Shlosman, 143
- Balzano (1983) Balzano, V. A. 1983, ApJ, 268, 602
- Barcos-Muñoz et al. (2015) Barcos-Muñoz, L., Leroy, A. K., Evans, A. S., et al. 2015, ApJ, 799, 10
- Barcos-Muñoz et al. (2017) —. 2017, ApJ, 843, 117
- Barreto et al. (1991) Barreto, J. A., Downes, D., Combes, F., et al. 1991, A&A, 244, 257
- Bigiel et al. (2008) Bigiel, F., Leroy, A., Walter, F., et al. 2008, AJ, 136, 2846
- Böker et al. (2008) Böker, T., Falcón-Barroso, J., Schinnerer, E., Knapen, J. H., & Ryder, S. 2008, AJ, 135, 479
- Boker et al. (1997) Boker, T., Forster-Schreiber, N. M., & Genzel, R. 1997, AJ, 114, 1883
- Bowen et al. (2016) Bowen, D. V., Chelouche, D., Jenkins, E. B., et al. 2016, ApJ, 826, 50
- Brown et al. (2014) Brown, M. J. I., Moustakas, J., Smith, J. D. T., et al. 2014, ApJS, 212, 18
- Bushouse (1986) Bushouse, H. A. 1986, AJ, 91, 255
- Buta & Combes (1996) Buta, R., & Combes, F. 1996, Fund. Cosmic Phys., 17, 95
- Buta et al. (2000) Buta, R., Treuthardt, P. M., Byrd, G. G., & Crocker, D. A. 2000, AJ, 120, 1289
- Casasola et al. (2015) Casasola, V., Hunt, L., Combes, F., & García-Burillo, S. 2015, A&A, 577, A135
- Clark et al. (2018) Clark, C. J. R., Verstocken, S., Bianchi, S., et al. 2018, A&A, 609, A37
- Combes (2001) Combes, F. 2001, in Advanced Lectures on the Starburst-AGN, ed. I. Aretxaga, D. Kunth, & R. Mújica, 223
- Combes & Gerin (1985) Combes, F., & Gerin, M. 1985, A&A, 150, 327
- Comerón et al. (2010) Comerón, S., Knapen, J. H., Beckman, J. E., et al. 2010, MNRAS, 402, 2462
- Condon (1992) Condon, J. J. 1992, ARA&A, 30, 575
- Crosthwaite (2001) Crosthwaite, L. P. 2001, PhD thesis, University of California, Los Angeles
- Crosthwaite et al. (2001) Crosthwaite, L. P., Turner, J. L., Hurt, R. L., et al. 2001, AJ, 122, 797
- Daddi et al. (2010) Daddi, E., Elbaz, D., Walter, F., et al. 2010, ApJ, 714, L118
- Dale et al. (2006) Dale, D. A., Smith, J. D. T., Armus, L., et al. 2006, ApJ, 646, 161
- Dale et al. (2009) Dale, D. A., Smith, J. D. T., Schlawin, E. A., et al. 2009, ApJ, 693, 1821
- Davies et al. (2004) Davies, R. I., Tacconi, L. J., & Genzel, R. 2004, ApJ, 602, 148
- de los Reyes & Kennicutt (2019) de los Reyes, M. A. C., & Kennicutt, Robert C., J. 2019, ApJ, 872, 16
- Devereux et al. (1992) Devereux, N. A., Kenney, J. D., & Young, J. S. 1992, AJ, 103, 784
- Díaz-Santos et al. (2010) Díaz-Santos, T., Charmandaris, V., Armus, L., et al. 2010, ApJ, 723, 993
- Díaz-Santos et al. (2011) —. 2011, ApJ, 741, 32
- Díaz-Santos et al. (2017) Díaz-Santos, T., Armus, L., Charmandaris, V., et al. 2017, ApJ, 846, 32
- Dickinson et al. (2018) Dickinson, C., Ali-Haïmoud, Y., Barr, A., et al. 2018, New A Rev., 80, 1
- Elbaz et al. (2011) Elbaz, D., Dickinson, M., Hwang, H. S., et al. 2011, A&A, 533, A119
- Englmaier & Shlosman (2004) Englmaier, P., & Shlosman, I. 2004, ApJ, 617, L115
- Fitzgibbon et al. (1996) Fitzgibbon, A. W., Pilu, M., & Fisher, R. B. 1996, in Proceedings of 13th International Conference on Pattern Recognition, Vol. 1, 253–257 vol.1
- Fukuda et al. (1998) Fukuda, H., Wada, K., & Habe, A. 1998, MNRAS, 295, 463
- García-Burillo et al. (2003) García-Burillo, S., Combes, F., Hunt, L. K., et al. 2003, A&A, 407, 485
- Genzel et al. (1995) Genzel, R., Weitzel, L., Tacconi-Garman, L. E., et al. 1995, ApJ, 444, 129
- Genzel et al. (2010) Genzel, R., Tacconi, L. J., Gracia-Carpio, J., et al. 2010, MNRAS, 407, 2091
- Grier et al. (2011) Grier, C. J., Mathur, S., Ghosh, H., & Ferrarese, L. 2011, ApJ, 731, 60
- Haan et al. (2013) Haan, S., Armus, L., Surace, J. A., et al. 2013, MNRAS, 434, 1264
- Herrero-Illana et al. (2017) Herrero-Illana, R., Alberdi, A., Pérez-Torres, M. Á., et al. 2017, MNRAS, 470, L112
- Herrero-Illana et al. (2014) Herrero-Illana, R., Pérez-Torres, M. Á., Alonso-Herrero, A., et al. 2014, ApJ, 786, 156
- Herrero-Illana et al. (2019) Herrero-Illana, R., Privon, G. C., Evans, A. S., et al. 2019, A&A, 628, A71
- Hinshaw et al. (2009) Hinshaw, G., Weiland, J. L., Hill, R. S., et al. 2009, ApJS, 180, 225
- Ho et al. (1997) Ho, L. C., Filippenko, A. V., & Sargent, W. L. W. 1997, ApJS, 112, 315
- Hopkins & Quataert (2010) Hopkins, P. F., & Quataert, E. 2010, MNRAS, 407, 1529
- Howell et al. (2010) Howell, J. H., Armus, L., Mazzarella, J. M., et al. 2010, ApJ, 715, 572
- Hsieh et al. (2011) Hsieh, P.-Y., Matsushita, S., Liu, G., et al. 2011, ApJ, 736, 129
- Ishizuki et al. (1990) Ishizuki, S., Kawabe, R., Ishiguro, M., Okumura, S. K., & Morita, K.-I. 1990, Nature, 344, 224
- Kenney & Lord (1991) Kenney, J. D. P., & Lord, S. D. 1991, ApJ, 381, 118
- Kennicutt (1998) Kennicutt, Robert C., J. 1998, The Astrophysical Journal, 498, 541
- Kennicutt & de los Reyes (2020) Kennicutt, Robert C., J., & de los Reyes, M. A. C. 2020, arXiv e-prints, arXiv:2012.05363
- Kennicutt et al. (2003) Kennicutt, Robert C., J., Armus, L., Bendo, G., et al. 2003, PASP, 115, 928
- Kennicutt et al. (2011) Kennicutt, R. C., Calzetti, D., Aniano, G., et al. 2011, PASP, 123, 1347
- Kim & Stone (2012) Kim, W.-T., & Stone, J. M. 2012, ApJ, 751, 124
- Knapen (2005) Knapen, J. H. 2005, A&A, 429, 141
- Knapen et al. (1995) Knapen, J. H., Beckman, J. E., Heller, C. H., Shlosman, I., & de Jong, R. S. 1995, ApJ, 454, 623
- Knapen et al. (2004) Knapen, J. H., Whyte, L. F., de Blok, W. J. G., & van der Hulst, J. M. 2004, A&A, 423, 481
- König et al. (2013) König, S., Aalto, S., Muller, S., Beswick, R. J., & Gallagher, J. S. 2013, A&A, 553, A72
- Kormendy & Kennicutt (2004) Kormendy, J., & Kennicutt, Robert C., J. 2004, ARA&A, 42, 603
- Larson et al. (2020) Larson, K. L., Díaz-Santos, T., Armus, L., et al. 2020, ApJ, 888, 92
- Laurikainen & Salo (2002) Laurikainen, E., & Salo, H. 2002, MNRAS, 337, 1118
- Leaman et al. (2019) Leaman, R., Fragkoudi, F., Querejeta, M., et al. 2019, MNRAS, 488, 3904
- Leroy et al. (2013) Leroy, A. K., Walter, F., Sandstrom, K., et al. 2013, AJ, 146, 19
- Li et al. (2015) Li, Z., Shen, J., & Kim, W.-T. 2015, ApJ, 806, 150
- Linden et al. (2020) Linden, S. T., Murphy, E. J., Dong, D., et al. 2020, ApJS, 248, 25
- Linden et al. (2019) Linden, S. T., Song, Y., Evans, A. S., et al. 2019, ApJ, 881, 70
- Livermore et al. (2012) Livermore, R. C., Jones, T., Richard, J., et al. 2012, MNRAS, 427, 688
- Livermore et al. (2015) Livermore, R. C., Jones, T. A., Richard, J., et al. 2015, MNRAS, 450, 1812
- Lonsdale et al. (1984) Lonsdale, C. J., Persson, S. E., & Matthews, K. 1984, ApJ, 287, 95
- Ma et al. (2018) Ma, C., de Grijs, R., & Ho, L. C. 2018, ApJ, 857, 116
- Maoz et al. (2001) Maoz, D., Barth, A. J., Ho, L. C., Sternberg, A., & Filippenko, A. V. 2001, AJ, 121, 3048
- Maoz et al. (1996) Maoz, D., Barth, A. J., Sternberg, A., et al. 1996, AJ, 111, 2248
- Mazzarella et al. (1994) Mazzarella, J. M., Voit, G. M., Soifer, B. T., et al. 1994, AJ, 107, 1274
- Mazzuca et al. (2008) Mazzuca, L. M., Knapen, J. H., Veilleux, S., & Regan, M. W. 2008, ApJS, 174, 337
- McMullin et al. (2007) McMullin, J. P., Waters, B., Schiebel, D., Young, W., & Golap, K. 2007, in Astronomical Society of the Pacific Conference Series, Vol. 376, Astronomical Data Analysis Software and Systems XVI, ed. R. A. Shaw, F. Hill, & D. J. Bell, 127
- Moreno et al. (2021) Moreno, J., Torrey, P., Ellison, S. L., et al. 2021, MNRAS, 503, 3113
- Mould et al. (2000) Mould, J. R., Huchra, J. P., Freedman, W. L., et al. 2000, ApJ, 529, 786
- Murphy et al. (2018) Murphy, E. J., Dong, D., Momjian, E., et al. 2018, ApJS, 234, 24
- Murphy et al. (2011) Murphy, E. J., Condon, J. J., Schinnerer, E., et al. 2011, ApJ, 737, 67
- Murphy et al. (2012) Murphy, E. J., Bremseth, J., Mason, B. S., et al. 2012, ApJ, 761, 97
- Narayanan et al. (2012) Narayanan, D., Krumholz, M. R., Ostriker, E. C., & Hernquist, L. 2012, MNRAS, 421, 3127
- Niklas et al. (1997) Niklas, S., Klein, U., & Wielebinski, R. 1997, A&A, 322, 19
- Olsson et al. (2010) Olsson, E., Aalto, S., Thomasson, M., & Beswick, R. 2010, A&A, 513, A11
- Osterbrock & Martel (1993) Osterbrock, D. E., & Martel, A. 1993, ApJ, 414, 552
- Pan et al. (2014) Pan, H.-A., Kuno, N., & Hirota, A. 2014, PASJ, 66, 27
- Pereira-Santaella et al. (2010) Pereira-Santaella, M., Diamond-Stanic, A. M., Alonso-Herrero, A., & Rieke, G. H. 2010, ApJ, 725, 2270
- Pereira-Santaella et al. (2016) Pereira-Santaella, M., Colina, L., García-Burillo, S., et al. 2016, A&A, 587, A44
- Phillips et al. (1984) Phillips, M. M., Pagel, B. E. J., Edmunds, M. G., & Diaz, A. 1984, MNRAS, 210, 701
- Piqueras López et al. (2013) Piqueras López, J., Colina, L., Arribas, S., & Alonso-Herrero, A. 2013, A&A, 553, A85
- Planesas et al. (1997) Planesas, P., Colina, L., & Perez-Olea, D. 1997, Astronomy and Astrophysics, 325, 81
- Price-Whelan et al. (2018) Price-Whelan, A. M., Sipőcz, B. M., Günther, H. M., et al. 2018, AJ, 156, 123
- Prieto et al. (2019) Prieto, M. A., Fernandez-Ontiveros, J. A., Bruzual, G., et al. 2019, MNRAS, 485, 3264
- Regan & Teuben (2003) Regan, M. W., & Teuben, P. 2003, ApJ, 582, 723
- Robitaille et al. (2019) Robitaille, T., Rice, T., Beaumont, C., et al. 2019, astrodendro: Astronomical data dendrogram creator, , , ascl:1907.016
- Sage & Solomon (1991) Sage, L. J., & Solomon, P. M. 1991, ApJ, 380, 392
- Sakamoto et al. (1995) Sakamoto, K., Okumura, S., Minezaki, T., Kobayashi, Y., & Wada, K. 1995, AJ, 110, 2075
- Sanders et al. (2003) Sanders, D. B., Mazzarella, J. M., Kim, D. C., Surace, J. A., & Soifer, B. T. 2003, AJ, 126, 1607
- Sanders & Mirabel (1996) Sanders, D. B., & Mirabel, I. F. 1996, ARA&A, 34, 749
- Sandstrom et al. (2013) Sandstrom, K. M., Leroy, A. K., Walter, F., et al. 2013, ApJ, 777, 5
- Sarzi et al. (2007) Sarzi, M., Allard, E. L., Knapen, J. H., & Mazzuca, L. M. 2007, MNRAS, 380, 949
- Schinnerer et al. (2003) Schinnerer, E., Böker, T., & Meier, D. S. 2003, ApJ, 591, L115
- Seo & Kim (2013) Seo, W.-Y., & Kim, W.-T. 2013, ApJ, 769, 100
- Seo & Kim (2014) —. 2014, ApJ, 792, 47
- Shlosman et al. (1990) Shlosman, I., Begelman, M. C., & Frank, J. 1990, Nature, 345, 679
- Soifer et al. (2001) Soifer, B. T., Neugebauer, G., Matthews, K., et al. 2001, AJ, 122, 1213
- Solomon et al. (1992) Solomon, P. M., Downes, D., & Radford, S. J. E. 1992, ApJ, 398, L29
- Speagle et al. (2014) Speagle, J. S., Steinhardt, C. L., Capak, P. L., & Silverman, J. D. 2014, ApJS, 214, 15
- Stierwalt et al. (2013) Stierwalt, S., Armus, L., Surace, J. A., et al. 2013, ApJS, 206, 1
- Storchi-Bergmann et al. (1993) Storchi-Bergmann, T., Baldwin, J. A., & Wilson, A. S. 1993, ApJ, 410, L11
- Tabatabaei et al. (2018) Tabatabaei, F. S., Minguez, P., Prieto, M. A., & Fernández-Ontiveros, J. A. 2018, Nature Astronomy, 2, 83
- Telesco & Decher (1988) Telesco, C. M., & Decher, R. 1988, ApJ, 334, 573
- U et al. (2012) U, V., Sanders, D. B., Mazzarella, J. M., et al. 2012, ApJS, 203, 9
- U et al. (2019) U, V., Medling, A. M., Inami, H., et al. 2019, ApJ, 871, 166
- Utomo et al. (2017) Utomo, D., Bolatto, A. D., Wong, T., et al. 2017, ApJ, 849, 26
- Veilleux et al. (1995) Veilleux, S., Kim, D. C., Sanders, D. B., Mazzarella, J. M., & Soifer, B. T. 1995, ApJS, 98, 171
- Wada et al. (1998) Wada, K., Sakamoto, K., & Minezaki, T. 1998, ApJ, 494, 236
- Wilson et al. (2019) Wilson, C. D., Elmegreen, B. G., Bemis, A., & Brunetti, N. 2019, ApJ, 882, 5
- Wright (2006) Wright, E. L. 2006, PASP, 118, 1711
- Xu et al. (2015) Xu, C. K., Cao, C., Lu, N., et al. 2015, ApJ, 799, 11
- Young et al. (1996) Young, J. S., Allen, L., Kenney, J. D. P., Lesser, A., & Rownd, B. 1996, AJ, 112, 1903
- Zaragoza-Cardiel et al. (2017) Zaragoza-Cardiel, J., Beckman, J., Font, J., et al. 2017, MNRAS, 465, 3461
Appendix A Notes on Individual Galaxies
Here we provide description of individual sources based on data used in this
work, as displayed in Figure 1(a), 1(b),
4 and 7. Where relevant, we include
descriptions from prior studies of each nuclear ring.
NGC 1097: In all three VLA bands, we clearly see a nearly
circular star-forming ring with diameter (1.2 kpc) made of
multiple bright SF knots, surrounding a luminous nucleus. Emission from the
nucleus and the ring are well separated in the azimuthally averaged light
profile at 33 GHz, which allows us to characterize the spatial extent of the
ring. A nuclear spiral inside the ring, which is transporting gas into the
nucleus through the ring, has been revealed with multi-wavelength observations
by Prieto et al. (2019). Our radio images also show three faint streamer-like
structures that connect the central nucleus to the ring, with the brightest
streamer on the west of the nucleus extending few arcseconds beyond the ring.
This extension has a bright counterpart in the ALMA CO(J=1-0) data, which
coincides with the contact point of a kpc gas streamer feeding in ring, as
discovered by Prieto et al. (2019). The host galaxy ( km/s) is interacting with at least
one dwarf companion (1097A: km/s; Bowen et al., 2016).
IC 342: A small asymmetric nuclear star-forming ring
( pc) made of at least four distinct SF knots is detected at all three VLA
bands. At 33 GHz, diffuse emission from the ring
covers the central region, as seen in the azimuthally-averaged light
profile. No bright nuclear emission is detected at any VLA Band, and
the ring morphology has previously been confirmed in near-IR and CO observations
(Boker et al., 1997; Schinnerer et al., 2003). Therefore we do not assign an inner radius for
this nuclear ring when calculating its SFR to account for the diffuse emission,
but the area of the synthesized beam is subtracted from the area defined by the
outer radius when estimating to account for the central
cavity. In a previous molecular gas study, Ishizuki et al. (1990) suggest that the nuclear ring
outlines the ends of a pair of molecular ridges, which may have formed due to
shock-waves from a bar-like gravitational potential.
NGC 3351: An elliptical nuclear ring ( pc) with
an inclination angle of is clearly present in images at all
three VLA bands, with two bright SF knots lying on the north and south tips of
the ring separately, accompanied by smaller, fainter SF knots on the east and
west sides. The azimuthally-averaged light profile at 33 GHz reveals a faint
nuclear component, which outlines the inner radius of the ring. This component
is most visible at 3 GHz. A comparison of the radio-detected ring with archival
Spitzer IRAC 3.6m image of the galaxy reveals a bar-like stellar structure
connecting the brightest radio “hotspots” along the north-south direction. Low
resolution () molecular observations have suggested the presence
of a molecular nuclear bar (Devereux et al., 1992), which is absent from the ALMA
CO(J=1-0) observation.
NGC 4321: The nuclear ring ( kpc) was detected at
all three bands, along with the central LINER nucleus. The ring appears fairly
clumpy, with three bright knots making up the east half of the ring and
relatively faint diffuse emission on the west half. At 3 GHz more diffuse
emission is detected, and the ring reveals itself to be part of a tightly wound
spiral structure, which is also evident in the ALMA CO(J=1-0) data. The ends of
the molecular spiral arms correspond to the location of bright SF knots, which
connects the ring to a nuclear bar that is prominent in both archival Spitzer
IRAC 3.6 m image, and CO data (Sakamoto et al., 1995). Numeric simulations
predict that such nuclear bars exert strong gravitational torques on molecular
gas to effectively feed the SMBHs and nuclear/circum-nuclear starbursts
(Wada et al., 1998).
NGC 4826: The small nuclear ring ( pc) is
most apparent at 15 GHz, where we see five distinct knots lying close together
to form a nearly circular structure. The brightest knot is the off-center LINER
nucleus (García-Burillo et al., 2003). At 33 and 3 GHz, the emission from the two fainter
knots is blended into the brighter knot in between them. The bright nuclear ring
is also closely surrounded by a series of much fainter SF regions, which
show up in the azimuthally-averaged light profile at
(250 pc) away from the center (we exclude them from our analyses). At 33 GHz,
diffuse emission from the ring covers the central region, as seen in the light
profile. No bright nuclear emission is detected at any VLA Band, and the ring
morphology has previously been confirmed in CO observation (García-Burillo et al., 2003).
Therefore we do not assign an inner radius for this nuclear ring when
calculating its SFR to account for the diffuse emission, but the area of the
synthesized beam is subtracted from the area defined by when
estimating to account for the central cavity.
NGC 1614: A clumpy, almost circular nuclear star-forming ring
( pc), made of knots with various
sizes and brightness, is detected at 33 and 15GHz. One faint elongated knot on the west extends beyond the
ring by (150 pc). A faint nucleus surrounded by the ring is also
detected at 33 GHz, which outlines the inner radius of the ring. At 3 GHz, the
ring is unresolved. Prominant dust lanes have been observed to be connected to
the northern tip of the nuclear ring where molecular gas is potentially streaming
into the ring and fueling the starbursts (Olsson et al., 2010; König et al., 2013).
NGC 1797: The ring structure is resolved for the very first time
with the GOALS equatorial survey. At 33 GHz, we clearly see three bright SF
knots connected by diffuse emission, forming an elliptical ring
( pc) with an inclination angle of . At 15 GHz,
the brightest region on the east half of the ring is further resolved into three
smaller distinct SF knots, with two brighter ones on the north connected to each
other. The ring morphology at 3 GHz follows that at 33 GHz, but the diffuse
emission connecting the east and west half the ring becomes more prominent. No
bright nuclear emission is detected at any VLA Band, therefore we do not assign
an inner radius for this nuclear ring when calculating its SFR to account for
the diffuse emission, but the area of the synthesized beam is subtracted from
the area defined by when estimating to
account for the central cavity.
NGC 7469: The ring structure ( pc)
containing five SF knots is clearly detected at 33GHz, surrounding a much
brighter Seyfert 1 nucleus, which outlines the inner radius of the ring. The
ring appears more spiral-like at 3 GHz, where the northern and southern
components are much more pronounced and extending beyond the ring. A similar
morphology is also seen in ALMA CO(J=1-0) data. Due to low angular
resolution, the ring appears as faint diffuse emission surrounding the bright
nucleus at 15 GHz. Mazzarella et al. (1994) observed the nuclear ring in the near-IR,
and found the brightest SF “hotspots” coincide with the ends of a nuclear
stellar bar revealed in K-band continuum, which may be transporting gas from the
ring to the luminous Seyfert 1 nucleus (e.g. Wada et al., 1998).
NGC 7591: The elliptical ring ( pc) has an inclination angle of , and is detected at all three bands but was only resolved with at least at 15 GHz, with the southern part of the ring brighter than the rest. At 3 and 33 GHz, the ring becomes completely unresolved. The nuclear ring has also been observed in the near-IR Paschen observations by Larson et al. (2020), but NRSF regions in the rings are resolved for the first time with the GOALS equatorial survey.
Appendix B Integrated measurements for highly elliptical rings
For all but three galaxies (NGC 1797, NGC 3351 and NGC 7591), we measured the azimuthally-averaged light profiles of each nuclear ring by computing the averaged brightness per pixel on a series of 1 pixel wide concentric circles overlaid on top of 33GHz images, with their centers aligned with the central coordinates of the host galaxy, with minor adjustments to visually match the ring center. Due to relatively high ellipticities of the nuclear rings in NGC 1797, NGC 3351 and NGC 7591, we used the following procedures to more accurately depict their light profiles: After each image is masked to only preserve emission with SNR , the coordinates of the unmasked pixels were extracted and then fitted with a 2D ellipse model using the least square fitting method suggested in Fitzgibbon et al. (1996). Note that 15 GHz image was used for NGC 7591 instead due to low resolution of the available 33 GHz image. The model describes a generic quadratic curve:
| (B1) |
where the fitted ellipse’s center coordinate , semi-major and semi-minor axes lengths and the counterclockwise angle of rotation from the x-axis to the major axis of the ellipse could be calculated as follows:
The above method works under the condition that , and , which makes Eq.B1 the general
expression for 2D ellipses. The caveat is that this method does not work well
for circular fits, therefore we only adopt it to extrapolate the
properties of the highly elliptical rings in NGC 1797, NGC 3351 and NGC 7591. Based on the
ellipticity estimated from the model fitting result, we then produced a series
of concentric 1-pixel-wide elliptical annuli to calculate the adjusted
azimuthally-averaged brightness of the ring.