Explainable Diabetic Retinopathy Detection and Retinal Image Generation
Abstract
Though deep learning has shown successful performance in classifying the label and severity stage of certain diseases, most of them give few explanations on how to make predictions. Inspired by Koch’s Postulates, the foundation in evidence-based medicine (EBM) to identify the pathogen, we propose to exploit the interpretability of deep learning application in medical diagnosis. By determining and isolating the neuron activation patterns on which diabetic retinopathy (DR) detector relies to make decisions, we demonstrate the direct relation between the isolated neuron activation and lesions for a pathological explanation. To be specific, we first define novel pathological descriptors using activated neurons of the DR detector to encode both spatial and appearance information of lesions. Then, to visualize the symptom encoded in the descriptor, we propose Patho-GAN, a new network to synthesize medically plausible retinal images. By manipulating these descriptors, we could even arbitrarily control the position, quantity, and categories of generated lesions. We also show that our synthesized images carry the symptoms directly related to diabetic retinopathy diagnosis. Our generated images are both qualitatively and quantitatively superior to the ones by previous methods. Besides, compared to existing methods that take hours to generate an image, our second level speed endows the potential to be an effective solution for data augmentation.
Code is available at https://github.com/zzdyyy/Patho-GAN.
Interpretable deep learning, explainable artificial intelligence, medical image analysis, medical image generation, generative adversarial network.
1 Introduction
Deep learning has become a popular methodology in medical imaging analysis such as diabetic retinopathy (DR) detection [1] and skin cancer classification [2]. Though these algorithms have shown high accuracy in classifying specific disease labels or regressing severity stages, most of them lack the ability to explain the decision, a common problem that haunts deep learning community. Interpretability is especially imperative for medical image application, as physicians or doctors rely on medical evidence to determine whether to trust it or not. Otherwise, a simple adversarial attack [3] may result in irreversible damage. Similar limitation also echoes in other critical applications, like autonomous vehicle [4] and face recognition [5], etc.
In this paper, we propose a novel technique inspired by Koch’s Postulates to give some insights into how convolutional neural network (CNN) based medical imaging detector makes decisions. In particular, we take the diabetic retinopathy (DR), a common cause of vision loss among people with diabetes, for example. Note that not limited to DR detector [6], this interpretation strategy could also be extended to other deep learning based medical imaging models.
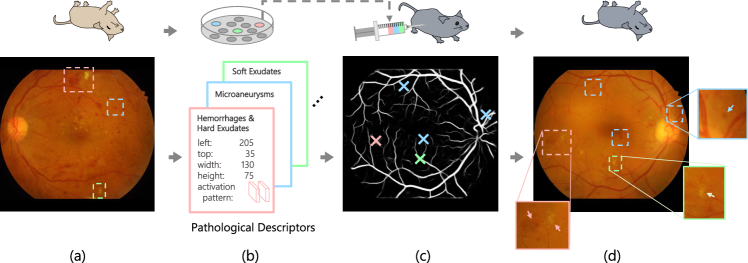
We at first define and extract pathological descriptors (Fig 1.(b)) that encode the neuron activation directly related to the prediction of the DR detector [6]. Isolating the directly relevant neurons, usually thousands, from millions of neurons in neural network is like separating the potential pathogen from diseased organism. Koch’s Postulates, the foundation of evidence-based medicine (EBM), could indirectly determine the property of the pathogen by observing the caused symptom. Specifically, as illustrated in the top row of Fig 1, the candidate pathogen is at first purified from a variety of microorganisms. If the healthy subjects injected with this pathogen consistently show the symptom, Koch’s Postulates could claim the association between the pathogen and disease. Similarly, we inject pathological descriptors into the binary vessel segmentation (Fig 1.(c)) to synthesize the medical plausible retinal image with the expected lesions. We achieve this by proposing Patho-GAN, a novel generative adversarial network (GAN) . With given pathological descriptors and binary vessel segmentation, the generated image (Fig 1.(d)) exhibits the expected symptoms with specified quantity at the designated positions, such as hemorrhages and hard exudates in the red box, microaneurysms in the blue box, and soft exudates in the green box.
Experiments on various datasets demonstrate that our generated images are both qualitatively and quantitatively superior to existing methods [7] [8]. Since our descriptors are lesion-based with spatial coordinates, we can arbitrarily manipulate these descriptors in position and quantity to generate the images with controlled type and quantity of symptoms. Fed with these generated images, the DR detecting algorithm [6] also reports the prediction consistent to the diagnose criteria. This shows our synthesized images carry the symptoms directly related to diabetic retinopathy diagnose. Moreover, the great diversity and high generating speed make Patho-GAN a potential data augmentation method for medical image analysis.
In conclusion, our main contributions are mainly three-fold:
-
1.
We define novel pathological descriptors that encode the key neuron activation directly related to the disease prediction. Each descriptor could be associated with individual specific lesion.
-
2.
Inspired by Koch’s Postulates, we propose a novel interpretability strategy to visualize the pathological descriptors by synthesizing fully controllable pathological images. The synthesized images are qualitatively and quantitatively superior to previous methods.
-
3.
With our pathological descriptors and Patho-GAN, we could generate medical plausible pathology retinal images at a greater variety, quality, and speed, which enable Patho-GAN to help improve the performance of medical tasks.
This article is an extension work of our previous conference publication [8], here we have obtained the following improvements:
-
1.
Novel Encoding Strategy. We have improved our method on lesion locating and descriptor encoding. This enhanced its ability to represent a greater variety of lesions.
-
2.
Photo-realism Enhancement. We have improved the synthesis quality by training our Patho-GAN on the dataset of DR image, rather than healthy ones. Meanwhile, our method could get rid of artifacts like the checkerboard effect in [8].
-
3.
Speed Boost. Our previous method used the descriptors in a restrictive loss function. For each new image, the whole model needed to be retrained. Here, by formulating the descriptors as input and generate the image in a forward pass, we can generate images much faster than [8]. This makes Patho-GAN a potential data augmentation method for medical image analysis.
2 Related Works
2.1 Diabetic Retinopathy Detection
Diabetic retinopathy (DR) is a common disease cause of vision loss or even blindness among people with diabetes, which affects 347 million people [9]. Human ophthalmologists rely on the type and amount of related lesions, let us say, counting the number of microaneurysms, to grade the DR severity. As a result, automatic detection is particularly needed to reduce the workload of ophthalmologists, and slow down the progress of DR by performing early diagnose on diabetic patients [1].
In 2015, a Kaggle competition [10] was organized to automatically classify retinal images into five stages according to International Clinical Diabetic Retinopathy Disease Severity Scale [11]. Not surprisingly, all of the top-ranking methods were based on deep learning. However, though achieving high sensitivity and specificity, these deep learning based methods lack the intuitive explanation for the decision. The recent methods [12, 13, 14] shifted the focus to locate the lesion position with a weakly supervised learning framework. However, these methods often relied on a large training set of lesion annotations from professional experts.
To explore the intuitive explanation, we propose a novel pathological descriptor encoding DR detector’s activated neurons directly related to the pathology. For the sake of generality, we select o_O DR detector, a CNN based method within the top-3 entries on Kaggle’s challenge. Even by now, the performance of o_O is still competent to the latest method [14].
2.2 Explainable Deep Learning
Explainable deep learning has now emerged as an important research to open the black-box of neuron networks. Existing researches mainly focus on answering the following three questions: [15, 16, 17].
How is the input processed by the network? Many efforts are devoted to training simple proxy models and emulating the network’s processing of data to discover connections between output and input. For example LIME [18] approximates a classifier locally with interpretable linear model. The proxy model is able to identify influential input regions of a network across various model and applications, and thus faithfully explains the original classifier. CRED [19] and recently extended method DeepRED [20] choose decision trees as proxy model to imitate the inference process of neural networks. More recent works [21, 22, 23] try to distill knowledge from deep models into trees, but the proxy model are more used for classification and less human-interpretable. Zhang et al. [24] propose to build semantic decision tree that encodes all potential decision modes in a coarse-to-fine manner.
How to design explainable systems? There are also researches designing self-explainable structures to achieve intrinsic interpretability. The structures include attention based CNN layers, modules, or other particularly designed pipelines. Li et al. [17] propose a slot attention-based classifier for transparent yet accurate classification, which provide positive or negative explanation for a certain category. Chenet al. [25] insert a layer of prototype correlation, making decisions by finding prototypical parts and combining evidence like human experts. Zhang et al. [26] disentangle “the mixture of pattern” in same filter by a specific loss restriction and build an interpretable object classification network. These self-explainable technique has been applied to DR detection. Zoom-in-Net [13] uses generated attention map to automatically discover suspicious regions for a double check, some of which are meaningful lesions. AFN [14] presents Center-Sample detector in the pipeline to evidently find lesions in retinal images through feature space clustering, and fuses lesion map with original retinal image in Attention Fusion Network. They achieve state-of-the-art accuracy while providing enough explanations.
What information does the network contain? Given an existing successful neuron network, how to decode its layer- or neuron-level representation has attracted much attention. [15, 17]. Perturbation-based methods perturb the input data to analyze the consequent change in the neuronal activity. Occlusion [27] occludes part of the input image with a sliding window, while RISE [28] applies random masks on the input. By modifying input and observing how the neurons change, these methods link neuronal activation with specific input patterns. Optimization methods [29, 30] directly optimize input image to maximize specific neurons. The optimized image shows what pattern can most activate the neurons.
Back-propagation methods like CAM [31], GradGAM [32], GradCAM++ [33] and DeepLIFT [34] produce heat maps with (gradient-based) back-propagation to visualize the discriminant regions for class prediction. A back-propagation method [27] uses Deconvolution to restore images from features in different layers, giving insight on layer-wise interpretation in deep networks. A variant method Guided BackPropagation [35], also known as guided saliency, can be used for visualizing features learned by CNNs, which can also be applied to a broad range of network structures.
Besides the attributive explanation for one example, there are more methods solving new multi-example tasks[36, 37].
To enhance the mutual understanding between the community of artificial intelligence and clinical medicine, we propose a novel framework to explain the neuron-level representation following the methodology of evidence-based medicine (EBM). Though the framework is evaluated on Diabetic Retinopathy Detection [10], it could be easily applied to explain other medical deep learning algorithms. We at first automatically identify the neuron representation that encodes the symptom information that contributes to the disease classification. Then by synthesizing lesions in encoded DR descriptors, we are able to associate pathological lesions with related neuron activation patterns.
2.3 Generative Adversarial Networks
Generative Adversarial Networks (GANs) [38] were first proposed in 2014, adopting the idea of zero-sum game, to generate realistic images. Subsequently, CGANs [39] attempted to use additional information to make the GAN controllable. More recent methods use GAN in image-to-image translation. Pix2pix [40] used the U-Net [41] combined with adversarial training and achieved amazing results. CycleGAN [42] used two sets of GANs and added cycle loss to achieve style transfer on unpaired data. These methods have been applied in many medical image processing tasks such as PET-CT translation, correction of MR motion artefacts and PET image denoising [43]. Besides, attempts of cross-modal translation [44] will shed light on mutual understanding between medical text and images.
2.4 Synthesizing Biomedical Images
Traditionally, the biomedical images were synthesized through the medical and biological prior knowledge accumulated by humans. Combined with complex simulation methods, realistic results could be produced [45, 46, 46, 47, 48, 48, 49].
With the development of generative models such as GAN and deep neural style transfer, Tub-sGAN [7] began to synthesize realistic retinal and neuronal images in a data-driven way. It synthesized images with style from a reference retinal image and with vessels from a binary segmentation map [50, 51]. Although their generated images could show pleasant visual appearance, the diabetic retinopathy symptoms and retina physiological details are either lost or incorrect as verified by the ophthalmologists [8]. And for a new reference retinal image, it spends dozens of minutes in training new generator.
A more recent work, DR-GAN [52], can synthesize high-resolution DR images by introducing multi-scale spatial and channel attention module, while keeping a reasonable DR severity grade by specially designing the latent space and classification loss. DR-GAN is fed with retinal structure and lesion masks, as well as a latent code of given severity. It generates retinal fundus with lesions specified with mask and severity. Different from DR-GAN that focus on improving the synthesizing quality through GAN, our proposed method is an interpretability work that explains “how an image is being classified”. To achieve this end, we synthesize the descriptors automatically extracted from the DR detector and generate vivid lesions that are clinically related to DR. Different from DR-GAN that relies on the input of lesion mask, our method automatically encodes the descriptors from DR images without explicitly knowing these leision information. Our Patho-Gan could then synthesise these lesions in new images. With the descriptors encoding the neuron representation, we could arbitrarily manipulate the lesion types, number, and locations when generating the image.
3 Pathological Descriptor
In this section, we will describe how to extract lesion based pathological descriptor to encode the activated neurons of Diabetic Retinopathy (DR) detector [6].
3.1 DR Detection Network
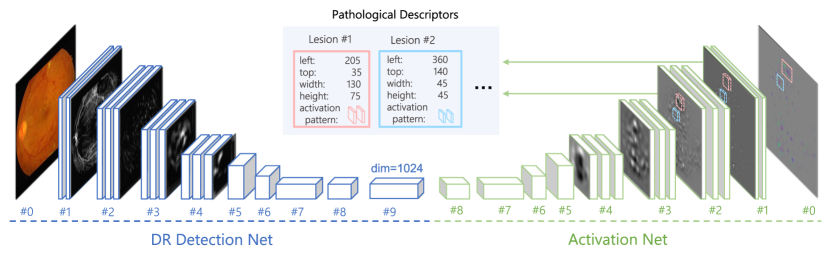
Here, we briefly introduce o_O DR detector [6] used in this paper. It takes retinal fundus image as input and outputs the 5 grades (0-4) diabetic retinopathy severity . As shown in the left part of Fig 2, the DR detection network is stacked with several blocks. Each block consists of 2-3 convolutional layers and a pooling layer. As the number of layers increases, the network merges into a bottleneck feature . Finally, is fed into a dense layer (not shown in the figure) to predict the severity label . The DR detector is denoted as a function .
The network is trained on Kaggle DR dataset [10] with Nesterov momentum over 250 epochs. Data augmentation methods, such as dynamic data re-sampling, random stretching, rotation, flipping, and color augmentation, are all applied.
After the training, the DR detector have learned whether to diagnose an image as DR. We will keep going and explore why the DR detector give such diagnosis.
3.2 Activation Network
Among millions of neurons in the network, only thousands of them actually contribute to the bottleneck feature’s activation and the final prediction. To explore the attributed activity of these neurons, we perform a back-propagation-liked procedure [27] from the -dimensional bottleneck feature to get activation projections for each DR detector’s feature layer , which encodes the impact of each neuron to the bottleneck feature [8]. Thus, we back propagated through each layer to build an symmetric network which we called Activation Net.
As shown in the right part of Fig 2, our activation net is a reversed version of the DR detector with the replicated weights. For each layer in the detector, there is a corresponding reverse layer in the activation net, with the same configuration of strides and kernel size: (1) For a convolutional layer, the corresponding layer performs transposed convolution, which shares the same weights, except that the kernel is flipped vertically and horizontally; (2) For each max pooling layer, there is an unpooling layer that conducts a partially inverse operation, where the max elements are located through a skip connection (not shown in the figure) and non-maximum elements are filled with zeros; (3) For a ReLU function, there is also a ReLU in the activation net, which drops out the negative activation projection; (4) The fully connection dense layer can be treated as a convolution. In the implementation, we use auto-differentiation provided in Tensorflow [53] to conduct back-propagate for each layer.
3.3 Explanation of DR Detection
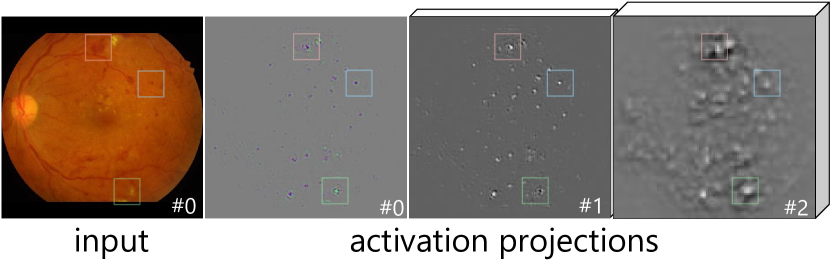
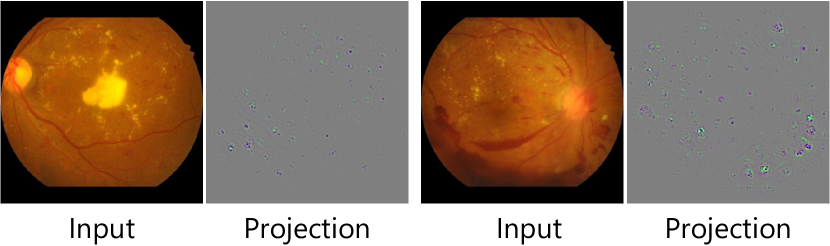
Here in Fig 3, we illustrate an input image and its activation projections in 3 different layers, #0, #1, and #2. From the input layer #0 to the activation projection layer #0, only the lesion regions arise obvious activation (such as the hemorrhages in blue and pink boxes, and the exudates in green boxes). This locality allows us to associate each activated immediate surrounding in the with a specific DR lesion in .
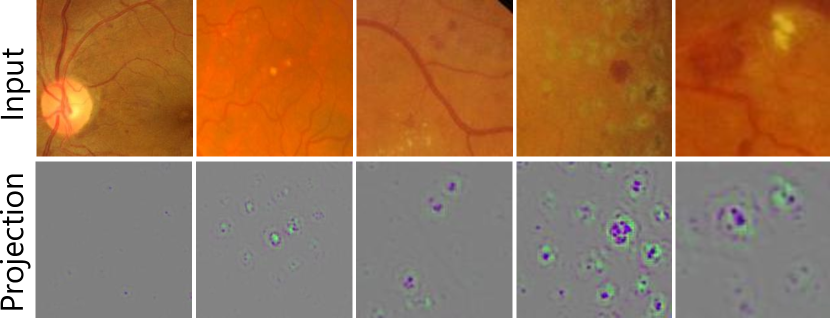
Fig 5 gives more examples on various types of lesions along with their activation projections. We could observe that ignores the the normal physiological region and only responses on the abnormal regions with microaneurysms, hard exudates, hemorrhages and soft exudates. Very interesting, as as shown in Fig 5, does not response to the large-region exudates or hemorrhages, because the existence of microaneurysms are sufficient for o_O detector to make diagnose. This shows that o_O detector can predict severity without detecting large ones.
The selective response of activation projections on the lesion indicates that our method could spatially recognize meaningful lesion patterns without the pixel-wise pathological annotation for training. In the meantime, the symptoms selected by the DR detector is also consistent with the ophthalmologists used for diagnose [8]. Based on this observation, we aim to encode the neuron activation pattern that is directly related to the disease diagnose as an analogy of isolating the pathogen in Koch’s postulates.
3.4 Retinal Pathological Descriptor
As the neuron activation projection is spatially correlated with the retinal lesions in , we could define pathological descriptor set to encode the coordinates, dimensions and activation patterns of individual lesion . These lesions serve as the evidence for both ophthalmologists and DR detector to make diagnosis.
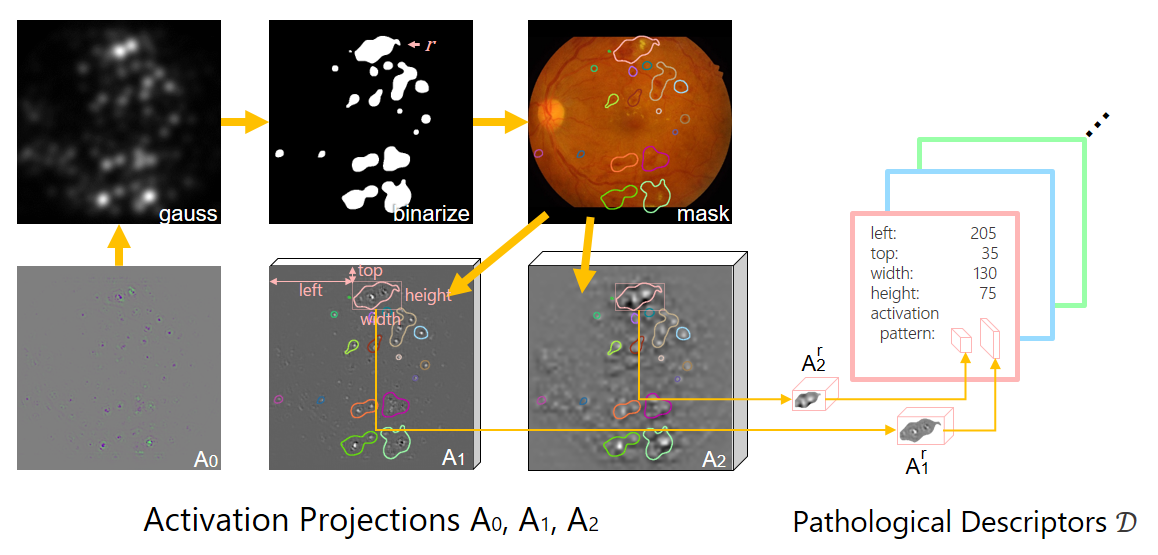
Fig 7 illustrates how the pathological descriptors are extracted: (1) To locate a lesion, we process the last layer activation by Gaussian blur with before thresholding it with Otsu’s method [54]. Thus we get a binary mask where different lesions are separated. (2) For each lesion, we enclose it with a minimal bounding box, like the pink one in Fig 7. (3) We extract vectors of activation projection in the bounding box to get the activation pattern . As shown in Fig 7, we collect the neuron outputs and from activation projection layers and in the array of bounding box. (4) With the bounding box coordinates, dimensions and activation patterns, we could define a pathological descriptor for each lesion . (5) Finally, by repeating step 2-4, we could get descriptors for every lesion in , forming a descriptor set .
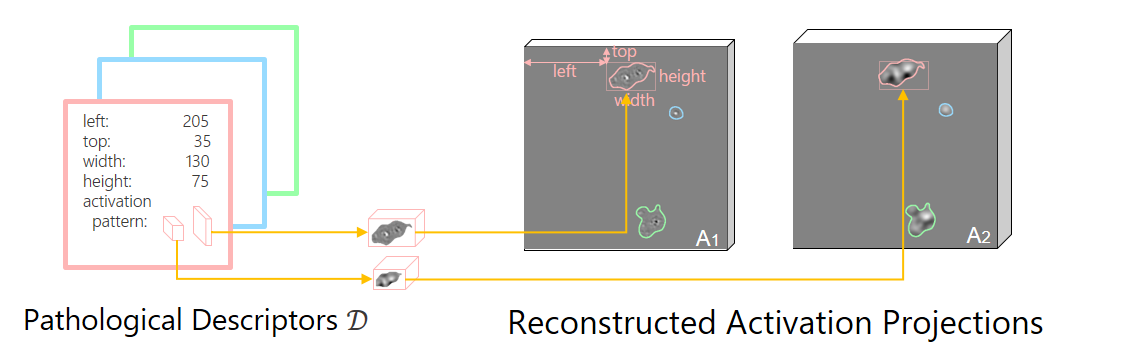
In summary, for an fundus image , we can extract a set of descriptors , which encodes the coordinates, dimensions and activation patterns of lesions in . Furthermore, descriptors can be used to reconstruct activation projections by inserting the encoded lesion associated neuron action into the activation maps (Fig. 7).
4 Visualizing Pathological Descriptor
According to Koch’s Postulates, although the pathogen is invisible (at least to the naked eye), its properties could be determined by observing the symptoms on the subject after injecting the purified pathogen. Similarly, we evaluate and visualize the interpretative medical meaning of this descriptor by our novel Patho-GAN to generate fully controllable DR fundus images. Our goal is to synthesize the diabetic retinopathy fundus images (Fig 1.(d)) that carry the lesions that appear on the pathological reference one (Fig 1.(a)). Since our descriptor is lesion based, we could even arbitrarily manipulate the number and position of different symptoms. We show the overview of our pipeline in Fig 8, and details in Fig 9.
4.1 Patho-GAN Overview
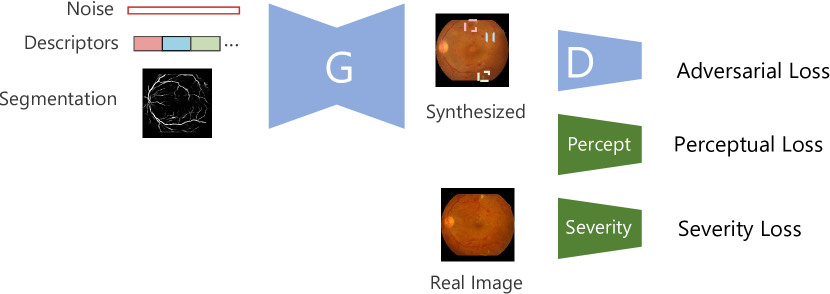
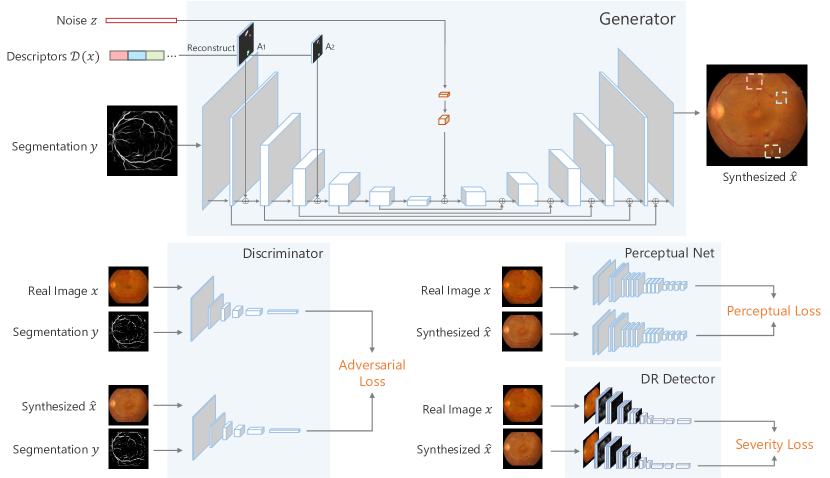
As shown in Fig 8, the generator network synthesizes a retinal image with vessels in an segmentation map and controlled symptoms in descriptors. To train the generator network, we add three sub-nets: the discriminator net, the perceptual net, and the DR detection net, as well as three related losses. The discriminator net is trained with the generator, distinguishing the synthesized images from the real ones to compete with and thus improves the generator. To further enhance the pathological and physiological details, we use the pre-trained perceptual net to constrain the detail reconstruction. We also introduce pre-trained DR detector to ensure the synthesized image exhibits the plausible symptoms. Different from the generator and discriminator, our perceptual net and DR detector are fixed and not updated during the training. After the model is trained, the generator could easily obtain synthesized fundus in one forward pass given the vessel segmentation, descriptors, and a noise vector.
4.2 Generator Network
Generator network takes a vessel segmentation image , descriptors and a noise code as input, where and provide physiological and pathological information respectively, and is used to provide randomness that models conditional image distribution. The output is a synthesized diabetic retinopathy fundus image . The entire image synthesis process can be expressed as a function .
As shown in Fig 9, we use a U-shaped encoder-decoder network [41] structure for the generator. The input vessel segmentation is down-scaled by 6 blocks of Convolution-BatchNorm-LeakyRelu, with kernel size 4 (or 3), stride 2, and no pooling layers. The input descriptors are used to reconstruct activation projections, which are then concatenated into the down-sampling process. The random noise is fully connected and convolved into a block, and then concatenated into the bottleneck layer of the generator. For the up-scaling part, we choose to pile 6 blocks of Resize-Convolution-BatchNorm, rather than Transposed Convolution-BatchNorm in [7] to avoid checkerboard artifacts [55]. To help retain details in the input segmentation and descriptors, skip connections from down-scaling features to up-scaling blocks are also considered in the network.
4.3 Discriminator Network
The discriminator net tries to distinguish the synthesized images from the real ones. Similarly, we can also define the discriminator as a discriminant function , . When is the real image , should tend to 1 and when is the composite image , should tend to 0. Structurally in Fig 9, the detector is also built with 5 blocks of Convolution-BatchNorm-LeakyRelu, with kernel size 4 (or 3), stride 2, and no pooling layers.
4.4 Loss Settings
We follow the GAN’s strategy and solve the following optimization problem that characterizes the interplay between and :
| (1) |
where is the adversarial loss, with and being perceptual loss and severity loss.
4.4.1 Adversarial Loss
Adversarial loss is computed on real and synthesized images: . To be more specific, learning the discriminator parameter amounts to maximizing the adversarial loss . As for the generator, parameter is learned by minimizing a loss where is a simplified adversarial loss computed only on generated image:
| (2) |
4.4.2 Perceptual Loss
Perceptual Loss is the divergence of real image and synthesized image measured in the feature space of the perceptual net. This is designed to help the reconstruction of both pathological and physiological details.
We choose a pre-trained VGG-19 [56] as the implementation of perceptual net. For specific layer and VGG feature extraction function , we define perceptual loss as:
| (3) |
4.4.3 Severity Loss
The severity loss is introduced to make the synthesized image medically equivalent to the reference real image . Specifically, we constrain the synthesized image to have the same severity level with real image . The severity divergence is measured with trained DR detector o_O, and the severity loss is defined as:
| (4) |
4.5 Implementation Details
The chosen norm in above equations is L1. Noise dimension is 400. Weights for different losses are . Based on experience, we set to be the second convolutional layer in the fourth block of VGG-19.
The batch size is set to 1. Before each training step, the input image values are scaled to , and a random rotation is performed on the input. The training is done using the ADAM optimizer [57] and the learning rate is set to 0.0002 for the generator and 0.0001 for the discriminator. In order to ensure that generator and discriminator are adapted, we update generator twice then update discriminator once. During training, the noise code is sampled element-wise from zero-mean Gaussian with standard deviation 0.001; At testing run, it is sampled in the same manner but with a different standard deviation of 0.1. The training finishes after 1000 epochs.
5 Experiment Results
5.1 Datasets
There are several datasets of fundus image online available, such as DRIVE [58], Kaggle (EyePACS) [10], IDRiD [59], Retinal-Lesions [60] and FGADR [61]. DRIVE [58] contains 40 fundamental retinal images with pixel-level vessel segmentation, but there are few lesions on images. The Kaggle (EyePACS) [10] contains 88.7k retinal images of 5 levels DR grades (including non DR). Each image is labelled with a DR grade. To further boost the DR research, IDRiD [59] provides pixel-wise segmentation of 4 types of lesions on 81 images. Retinal-Lesions datasets [60] annotates up to 8 kinds of lesions with circle regions. Recently, FGADR [61] released 1842 images with pixel-wise segmentation of 6 kinds of lesions. We summarize the attributes of datasets in TABLE 1.
| Dataset Name | DR Lesion Annotation | Vessel Segmentation | Resolution | Number of Images |
|---|---|---|---|---|
| DRIVE [58] | (No DR) | Yes | 584565 | 20 train + 20 test |
| EyePACS Kaggle [10] | Only severity levels | No | 1444144421843456 | 35.1k train + 53.6k test |
| IDRiD [59] | Pixel-wise lesion segmentation | No | 42882848 | 54 train + 27 test |
| Retinal-Lesions [60] | Lesion annotation in circle & severity levels | No | 896896 | 337 train + 1256 test |
| FGADR [61] | Pixel-wise lesion segmentation & severity levels | No | 12801280 | 500 train + 1342 test |
5.2 Synthesizing Images from Descriptors
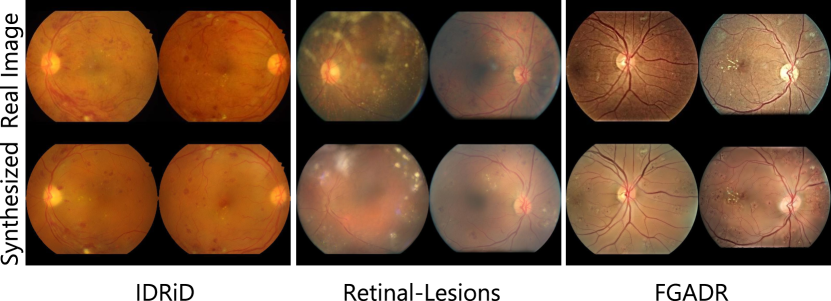
Since the images of IDRiD, Retinal-Lesions, FGADR contain a great variety of DR lesions, we use their retinal images for training Patho-GAN. The images are partitioned into train/test sets as described in TABLE 1. Before our experiments, the dataset images are firstly downscaled to 512 512 real images . For the interpretation of the pre-trained DR detector, descriptors are extracted from corresponding retinal image by o_O DR detector, without accessing any lesion annotations in datasets. Since vessel annotation is not provided by these datasets, we compute the related binary vessel segmentation through SA-UNet[51] pre-trained on lesion-free DRIVE dataset. The 400-dimension noise is randomly sampled where . With real images in the train-set, vessel segmentation and noise , we trained 3 Patho-GAN models on IDRiD, Retinal-Lesions, and FGADR respectively.
In testing phase, with test-set image as a reference, we input , and into trained generators to get synthesized fundus . Same with [7, 8, 52], in order to keep same field of view (FOV), the generated images are cropped with the same FOV boundary of the reference image before visualization. Some pairs of real image and generated image are presented in Fig 10, showing that Patho-GAN can reconstruct a variety of photo-realistic lesions, including microaneurysms, hemorrhages, soft and hard exudates, with the similar locations and appearance.
5.3 Lesion Manipulations
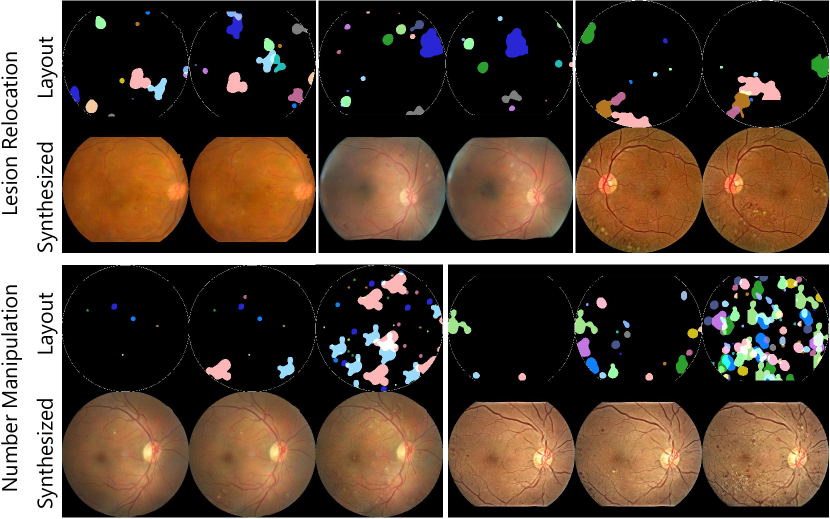
Since our descriptors are designed as lesion-based with spatial coordinates, we could manipulate lesions’ positions by modifying their coordinates, and manipulate lesions’ numbers by cloning or removing specific descriptors. Here, we demonstrate some results.
5.3.1 Lesion Relocation
We could arbitrarily relocate individual lesion to any position by controlling the coordinates (left and top distance) of descriptors. The modified descriptor layout and synthesized images are shown in row 1 and 2 of Fig 11. Note that images in each group are generated with same vessel segmentation and descriptors as input, except that the descriptor coordinates are different. We could see the lesions relocate their positions according to the given coordinates.
5.3.2 Number Manipulation
By cloning or removing some of the input descriptors, we can control the amount of synthesized lesions, i.e., decreasing or increasing their number. Row 3 and 4 of Fig 11 demonstrate the result of lesion number manipulation. In each group shown here, we generate lesions of 3 different amount: less, middle, and more lesions. Middle lesions are synthesized with original descriptor layout. We randomly remove descriptors in the original layout to generate less lesions. We clone each of the descriptors by several times and randomly distribute them to generate more lesions.
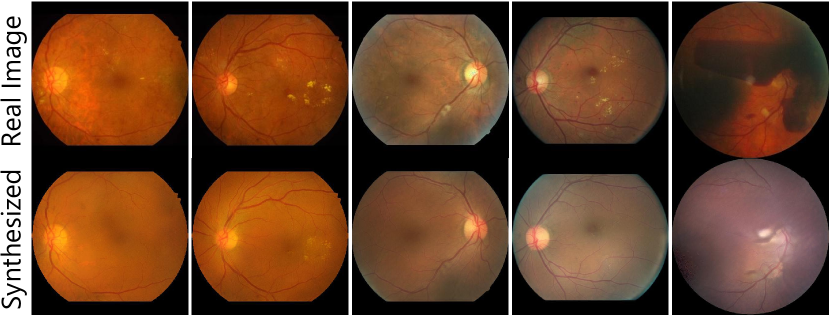
An interesting observation is that we could even eliminate existing lesions in a DR retinal image by inputting no (empty) pathological descriptors. As shown in Fig 12. Row 1 are the original retinal images with DR, while row 2 are synthesized with no descriptors. The pathological symptoms in row 1 almost disappeared in row 2.
5.4 Medical Interpretation
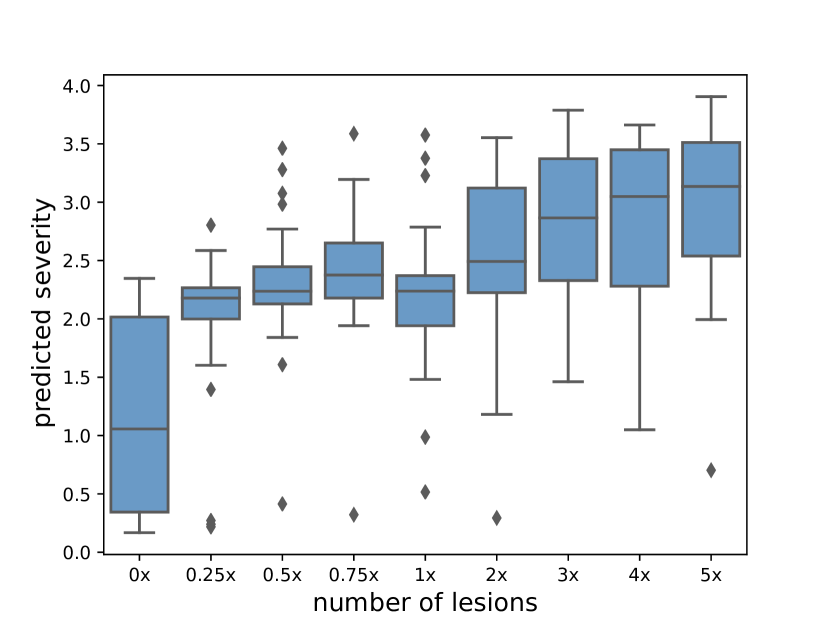
We also evaluate the synthesized images on the o_O DR detector [6] to evaluate its DR severity on the image level. According to [11], number of lesions like microaneurysms is an important criteria for the severity diagnose. Here we manipulate the number of lesions on retinal images and report the severity prediction by o_O DR detector [6].
IDRiD consists of 27 test images with 4 type of lesions including microaneurysms, hemorrhages, hard and soft exudates, and each image has enough and even amount of DR lesions. So we choose IDRiD for this experiment. Using the number manipulation method described in last section, we modify each IDRiD test image by removing or multiply the original descriptors , generating different amount of lesions varying from 0 to 5 times of the original number. Specifically, we randomly remove 100%, 75%, 50%, 25%, 0% from to generate image with less (0x, 0.25x, 0.5x, 0.75x) or equal (1x) lesions. We multiple descriptors in this image by 2 to 5 times to generate more (2x, 3x, 4x, 5x) lesions. The statistics of predicted DR severity are reported in the box plot Fig 13. As a result, by increasing the lesion number, o_O DR detector [6] also returns a result with increasing severity, consistent with the medical interpretation [11].
5.5 Qualitative Evaluation
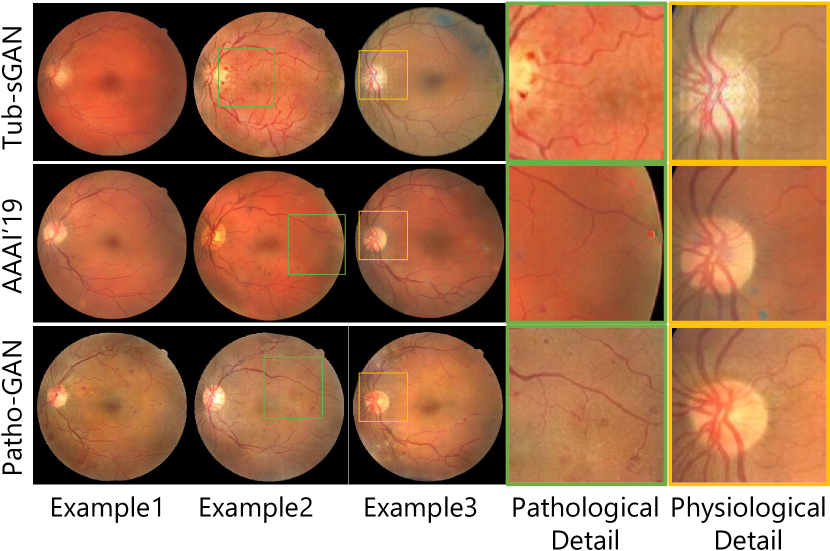
In this subsection, we compare our Patho-GAN together with two related generation methods, Tub-sGAN [7] and our previous work [8] in Fig 14. Pathologically (in col 4), Tub-sGAN can not synthesize lesions, or gets wrong lesions, while [8] generates scattered and sometimes unreal lesions. However, our Patho-GAN synthesizes realistic lesions with various visual appearances. Physiologically (in col 5), our generated results have clear boundaries of optic disc, and get rid of checkerboard artifacts (repeated grid patterns) mainly caused by transposed-convolution up-sampling. As a conclusion, the images we generate are more photo-realistic in both pathological symptoms and physiological details.
5.6 Quantitative Evaluation
Here we also perform quantitative evaluation on Patho-GAN and other related methods [7] [8]. We generate images using these methods on IDRiD, Retinal-Lesions and FGADR, and evaluate the similarity between generated images and real images using Freshet Inception Distance (FID) and Mean Squared Error (MSE). Freshet Inception Distance (FID) is usually adopted to statistically measure the divergence of two image sets, while Mean Squared Error (MSE) measures the pixel-wise average difference of two images or one-to-one related image sets. The results in TABLE 2 indicate that we have better score than previous works, and that Patho-GAN generates more similar retinal images to real images.
Methods IDRiD Retinal-Lesions FGADR FID MSE FID MSE FID MSE Tub-sGAN [7] 111.36 0.0119 69.42 0.0250 40.67 0.0154 [8] 117.82 0.0128 40.76 0.0214 95.06 0.0146 Patho-GAN4×4 81.16 0.0093 22.28 0.0144 20.34 0.0115 Patho-GAN3x3 80.13 0.0086 24.37 0.0149 21.11 0.0107
* Subscription is the convolution kernel size ( or ) of Patho-GAN.
5.7 Ablation Study of Perceptual Loss
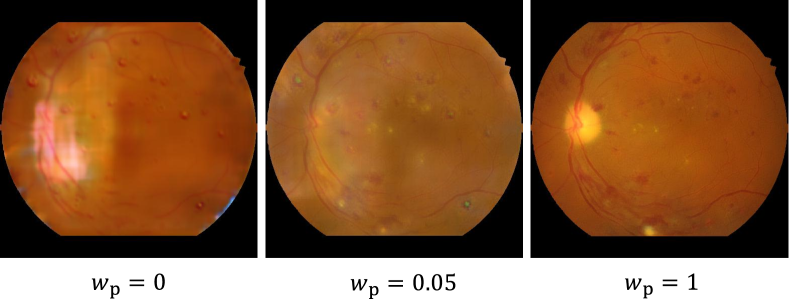
To evaluate the perceptual loss on the reconstruction of both pathological and physiological details, we conduct the ablation analysis of perceptual loss by adjusting its weights .
As shown in Fig 15, when reducing the weight of perceptual loss, the synthesized vessels and optic discs start to blur. The generated lesions become unreal while the background noises in the image increase. In summary, perceptual loss plays a key role in restraining the generator to learn pathological and physiological details effectively.
5.8 Computational Efficiency
To synthesize images of a new style or descriptors, both Tub-sGAN [7] and previous method [8] need to train a whole new generator network with the new lesion style or layout in the training loss. This usually takes 0.5 - 2 hours using 1 GPU of Nvidia Titan Xp.
By taking descriptors as network input, Patho-GAN can generate images with new descriptors through the inference in less than 1 second. The speedup endows our method the potential for data augmentation in medical imaging analysis.
6 Discussion
6.1 Interpretability obtained with Patho-GAN
Here we briefly talk about the interpretability attained with our framework.
The DR detector focus on lesions. In this paper, we try to interpret deep learning DR detector using a methodology like Koch’s Postulates illustrated in Fig 1. We first extract pathological descriptors from a retinal image to describe the positions, dimensions and appearances of DR lesions, and then prove the effectiveness of descriptors by reconstructing lesions from them faithfully. According to the Koch’s Postulates we conclude that the neuron activate pattern is closely related with the pathological lesions.
The visualized activation projections in Fig 3 and Fig 5 show high correlation with the original images in lesion areas, and moreover it is able to locate lesions in an unsupervised manner. As Fig 5 indicates, large-region lesions are not distinguishable from the activation projections as DR detector is able to make the diagnose only based on microaneurysms. Patho-GAN faithfully interprets the network by only generating small pathological symptoms (microaneurysms) without synthesizing large pathological symptoms (exudates or hemorrhage) in Fig 16. Accordingly, Patho-GAN provides a perspective on how the o_O DR detector perceive an retinal image: it can predict severity without detecting large lesions.
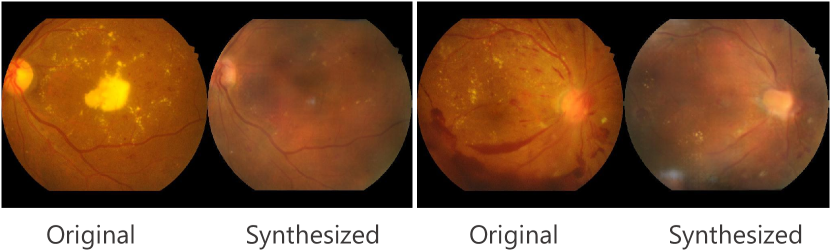
The DR detector is sensitive to various kinds of lesions. As shown in Fig 10, the retinal image reconstruction method Patho-GAN could generate different types of lesions. And further proven by lesion manipulations in Fig 11, the generated lesions are synthesized from pathological descriptors. To conclude, descriptors contain information of various kinds of lesions, leading to the explanation that the DR detector is sensitive to various lesions.
The DR detector is consistent with the medical interpretation. In the experiment of medical interpretation, we tried to generate retinal images of different lesion counts and feed them into DR detector. The results in Fig 13 demonstrate that, when introducing more lesions, the o_O DR detector [6] returns a result with increasing severity consistent with the medical interpretation [11].
Apart from the interpretability, Patho-GAN itself is superior to existing generating methods on the qualitative evaluation, quantitative evaluation, and computational efficiency. Fig 14 compares retinal images generated using Patho-GAN and related methods. Patho-GAN generates high-quality images with realistic lesions and without checkerboard artifacts. Table 2 shows that Patho-GAN generates more similar images to the real ones in the sense of FID and MSE. Finally, the computational speed is also much faster compared to [8].
6.2 Network Architecture and Parameter Settings
The medical interpretation result in Fig 13 proves the effectiveness of severity loss in keeping grades. The ablation study in Fig 15 implies the importance of perceptual loss in preserving physiological and pathological structures.
Gaussian noise code z is used in CGAN [39] to model conditional distributions of the real data that avoids deterministic output. When it comes to image synthesis, as pix2pix [40] finds, generator simply learns to ignore the noise. In our experiments, noise z mainly contributes to the brightness of retinal background, and contributes not much to the stochasticity and variety of physiological structures and lesions. The perfect reconstruction of retinal background colors and appearance needs further research.
Most of the parameter settings are inhered from our previous work [8], or chosen empirically. For example, the convolution kernel size of and . The setting is inherited from Tub-sGAN [7] and originated from pix2pix [40] and DCGAN [62], which is only a convention in GAN and style transfer area. We have tried to train Patho-GAN with kernel of and . The FID and MSE scores between real images and generated images are reported in TABLE 2. Patho-GAN trained with different kernel sizes get similar better scores compared to previous method Tub-sGAN [7] and AAAI’19 [8]. Different kernel sizes work equally well.
6.3 Future Works
In future works, our interpretation framework is not limited to medical tasks such as DR detection. It also applies on broader critical applications such as medicine, banking and self-driving automobiles. Our method has the potential to enhance decision reliability, algorithm fairness, and ensure network performance of general CNN models.
7 Conclusion
To exploit the network interpretability in medical imaging, following similar methodology to Koch’s Postulates, we propose a novel strategy to encode pathological descriptors from the activated neurons directly related to the prediction, and a GAN based visualization method, Patho-GAN, to visualize the pathological descriptor into a pathology retinal image from an unseen binary vessel segmentation. The images we generated have shown medical plausible and controllable symptoms, proving that specific lesions are directly related to the DR grade prediction. This explainable work helps medical community to further understand on how deep learning makes prediction and encourage more collaboration.
Acknowledgment
This work was supported by National Natural Science Foundation of China (NSFC) under Grant 61972012 and JST, ACT-X Grant Number JPMJAX190D, Japan.
References
- [1] Gulshan, Peng, Coram, and et al, “Development and validation of a deep learning algorithm for detection of diabetic retinopathy in retinal fundus photographs,” JAMA, vol. 316, no. 22, pp. 2402–2410, 2016.
- [2] A. Esteva, B. Kuprel, R. A. Novoa, J. Ko, S. M. Swetter, H. M. Blau, and S. Thrun, “Dermatologist-level classification of skin cancer with deep neural networks,” Nature, vol. 542, p. 115, Jan. 2017.
- [3] X. Ma, Y. Niu, L. Gu, Y. Wang, Y. Zhao, J. Bailey, and F. Lu, “Understanding adversarial attacks on deep learning based medical image analysis systems,” Pattern Recognition, vol. 110, p. 107332, 2021.
- [4] Y. Tian, K. Pei, S. Jana, and B. Ray, “Deeptest: Automated testing of deep-neural-network-driven autonomous cars,” in Proc. of the 40th international conference on software engineering, 2018, pp. 303–314.
- [5] J. R. Williford, B. B. May, and J. Byrne, “Explainable face recognition,” in European Conf. on Computer Vision. Springer, 2020, pp. 248–263.
- [6] M. Antony, “Team o_O solution for the kaggle diabetic retinopathy detection challenge,” https://www.kaggle.com/c/diabetic-retinopathy-detection/discussion/15807, 2016.
- [7] H. Zhao, H. Li, S. Maurer-Stroh, and L. Cheng, “Synthesizing retinal and neuronal images with generative adversarial nets,” Medical image analysis, vol. 49, pp. 14–26, 2018.
- [8] Y. Niu, L. Gu, F. Lu, F. Lv, Z. Wang, I. Sato, Z. Zhang, Y. Xiao, X. Dai, and T. Cheng, “Pathological evidence exploration in deep retinal image diagnosis,” in Proceedings of the AAAI conference on artificial intelligence, vol. 33, no. 01, 2019, pp. 1093–1101.
- [9] G. Danaei, M. Finucane, Y. Lu, G. Singh, M. Cowan, C. Paciorek, J. Lin, F. Farzadfar, Y. Khang, G. Stevens et al., “National, regional, and global trends in fasting plasma glucose and diabetes prevalence since 1980: systematic analysis of health examination surveys and epidemiological studies with 370 country-years and 2.7 million participants,” The Lancet, vol. 378, p. 31–40, 2011, n/a.
- [10] Kaggle, “Kaggle diabetic retinopathy detection challenge,” https://www.kaggle.com/c/diabetic-retinopathy-detection, 2015.
- [11] American Academy of Ophthalmology, “International clinical diabetic retinopathy disease severity scale,” https://www.icoph.org/dynamic/attachments/resources/ diabetic-retinopathy-detail.pdf, 2002.
- [12] Y. Yang, T. Li, W. Li, H. Wu, W. Fan, and W. Zhang, “Lesion detection and grading of diabetic retinopathy via two-stages deep convolutional neural networks,” in MICCAI 2017, M. Descoteaux, L. Maier-Hein, A. Franz, P. Jannin, D. L. Collins, and S. Duchesne, Eds. Springer International Publishing, 2017.
- [13] Z. Wang, Y. Yin, J. Shi, W. Fang, H. Li, and X. Wang, “Zoom-in-net: Deep mining lesions for diabetic retinopathy detection,” in MICCAI. Springer, 2017, pp. 267–275.
- [14] Z. Lin, R. Guo, Y. Wang, B. Wu, T. Chen, W. Wang, D. Z. Chen, and J. Wu, “A framework for identifying diabetic retinopathy based on anti-noise detection and attention-based fusion,” in International Conference on MICCAI. Springer, 2018, pp. 74–82.
- [15] L. H. Gilpin, D. Bau, B. Z. Yuan, A. Bajwa, M. Specter, and L. Kagal, “Explaining explanations: An overview of interpretability of machine learning,” in 2018 IEEE 5th International Conference on data science and advanced analytics (DSAA). IEEE, 2018, pp. 80–89.
- [16] P. Linardatos, V. Papastefanopoulos, and S. Kotsiantis, “Explainable AI: A review of machine learning interpretability methods,” Entropy, vol. 23, no. 1, p. 18, 2021.
- [17] L. Li, B. Wang, M. Verma, Y. Nakashima, R. Kawasaki, and H. Nagahara, “SCOUTER: Slot attention-based classifier for explainable image recognition,” arXiv preprint arXiv:2009.06138, 2020.
- [18] M. T. Ribeiro, S. Singh, and C. Guestrin, ““Why should I trust you?” Explaining the predictions of any classifier,” in Proceedings of the 22nd ACM SIGKDD international conference on knowledge discovery and data mining, 2016, pp. 1135–1144.
- [19] M. Sato and H. Tsukimoto, “Rule extraction from neural networks via decision tree induction,” in IJCNN’01. International Joint Conference on Neural Networks. Proceedings (Cat. No. 01CH37222), vol. 3. IEEE, 2001, pp. 1870–1875.
- [20] J. R. Zilke, E. L. Mencía, and F. Janssen, “Deepred–rule extraction from deep neural networks,” in International Conference on Discovery Science. Springer, 2016, pp. 457–473.
- [21] G. Hinton and N. Frosst, “Distilling a neural network into a soft decision tree,” CEx@AI*IA, 2017.
- [22] S. Tan, R. Caruana, G. Hooker, and Y. Lou, “Distill-and-compare: Auditing black-box models using transparent model distillation,” in Proceedings of the 2018 AAAI/ACM Conference on AI, Ethics, and Society, 2018, pp. 303–310.
- [23] M. Wu, M. Hughes, S. Parbhoo, M. Zazzi, V. Roth, and F. Doshi-Velez, “Beyond sparsity: Tree regularization of deep models for interpretability,” in Proceedings of the AAAI Conference on Artificial Intelligence, vol. 32, no. 1, 2018.
- [24] Q. Zhang, Y. Yang, H. Ma, and Y. N. Wu, “Interpreting cnns via decision trees,” in Proceedings of the IEEE/CVF Conference on Computer Vision and Pattern Recognition, 2019, pp. 6261–6270.
- [25] C. Chen, O. Li, C. Tao, A. J. Barnett, J. Su, and C. Rudin, “This looks like that: deep learning for interpretable image recognition,” 2018.
- [26] Q. Zhang, X. Wang, Y. N. Wu, H. Zhou, and S.-C. Zhu, “Interpretable CNNs for object classification,” IEEE Transactions on Pattern Analysis and Machine Intelligence, 2020.
- [27] M. D. Zeiler and R. Fergus, “Visualizing and understanding convolutional networks,” in ECCV. Springer, 2014, pp. 818–833.
- [28] V. Petsiuk, A. Das, and K. Saenko, “RISE: randomized input sampling for explanation of black-box models,” in British Machine Vision Conference 2018, BMVC 2018, Newcastle, UK, September 3-6, 2018. BMVA Press, 2018, p. 151.
- [29] A. Mahendran and A. Vedaldi, “Visualizing deep convolutional neural networks using natural pre-images,” International Journal of Computer Vision, vol. 120, no. 3, pp. 233–255, 2016.
- [30] A. Nguyen, J. Yosinski, and J. Clune, “Multifaceted feature visualization: Uncovering the different types of features learned by each neuron in deep neural networks,” in Visualization for Deep Learning workshop, International Conference in Machine Learning, 2016.
- [31] B. Zhou, A. Khosla, A. Lapedriza, A. Oliva, and A. Torralba, “Learning deep features for discriminative localization,” in Proceedings of the IEEE conference on computer vision and pattern recognition, 2016, pp. 2921–2929.
- [32] R. R. Selvaraju, M. Cogswell, A. Das, R. Vedantam, D. Parikh, and D. Batra, “Grad-cam: Visual explanations from deep networks via gradient-based localization,” Int. J. Comput. Vis., vol. 128, no. 2, pp. 336–359, 2020. [Online]. Available: https://doi.org/10.1007/s11263-019-01228-7
- [33] A. Chattopadhay, A. Sarkar, P. Howlader, and V. N. Balasubramanian, “Grad-cam++: Generalized gradient-based visual explanations for deep convolutional networks,” in 2018 IEEE Winter Conference on Applications of Computer Vision (WACV). IEEE, 2018, pp. 839–847.
- [34] A. Shrikumar, P. Greenside, and A. Kundaje, “Learning important features through propagating activation differences,” in International Conference on Machine Learning. PMLR, 2017, pp. 3145–3153.
- [35] J. T. Springenberg, A. Dosovitskiy, T. Brox, and M. Riedmiller, “Striving for simplicity: The all convolutional net,” in Proceedings of the ICLR (Workshop Track), 2015.
- [36] Y. Goyal, Z. Wu, J. Ernst, D. Batra, D. Parikh, and S. Lee, “Counterfactual visual explanations,” in International Conference on Machine Learning. PMLR, 2019, pp. 2376–2384.
- [37] P. Wang and N. Vasconcelos, “Scout: Self-aware discriminant counterfactual explanations,” in Proceedings of the IEEE Conference on Computer Vision and Pattern Recognition, 2020, pp. 8981–8990.
- [38] I. Goodfellow, J. Pouget-Abadie, M. Mirza, B. Xu, D. Warde-Farley, S. Ozair, A. Courville, and Y. Bengio, “Generative adversarial nets,” in Advances in neural information processing systems, 2014, pp. 2672–2680.
- [39] M. Mirza and S. Osindero, “Conditional generative adversarial nets,” arXiv preprint arXiv:1411.1784, 2014.
- [40] P. Isola, J.-Y. Zhu, T. Zhou, and A. A. Efros, “Image-to-image translation with conditional adversarial networks,” in Proceedings of the IEEE Conference on Computer Vision and Pattern Recognition, 2017, pp. 1125–1134.
- [41] O. Ronneberger, P. Fischer, and T. Brox, “U-net: Convolutional networks for biomedical image segmentation,” in International Conference on MICCAI. Springer, 2015, pp. 234–241.
- [42] J.-Y. Zhu, T. Park, P. Isola, and A. A. Efros, “Unpaired image-to-image translation using cycle-consistent adversarial networks,” in Proceedings of the IEEE International Conference on Computer Vision, 2017, pp. 2223–2232.
- [43] K. Armanious, C. Jiang, M. Fischer, T. Küstner, T. Hepp, K. Nikolaou, S. Gatidis, and B. Yang, “Medgan: Medical image translation using gans,” Computerized medical imaging and graphics, vol. 79, p. 101684, 2020.
- [44] J. Liang, W. Pei, and F. Lu, “Cpgan: Content-parsing generative adversarial networks for text-to-image synthesis,” in European Conference on Computer Vision. Springer, 2020, pp. 491–508.
- [45] S. Fiorini, L. Ballerini, E. Trucco, and A. Ruggeri, “Automatic generation of synthetic retinal fundus images.” in Eurographics Italian Chapter Conference, 2014, pp. 41–44.
- [46] L. Bonaldi, E. Menti, L. Ballerini, A. Ruggeri, and E. Trucco, “Automatic generation of synthetic retinal fundus images: Vascular network,” Procedia Computer Science, vol. 90, pp. 54–60, 2016.
- [47] J. M. Bower, H. Cornelis, and D. Beeman, “Genesis, the general neural simulation system,” Encyclopedia of Computational Neuroscience, pp. 1287–1293, 2015.
- [48] N. T. Carnevale and M. L. Hines, The NEURON book. Cambridge University Press, 2006.
- [49] G. A. Ascoli and J. L. Krichmar, “L-neuron: a modeling tool for the efficient generation and parsimonious description of dendritic morphology,” Neurocomputing, vol. 32, pp. 1003–1011, 2000.
- [50] B. Liu, L. Gu, and F. Lu, “Unsupervised ensemble strategy for retinal vessel segmentation,” in Medical Image Computing and Computer Assisted Intervention – MICCAI 2019. Cham: Springer International Publishing, 2019, pp. 111–119.
- [51] C. Guo, M. Szemenyei, Y. Yi, W. Wang, B. Chen, and C. Fan, “SA-UNet: Spatial attention U-Net for retinal vessel segmentation,” in 2020 25th International Conference on Pattern Recognition (ICPR). IEEE, 2021, pp. 1236–1242.
- [52] Y. Zhou, B. Wang, X. He, S. Cui, and L. Shao, “DR-GAN: Conditional generative adversarial network for fine-grained lesion synthesis on diabetic retinopathy images,” IEEE Journal of Biomedical and Health Informatics, 2020.
- [53] M. Abadi, P. Barham, J. Chen, Z. Chen, A. Davis, J. Dean, M. Devin, S. Ghemawat, G. Irving, M. Isard et al., “Tensorflow: a system for large-scale machine learning.” in OSDI, vol. 16, 2016, pp. 265–283.
- [54] N. Otsu, “A threshold selection method from gray-level histograms,” IEEE transactions on systems, man, and cybernetics, vol. 9, no. 1, pp. 62–66, 1979.
- [55] A. Odena, V. Dumoulin, and C. Olah, “Deconvolution and checkerboard artifacts,” Distill, 2016. [Online]. Available: http://distill.pub/2016/deconv-checkerboard
- [56] K. Simonyan and A. Zisserman, “Very deep convolutional networks for large-scale image recognition,” in ICLR 2015 : International Conference on Learning Representations 2015, 2015.
- [57] D. P. Kingma and J. L. Ba, “Adam: A method for stochastic optimization,” in ICLR 2015 : International Conference on Learning Representations 2015, 2015.
- [58] J. Staal, M. Abramoff, M. Niemeijer, M. Viergever, and B. van Ginneken, “Ridge based vessel segmentation in color images of the retina,” IEEE TMI, vol. 23, no. 4, pp. 501–509, 2004.
- [59] P. Porwal, S. Pachade, M. Kokare, G. Deshmukh, J. Son, W. Bae, L. Liu, J. Wang, X. Liu, L. Gao et al., “Idrid: Diabetic retinopathy–segmentation and grading challenge,” Medical image analysis, vol. 59, p. 101561, 2020.
- [60] Q. Wei, X. Li, W. Yu, X. Zhang, Y. Zhang, B. Hu, B. Mo, D. Gong, N. Chen, D. Ding et al., “Learn to segment retinal lesions and beyond,” in 2020 25th International Conference on Pattern Recognition (ICPR). IEEE, 2021, pp. 7403–7410.
- [61] Y. Zhou, B. Wang, L. Huang, S. Cui, and L. Shao, “A benchmark for studying diabetic retinopathy: Segmentation, grading, and transferability,” IEEE Transactions on Medical Imaging, 2020.
- [62] A. Radford, L. Metz, and S. Chintala, “Unsupervised representation learning with deep convolutional generative adversarial networks,” in ICLR 2016 : International Conference on Learning Representations 2016, 2016.