11email: aalonso@cab.inta-csic.es 22institutetext: Observatorio de Madrid, OAN-IGN, Alfonso XII, 3, E-28014 Madrid, Spain 33institutetext: Department of Physics & Astronomy, University of Southampton, Hampshire SO17 1BJ, Southampton, UK 44institutetext: Department of Physics, University of Oxford, Oxford OX1 3RH, UK 55institutetext: Instituto de Astrofísica de Canarias, Calle vía Láctea, s/n, 38205 La Laguna, Tenerife, Spain 66institutetext: Departamento de Astrofísica, Universidad de La Laguna, 38205 La Laguna, Tenerife, Spain 77institutetext: Instituto de Radioastronomía y Astrofísica (IRyA-UNAM), 3-72 (Xangari), 8701, Morelia, Mexico 88institutetext: Kavli Institute for Particle Astrophysics and Cosmology (KIPAC), Stanford University, Stanford, CA 94305, USA 99institutetext: Astronomical Institute, Academy of Sciences, Bôcní II 1401, CZ- 14131 Prague, Czechia 1010institutetext: Leiden Observatory, PO Box 9513, 2300 RA Leiden, The Netherlands 1111institutetext: LERMA, Observatoire de Paris, Collège de France, PSL University, CNRS, Sorbonne University, Paris, France 1212institutetext: Max-Planck-Institut für Extraterrestrische Physik, Postfach 1312, D-85741 Garching, Germany 1313institutetext: Institute of Astrophysics, Foundation for Research and Technology- Hellas, GR-71110, Heraklion, Greece 1414institutetext: Department of Physics & Astronomy, University of Alaska Anchorage, Anchorage, AK 99508-4664, USA 1515institutetext: INAF - Osservatorio Astrofisico di Arcetri, Largo Enrico Fermi 5, 50125 Firenze, Italy 1616institutetext: Frontier Research Institute for Interdisciplinary Sciences, Tohoku University, Sendai 980-8578, Japan 1717institutetext: Astronomical Institute, Tohoku University 6-3 Aramaki, Aoba-ku, Sendai, 980-8578 Japan 1818institutetext: National Astronomical Observatory of Japan, National Institutes of Natural Sciences (NINS), 2-21-1 Osawa, Mitaka, Tokyo 181-8588, Japan 1919institutetext: Department of Astronomy, School of Science, The Graduate University for Advanced Studies, SOKENDAI, Mitaka, Tokyo 181-8588, Japan 2020institutetext: National Astronomical Observatory of Japan, 2-21-1 Osawa, Mitaka, Tokyo 181-8588, Japan 2121institutetext: Department of Astronomical Science, The Graduate University for Advanced Studies, SOKENDAI, 2-21-1 Osawa, Mitaka, Tokyo 181- 8588, Japan 2222institutetext: Centro de Astrobiología (CAB, CSIC-INTA), Carretera de Ajalvir, 28850 Torrejón de Ardoz, Madrid, Spain 2323institutetext: Space Telescope Science Institute, Baltimore, MD 21218, USA 2424institutetext: The University of Texas at San Antonio, One UTSA Circle, San Antonio, TX 78249, USA 2525institutetext: Núcleo de Astronomía de la Facultad de Ingeniería, Universidad Diego Portales, Av. Ejército Libertador 441, Santiago, Chile 2626institutetext: Kavli Institute for Astronomy and Astrophysics, Peking University, Beijing 100871, China 2727institutetext: Centre for Extragalactic Astronomy, Department of Physics, Durham University, South Road, Durham DH1 3LE, UK 2828institutetext: LESIA, Observatoire de Paris, PSL Research University, CNRS, Sorbonne Universités, UPMC Univ. Paris 06, Univ. Paris Diderot, Sorbonne Paris Cité, 5 place Jules Janssen, 92190 Meudon, France 2929institutetext: Astronomical Observatory, Volgina 7, 11060 Belgrade, Serbia 3030institutetext: Sterrenkundig Observatorium, Universiteit Ghent, Krijgslaan 281-S9, Ghent, B-9000, Belgium 3131institutetext: Kagoshima University, Graduate School of Science and Engineering, Kagoshima 890-0065, Japan 3232institutetext: Ehime University, Research Center for Space and Cosmic Evolution, Matsuyama 790-8577, Japan Hokkaido University, Faculty of Science, Sapporo 060-0810, Japan
The Galaxy Activity, Torus and Outflow Survey (GATOS):
We compare high angular resolution mid-infrared (mid-IR) and ALMA far-infrared (far-IR) images of twelve nearby (median 21 Mpc) Seyfert galaxies selected from the Galaxy Activity Torus and Outflow Survey (GATOS). The mid-IR unresolved emission contributes more than 60% of the nuclear (diameters of 1.5″150 pc) emission in most galaxies. By contrast, the ALMA m continuum emission is mostly resolved with a median diameter of 42 pc and typically along the equatorial direction of the torus (Paper I of the series Garcia-Burillo et al., 2021). The Eddington ratios and nuclear hydrogen column densities () of half the sample are favorable to launching polar and/or equatorial dusty winds, according to numerical simulations. Six of these show mid-IR extended emission approximately in the polar direction as traced by the narrow line region and perpendicular to the ALMA emission. In a few galaxies, the nuclear might be too high to uplift large quantities of dusty material along the polar direction. Five galaxies have low and/or Eddington ratios and thus polar dusty winds are not likely. We generate new radiative transfer CAT3D-WIND disk-wind models and model images at 8, 12, and m. We tailor these models to the properties of the GATOS Seyferts in this work. At low wind-to-disk cloud ratios the far-IR model images have disk- and ring-like morphologies. The characteristic “X”-shape associated with dusty winds is seen better in the far-IR at intermediate-high inclinations for the extended-wind configurations. In most of the explored models, the mid-IR emission comes mainly from the inner part of the disk/cone. Extended bi-conical and one-sided polar mid-IR emission is seen in extended-wind configurations and high wind-to-disk cloud ratios. When convolved to the typical angular resolution of our observations, the CAT3D-WIND model images reproduce qualitative aspects of the observed mid- and far-IR morphologies. However, low to intermediate values of the wind-to-disk ratio are required to account for the observed large fractions of unresolved mid-IR emission in our sample. This work and Paper I provide observational support for the torus+wind scenario. The wind component is more relevant at high Eddington ratios and/or AGN luminosities, and polar dust emission is predicted at nuclear column densities of up to . The torus/disk component, on the other hand, prevails at low luminosities and/or Eddington ratios.
Key Words.:
Galaxies: Seyfert – Submillimeter: galaxies – Infrared: galaxies – Galaxies: ISM – Galaxies: individual: NGC 1365, NGC 3227, NGC 4388, NGC 4941, NGC 5506, NGC 5643, NGC 6300, NGC 6814, NGC 7213, NGC 7314, NGC 7465, NGC 75821 Introduction
The fundamental component of the Unified Model for Active Galactic Nuclei (AGN) is an obscuring torus or disk111Throughout this work we will use the terms torus and nuclear disk interchangeably. In particular, unless otherwise indicated, the term torus does not necessarily refer to a geometrically thick one, which is defined as having a height over radial size ratio of . made of dust and molecular gas (see Antonucci, 1993; Urry & Padovani, 1995; Netzer, 2015, for reviews). In the classical scenario, the torus obscures the view of the broad line region (BLR) along certain lines of sight and the nuclei are classified as type 2. Those nuclei observed along or near the polar direction of the torus have a direct view of the BLR and are classified as type 1. Initially, Pier & Krolik (1993) derived a compact size (a few parsecs) for the torus of the archetypical Seyfert 2 galaxy NGC 1068, from the fit of the infrared (IR) spectral energy distribution (SED) with the torus models of Pier & Krolik (1992a). Subsequent modelling of a sample of Seyfert 1s by Granato & Danese (1994) however, required tori extending for up to a few hundred parsecs. The narrow line region (NLR) of Seyfert galaxies extends on much larger scales (hundreds of parsecs up to a kpc) than the dusty molecular torus and is thus seen in both type 1 and type 2 AGN.
| Galaxy | Dist | Type | log (2-10keV) | X-ray log | ALMA log | |
|---|---|---|---|---|---|---|
| (Mpc) | (erg s-1) | (cm-2) | (cm-2) | |||
| NGC 1365 | 18.3 | Sy1.8 | 42.09 | 22.2 | 22.3 | |
| NGC 3227 | 23.0 | Sy1.5 | 42.37 | 21.0 | 22.7 | |
| NGC 4388 | 18.1 | Sy1.9 | 42.45 | 23.5 | 22.3 | |
| NGC 4941 | 20.5 | Sy2 | 41.40 | 23.7 | 21.9 | |
| NGC 5506 | 26.4 | Sy1.9 | 42.98 | 22.4 | 22.6 | |
| NGC 5643 | 16.9 | Sy2 | 42.41 | 25.4 | 23.6 | |
| NGC 6300 | 14.0 | Sy2 | 41.73 | 23.5 | 23.4 | |
| NGC 6814 | 22.8 | Sy1.5 | 42.24 | 21.0 | 21.8 | |
| NGC 7213 | 22.0 | Sy1.5 | 41.85 | 20.0 | 22.0 | |
| NGC 7314 | 17.4 | Sy1.9 | 42.18 | 21.6 | 22.1 | |
| NGC 7465 | 27.2 | Sy2 | 41.93 | 21.5 | 22.7 | |
| NGC 7582 | 22.5 | Sy2 | 43.49 | 24.3 | 22.6 |
The angular resolutions needed in the IR to resolve the obscuring structures of nearby AGN have not been available until recently. In the mid-infrared333Throughout this work, mid-IR refers to the m spectral range that can be observed from the ground. (mid-IR), interferometric observations with the Very Large Telescopes Interferometer (VLTI) of nearby Seyferts are generally modeled with an unresolved source and a resolved source. Both show compact sizes (pc, Burtscher et al., 2013; López-Gonzaga et al., 2016). Some of the resolved model components are elongated in the polar direction, with this component accounting for most of the mid-IR emission on these scales (Hönig et al., 2013; Tristram et al., 2014; López-Gonzaga et al., 2014, 2016; Leftley et al., 2019). This polar dust emission appears to be related to the large scale (up to a few hundred parsec) emission detected in the mid-IR (Cameron et al., 1993; Tomono et al., 2001; Radomski et al., 2003; Packham et al., 2005a; Asmus et al., 2014; Asmus, 2019; García-Bernete et al., 2016) and with SOFIA at m (see Fuller et al., 2019). In many local Seyferts that is spatially coincident with that of the NLR and/or ionization cones. In the near-infrared (near-IR) Gravity Collaboration et al. (2020b) reconstructed VLT/GRAVITY -band observations of NGC 1068 with a ring-like structure with a radius of 0.24 pc. This emission is believed to be associated with the dust sublimation region but, according to these authors, the geometry is not consistent with that expected from a geometrically thick torus. Furthermore, for a sample of Seyfert 1s, Gravity Collaboration et al. (2020a) resolved the radii of the hot dust continuum emission and showed they follow the luminosity-size relation (Suganuma et al., 2006; Kishimoto et al., 2007), as expected for the dust sublimation region.
Observations with the Atacama Large Millimeter/submillimeter Array (ALMA) of NGC 1068 resolved the far-infrared (far-IR) or sub-millimeter continuum emission of the torus (García-Burillo et al., 2016, 2019; Lopez-Rodriguez et al., 2020). At m the torus diameter is 7-10 pc. The derived (sub)millimeter spectral indices at the AGN position of NGC 1068 indicate the presence of cold dust but with an important contribution from synchrotron emission at these wavelengths (García-Burillo et al., 2019; Pasetto et al., 2019). The torus was also detected in a variety of molecular gas transitions that probe a range of gas densities with the torus diameter reaching pc in the low density tracers (see García-Burillo et al., 2016, 2019; Gallimore et al., 2016; Impellizzeri et al., 2019; Imanishi et al., 2020).
Molecular tori with diameters of up to 50 pc are now routinely observed with ALMA in other nearby Seyfert galaxies and low luminosity AGN. The tori are sometimes morphologically and kinematically decoupled from the host galaxy. However, in most cases the tori are connected to reservoirs of molecular gas on scales of pc that are associated with dynamical resonances (see Izumi et al., 2018; Alonso-Herrero et al., 2018, 2019; Combes et al., 2019, and also below). These reservoirs are likely related to the 100 pc-torus invoked by Maiolino & Rieke (1995) to explain the properties of 1.8 and 1.9 Seyfert nuclei. These would be type 1s seen through these large scale dust structures that are coplanar with the host galaxy disk. Finally there is evidence that in some cases the torus itself is not only rotating but also outflowing (Gallimore et al., 2016; Alonso-Herrero et al., 2018; García-Burillo et al., 2019).
In parallel with the new observational constraints on the torus properties, theoretical models are continuously evolving. In the first static models the dust was homogeneously distributed (Pier & Krolik, 1992a; Granato & Danese, 1994; Efstathiou & Rowan-Robinson, 1995; Fritz et al., 2006). Subsequently, the dust was distributed in clouds in the so-called clumpy torus models (Nenkova et al., 2008a, b; Schartmann et al., 2008; Hönig & Kishimoto, 2010) and in two phases (Stalevski et al., 2012; Siebenmorgen et al., 2015). Torus models also incorporated an additional polar dust component to account for the mid-IR imaging and interferometric observations of some Seyfert galaxies (Efstathiou et al., 1995; Gallagher et al., 2015; Hönig & Kishimoto, 2017; Stalevski et al., 2017; Isbell et al., 2021). These models reproduced satisfactorily the observed nuclear IR emission of samples of nearby AGN (see e.g., Ramos Almeida et al., 2009, 2011; Alonso-Herrero et al., 2011; Ichikawa et al., 2015; García-González et al., 2017; García-Bernete et al., 2019; González-Martín et al., 2019). Elitzur & Shlosman (2006) put forward a scenario where the torus is part of a clumpy outflow and recently, Venanzi et al. (2020) demonstrated theoretically that dusty winds can be launched at the inner walls of the torus. Radiation hydrodynamical models (Schartmann et al., 2014; Wada et al., 2016; Williamson et al., 2019, 2020) incorporated predictions for the dust IR emission and the molecular gas emission and kinematics.
Hönig (2019) assembled the information gathered from the analysis of IR and sub-mm data of nearby and bright AGN and proposed a new paradigm for the obscuring structures around radio-quiet AGN (see also Ramos Almeida & Ricci, 2017; Lyu & Rieke, 2021). The torus is now envisioned as a multi-component multi-phase structure (see figure 1 and figure 4 of Izumi et al., 2018; Hönig, 2019, for schematic pictures, respectively). In short, the hot innermost part of the equatorial disk/torus is close to the sublimation radius on sub-pc scales in Seyferts and emits mostly in the near-IR. The dusty inner molecular torus as well as the wind region are traced by the mid-IR emission as well as hot and relatively warm molecular gas on scales of a few pc to probably tens of parsecs. Both dust components (that is, the inner molecular disk and the wind) are likely to contribute to the AGN obscuration. Finally, the cold outer part of the equatorial disk is probed by the cold molecular gas and dust emission and extends on scales from 5 pc out to tens of parsecs.
This is the second paper in a series aimed at understanding the nuclear activity and its connection with the host galaxy in nearby Seyfert galaxies. In the first paper of the series, Garcia-Burillo et al. (2021), GB21 from now on, obtained ALMA observations of a volume-limited and complete sample of Seyfert galaxies to study their torus properties. The galaxies are part of the Galactic Activity, Torus, and Outflow Survey (GATOS). We drew the GATOS galaxies from the 70 Month Swift-BAT All-sky Hard X-Ray Survey (Baumgartner et al., 2013). The Swift-BAT 14-195 keV energy range ensures a nearly complete selection for nearby AGN at (Ricci et al., 2017a; Koss et al., 2017). GB21 selected galaxies in the southern hemisphere and with distances in the Mpc range. We summarize the main properties of the sample of 12 Seyfert galaxies in Table 1. The median galaxy distance is 21 Mpc and the median value of the intrinsic (absorption corrected) 2-10 keV luminosity is . The Eddington ratios () vary from 0.001 to 0.06. The sample probes a range of X-ray column densities and includes two Compton-thick objects.
In this paper we characterize for the first time the torus and polar dust emission components in nearby Seyferts, using mid and far-IR observations with physical resolutions pc. The paper is organized as follows. We describe the existing mid-IR observations with angular resolutions in Sect. 2.1. We summarize in Sect. 2.2 the ALMA observations analyzed and discussed in detail by GB21. In Sect. 3 we derive the extended mid-IR emission of our Seyfert galaxies, and compare it with ALMA and NLR observations. In Sect. 4 we investigate the mid-IR morphology dependence on AGN properties. In Sect. 5 we generate mid- and far-IR torus model images using the disk-wind models of Hönig & Kishimoto (2017). In Sect. 6 we use these model images to simulate our observations. Sections 7 and 8 present the discussion and summary, respectively.
2 Observations
The observations used in this work have already been presented in the literature. In what follows we describe them briefly.
2.1 Mid-IR observations
We used fully-reduced mid-IR imaging observations taken with 8-10 m class telescopes and already published in the literature (see references in Table 2). The instruments included VISIR (Lagage et al., 2004) and the upgraded VISIR (Käufl et al., 2015; Kerber et al., 2016) on the VLT, T-ReCS (Telesco et al., 1998) on Gemini-South (Gemini-S), and CanariCam (Telesco et al., 2003; Packham et al., 2005b) on the Gran Telescopio Canarias (GTC). We used observations taken with various filters in the atmospheric -band listed in Table 2.
For each galaxy we also obtained fully-reduced images of standard stars taken with the same filter and observed close in time. All the observations have angular resolutions, as measured from the full width at half maximum (FWHM) of the stars, close to the theoretical diffraction limit of the corresponding telescopes in the mid-IR (). At the distances of our galaxies, these correspond to physical resolutions between 17 pc for NGC 6300 and 50 pc for NGC 7465. The pixel sizes are as follows, 0.0453″ for the upgraded VISIR, for VISIR, for CanariCam and for T-ReCS.
We note that the observations from the atlas of Asmus et al. (2014) were already at the usual orientation of north up, east to the left. The T-ReCS and CanariCam original images had different orientations and we kept them during the Point Spread Function (PSF) subtraction analysis (see Sect. 3), and only rotated them to the usual orientation after the PSF subtraction. We refer the reader to the works listed in the notes of Table 2 for full details on the observations and data reduction.
| Galaxy | Tel/Inst | Filter | FWHM | Ref | Unresolv. | PAMIR-ext | Morphology | ||
|---|---|---|---|---|---|---|---|---|---|
| (m) | (″) | (pc) | (%) | (∘) | |||||
| NGC 1365 | Gemini-S/T-ReCS | Si-2 | 8.74 | 0.34 | 30 | 1 | 57 | to 70 | unresolv. + two-sided polar |
| NGC 3227 | GTC/CanariCam | Si-2 | 8.74 | 0.31 | 35 | 2 | 69 | 30 to 45 | unresolv. + one-sided polar |
| NGC 4388 | GTC/CanariCam | Si-2 | 8.74 | 0.39 | 34 | 2 | 72 | 30 | unresolv.+ one-sided polar |
| NGC 4941 | VLT/VISIR | NeII-1 | 12.27 | 0.35 | 35 | 3 | 100 | … | unresolved |
| NGC 5506 | VLT/VISIR | NeII-1 | 12.27 | 0.33 | 42 | 3 | 61 | 30 to 90 | unresolv. + polar + equatorial/host |
| NGC 5643 | VLT/VISIR(u) | B12.4 | 12.47 | 0.34 | 28 | 4 | 53 | 48 to 70 | unresolv. + polar + equatorial/host |
| NGC 6300 | VLT/VISIR | PAH1 | 8.59 | 0.25 | 17 | 3 | 36 | to | unresolv. + equatorial/host |
| NGC 6814 | VLT/VISIR | PAH2 | 11.25 | 0.35 | 39 | 3 | 78 | … | unresolved |
| NGC 7213 | VLT/VISIR(u) | PAH1 | 8.59 | 0.26 | 28 | 5 | 100 | … | unresolved |
| NGC 7314 | Gemini-S/T-ReCS | Si-2 | 8.74 | 0.37 | 31 | 6 | 67 | … | unresolved |
| NGC 7465 | GTC/CanariCam | Si-2 | 8.74 | 0.38 | 50 | 2 | 80 | … | unresolved |
| NGC 7582 | VLT/VISIR(u) | B12.4 | 12.47 | 0.36 | 40 | 4 | 70 | 45 to 55 | unresolv. + one-sided polar |
2.2 ALMA CO(3-2) and continuum m observations
We obtained ALMA band 7 (frequency range GHz, wavelength range mm) observations of the GATOS core sample of 10 Seyferts in Cycles 6 and 7. We targeted the CO(3-2) and HCO+(4-3) transitions as well as the adjacent continuum at m with a common angular resolution of 0.1″, which translates into physical resolutions in the range pc for our sample. GB21 presented the observations, data reduction, and analysis. For this work we use the fully reduced maps of the m continuum and integrated intensity CO(3-2) (see Sect. 3.3) generated from their moderate spatial resolution (MSR) data sets as well as the torus properties derived from the modelling of the MSR m continuum (see Sect. 3.3). The ALMA band 7 observations of the other two galaxies in our sample, namely NGC 1365 and NGC 3227, were part of other ALMA programs and were published by Combes et al. (2019) and Alonso-Herrero et al. (2019), respectively.
3 Extended mid-IR emission
3.1 Analysis of the observations
The nuclear mid-IR emission of nearby active galaxies, as observed from ground-based telescopes, is a combination of an unresolved component, generally assumed to arise from dust heated by the AGN, and extended emission. The latter arises from dust in the NLR and/or dust heated by on-going star formation activity, especially in local Seyferts that are also classified as luminous IR galaxies (see the review by Pérez-Torres et al., 2021, and references therein), or might be due to synchrotron emission, especially in radio-loud low-luminosity AGN (Mason et al., 2012).
To separate the unresolved and extended emission in ground-based mid-IR images, the majority of works used the so-called PSF-scaling technique. The main assumption is that an imaging observation of a standard star taken close in time to the galaxy observation represents the galaxy unresolved nuclear component. The standard star image is then scaled to the peak of the galaxy observation and subtracted from the galaxy image. The scaling level (that is, 100%, 90%, etc. at the peak of the galaxy emission) is visually assessed from the PSF-subtracted image and the azimuthally averaged one-dimension (1D) emission profiles (see, e.g., figures 1 in Radomski et al., 2003; Ramos Almeida et al., 2011). Generally in Seyfert galaxies a 100% scaling produces residual holes at the center of the galaxy and the scaling level is determined when the residual image does not show a central hole and the PSF-subtracted galaxy profile is flat in the central region.
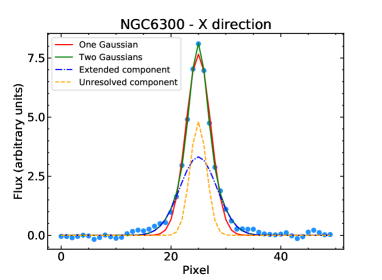
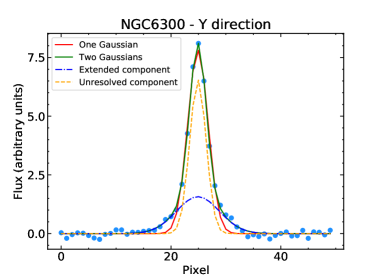
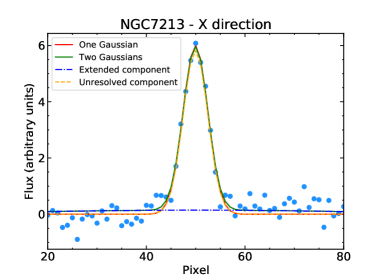
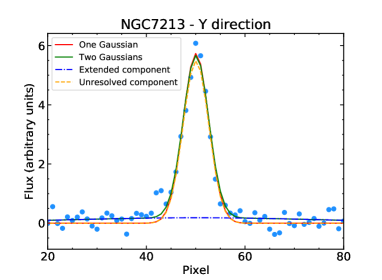
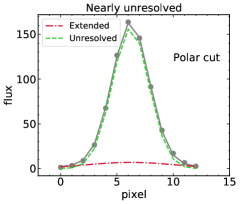
In this work we used the same PSF-scaling technique but we first determined the scaling factor by fitting 1D emission profiles. We extracted 1D profiles of one pixel width, centered at the peak of the emission along each of the X and Y axes of the mid-IR galaxy and standard star images. We used the original images before rotating to the usual orientation and smoothing them. We started by fitting separately the X and Y profiles of the corresponding standard stars with one Gaussian function to derive the width of the unresolved component. We then used two Gaussians for the galaxy profiles along each of the X and Y directions. The first component models the unresolved component. We fixed its to the value derived from the standard star (within pixel), and allowed its intensity and position to vary. For the second Gaussian we allowed all the parameters to vary to model the extended emission. We derived the scaling factors for the unresolved component Gaussian along the X and Y directions. We scaled the PSF images (that is, the standard star images) with the two factors and subtracted them from the galaxy images. From the two PSF-subtracted galaxy images, we chose the one that did not over-subtract the unresolved emission. We note that there is not a strong dependence of the morphology of the extended mid-IR emission with the scaling factor, except in the very inner regions. Asmus (2019) illustrated this in their Fig. 4 for NGC 5643, which is included in our analysis.
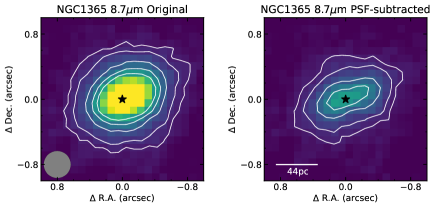
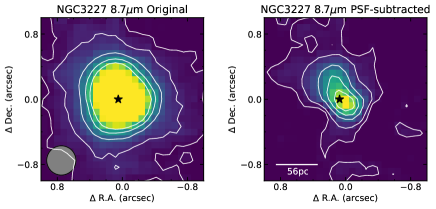
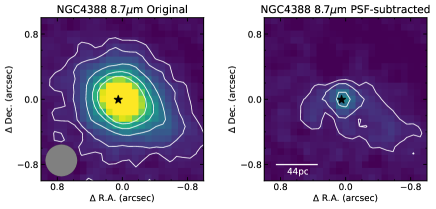
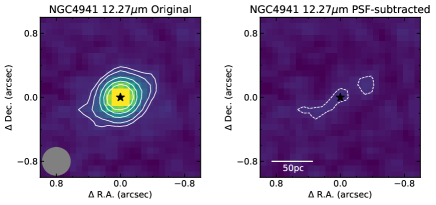
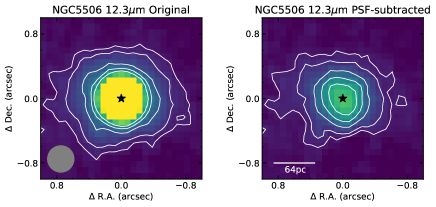
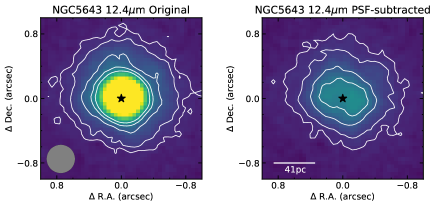
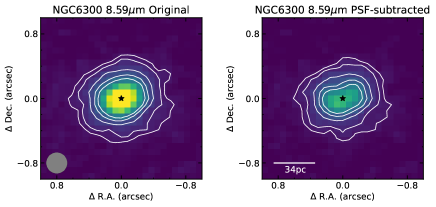
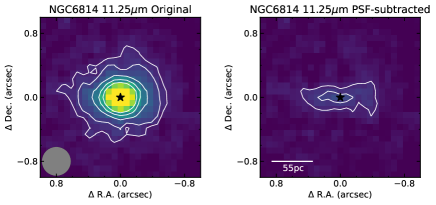
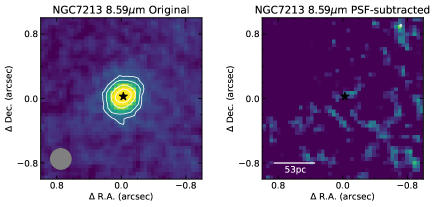
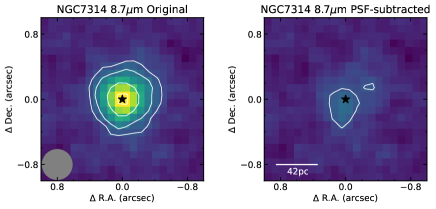
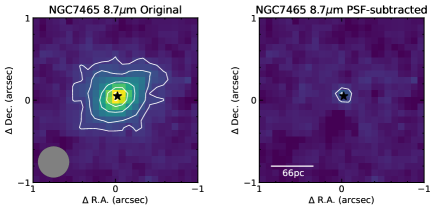
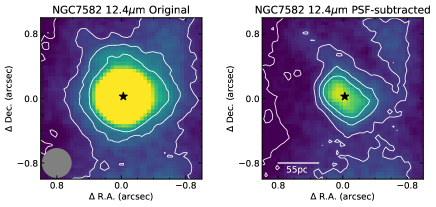
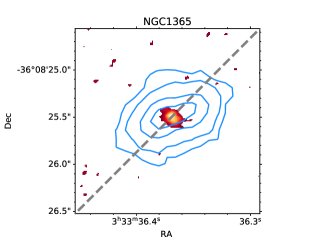
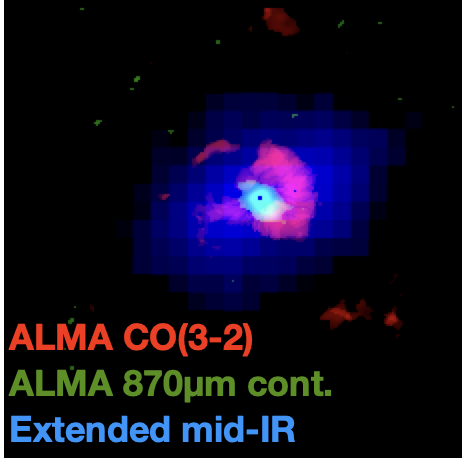
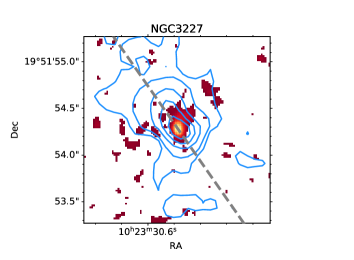
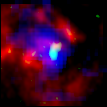
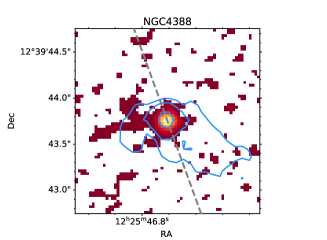

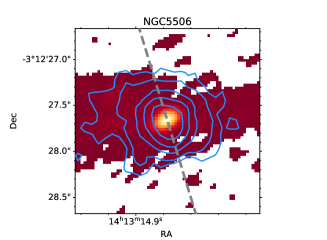

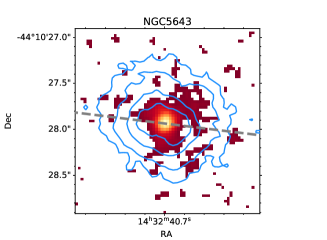

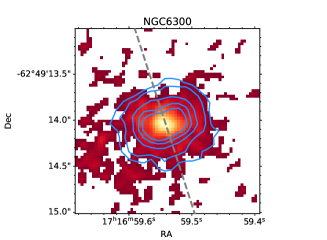

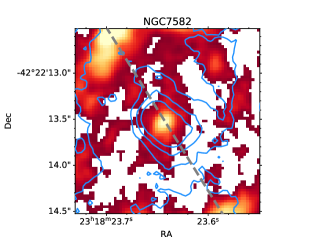
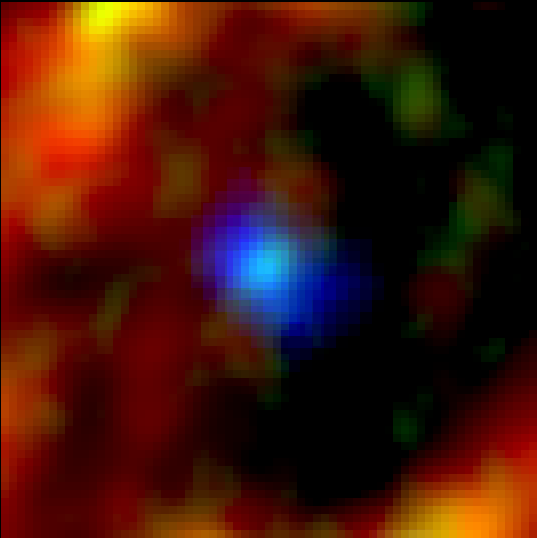
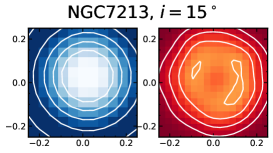
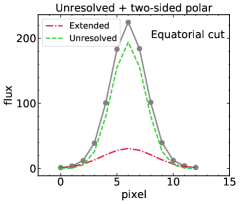
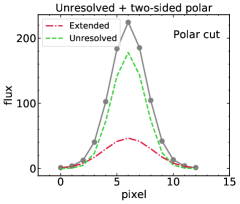
Figure 1 shows two examples of the fits to the X and Y direction profiles. The top panels are for NGC 6300, a galaxy in our sample with a large mid-IR extended component and the bottom panels NGC 7213, which appears unresolved in our mid-IR image. In the case of NGC 6300, the 1D profiles show that the extended emission is more prominent along the X-direction (east-west direction in this case) than along the Y-direction. The derived scaling factors were 63% and 84% for the X and Y directions, respectively. The PSF-subtracted galaxy image using the scaling factor along the Y direction had negative residuals and thus we used the scaling factor along the X direction to produce the PSF-subtracted galaxy image. For NGC 7213, both 1D profiles extracted along the X and Y directions were well modelled with a dominant unresolved component, which resulted in a scaling factor of the PSF image of 97-98%.
3.2 Results
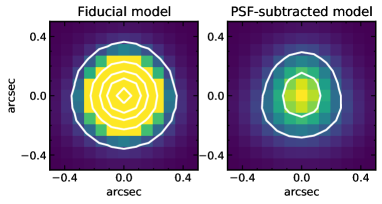
In Fig. 2 we display for each galaxy in our sample the original mid-IR image and the resulting PSF-subtracted images for a field of view (FoV) of . This FoV includes most of the mid-IR extended emission detected for our sample with the instruments listed in Table 2. The only exceptions are NGC 3227 and NGC 7582 that show extended emission over larger scales due to the presence of circumnuclear rings of star formation (Alonso-Herrero et al., 2016; Wold & Galliano, 2006; García-Bernete et al., 2016). We also smoothed the images using Gaussian functions with FWHM of between 1.1 and 1.7 pixels, corresponding to 0.07 to 0.13″. In all the images, the first contour shown with a solid line is at a level, where is the standard deviation of the background measured on the original images, that is, before we smoothed the images and when needed, rotated them. The other contours are shown at 5, 10, 15, and levels.
The PSF-subtracted images of six out of the twelve galaxies present bright extended mid-IR emission (Fig. 2). These are NGC 1365, NGC 3227, NGC 5506, NGC 5643, NGC 6300, and NGC 7582. The contours show that the extended emission is detected up to at least a level. For NGC 4388 we also detected extended mid-IR emission at a lower significance but in a similar orientation as that derived by Asmus et al. (2016) using a different dataset. The sizes of the extended mid-IR emission range from approximately 50 pc in NGC 6300 to 190 pc in NGC 5506. We used the ellipse task within iraf on the PSF-subtracted images to derive the position angle (PA) of the extended mid-IR emission (PAMIR-ext). The typical uncertainties in these measurements are . We report these values in Table 2 for the inner , which is the location of most of the extended mid-IR emission. PAMIR-ext is relatively constant with radius in NGC 1365, NGC 3227, NGC 4388, NGC 6300, and NGC 7582. For NGC 5643 we found that the values are between approximately in the inner regions () changing progressively to approximately in the outer contours. In the most extreme case in our sample NGC 5506, the PAMIR-ext values vary from in the inner region (central ) to nearly in the outer regions.
Three galaxies, NGC 6814, NGC 7314, and NGC 7465, only show evidence of faint extended emission at levels. Finally, the PSF-subtracted images of NGC 4941 and NGC 7213 do not show evidence of extended emission.
The fraction of unresolved flux over total flux measured within aperture diameters of (see Table 2) are between 40 and 72% for the seven galaxies with extended mid-IR emission. These apertures cover the extent of the mid-IR nuclear emission and are large enough to include the PSF wings. For the five galaxies with faint or no detected extended mid-IR emission, the unresolved emission contributes between 80 and 100%, within similar apertures. This is in good agreement with previous works (Asmus et al., 2014; García-Bernete et al., 2016; Asmus, 2019). In summary, at our angular resolutions the unresolved component accounts for between 60 and 100% of the mid-IR emission in the central 1.5″150 pc for the majority of the galaxies in our sample.
| Torus/disk | Wind | |||||||||
| ALMA | (∘) | (∘) | PAcone(∘) | |||||||
| Galaxy | (pc) | PA | clumpy | cat3d-wind | xclumpy | ALMA | Kinem. | Model | Opt/IR | cat3d-wind |
| NGC 1365 | 28 | 50 | [8-40] | … | 53 | 48 | … | … | … | |
| NGC 3227 | 41 | 166 | [9-35] | [28-32] | 20 (f) | 50 | 30 | 75 | 35 | |
| NGC 4388 | 32 | 43∗ | [13-20] | [50-52] | 70 | … | … | |||
| NGC 4941 | 78 | 29∗ | … | [35-41] | … | … | … | … | 40 | [0.2-0.3] |
| NGC 5506 | 129 | 87 | [5-40] | low | 33 | 55 | 10 | 18 | ||
| NGC 5643 | 43 | 4 | [65-81] | … | 74 (f) | 39 | 60 | 25 | 82 | … |
| NGC 6300 | 64 | 85 | [14-21] | low | 53 | 44 | 57 | … | 18 | [0.2-0.3] |
| NGC 6814 | 33 | 57∗ | [7-34] | 30 | 45 (f) | … | … | … | 33 | [0.2-0.3] |
| NGC 7213 | 40 | 71 | [0-30] | low | 45 (f) | 30 | … | … | no | 0.2 |
| NGC 7314 | 60 | 21 | [5-37] | high | 45 (f) | 58 | … | … | 110 | 0.7 |
| NGC 7465 | 67 | 4 | … | … | … | 53 | … | … | … | |
| NGC 7582 | 91 | 18 | [53-82] | … | 41 | 59 | 59 | … | … | |
3.3 Comparison with ALMA m and CO(3-2) observations
To compare the mid- and far-IR morphologies, we first adjusted the astrometry of the mid-IR images of the seven galaxies with extended emission. We assumed that the peak of the mid-IR emission coincides with that of the ALMA m continuum emission and adjusted the mid-IR coordinates accordingly. Figure 3 (left panels for each galaxy) shows in color the original ALMA continuum images, that is, including both the unresolved and the extended emission, with the contours showing the extended mid-IR emission from the PSF-subtracted images. In the six out of the seven galaxies with extended mid-IR emission, GB21 concluded that the ALMA m extended emission traces cold dust mostly along the equatorial material in the torus, with sizes between 28 and 129 pc (median of 42 pc, Table 3).
In NGC 1365, NGC 3227, and NGC 7582 as well as the inner regions of NGC 5506, the extended mid-IR emission appears to be approximately perpendicular (in projection) to the extended ALMA m continuum emission. The latter for these four galaxies is identified as the torus. In NGC 5643, the orientation of the extended mid-IR emission is mostly along , which is nearly perpendicular (in projection) to the nearly north-south ALMA m continuum emission. Finally, in NGC 6300 the extended mid- and far-IR emission show similar orientations, and thus the extended mid-IR emission is along the equatorial direction of the torus.
GB21 showed that the nuclear CO(3-2) morphologies of the GATOS Seyferts are in most cases rather different from the m emission. We constructed red-green-blue (RGB) images using the ALMA CO(3-2) images in red and m continuum in green for the seven Seyferts with extended mid-IR emission. In blue we show only the extended mid-IR emission to emphasize the low surface brightness emission at these wavelengths. In all galaxies but NGC 6300 (see right panels of Fig. 3), the extended mid-IR emission appears to fill the nuclear regions where the CO(3-2) emission is fainter. On larger scales the CO(3-2) emission is more extended than both the mid- and far-IR continuum images. In NGC 5643 the extended mid-IR emission is not only along the east-west direction, where there is faint CO(3-2) emission, but also along the nuclear molecular gas mini-spiral.
3.4 Comparison with ionization cones, NLR, and nuclear outflows
The seven galaxies with extended mid-IR emission have bright ionization cones/NLR that are identified from optical and near-IR narrow-band imaging and/or integral field unit (IFU) spectroscopy. We derived the PA of the cones by visual inspection of the [O iii]5007 images from Venturi et al. (2018) for NGC 1365, from Schmitt et al. (2003) for NGC 4388, from Fischer et al. (2013) for NGC 5506, from García-Bernete et al. (2021) for NGC 5643, and from Thomas et al. (2017) for NGC 7582. For NGC 3227 we used Hubble Space Telescope (HST) narrow-band images from Alonso-Herrero et al. (2019). For NGC 6300, Davies et al. (2014) detected a nuclear molecular gas outflow using observations of the H2 m line. We list the values of PAcone in Table 3 and plot them in Fig. 3. All seven galaxies have large projected opening angles of the cones/outflows, ranging from 85 to , approximately.
Six of the seven GATOS Seyferts with extended mid-IR emission show nearly the same orientations for the extended mid-IR emission and the ionization cones/outflows (Fig. 3, left panels). The exception is NGC 6300 (see below). The differences in (projected) orientations for these six Seyferts are less than . These are in good agreement with the typical values found by Asmus et al. (2016); Asmus (2019) for a larger sample of nearby AGN with prominent extended mid-IR emission. The extended mid-IR emission in NGC 3227, NGC 4388, and NGC 7582 is more prominent on the optical bright side of the ionization cone. In NGC 1365, NGC 5506, and NGC 5643 the mid-IR extended emission is more symmetric around the AGN position and approximately along the direction of the ionization cone. In the innermost region of NGC 5643, the extended mid-IR emission is at PA, which could be due to emission in the northeast inner walls of the ionization cone (see figure 22 of Fischer et al., 2013), becoming progressively more aligned with the ionization cone in the outer regions. In the inner regions of NGC 5506, PA, which is nearly aligned with the orientation of the cone, whereas at larger radial distances the extended mid-IR emission becomes more equatorial.
The extended mid-IR emission of NGC 6300 appears to be perpendicular to the orientation of the ionization cone. The morphology and orientation of the mid-IR extended emission are, on the other hand, similar to that seen in the HST color map (Martini et al., 2003; Davies et al., 2014), which likely traces dust in the host galaxy. The outer regions of NGC 5506 also show a large difference between the projected orientations of the cones and mid-IR extended emission. This indicates that the extended mid-IR emission along the approximate east-west direction also traces dust emission in the highly inclined host galaxy, as seen again from the color map (Martini et al., 2003). In NGC 7582, the extended mid-IR emission additionally probes dust in regions in the circumnuclear ring of star formation (Wold & Galliano, 2006).
NGC 4941, NGC 7465 and NGC 7314 have extended optical NLRs, which are detected with optical IFU observations and/or HST imaging (see Erroz-Ferrer et al., 2019; Ferruit et al., 2000, and Sousa et al. in preparation, respectively). In NGC 6814, the NLR and the coronal line region are rather compact and there is evidence for ionized outflows on these scales (, see Müller-Sánchez et al., 2011). In these four galaxies we do not detect extended mid-IR emission.
4 Dependence of warm dust morphologies on the Eddington ratio and nuclear column density
In the previous section, we showed that there is extended mid-IR emission approximately along the polar direction in six out of the 12 GATOS Seyferts analyzed in this work. It is yet unknown whether this polar dust emission is simply due to dust near the edges of the NLR being illuminated by the AGN, part of a nuclear dusty outflow or both. On the other hand, another four galaxies in our sample show NLR emission but no evidence for bright extended mid-IR emission. In this section we investigate if the nuclear column densities and Eddington ratios in the galaxies in our sample are likely to launch dusty outflows.
The gas and dust in the immediate surroundings of an active nucleus are subject to the AGN radiation pressure. The idea of infrared radiation pressure was first put forward by Pier & Krolik (1992b) and developed further by Krolik (2007), as an explanation to support the vertical height of the torus. In the classical Eddington limit, only the electron scattering is taken into account. Because the opacity of the dust is much greater than the Thomson opacity, there is an effective Eddington ratio, which Krolik (2007) estimated to be of the order of 10% the classical Eddington ratio. In other words, in the presence of dust, the effects of the radiation pressure are boosted. Thus, at high Eddington ratios, although not necessarily , and moderate column densities, nuclear outflows may be present (see Fabian et al., 2008, and references therein). These outflows might even clear out the gas from the nuclear region (see also Ricci et al., 2017b).
Venanzi et al. (2020) demonstrated semi-analytically that IR-dominated winds can be launched more efficiently when the acceleration due to the AGN radiation pressure () and the acceleration due to the gravitational force () from the central black hole are balanced (see also Tazaki & Ichikawa, 2020). Their radiation dynamical simulations for the typical Eddington ratios of Seyfert galaxies showed that IR-dominated outflows would take place at moderate column densities of a few . At higher column densities of approximately , they predicted that the lifting of the dusty clumps is suppressed and this material settles in the disk plane.
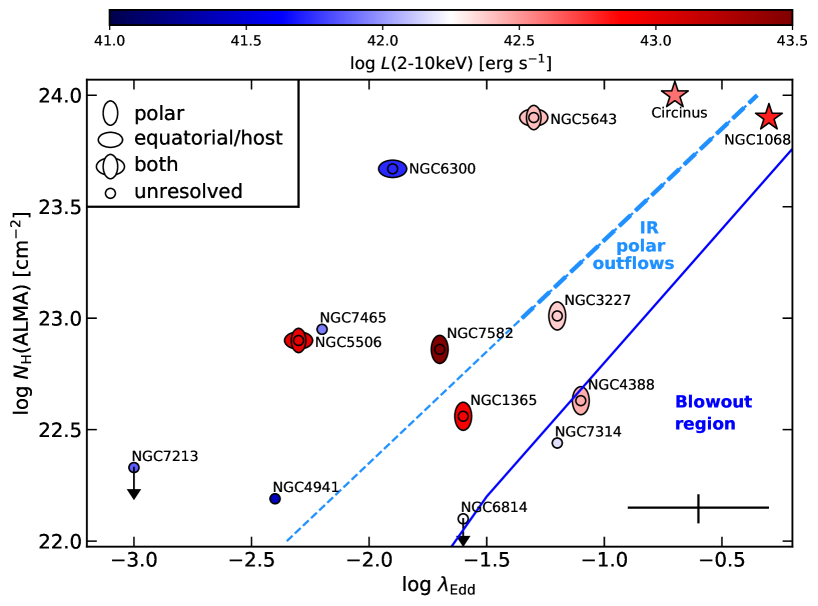
In Fig. 4, we show the hydrogen column densities or upper limits derived toward the AGN position of the GATOS Seyferts against the Eddington ratios. We used the ALMA estimates of from GB21 (see also Table 1), which were derived using the CO(3-2) data and the canonical CO-to-H2 conversion factor of the Milky Way. The ALMA values correspond to physical resolutions of pc. To derive we assumed that the molecular gas phase is dominant on these scales (see for instance the simulations of Wada et al., 2016). We note that these values are not the measured column densities of the individual clumps. However, they likely give an estimate of the average properties of the clumps modulo the (unknown) filling factor. In X-rays, the derived are only along the line of sight. We therefore assume that (ALMA) for each galaxy is representative of those clouds located in the dusty wind launching region. We also included in this figure NGC 1068 and Circinus, which show clear polar mid-IR emission (see Cameron et al., 1993; Packham et al., 2005a, respectively). For the latter, the ALMA hydrogen column densities are from García-Burillo et al. (2019) and Izumi et al. (2018), respectively.
We also plot in this figure the predicted blowout region (the area below the solid line) derived by Fabian et al. (2008), which is not populated by AGN. The area in this figure near the dashed line (computed when , see Venanzi et al., 2020), shows the region where we would expect to find AGN with IR-dominated outflows. As discussed by these authors, below approximately which is equivalent to an optical depth in the near-IR below one, the driving of infrared radiation is not effective.
We find that the GATOS Seyferts with extended mid-IR emission in the (projected) polar direction (NGC 1365, NGC 3227, NGC 4388, and NGC 7582) as well as NGC 1068 and Circinus are located close to the region where polar dusty outflows are more likely to be launched. Among these galaxies, NGC 3227 and NGC 1068 present evidence of molecular outflows in CO transitions on the torus scales (pc, see Alonso-Herrero et al., 2019; García-Burillo et al., 2019). The ALMA observations of Circinus show, on the other hand, a nuclear outflow with a modest velocity (Izumi et al., 2018). These authors predicted that a significant mass in the wind will fall back to the disk. NGC 3227, NGC 4388 and NGC 7582 as well as NGC 1068 show evidence of molecular outflows on physical scales larger than the torus (up to a few hundred parsecs, see Davies et al., 2014; García-Burillo et al., 2019; Domínguez-Fernández et al., 2020, and GB21), which are more likely due to the interaction between the AGN wind and/or a radio jet if present and molecular gas in the disk of the host galaxy.
NGC 5643 and NGC 5506 appear to have extended both polar and equatorial mid-IR emission. In NGC 6300 the mid-IR emission might be due to dust in the equatorial direction of the torus as well as in the host galaxy. According to the Venanzi et al. (2020) simulations, galaxies with relative high Eddington ratios that lie to the left of the dashed line might be more conducive to having equatorial outflows. This is the case for NGC 5643 (see Alonso-Herrero et al., 2018). Moreover, these equatorial outflows are not likely to be efficient (maybe not just yet) at clearing the nuclear regions of NGC 5643 and NGC 6300 (and others), as shown observationally by GB21.
NGC 6814 and NGC 7314 are close to the blowout region, where polar dusty outflows should not be prominent. The CO(3-2) map of NGC 6814 of GB21 (their Fig. 10) shows that there is little molecular gas in the nuclear and circumnuclear regions of this galaxy, in agreement with being in the blowout region and an unresolved mid-IR morphology. NGC 7314, on the other hand, contains more molecular gas with two CO peaks located symmetrically around the AGN in the inner 40 pc (Fig. 13 of GB21). This might indicate that some clearing of molecular gas at the AGN location already took place in the nuclear regions of this galaxy. For this galaxy, the mid-IR emission is mostly unresolved. Finally the low nuclear column density and Eddington ratio of NGC 4941 amd NGC 7213 place these galaxies in a region in Fig. 4 where dusty winds are not launched. This is in agreement with the unresolved mid-IR morphology.
| Name | Symbol | Range | NGC 7213, NGC 6814 |
|---|---|---|---|
| Disk radial index | [, ] | ||
| Wind radial index | [, ] | ||
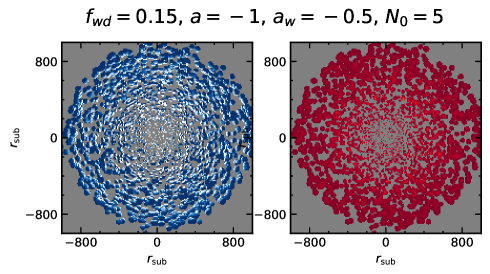
| Wind-to-disk cloud ratio | [0.3, 0.6, 0.9, 1.2] | 0.15 | |
| Number of clouds along disk equator | 10 | 5 | |
| Inclination (∘) | [30, 45, 60, 75] | [0, 15, 30] | |
| Disk height | [0.1, 0.2, 0.3] | 0.1 | |
| Wind angular width (∘) | [5, 10, 15] | 10 |
In summary, seven galaxies in our sample show both Eddington ratios and nuclear column densities favorable to launching polar and equatorial dusty winds. The remaining have either low nuclear hydrogen column densities and/or low Eddington ratios, and thus dusty winds might not be likely.
5 CAT3D-WIND mid- and far-IR model images
In Sect. 3.3 we showed that there is a diversity of nuclear (1-1.5″) mid-IR morphologies in the GATOS Seyferts with the unresolved component dominating the emission. At m, on the other hand, GB21 found that the extended component is dominant on these scales. In this section we use the radiative transfer model of a clumpy disk and wind dubbed CAT3D-WIND and presented in Hönig & Kishimoto (2017) to generate model images in the mid- and far-IR. The goal is to explore the morphologies at these wavelengths for several disk and wind configurations and geometries as informed by fits to their IR emission. In Sect. 6 we then simulate CAT3D-WIND model images with angular resolutions corresponding to those of our mid-IR and ALMA observations.
5.1 Brief description of the models
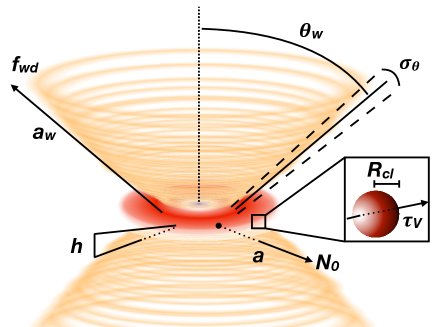
The CAT3D-WIND model includes both a traditional dusty clumpy disk (or geometrically thin torus), which is based on that of Hönig & Kishimoto (2010), and a dusty clumpy wind perpendicular to the torus. The latter is included to account for the polar dust emission detected in local AGN (see, e.g., Asmus et al., 2016; Asmus, 2019). The clouds have an optical depth of and describes the number of clouds along the equatorial direction of the torus. The clouds are distributed following a radial power law () with indices for the disk and for the wind. The wind-to-disk ratio is the number of clouds along the cone with respect to . The vertical distribution of the disk follows a Gaussian distribution with a dimensionless scale height and the vertical distance from the mid-plane in units of the sublimation radius (). The wind is modelled as a hollow cone with a half-opening angle of and walls with an angular width of . Figure 5 shows a sketch of the model and its parameters.
The inner radius is determined by the dust , which the model takes as pc at and the scaling is then (see Hönig & Kishimoto, 2010, for more details). is the accretion disk bolometric luminosity computed as .
5.2 Selection of model parameters and generation of model images
The CAT3D-WIND model has a large number of parameters to describe the disk and the wind components (see table 1 of Hönig & Kishimoto, 2017). Since we are interested in comparing the observed mid- and far-IR observations of the GATOS Seyferts with CAT3D-WIND model images, in this work we concentrate on some of the main parameters that define the geometry and thus are more likely to control the morphologies. These are the indices of the radial distribution of the clouds in the disk and the wind ( and ), the wind-to-disk ratio of clouds (), as well as the inclination. As we shall see, the disk height and angular width of the cone walls play an important role on the self-obscuration of the disk and wind in the mid-IR.
González-Martín et al. (2019) fit Spitzer/IRS spectroscopy of a large sample of local AGN using a variety of torus models, including CAT3D-WIND. They found that CAT3D-WIND provided a good fit for approximately half of their sample. In particular, they reproduced better the mid-IR spectra of type 1 AGN than type 2 as well as the spectra of the more luminous AGN in their sample. Eight of the GATOS Seyferts are in their sample. Rather than focusing on the individual fits, we based our choice of the CAT3D-WIND parameters on the derived ranges (see Table 4 and below) for these Seyferts, regardless of whether we detected a bright extended mid-IR component or not. We included the following combinations of cloud radial distributions:
-
•
compact disk - extended wind, and
-
•
extended disk - compact wind, and
-
•
compact disk - compact wind, and
-
•
extended disk - extended wind, and
We used four values of the wind-to-disk ratio of clouds: and four values of the inclination: (nearly face-on view of the disk), and (nearly edge-on view of the disk). We fixed the following parameters, and the half-opening angle of the wind . We took ranges of the angular width of the wind and height of the disk . We distributed the dust over a region of in size. This corresponds to typical physical sizes of tens of parsecs for our sample (see Sect. 6.2), which are needed to reproduce the relatively large ALMA tori.
We additionally generated CAT3D-WIND model images for the specific cases of NGC 7213 and NGC 6814, for which González-Martín et al. (2019) derived some model parameters outside the range found for the rest of the galaxies in our sample. In particular, they fitted relatively low values of the number of clouds along the disk equator, the fraction of wind-to-disk cloud ratio, and inclination. The low fitted agree with the relatively little amounts of nuclear cold molecular gas (see Alonso-Herrero et al., 2020, and GB21, see also Table 1) detected in these two galaxies. Table 4 summarizes the CAT3D-WIND parameters selected to generate model images in this work.
We generated model monochromatic images at two mid-IR wavelengths, namely, and m to encompass approximately those of the central wavelengths of the observation filters. We used as a far-IR wavelength m, which is one of the wavelengths of the model standard grid (the next one is m). Taking into account the model parameters (see Table 4) and the three wavelengths, we generated a total of 1728 + 9 model images777The CAT3D-WIND model images and corresponding SEDs can be found at http://cat3d.sungrazer.org.. We resampled the images from the model natural resolution of to a pixel size of . As we shall see in Sect. 6.2, this resolution is higher than that achieved with the current ground-based mid-IR imaging and ALMA angular resolutions. We also note that the and m model images are similar and thus, we only show in the figures an discuss in the following sections the former.
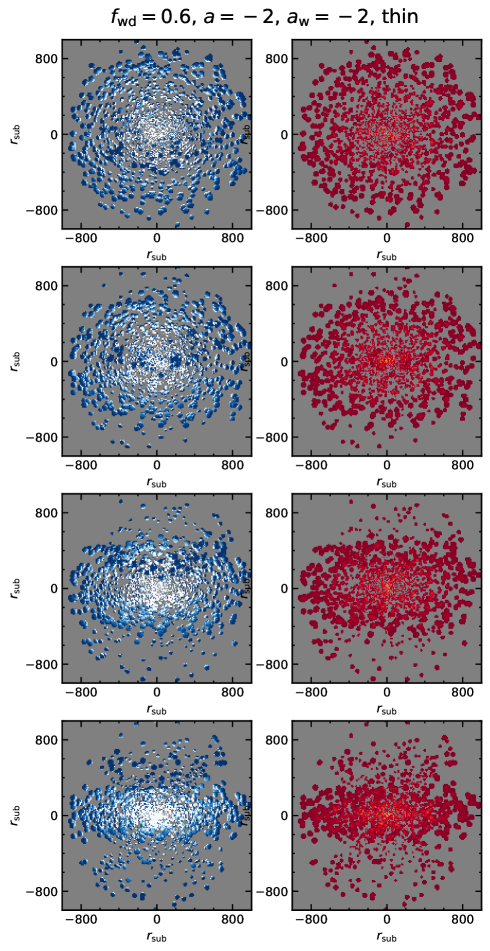
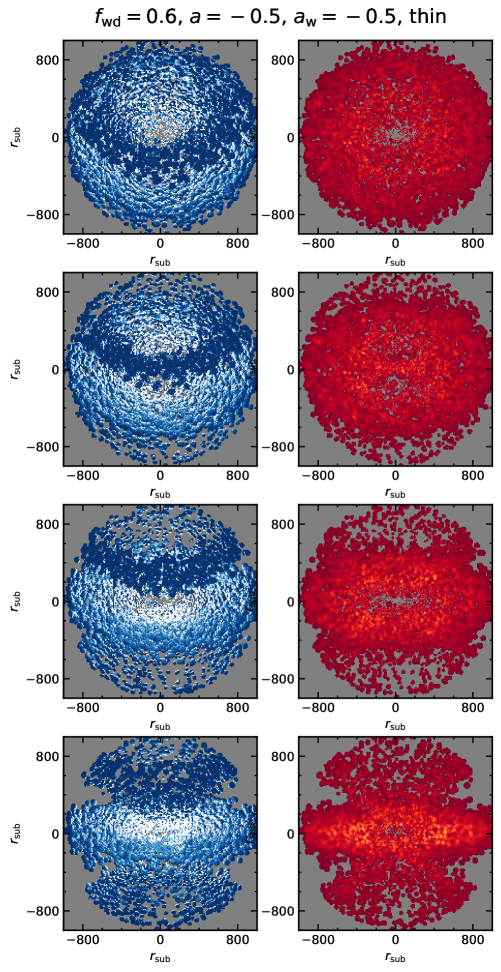
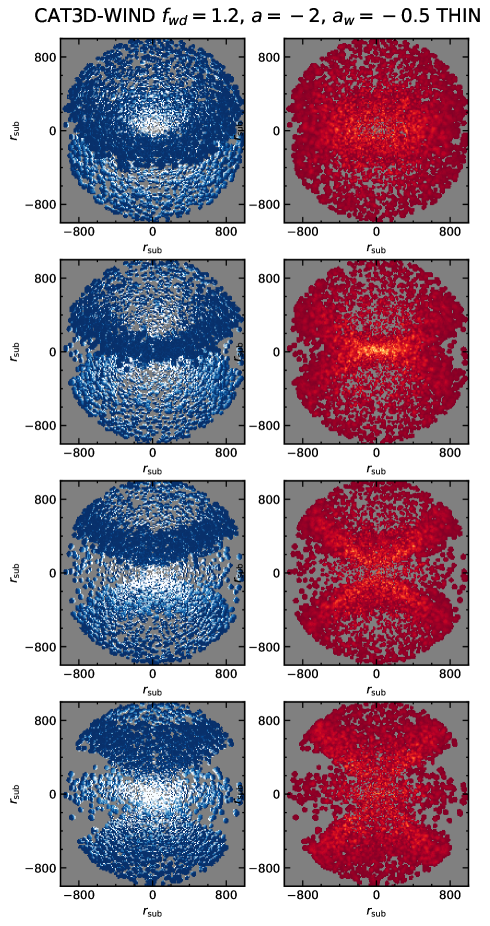
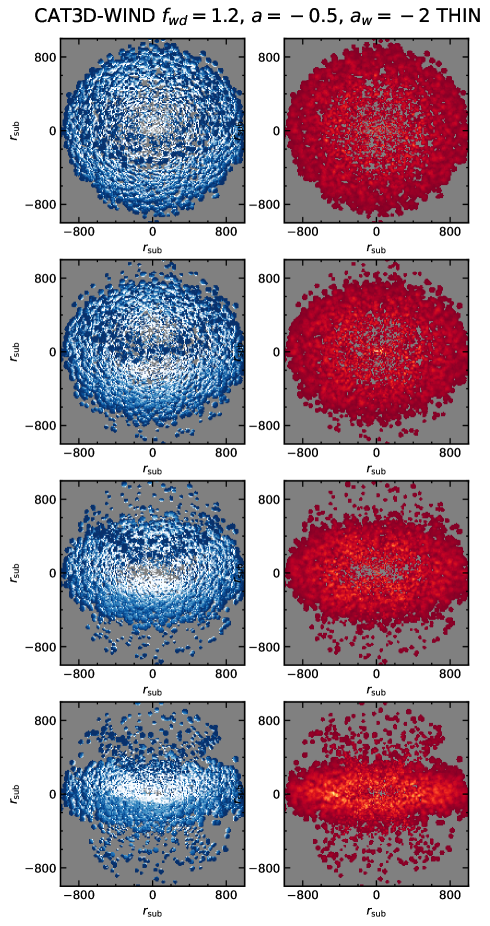
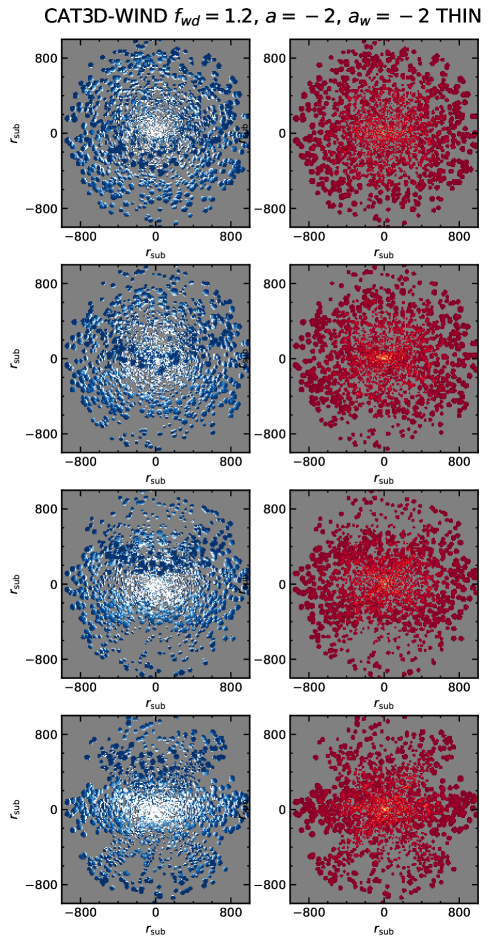
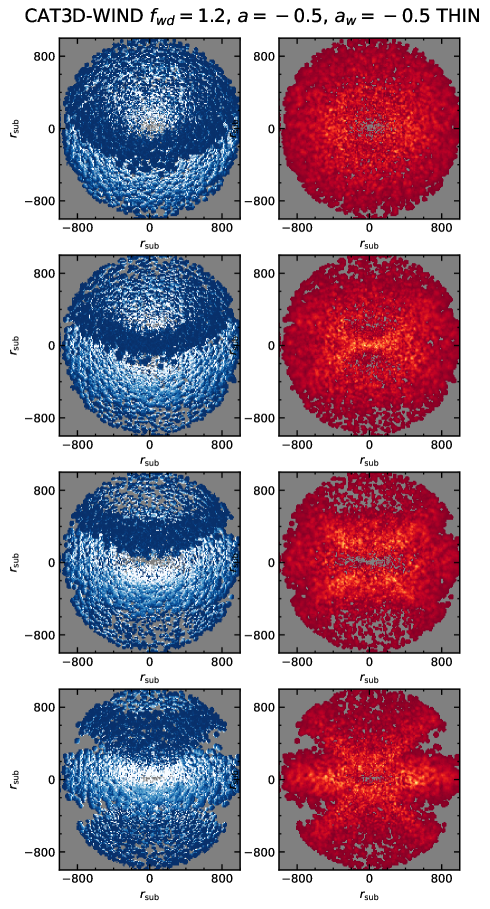
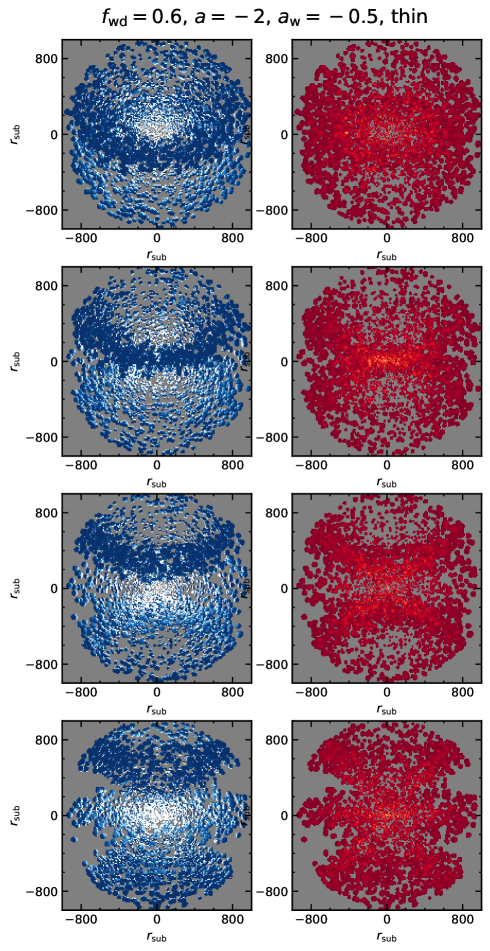
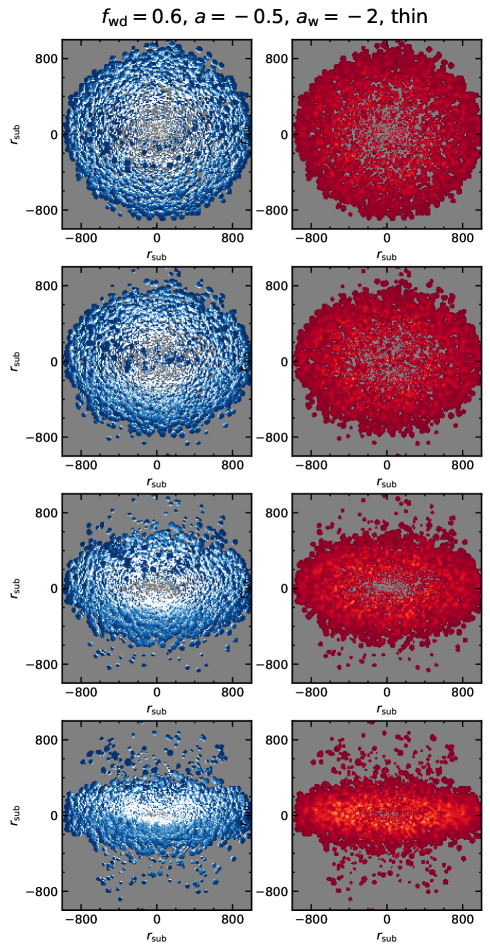
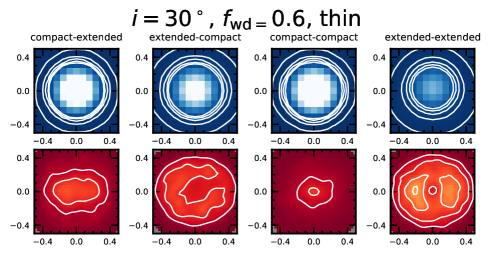
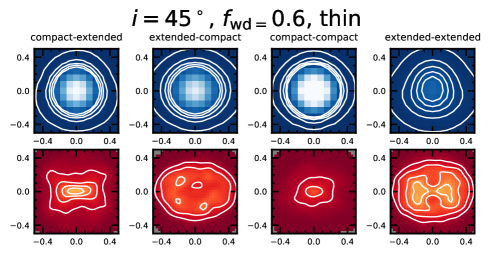
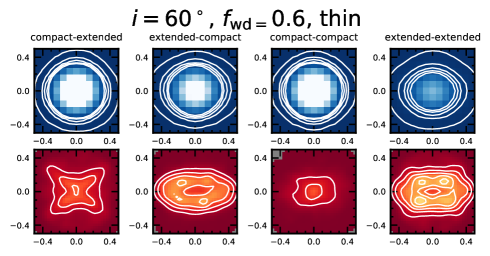
5.3 “Thin” geometries
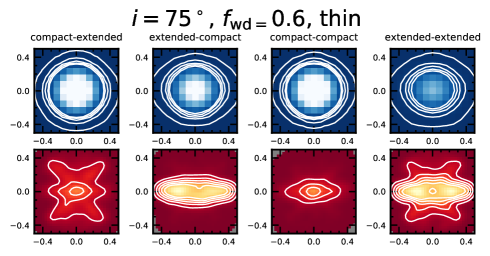
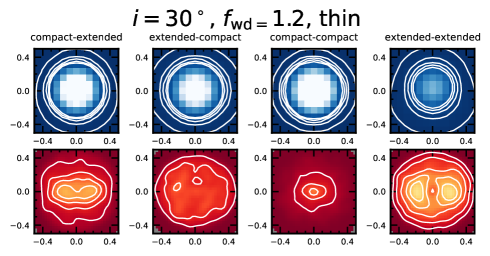
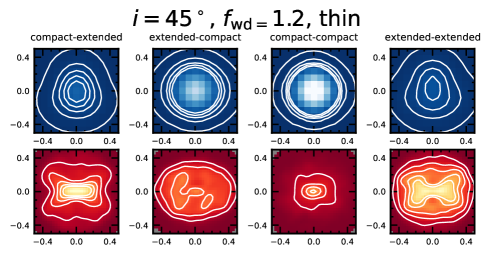
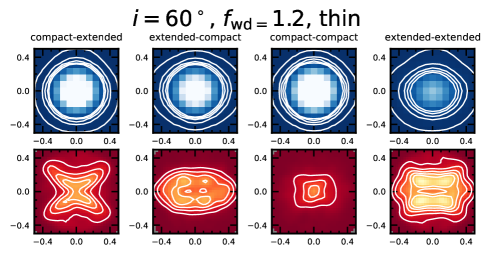
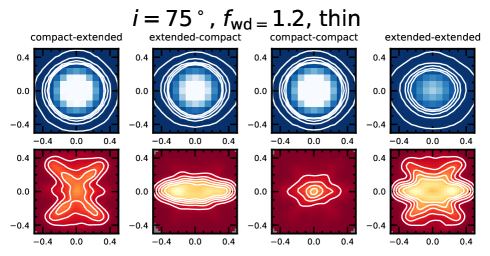
We start by presenting the model images for a “thin” geometry, that is, a disk height and cone walls with . This geometry suffers less from self-obscuration effects. Figures 6 and 7 show the mid- and far-IR images for the compact disk- extended wind and extended disk - compact wind combinations, at the four selected inclinations and for an intermediate value of the wind-to-disk ratio, (see Appendix for images with . In Figs. 20 and 21 in the Appendix we show the compact disk - compact wind and extended wind - extended disk configurations. In all the figures, we plotted the images in a linear scale and with the same scaling values for all geometries and inclinations.
The wind component is clearly observed at intermediate-to-high inclinations and is more prominent, as expected, when the wind is in an extended configuration (Figs. 6 and 21). Moreover, the characteristic “X”-shape of the wind is most notable in the far-IR. At this wavelength the dust is optically thin. The disk and wind can have comparable far-IR brightnesses in the compact disk - extended wind configuration at relatively high inclinations ( and , two bottom panels of Fig. 6). The disk component, on the other hand, is brighter than the wind in the far-IR for the compact wind configurations (see Figs. 7 and 20). In the extended disk configurations (Figs. 7 and 21), the far-IR emission of the disk shows a ring-like morphology at all inclinations whereas in the compact disk configurations (Figs. 6 and 20) the far-IR emission peaks at the central position.
In the mid-IR, two-sided polar wind emission is also present at for the compact disk and extended wind configuration (see second panel from the top in Fig. 6). However, even for this “thin” geometry, it suffers moderately from self-obscuration due to the cone walls. Clearer two-sided polar morphologies in the mid-IR are seen in other geometries with the CAT3D-WIND models (see figure 1 of Hönig & Kishimoto, 2017) and other models (see for instance, Schartmann et al., 2014; Gallagher et al., 2015; Stalevski et al., 2017). We note that even at the disk component is quite prominent in the mid-IR in our “thin” geometry. For the wind-to-disk ratio considered in this section () and the majority of the disk-wind configurations and inclinations, the mid-IR emission comes mostly from the inner part of the disk/cone. For higher values of , bi-conical and one-sided polar emission morphologies in the mid-IR become more apparent (see Figs. 24 and 27 in the Appendix). At lower inclinations, part of the mid-IR emission arises from the far side of the cone at radial distances close to the heating source. It is also possible to observe both bright mid- and far-IR emission along the equatorial direction of the disk in the extended disk - compact wind configuration at high inclination (see the bottom panels of Fig. 7).
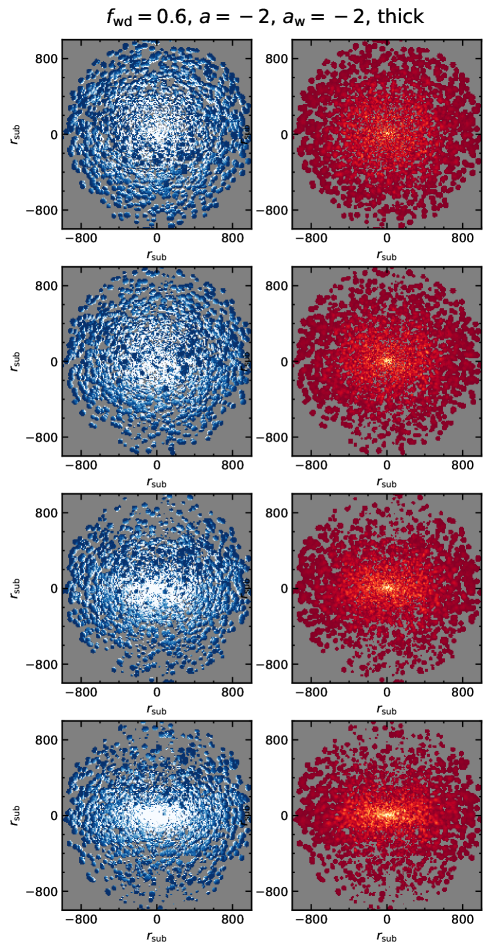
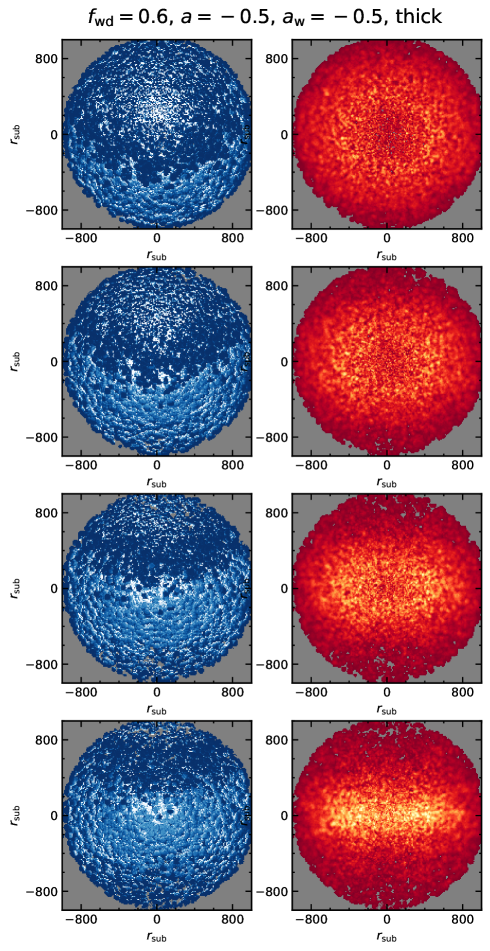
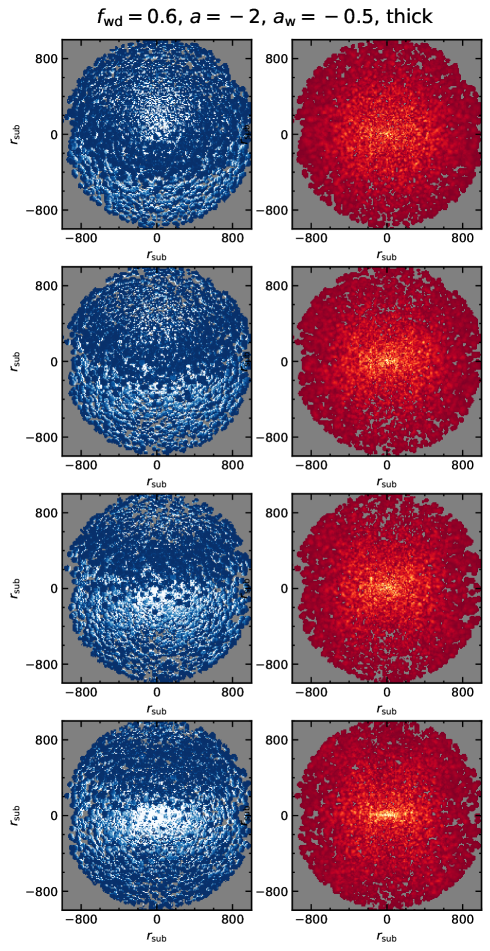
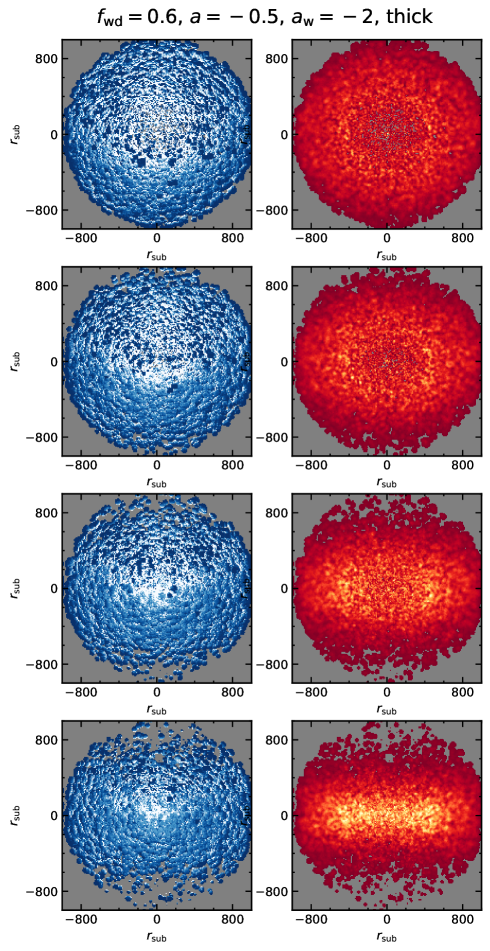
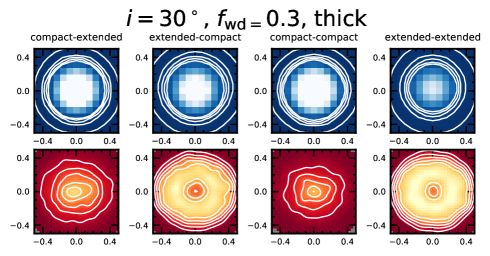
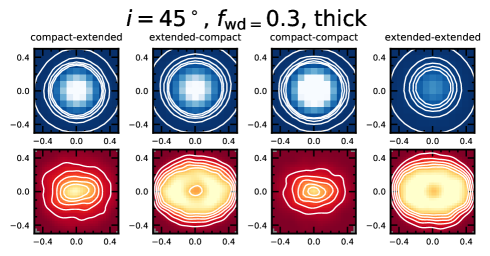
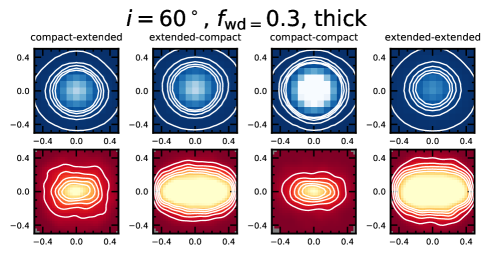
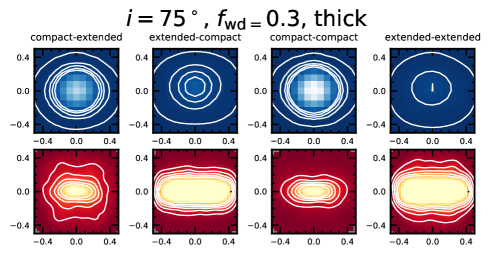
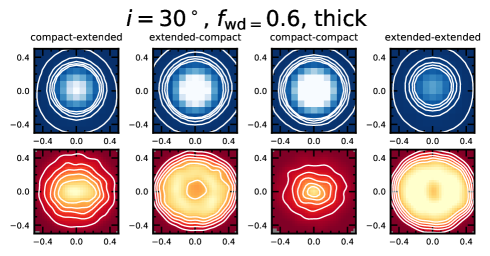
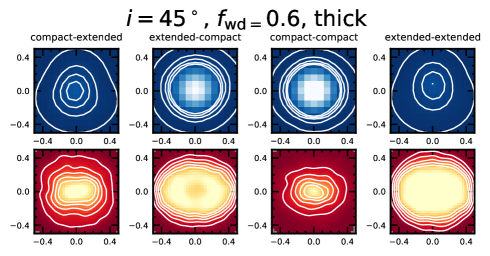
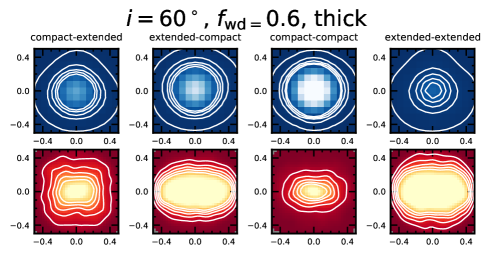
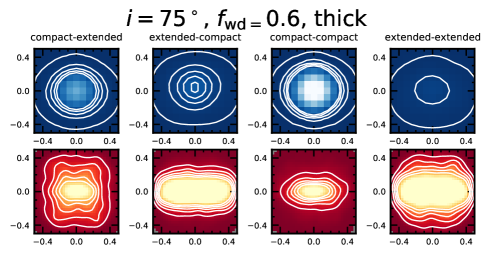
5.4 “Thick” geometries
Figures 8 and 9, and Figs. 22 and 23 in the Appendix present the images for “thick” geometries, that is, a disk height of and cone walls with , and . Note that this “thick” geometry does not mean a geometrically thick torus. None of the generated model images produces clear bi-conical dust emission morphologies in the mid-IR and at high inclinations (). Our value of produces relatively thick cone edges that obscure the near side of the cone. A similar effect also takes place for large values of when the number of clouds in the cone line-of-sight becomes too large.
At low and intermediate inclinations () there is one-sided polar dust emission in the mid-IR in all geometries (Figs. 8, 9 and 23) except for the compact disk - wind configuration. This mid-IR polar dust emission is only seen projected on the far side of the disk and is due to self-obscuration of the near side of the cone and disk. This morphology appears in all the values of the wind-to-disk ratio explored in this work. Torus models without the wind component can also produce this one-sided polar emission at intermediate inclinations and relatively large torus angular widths (see, e.g., Schartmann et al., 2008; Siebenmorgen et al., 2015; Lopez-Rodriguez et al., 2018; Nikutta et al., 2021). The details of the mid-IR morphology in the model images also depend on how obscuring the cone edges are (that is, the thickness of the cone walls).
In the two extended disk configurations (Figs. 9 and 23), the mid- and far-IR emissions have complementary morphologies. At low and intermediate inclinations () most of the mid-IR emission comes from the inner regions of the disk and the edges of the cone, whereas the far-IR emission is produced in the outer regions with an apparent ring-like morphology. At high inclinations most of the far-IR emission comes from the disk that shows a puffed-up morphology due not only to the thicker disk but also to the additional contribution from cold dust in the wind.
There is also polar dust emission in the far-IR with the characteristic “X”-shape at and for the extended wind configurations (Figs. 8 and 23). The constrast of the “X”-shape is however lower than in the “thin” geometry. Nevertheless, in the model with the steep cloud distribution profile in the disk (compact disk), this shape is seen more clearly. This is because in this configuration there are not too many clouds left at larger distances, so relatively more far-IR emission is coming from the cone edges.
The compact disk - wind configuration produces relatively similar morphologies in the mid- and far-IR (see Fig. 22), with a more roundish shape at lower inclinations and more elongated at higher inclinations, as expected. The mid-IR morphologies of this configuration are similar to those seen in clumpy torus models without a wind component but with similar steep radial dust distributions (see Schartmann et al., 2008).
5.5 The NGC 6814 and NGC 7213 geometry
Figure 10 shows the specific model mid- and far-IR images for NGC 6814 and NGC 7213 at . In the mid-IR a large fraction of the emission comes from the inner regions of the disk since the radial distribution of the clouds in the disk is moderately steep (). Moreover, because in this model the wind component is not prominent the effects of self-obscuration from the cone walls appear to be small. In the far-IR, the emission is relatively faint and diffuse due to the low number of clouds along the equatorial direction (), and it comes from the outer part of the disk and shows a nearly ring-like morphology.
6 Comparison between CAT3D-WIND model images and observations
The good angular resolutions achieved with ground-based mid-IR instruments on 8-10m class telescopes and ALMA resolve extended components in the mid and far-IR in nearby Seyferts (see Sect. 3.3 and references cited there). In this section we adapt the resolutions of the CAT3D-WIND model images to those of our data, and make a qualitative comparison between models and observations. We refer the reader to Lopez-Rodriguez et al. (2018) and Nikutta et al. (2021) for a similar comparison for NGC 1068 using the Nenkova et al. (2008b) model images produced with HyperCAT.
6.1 Summary of torus and wind properties of the sample
The CAT3D-WIND models produce a diversity of mid and far-IR morphologies (Sects. 5.3, 5.4 and 5.5) depending on our viewing angle (inclination) as well as the radial distributions assumed for the disk and wind components and the thickness of the disk and cone walls. In this section we compile values of the torus inclination and sizes as well as the wind properties derived from different types of modelling to aid the comparison between models and observations in Sect. 6.2.
For the torus/disk component, we list in Table 3 the estimated inclinations using fits to the high angular resolution IR SEDs and mid-IR spectroscopy using the clumpy models (Nenkova et al., 2008a, b) and fits to the Spitzer/IRS spectroscopy with the CAT3D-WIND torus models (Hönig & Kishimoto, 2017). We also included the inclination values derived from fits to the X-ray emission using the xclumpy model (Tanimoto et al., 2019, 2020; Ogawa et al., 2021). Additionally, there are lower limits to the torus inclination based on the ellipticity of the ALMA extended m continuum images from GB21. We also provided in this table estimates of the nuclear disk/torus inclination based on the modelling of the ALMA CO(3-2) and CO(2-1) kinematics, and the sizes and PA of the extended m sizes from GB21.
We additionally summarized in Table 3 some information about the wind/NLR/cones components. In the simplest scenario these components are perpendicular to the nuclear disk/torus. We included the PA of the NLR (see Sect. 3.4 for references), as well as the inclinations and PA of the cones derived from the modeling of the NLR kinematics by Fischer et al. (2013) for the galaxies in common with our work. The constraints on are from González-Martín et al. (2019).
6.2 Fiducial model images for GATOS Seyferts
To match the angular resolutions of the models to those of the observations, we need estimates of . For NGC 1365, recent GRAVITY -band interferometry derived a radius of 0.035 pc (scaled to our distance) for the hot dust emission (Gravity Collaboration et al., 2020a). Using the relationship between the absorption-corrected keV luminosity and (Jensen et al., 2017), we obtained values ranging from pc for NGC 4941 to pc for NGC 7582. We can derive another estimate using the radius-luminosity relation seen from GRAVITY observations (Gravity Collaboration et al., 2020a), which for the typical bolometric luminosities of our sample provides pc. We take this as a representative value for our sample. For NGC 7213 we use the value of pc (scaled to our distance) from Hönig et al. (2010) based on -band reverberation mapping from Kishimoto et al. (2007).
The CAT3D-WIND model images cover typical physical sizes of or approximately angular sizes of for a median distance of 19 Mpc for our galaxies, excluding NGC 6814 and NGC 7213. For these two galaxies, the model images have sizes of = at a distance of 23 Mpc. We convolved the m and m model images to the typical mid-IR and ALMA far-IR angular resolutions of and , respectively, using a Gaussian function. Finally, we resampled the CAT3D-WIND simulated images to representative pixel sizes of ″/pixel for the mid-IR (0.0453″/pixel for NGC 7213) and 0.03″/pixel for the far-IR images.
We show a selection of fiducial simulated images for the GATOS Seyferts. In Figs. 11 and 12, we include models with a “thick” geometry and two values of the wind-to-disk ratio and (compare with the original resolution model images in Sect. 5.4). In Figs. 13 and 14 we display the simulated images for a “thin” geometry with (compare with the original resolution model images of Sect. 5.3) and (compare with model images in the Appendix), respectively. In the next two sections, we describe the morphologies of the fiducial models and make qualitative comparisons with our far-IR and mid-IR observations.
6.2.1 Mid-IR model images
The fiducial mid-IR simulated model images do not show a high level of detail compared to the far-IR. The reasons are twofold. First, most of the mid-IR emission in many of the geometries studied in this work comes from the inner part of the disk and wind. Second, the angular resolution of our mid-IR observations is a factor of three worse than the ALMA ones. Nevertheless, there are some morphological differences in the mid-IR.
The large majority of the CAT3D-WIND model parameters investigated here produces bright and centrally peaked mid-IR emission, which appears unresolved or only slightly resolved at the considered angular resolution. This is most noticeable for compact disk configurations as well as the case of the specific simulation for NGC 6814 and NGC 7213 (left panel of Fig. 15). There is extended mid-IR emission along the polar direction at intermediate inclinations () for the extended wind configurations in both “thin” and “thick” geometries with and (second panels from the top in Figs. 12, 13, and 14) and the case of a mild extended wind with (see Fig. 11) as well as at nearly face-on inclinations () for (top panels of Fig. 14). Extended mid-IR emission along the equatorial and/or polar direction of the disk is produced at high inclinations in extended disk configurations.
To evaluate the unresolved and extended contribution in the simulated mid-IR model images, we followed a similar procedure as for the observations in Sect. 3.1. We fitted 1D profiles along the equatorial and polar directions. For the unresolved component we fixed the Gaussian width to the value used to convolve the original CAT3D+WIND images. With the scaling factors derived from these fits, we subtracted the PSF image from the fiducial mid-IR model images.
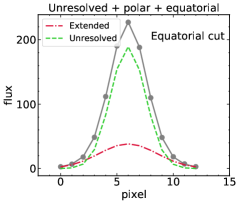
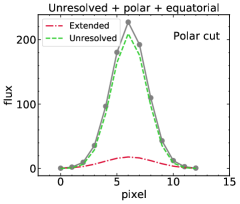
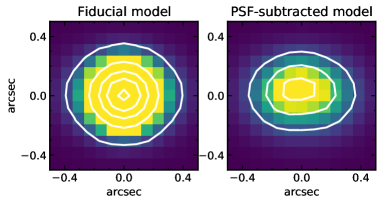
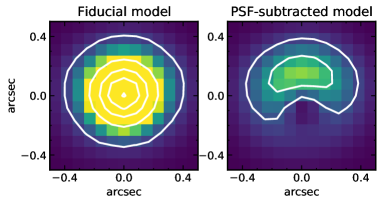
Rather than fitting the individual galaxies, in Figs. 16-19 we show some model examples of the different observed mid-IR morphologies. The case of unresolved + two-sided polar mid-IR emission (Fig. 16) is seen in a compact disk - extended wind “thin” geometry with a high wind-to-disk ratio (, in the figure), at an intermediate inclination of . These parameters are based on the constraints for NGC 1365, including the relatively compact torus seen with ALMA (see Table 3). The 1D profiles and PSF-subtracted model image show that the extended component is more relevant along the polar direction.
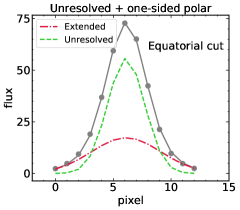
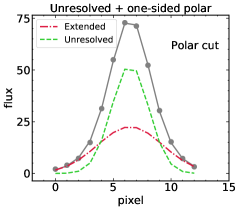
The unresolved + one-sided polar mid-IR emission (Fig. 17) is seen mostly at intermediate inclinations ( in the figure) in the simulated image and profiles, for extended disk - extended wind configurations with a “thick” geometry. Low to intermediate wind-to-disk values ( in the figure) are needed to have an important contribution from the unresolved mid-IR emission, as seen in our observations of NGC 3227, and NGC 7582.
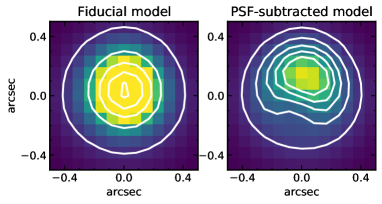
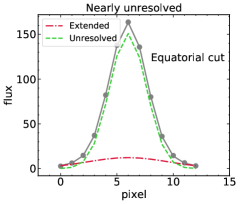
The combination of unresolved + equatorial mid-IR emission (Fig. 18) is observed at higher inclinations ( in the figure) with a “thick” geometry and extended disk and compact wind ( in the figure). The PSF-subtracted mid-IR model image shows a morphology consistent with the observations of NGC 6300. Finally, we checked models that produce nearly unresolved mid-IR morphologies (Fig. 19) such as a “thick” geometry and extended disk and compact wind with in the figure for an inclination of . This would reproduce the case of NGC 7314 which has a large m torus but mostly unresolved mid-IR emission.
6.2.2 Far-IR model images
All the simulated far-IR model images are resolved and show a variety of morphologies. This is in excellent agreement with the observational result that the extended ALMA m emission in most GATOS Seyferts dominates the total emission at this wavelength (see GB21 for more details). At low-to-intermediate inclinations, the far-IR simulated model images with extended disk components show ring-like morphologies. As expected, the compact disk configurations show a more compact far-IR morphology. At high inclinations and extended wind configurations, the characteristic “X”-shape due to the edge brightening in the cone walls, is seen in the “thin” geometry and high values of the wind-to-disk cloud ratio (the two bottom panels of Figs. 13 and 14, that is for and ). It is also seen, although with low contrast, for and “thick” geometries (Figs. 11 and 12). The ALMA m images of a few GATOS Seyferts are suggestive of this “X”-shape, for instance, NGC 5643, NGC 7314, and especially in NGC 7582 (see Figs. 2-4 in GB21 and Fig. 3). NGC 4388 shows mixed/polar emission at m. A compact disk and compact wind “thick” configuration with a low wind-to-disk ratio and seen at an intermediate inclination reproduces well the observed morphology.
We show the specific simulation for NGC 7213 in Fig. 15 (right panel), which is also valid for NGC 6814. The far-IR model image shows a ring-like geometry due to the low inclination of and the cloud radial distribution in the disk. The ALMA extended m emission of NGC 6814 and NGC 7213 (Fig. 3 in GB21) shows centrally peaked emission. As discussed by GB21, it is possible that a large fraction of this emission is not associated with cold dust. This was based on the discrepancies between the molecular gas masses derived from the CO(3-2) and the m emission.
7 Discussion
The emerging picture for the central regions of radio-quiet AGNs has the obscuring torus as part of a gas flow cycle where gas is brought in from the host galaxy and then driven out by the AGN in a wind (see Elitzur & Shlosman, 2006). High angular resolution observations gathered over the last 15 years point to a multi-phase multi-component structure where both the disk/torus and the base of the wind can contribute to the AGN obscuration (see the review by Ramos Almeida & Ricci, 2017). Recently Hönig (2019) used simple physical principles to support this new unifying view in a disk+wind scenario. Up until now, this view was based on observations of a few individual AGN. GATOS aims for a comprehensive study of the nuclear activity and its connection with the host galaxy in a well-defined sample of nearby Seyfert galaxies.
7.1 Observational considerations
One of the main caveats from the analysis of the extended mid-IR emission with ground-based facilities is the stability of the PSF. Observing conditions can change on scales of a few minutes and affect the shape of the PSF, which we took from the emission of a standard star observed close in time. This combined with the modest sensitivity to diffuse emission due to the high thermal background make it challenging to derive the morphologies of the extended mid-IR emission in the vicinity of the unresolved AGN emission. Nevertheless, we detected extended mid-IR emission in seven of the twelve Seyfert galaxies analyzed in this work, with sizes between 50 and 160 pc.
The measured orientations of the extended mid-IR emission are approximately along the polar/NLR direction and perpendicular to the ALMA-identified tori (Fig. 3) in five galaxies (NGC 1365, NGC 3227, NGC 5643, and NGC 7582, and tentatively in NGC 4388) as well as the inner regions of NGC 5506 (see also Asmus, 2019). In NGC 5506, NGC 5643, and NGC 6300, there is also extended mid-IR emission along the equatorial direction of the torus and/or the host galaxy, adding to the complexity of the dust emission. The extended mid-IR emission along the polar direction is likely associated with AGN-driven dusty outflows (Wada et al., 2018; Williamson et al., 2020; Venanzi et al., 2020) and/or dust located in the edges of the NLR and ionization cones. With the existing data, we cannot distinguish between the two possibilities. We note that contributions from emission lines in the imaging filters, in particular [Ne ii]m in NGC 5643 and NGC 7582, might be partly responsible for the alignment along the polar direction. However, there are galaxies in our sample with relatively bright optical NLR emission and faint or no extended polar mid-IR emission.
7.2 The role of the IR radiation pressure
In the immediate surroundings of an active nucleus, the gas and dust are subject to the AGN radiation pressure. In particular, the AGN IR radiation pressure may play a significant role in both maintaining the vertical extent of the torus and launching dusty outflows (Pier & Krolik, 1992b; Krolik, 2007; Fabian et al., 2008; Venanzi et al., 2020; Tazaki & Ichikawa, 2020). We investigated the observed mid-IR morphologies of our sample in the context of the Venanzi et al. (2020) semi-analytical disk+wind models, which include the AGN radiation pressure, gravity from the central black hole, and the IR radiation pressure. They showed that dusty outflows are launched more efficiently when the IR radiation pressure is the dominant component. This takes place when the AGN radiation pressure balances gravity from the central black hole.
We found that those Seyferts with polar mid-IR emission show intermediate nuclear hydrogen column densities () and moderate Eddington ratios (). As can be seen from Fig. 4, the observed nuclear column densities and Eddington ratios place them close to the region where the IR radiation pressure is most effective. However, polar outflows are also possible at high nuclear column densities for sufficiently high Eddington ratios, as is the case of NGC 1068 and even Circinus. The dashed line plotted in Fig. 4 is thus not a hard boundary, but it rather indicates the combination of Eddington ratios and column densities where the IR radiation pressure dominates for individual clouds. The well-studied case of Circinus illustrates this. Indeed, Venanzi et al. (2020) used their simulations and predicted a disk + wind distribution for this galaxy, in good agreement with both observations (Packham et al., 2005a) and the radiative transfer modeling done by Stalevski et al. (2017).
Molecular outflows at the torus or its vicinity (tens of parsecs) are observed in some nearby Seyferts (see Gallimore et al., 2016; Izumi et al., 2018; Alonso-Herrero et al., 2019; García-Burillo et al., 2019), and are also predicted by hydrodynamic simulations of radiation-driven winds (Wada et al., 2016; Williamson et al., 2020). In addition, the AGN in Fig. 4 in the region where outflows are launched also show strong evidence for the clearing of (cold) molecular gas in the nuclear regions, possibly related to these nuclear outflows (see GB21 and also Alonso-Herrero et al., 2019). We also note that in some Seyfert galaxies (for instance, NGC 1068) the radio jet may also play a role in maintaining or even boosting radiation-driven outflows. This is particularly true, when the molecular outflows occur at 100 pc scales far from the scales where the IR radiation of the disk/torus dominates (that is, near the sublimation radius, see Venanzi et al., 2020).
Seyferts with both polar and equatorial mid-IR emission have moderate-to-low Eddington ratios (), and high column densities (). As shown by Venanzi et al. (2020), these conditions might be more conducive to equatorial dusty outflows (see Alonso-Herrero et al., 2018) since large column densities might suppress the liftup of material. The galaxies with little or no extended mid-IR emission are the least luminous in terms of their keV luminosities, typically below . In Fig. 4 they are in regions of this diagram where dusty outflows are not expected, either because they are close to the blowout region or their Eddington ratios are very low. In the scenario proposed by GB21 these are galaxies where we would not expect to see the imprint of AGN feedback from nuclear outflows.
The predictions of the models used above regarding the behavior of outflows as a function of location in the - space should only be taken as broad characterisations, rather than as strict laws. Venanzi et al. (2020) represented clouds as indivisible particles, while Fabian et al. (2008) represented the entire gas distribution as a thick spherically symmetric shell. However, any optically thick cloud experiencing radiation pressure that is above the effective Eddington limit for dusty gas will fragment through the radiative Rayleigh-Taylor instability into fingers of low density outflow and high density inflow (Jacquet & Krumholz, 2011; Zhang et al., 2018). Finally, winds do not need to be launched as polar winds to obtain a polar outflow. The anisotropy of the AGN emission, combined with anisotropic extinction from a torus, causes more equatorial outflows feel less radiation pressure and are more likely to fail, even if they are injected at the same speed (Williamson et al., 2020). Thus, non-polar outflows are therefore likely to evolve into polar outflows. Anisotropy and gas instabilities together mean that outflows and inflows can exist (and even co-exist) across a wide range of inclinations, column densities, and Eddington factors. Further observations and simulations are needed to better constrain the necessary parameters for a polar outflow.
7.3 Disk-wind models
The CAT3D-WIND models capture qualitatively the expected dust and gas configurations predicted by simulations of dusty disks (see Figs. 10-12 of Venanzi et al., 2020) and/or dust in the NLR walls illuminated by the AGN. Moreover, the wind-to-disk cloud ratio in the CAT3D-WIND models can also be associated qualitatively with feedback effects seen observationally in our sample at high AGN luminosities and/or Eddington ratios (see GB21). Out of the large parameter space of the CAT3D-WIND models, in this work we selected parameter ranges based on results from fitting the Spitzer/IRS spectra (González-Martín et al., 2019) for several GATOS Seyferts. Additionally, we distributed the dust in the models over characteristic physical sizes of . These were motivated by the ALMA resolved molecular dusty tori of our sample (GB21) as well as the presence of extended mid-IR components. However, we emphasize that the dust emission is from a disk+wind configuration, and any additional dust is not treated in the picture, but it may exist in reality.
We showed in Sect. 6 that to make meaningful comparisons between the CAT3D-WIND model images and observations, even if only qualitatively, it is necessary to convolve and resample the models to the typical angular resolutions and pixel sizes. The level of morphological detail in the mid- and far-IR as well as the unresolved mid-IR emission fractions depend on the assumed sublimation radius. If we adopted a factor of two smaller sublimation radius (pc) for the fiducial models, the simulated images would cover typically or approximately . In those mid-IR models dominated by the point source, a larger fraction of the mid-IR emission would be unresolved. Detailed morphological comparisons on a case-by-case basis require accurate estimates of the sublimation radius as well as higher angular resolution observations, especially in the mid-IR.
In the fiducial CAT3D-WIND models produced for our sample, we found that the mid-IR emission comes mainly from the inner part of the disk/cone for all values of the wind-to-disk cloud ratios and all inclinations. Extended bi-conical and one-sided polar mid-IR emission becomes more apparent in the extended-wind configurations at . The latter morphology is present mostly at intermediate inclinations in the “thick” geometry because of the disk and cone wall obscuration. Torus models without a wind component also give rise to similar one-sided mid-IR morphologies due to self obscuration (see e.g., Siebenmorgen et al., 2015; Lopez-Rodriguez et al., 2018; Nikutta et al., 2021).
To reproduce the relatively large contributions from the unresolved component seen in the mid-IR at our resolution requires low to moderate values of the wind-to-dust ratio () in most GATOS Seyferts. We also note, that although clumpiness introduces some inhomogeneities, the CAT3D-WIND models produce mostly symmetric (with respect to the wind axis) wind/hollow cone morphologies. For several bright nearby AGN the polar extension observed in the mid-IR is preferentially tilted towards one side of the ionization cone and counter-cone, similarly to observations of the NLR. Circinus is one of the best examples of this (see Packham et al., 2005a; Stalevski et al., 2017). This could be just a sign of general inhomogeneity of outflows (Wada et al., 2016, 2018) or a slight misalignment of accretion disk and dust disk from where the winds are driven, as proposed by Stalevski et al. (2017).
The observed ALMA m disk-like morphologies and extents of the GATOS Seyferts are reproduced qualitatively with the simulated CAT3D-WIND model images, including those with a dominant equatorial torus emission as well as the small number of galaxies with far-IR along the polar direction. The characteristic “X”-shape associated with the dusty winds (see e.g., Wada et al., 2016; Williamson et al., 2020) is seen at intermediate to edge-on inclinations in the extended disk and wind model configurations. Furthermore, this morphology is appreciated better for higher values of and thin cone walls, and in the far-IR rather than the mid-IR. In a few Seyferts in our sample (NGC 5643, NGC 7314, and NGC 7582), there is some evidence of this “X”-shape.
Observationally, the clearest example of an “X”-shape morphology is observed in the HCO+(4-3) dense molecular gas emission of NGC 1068 (see Figs. 11 and 12 of García-Burillo et al., 2019). Moreover, at m the torus of NGC 1068 is resolved in the equatorial direction but it also shows a polar elongation (García-Burillo et al., 2016), as in the simulations. The dusty torus/disk may spread over larger regions (diameter of pc), as traced by near-IR scattered light (Gratadour et al., 2015). The sublimation radius of pc and torus diameter of pc of NGC 1068 mean that in a CAT3D-WIND model the dust should be distributed over a region of in diameter, but mostly concentrated towards the smaller region probed by the ALMA continuum. The polar component in the mid-IR is more extended and brighter to the north of the AGN (Tomono et al., 2001). For the estimated (García-Burillo et al., 2019), a model with a compact disk - extended wind configuration and a “thin” geometry reproduces all these observations (Fig. 13). Higher angular resolution ALMA continuum images are needed for NGC 1068 and other nearby Seyferts to confirm the “X”-shape morphologies.
8 Summary
In this work we analyzed high-angular ()
mid-IR imaging observations of 12 GATOS Seyferts and compared them
with the ALMA observations from Paper I (GB21).
We assessed the observations in the context of the Venanzi et al. (2020)
semi-analytical models which include the AGN radiation pressure,
gravity from the central black hole, and the IR radiation pressure. Motivated by the observed mid- and far-IR morphologies in our sample, we generated new radiative
transfer CAT3D-WIND models (Hönig & Kishimoto, 2017) and m,
m, and
m model images (see Figs. 6-10 and Appendix).
We made an informed choice of the model
parameters (see Table 4) using the
fits of the Spitzer/IRS spectra from
González-Martín et al. (2019) for the GATOS
Seyferts in their sample.
Thus, the models are tailored to the
properties of the GATOS Seyferts analyzed in this work, which are
representative of X-ray selected AGN with median luminosities .
We distributed the dust
in a disk + wind geometry
over a region to account for
the relatively large torus sizes observed with ALMA in our sample. We
included compact and extended configurations for the disk and wind,
“thin” and “thick” geometries for the disk and cone walls, and a
range of wind-to-disk cloud ratios.
Our main results are the following:
-
•
In seven out of the twelve galaxies we detected extended mid-IR emission with sizes between 50 and 160 pc (Fig. 2). The other five galaxies only show faint extended or mostly unresolved mid-IR emission. At our current mid-IR angular resolutions, however, the unresolved emission contributes between 60% and 100% of the nuclear 1.5″150 pc emission in the majority of the sources.
-
•
There is a diversity of nuclear extended mid-IR morphologies. In six galaxies there is extended mid-IR emission approximately in the polar direction and perpendicular to the extended m component detected with ALMA. The latter continuum emission traces the equatorial component of the dusty molecular torus in the majority of the GATOS Seyferts (GB21). The only exception is NGC 6300 where the extended mid-IR is along the equatorial direction of the torus and dust in the host galaxy. In some galaxies there are other extended mid-IR components associated with emission in the host galaxy and/or star formation.
-
•
The majority of galaxies in our sample with extended mid-IR emission show intermediate-to-high nuclear column densities ((ALMA) 22.5-23.9 ) and moderate Eddington ratios ( to ) and have . According to the simulations of Venanzi et al. (2020), these conditions are favorable to launching dusty winds (Fig. 4), both in the polar and equatorial direction.
-
•
At our mid-IR 0.3″ resolutions, the fiducial CAT3D-WIND models show unresolved or only slightly resolved mid-IR emission in a significant number of model configurations (Figs. 11-15). Polar mid-IR emission is observed at intermediate inclinations, extended wind configurations, and intermediate-to-high wind-to-disk cloud ratios. To reproduce the observed mid-IR unresolved/extended fractions in our galaxies, low-to-moderate wind-to-disk ratios are needed (up to ).
-
•
At our ALMA 0.1″ resolution, the fiducial CAT3D-WIND model images show resolved far-IR morphologies, trace well the extent of the dust distribution, and reproduce the observed morphologies. In the models, the “X-”shape morphologies associated with a strong and extended wind component are seen at this resolution for high inclinations and are more apparent in the far-IR. While there is some ALMA observational evidence for these in our sample, higher angular resolution data are needed.
In conclusion, this work together with GB21 provide observational support for the disk/torus+wind scenario. Dusty nuclear winds with the accompanying polar dust emission and possibly with on-going clearing of the nuclear regions might be common in Seyferts with high Eddington ratios and/or AGN luminosities (see also Ricci et al., 2017a; González-Martín et al., 2019). At moderate Eddington ratios if the nuclear column densities are high, the IR radiation pressure uplift may be suppressed and only equatorial dusty outflows could occur (Venanzi et al., 2020). GB21 also showed that (radio-quiet) AGN with low Eddington ratios and/or luminosities might be dominated by the disk/torus component, and have higher covering factors (Ezhikode et al., 2017; Ricci et al., 2017a; González-Martín et al., 2019). These are predicted to show little or no polar dust emission, as confirmed by our observations.
In the near future, the Mid-Infrared Instrument (MIRI, Rieke et al., 2015; Wright et al., 2015) onboard the James Webb Space Telescope will provide observations at angular resolutions (FWHM at m) similar to those of the ground-based mid-IR imaging observations analyzed in this work. MIRI high sensitivity and spectral coverage, and especially the stability of the PSF will enable for the separation of the emitting components in the nuclear regions of AGN. The next generation of near and mid-IR instruments on 30-40 m-class ground-based telescopes (Packham et al., 2018; Brandl et al., 2021; Davies et al., 2021; Thatte et al., 2021) will allow observations of nearby Seyfert galaxies at angular resolutions in the tens of milli-arcsecond range that are comparable to the best resolutions currently achieved with ALMA. All these instruments will provide an unprecedented IR view of the dust emission and gas cycle in the immediate surroundings of nearby AGN. Finally, the comparison between models and observations will benefit from accurate estimates of the sublimation radii, dust composition, and the inclusion of the circum-nuclear environment.
Acknowledgements.
We thank D. Asmus, M. Villar-Martín, and M. Venanzi for interesting discussions. AA-H and SG-B acknowledge support through grant PGC2018-094671-B-I00 (MCIU/AEI/FEDER,UE). AA-H, AL, and MP-S work was done under project No. MDM-2017-0737 Unidad de Excelencia ”María de Maeztu”- Centro de Astrobiología (INTA-CSIC). SG-B thanks support from the research project PID2019-106027GA-C44 from the Spanish Ministerio de Ciencia e Innovación. SFH acknowledges support by the EU Horizon 2020 framework programme via the ERC Starting Grant DUST-IN-THE-WIND (ERC-2015-StG-677117). IGB acknowledges support from STFC through grant ST/S000488/1. CRA acknowledges financial support from the Spanish Ministry of Science, Innovation and Universities (MCIU) under grant with reference RYC-2014-15779, from the European Union’s Horizon 2020 research and innovation programme under Marie Skłodowska-Curie grant agreement No 860744 (BiD4BESt), from the State Research Agency (AEI-MCINN) of the Spanish MCIU under grants ”Feeding and feedback in active galaxies” with reference PID2019-106027GB-C42 and ”Quantifying the impact of quasar feedback on galaxy evolution (QSOFEED)” with reference EUR2020-112266. CRA also acknowledges support from the Consejería de Economía, Conocimiento y Empleo del Gobierno de Canarias and the European Regional Development Fund (ERDF) under grant with reference ProID2020010105 and from IAC project P/301404, financed by the Ministry of Science and Innovation, through the State Budget and by the Canary Islands Department of Economy, Knowledge and Employment, through the Regional Budget of the Autonomous Community. OG-M acknowledges support from UNAM PAPIIT IN105720. AJB has received funding from the European Research Council (ERC) under the European Union’s Horizon 2020 Advanced Grant 789056 “First Galaxies”. AA-H and AJB acknowledge support from a Royal Society International Exchange Grant. BG-L acknowledges support from the Spanish Agencia Estatal de Investigación del Ministerio de Ciencia e Innovación (AEI-MCINN) under grant with reference PID2019-107010GB-I00. TI is supported by Japan Society for the Promotion of Science (JSPS) KAKENHI grant No. JP20K14531. AL acknowledges the support from Comunidad de Madrid through the Atracción de Talento Investigador Grant 2017-T1/TIC-5213, and PID2019-106280GB-I00 (MCIU/AEI/FEDER,UE). MPS acknowledges support from the Comunidad de Madrid through the Atracción de Talento Investigador Grant 2018-T1/TIC-11035 and PID2019-105423GA-I00 (MCIU/AEI/FEDER,UE). DR acknowledges support from the Oxford Fell Fund and STFC through grant ST/S000488/1. DJR acknowledges support from the STFC (ST/T000244/1). MS is supported by the Ministry of Education, Science and Technological Development of the Republic of Serbia through the contract no. 451-03-9/2021-14/200002 and the Science Fund of the Republic of Serbia, PROMIS 6060916, BOWIE. Based on observations made with the Gran Telescopio Canarias (GTC), installed at the Spanish Observatorio del Roque de los Muchachos of the Instituto de Astrofísica de Canarias, in the island of La Palma. Based on observations collected at the European Organisation for Astronomical Research in the Southern Hemisphere. Based on observations obtained at the international Gemini Observatory, a program of NSF’s NOIRLab, which is managed by the Association of Universities for Research in Astronomy (AURA) under a cooperative agreement with the National Science Foundation. on behalf of the Gemini Observatory partnership: the National Science Foundation (United States), National Research Council (Canada), Agencia Nacional de Investigación y Desarrollo (Chile), Ministerio de Ciencia, Tecnología e Innovación (Argentina), Ministério da Ciência, Tecnologia, Inovações e Comunicações (Brazil), and Korea Astronomy and Space Science Institute (Republic of Korea). This paper makes use of the following ALMA data: ADS/JAO.ALMA#2017.1.00082.S and#2018.1.00113.S. ALMA is a partnership of ESO (representing its member states), NSF (USA) and NINS (Japan), together with NRC (Canada) and NSC and ASIAA (Taiwan), in cooperation with the Republic of Chile. The Joint ALMA Observatory is operated by ESO, AUI/NRAO and NAOJ. The National Radio Astronomy Observatory is a facility of the National Science Foundation operated under cooperative agreement by Associated Universities, Inc. This research has made use of the NASA/IPAC Extragalactic Database (NED), which is operated by the Jet Propulsion Laboratory, California Institute of Technology, under contract with the National Aeronautics and Space Administration. This research made use of Astropy,888http://www.astropy.org a community-developed core Python package for Astronomy (Astropy Collaboration et al., 2013, 2018). IRAF is distributed by the National Optical Astronomy Observatory, which is operated by the Association of Universities for Research in Astronomy (AURA) under a cooperative agreement with the National Science Foundation.References
- Alonso-Herrero et al. (2016) Alonso-Herrero, A., Esquej, P., Roche, P. F., et al. 2016, MNRAS, 455, 563
- Alonso-Herrero et al. (2019) Alonso-Herrero, A., García-Burillo, S., Pereira-Santaella, M., et al. 2019, A&A, 628, A65
- Alonso-Herrero et al. (2018) Alonso-Herrero, A., Pereira-Santaella, M., García-Burillo, S., et al. 2018, ApJ, 859, 144
- Alonso-Herrero et al. (2020) Alonso-Herrero, A., Pereira-Santaella, M., Rigopoulou, D., et al. 2020, A&A, 639, A43
- Alonso-Herrero et al. (2011) Alonso-Herrero, A., Ramos Almeida, C., Mason, R., et al. 2011, ApJ, 736, 82
- Alonso-Herrero et al. (2012) Alonso-Herrero, A., Sánchez-Portal, M., Ramos Almeida, C., et al. 2012, MNRAS, 425, 311
- Antonucci (1993) Antonucci, R. 1993, ARA&A, 31, 473
- Asmus (2019) Asmus, D. 2019, MNRAS, 489, 2177
- Asmus et al. (2016) Asmus, D., Hönig, S. F., & Gandhi, P. 2016, ApJ, 822, 109
- Asmus et al. (2014) Asmus, D., Hönig, S. F., Gandhi, P., Smette, A., & Duschl, W. J. 2014, MNRAS, 439, 1648
- Astropy Collaboration et al. (2018) Astropy Collaboration, Price-Whelan, A. M., SipHocz, B. M., et al. 2018, AJ, 156, 123
- Astropy Collaboration et al. (2013) Astropy Collaboration, Robitaille, T. P., Tollerud, E. J., et al. 2013, A&A, 558, A33
- Baumgartner et al. (2013) Baumgartner, W. H., Tueller, J., Markwardt, C. B., et al. 2013, ApJS, 207, 19
- Brandl et al. (2021) Brandl, B., Bettonvil, F., van Boekel, R., et al. 2021, The Messenger, 182, 22
- Burtscher et al. (2013) Burtscher, L., Meisenheimer, K., Tristram, K. R. W., et al. 2013, A&A, 558, A149
- Cameron et al. (1993) Cameron, M., Storey, J. W. V., Rotaciuc, V., et al. 1993, ApJ, 419, 136
- Combes et al. (2019) Combes, F., García-Burillo, S., Audibert, A., et al. 2019, A&A, 623, A79
- Davies et al. (2021) Davies, R., Hörmann, V., Rabien, S., et al. 2021, The Messenger, 182, 17
- Davies et al. (2014) Davies, R. I., Maciejewski, W., Hicks, E. K. S., et al. 2014, ApJ, 792, 101
- Domínguez-Fernández et al. (2020) Domínguez-Fernández, A. J., Alonso-Herrero, A., García-Burillo, S., et al. 2020, A&A, 643, A127
- Efstathiou et al. (1995) Efstathiou, A., Hough, J. H., & Young, S. 1995, MNRAS, 277, 1134
- Efstathiou & Rowan-Robinson (1995) Efstathiou, A. & Rowan-Robinson, M. 1995, MNRAS, 273, 649
- Elitzur & Shlosman (2006) Elitzur, M. & Shlosman, I. 2006, ApJ, 648, L101
- Erroz-Ferrer et al. (2019) Erroz-Ferrer, S., Carollo, C. M., den Brok, M., et al. 2019, MNRAS, 484, 5009
- Ezhikode et al. (2017) Ezhikode, S. H., Gandhi, P., Done, C., et al. 2017, MNRAS, 472, 3492
- Fabian et al. (2008) Fabian, A. C., Vasudevan, R. V., & Gandhi, P. 2008, MNRAS, 385, L43
- Ferruit et al. (2000) Ferruit, P., Wilson, A. S., & Mulchaey, J. 2000, ApJS, 128, 139
- Fischer et al. (2013) Fischer, T. C., Crenshaw, D. M., Kraemer, S. B., & Schmitt, H. R. 2013, ApJS, 209, 1
- Fritz et al. (2006) Fritz, J., Franceschini, A., & Hatziminaoglou, E. 2006, MNRAS, 366, 767
- Fuller et al. (2019) Fuller, L., Lopez-Rodriguez, E., Packham, C., et al. 2019, MNRAS, 483, 3404
- Gallagher et al. (2015) Gallagher, S. C., Everett, J. E., Abado, M. M., & Keating, S. K. 2015, MNRAS, 451, 2991
- Gallimore et al. (2016) Gallimore, J. F., Elitzur, M., Maiolino, R., et al. 2016, ApJ, 829, L7
- García-Bernete et al. (2021) García-Bernete, I., Alonso-Herrero, A., García-Burillo, S., et al. 2021, A&A, 645, A21
- García-Bernete et al. (2016) García-Bernete, I., Ramos Almeida, C., Acosta-Pulido, J. A., et al. 2016, MNRAS, 463, 3531
- García-Bernete et al. (2019) García-Bernete, I., Ramos Almeida, C., Alonso-Herrero, A., et al. 2019, MNRAS, 486, 4917
- Garcia-Burillo et al. (2021) Garcia-Burillo, S., Alonso-Herrero, A., Ramos Almeida, C., et al. 2021, arXiv e-prints, arXiv:2104.10227
- García-Burillo et al. (2019) García-Burillo, S., Combes, F., Ramos Almeida, C., et al. 2019, A&A, 632, A61
- García-Burillo et al. (2016) García-Burillo, S., Combes, F., Ramos Almeida, C., et al. 2016, ApJ, 823, L12
- García-González et al. (2017) García-González, J., Alonso-Herrero, A., Hönig, S. F., et al. 2017, MNRAS, 470, 2578
- González-Martín et al. (2019) González-Martín, O., Masegosa, J., García-Bernete, I., et al. 2019, ApJ, 884, 11
- Granato & Danese (1994) Granato, G. L. & Danese, L. 1994, MNRAS, 268, 235
- Gratadour et al. (2015) Gratadour, D., Rouan, D., Grosset, L., Boccaletti, A., & Clénet, Y. 2015, A&A, 581, L8
- Gravity Collaboration et al. (2020a) Gravity Collaboration, Dexter, J., Shangguan, J., et al. 2020a, A&A, 635, A92
- Gravity Collaboration et al. (2020b) Gravity Collaboration, Pfuhl, O., Davies, R., et al. 2020b, A&A, 634, A1
- Hönig (2019) Hönig, S. F. 2019, ApJ, 884, 171
- Hönig & Kishimoto (2010) Hönig, S. F. & Kishimoto, M. 2010, A&A, 523, A27
- Hönig & Kishimoto (2017) Hönig, S. F. & Kishimoto, M. 2017, ApJ, 838, L20
- Hönig et al. (2010) Hönig, S. F., Kishimoto, M., Gandhi, P., et al. 2010, A&A, 515, A23
- Hönig et al. (2013) Hönig, S. F., Kishimoto, M., Tristram, K. R. W., et al. 2013, ApJ, 771, 87
- Ichikawa et al. (2015) Ichikawa, K., Packham, C., Ramos Almeida, C., et al. 2015, ApJ, 803, 57
- Imanishi et al. (2020) Imanishi, M., Nguyen, D. D., Wada, K., et al. 2020, ApJ, 902, 99
- Impellizzeri et al. (2019) Impellizzeri, C. M. V., Gallimore, J. F., Baum, S. A., et al. 2019, ApJ, 884, L28
- Isbell et al. (2021) Isbell, J. W., Burtscher, L., Asmus, D., et al. 2021, ApJ, 910, 104
- Izumi et al. (2018) Izumi, T., Wada, K., Fukushige, R., Hamamura, S., & Kohno, K. 2018, ApJ, 867, 48
- Jacquet & Krumholz (2011) Jacquet, E. & Krumholz, M. R. 2011, ApJ, 730, 116
- Jensen et al. (2017) Jensen, J. J., Hönig, S. F., Rakshit, S., et al. 2017, MNRAS, 470, 3071
- Käufl et al. (2015) Käufl, H. U., Kerber, F., Asmus, D., et al. 2015, The Messenger, 159, 15
- Kerber et al. (2016) Kerber, F., Käufl, H. U., Tristram, K., et al. 2016, in Society of Photo-Optical Instrumentation Engineers (SPIE) Conference Series, Vol. 9908, Ground-based and Airborne Instrumentation for Astronomy VI, ed. C. J. Evans, L. Simard, & H. Takami, 99080D
- Kishimoto et al. (2007) Kishimoto, M., Hönig, S. F., Beckert, T., & Weigelt, G. 2007, A&A, 476, 713
- Koss et al. (2017) Koss, M., Trakhtenbrot, B., Ricci, C., et al. 2017, ApJ, 850, 74
- Krolik (2007) Krolik, J. H. 2007, ApJ, 661, 52
- Lagage et al. (2004) Lagage, P. O., Pel, J. W., Authier, M., et al. 2004, The Messenger, 117, 12
- Leftley et al. (2019) Leftley, J. H., Hönig, S. F., Asmus, D., et al. 2019, ApJ, 886, 55
- López-Gonzaga et al. (2016) López-Gonzaga, N., Burtscher, L., Tristram, K. R. W., Meisenheimer, K., & Schartmann, M. 2016, A&A, 591, A47
- López-Gonzaga et al. (2014) López-Gonzaga, N., Jaffe, W., Burtscher, L., Tristram, K. R. W., & Meisenheimer, K. 2014, A&A, 565, A71
- Lopez-Rodriguez et al. (2020) Lopez-Rodriguez, E., Alonso-Herrero, A., García-Burillo, S., et al. 2020, ApJ, 893, 33
- Lopez-Rodriguez et al. (2018) Lopez-Rodriguez, E., Fuller, L., Alonso-Herrero, A., et al. 2018, ApJ, 859, 99
- Lyu & Rieke (2021) Lyu, J. & Rieke, G. H. 2021, ApJ, 912, 126
- Maiolino & Rieke (1995) Maiolino, R. & Rieke, G. H. 1995, ApJ, 454, 95
- Martínez-Paredes et al. (2020) Martínez-Paredes, M., González-Martín, O., Esparza-Arredondo, D., et al. 2020, ApJ, 890, 152
- Martini et al. (2003) Martini, P., Regan, M. W., Mulchaey, J. S., & Pogge, R. W. 2003, ApJS, 146, 353
- Mason et al. (2012) Mason, R. E., Lopez-Rodriguez, E., Packham, C., et al. 2012, AJ, 144, 11
- Müller-Sánchez et al. (2011) Müller-Sánchez, F., Prieto, M. A., Hicks, E. K. S., et al. 2011, ApJ, 739, 69
- Nenkova et al. (2008a) Nenkova, M., Sirocky, M. M., Ivezić, Ž., & Elitzur, M. 2008a, ApJ, 685, 147
- Nenkova et al. (2008b) Nenkova, M., Sirocky, M. M., Nikutta, R., Ivezić, Ž., & Elitzur, M. 2008b, ApJ, 685, 160
- Netzer (2015) Netzer, H. 2015, ARA&A, 53, 365
- Nikutta et al. (2021) Nikutta, R., Lopez-Rodriguez, E., Ichickawa, K., et al. 2021, submitted
- Ogawa et al. (2021) Ogawa, S., Ueda, Y., Tanimoto, A., & Yamada, S. 2021, ApJ, 906, 84
- Packham et al. (2018) Packham, C., Honda, M., Chun, M., et al. 2018, in Society of Photo-Optical Instrumentation Engineers (SPIE) Conference Series, Vol. 10702, Ground-based and Airborne Instrumentation for Astronomy VII, ed. C. J. Evans, L. Simard, & H. Takami, 10702A0
- Packham et al. (2005a) Packham, C., Radomski, J. T., Roche, P. F., et al. 2005a, ApJ, 618, L17
- Packham et al. (2005b) Packham, C., Telesco, C. M., Hough, J. H., & Ftaclas, C. 2005b, in Revista Mexicana de Astronomia y Astrofisica Conference Series, Vol. 24, Revista Mexicana de Astronomia y Astrofisica Conference Series, ed. A. M. Hidalgo-Gámez, J. J. González, J. M. Rodríguez Espinosa, & S. Torres-Peimbert, 7–12
- Pasetto et al. (2019) Pasetto, A., González-Martín, O., Esparza-Arredondo, D., et al. 2019, ApJ, 872, 69
- Pérez-Torres et al. (2021) Pérez-Torres, M., Mattila, S., Alonso-Herrero, A., Aalto, S., & Efstathiou, A. 2021, A&A Rev., 29, 2
- Phillips (1979) Phillips, M. M. 1979, ApJ, 227, L121
- Pier & Krolik (1992a) Pier, E. A. & Krolik, J. H. 1992a, ApJ, 401, 99
- Pier & Krolik (1992b) Pier, E. A. & Krolik, J. H. 1992b, ApJ, 399, L23
- Pier & Krolik (1993) Pier, E. A. & Krolik, J. H. 1993, ApJ, 418, 673
- Radomski et al. (2003) Radomski, J. T., Piña, R. K., Packham, C., et al. 2003, ApJ, 587, 117
- Ramos Almeida et al. (2011) Ramos Almeida, C., Levenson, N. A., Alonso-Herrero, A., et al. 2011, ApJ, 731, 92
- Ramos Almeida et al. (2009) Ramos Almeida, C., Levenson, N. A., Rodríguez Espinosa, J. M., et al. 2009, ApJ, 702, 1127
- Ramos Almeida & Ricci (2017) Ramos Almeida, C. & Ricci, C. 2017, Nature Astronomy, 1, 679
- Ricci et al. (2017a) Ricci, C., Trakhtenbrot, B., Koss, M. J., et al. 2017a, ApJS, 233, 17
- Ricci et al. (2017b) Ricci, C., Trakhtenbrot, B., Koss, M. J., et al. 2017b, Nature, 549, 488
- Rieke et al. (2015) Rieke, G. H., Wright, G. S., Böker, T., et al. 2015, PASP, 127, 584
- Ruschel-Dutra et al. (2014) Ruschel-Dutra, D., Pastoriza, M., Riffel, R., Sales, D. A., & Winge, C. 2014, MNRAS, 438, 3434
- Schartmann et al. (2008) Schartmann, M., Meisenheimer, K., Camenzind, M., et al. 2008, A&A, 482, 67
- Schartmann et al. (2014) Schartmann, M., Wada, K., Prieto, M. A., Burkert, A., & Tristram, K. R. W. 2014, MNRAS, 445, 3878
- Schmitt et al. (2003) Schmitt, H. R., Donley, J. L., Antonucci, R. R. J., Hutchings, J. B., & Kinney, A. L. 2003, ApJS, 148, 327
- Siebenmorgen et al. (2015) Siebenmorgen, R., Heymann, F., & Efstathiou, A. 2015, A&A, 583, A120
- Stalevski et al. (2017) Stalevski, M., Asmus, D., & Tristram, K. R. W. 2017, MNRAS, 472, 3854
- Stalevski et al. (2012) Stalevski, M., Fritz, J., Baes, M., Nakos, T., & Popović, L. Č. 2012, MNRAS, 420, 2756
- Suganuma et al. (2006) Suganuma, M., Yoshii, Y., Kobayashi, Y., et al. 2006, ApJ, 639, 46
- Tanimoto et al. (2019) Tanimoto, A., Ueda, Y., Odaka, H., et al. 2019, ApJ, 877, 95
- Tanimoto et al. (2020) Tanimoto, A., Ueda, Y., Odaka, H., et al. 2020, ApJ, 897, 2
- Tazaki & Ichikawa (2020) Tazaki, R. & Ichikawa, K. 2020, ApJ, 892, 149
- Telesco et al. (2003) Telesco, C. M., Ciardi, D., French, J., et al. 2003, in Society of Photo-Optical Instrumentation Engineers (SPIE) Conference Series, Vol. 4841, Instrument Design and Performance for Optical/Infrared Ground-based Telescopes, ed. M. Iye & A. F. M. Moorwood, 913–922
- Telesco et al. (1998) Telesco, C. M., Pina, R. K., Hanna, K. T., et al. 1998, in Society of Photo-Optical Instrumentation Engineers (SPIE) Conference Series, Vol. 3354, Infrared Astronomical Instrumentation, ed. A. M. Fowler, 534–544
- Thatte et al. (2021) Thatte, N., Tecza, M., Schnetler, H., et al. 2021, The Messenger, 182, 7
- Thomas et al. (2017) Thomas, A. D., Dopita, M. A., Shastri, P., et al. 2017, ApJS, 232, 11
- Tomono et al. (2001) Tomono, D., Doi, Y., Usuda, T., & Nishimura, T. 2001, ApJ, 557, 637
- Tristram et al. (2014) Tristram, K. R. W., Burtscher, L., Jaffe, W., et al. 2014, A&A, 563, A82
- Urry & Padovani (1995) Urry, C. M. & Padovani, P. 1995, PASP, 107, 803
- Vasudevan et al. (2010) Vasudevan, R. V., Fabian, A. C., Gandhi, P., Winter, L. M., & Mushotzky, R. F. 2010, MNRAS, 402, 1081
- Venanzi et al. (2020) Venanzi, M., Hönig, S., & Williamson, D. 2020, ApJ, 900, 174
- Venturi et al. (2018) Venturi, G., Nardini, E., Marconi, A., et al. 2018, A&A, 619, A74
- Véron-Cetty & Véron (2006) Véron-Cetty, M. P. & Véron, P. 2006, A&A, 455, 773
- Wada et al. (2016) Wada, K., Schartmann, M., & Meijerink, R. 2016, ApJ, 828, L19
- Wada et al. (2018) Wada, K., Yonekura, K., & Nagao, T. 2018, ApJ, 867, 49
- Walton et al. (2010) Walton, D. J., Reis, R. C., & Fabian, A. C. 2010, MNRAS, 408, 601
- Williamson et al. (2019) Williamson, D., Hönig, S., & Venanzi, M. 2019, ApJ, 876, 137
- Williamson et al. (2020) Williamson, D., Hönig, S., & Venanzi, M. 2020, ApJ, 897, 26
- Wold & Galliano (2006) Wold, M. & Galliano, E. 2006, MNRAS, 369, L47
- Wright et al. (2015) Wright, G. S., Wright, D., Goodson, G. B., et al. 2015, PASP, 127, 595
- Zhang et al. (2018) Zhang, D., Davis, S. W., Jiang, Y.-F., & Stone, J. M. 2018, ApJ, 854, 110
Appendix A Additional CAT3D-WIND model images
We show in this appendix additional CAT3D-WIND mid- and far-IR model images for the compact disk - compact wind and extended disk - extended wind configurations for the “thin” and “thick” geometries and in Figs. 20-23, respectively. We also show for the “thin” geometry and the four disk and wind configurations the mid- and far-IR model images for a wind-to-disk ratio of in Figs. 24-27. All these images were discussed briefly in Sects. 5.3 and 5.4.