First observation of MeV gamma-ray universe with bijective imaging spectroscopy
using the Electron-Tracking Compton Telescope aboard SMILE-2+
Abstract
MeV gamma-rays provide a unique window for the direct measurement of line emissions from radioisotopes, but observations have made little significant progress after COMPTEL/CGRO. To observe celestial objects in this band, we are developing an electron-tracking Compton camera (ETCC), which realizes both bijective imaging spectroscopy and efficient background reduction gleaned from the recoil electron track information. The energy spectrum of the observation target can then be obtained by a simple ON-OFF method using a correctly defined point spread function on the celestial sphere. The performance of celestial object observations was validated on the second balloon SMILE-2+ installed with an ETCC having a gaseous electron tracker with a volume of 303030 cm3. Gamma-rays from the Crab nebula were detected with a significance of 4.0 in the energy range 0.15–2.1 MeV with a live time of 5.1 h, as expected before launching. Additionally, the light curve clarified an enhancement of gamma-ray events generated in the Galactic center region, indicating that a significant proportion of the final remaining events are cosmic gamma rays. Independently, the observed intensity and time variation were consistent with the pre-launch estimates except in the Galactic center region. The estimates were based on the total background of extragalactic diffuse, atmospheric, and instrumental gamma-rays after accounting for the variations in the atmospheric depth and rigidity during the level flight. The Crab results and light curve strongly support our understanding of both the detection sensitivity and the background in real observations. This work promises significant advances in MeV gamma-ray astronomy.
1 Introduction
Various radiation process in the universe can be observed in the low-energy gamma-ray band (0.1–100 MeV). Examples are line emissions from the radioisotopes produced by nucleosynthesis in supernovae or neutron star mergers (Matz et al.,, 1988; von Ballmoos,, 1995), the electron–positron annihilation line in the Galactic center region (GCR) (Prantzos et al.,, 2011), synchrotron emissions and inverse Compton scattering with particle acceleration in active galactic nuclei or gamma-ray bursts (GRBs) (Urry & Padovani,, 1995; Briggs et al.,, 1999), pion-decay radiation in the strong gravity fields around black holes (McConnell et al.,, 1996; Mahadevan et al.,, 1997), and de-excitation lines from nuclei excited by interactions between cosmic-rays and the interstellar medium (Boggs et al.,, 2000; Strong et al.,, 2000). Population III stars are expected to be detected as long duration GRBs (Mészáros & Rees,, 2010; Toma et al.,, 2011), because the universe is very transparent in this energy band. Thermal emissions in the extragalactic diffuse emission might confirm the existance of primordial black holes (PBHs) with masses of g, which emit thermal emission in the MeV band (Carr et al.,, 2010).
Although celestial MeV gamma-rays have been observed scince the dawn of high-energy astrophysics, when GRBs were discovered by Vela and extragalactic diffuse emission was detected by Apollo 15 (Trombka et al.,, 1973), observations in this band stagnate. COMPTEL aboard CGRO (Schönfelder et al.,, 1993) discovered only 30 steady gamma-ray sources in the 0.75–30 MeV band (Schönfelder et al.,, 2000), and SPI loaded on INTEGRAL discovered only four steady celestial objects at energies above 0.6 MeV (Bouchet et al.,, 2008). The expected signatures of supernova explosions are line gamma-rays emitted from fresh isotopes, but line gamma-rays of 56Ni/56Co have been detected only from SN1987A (Matz et al.,, 1988) and SN2014J (Diehl et al.,, 2015; Chrazov et al.,, 2015). Various gamma-ray telescopes are being developed and some balloon experiments have been performed, but none of the present developments have surpassed the sensitivity of COMPTEL (Aprile et al.,, 2008; Bandstra et al.,, 2011; Kamiya,, 2011). The NCT (predecessor of COSI) produced some observational results using a wide-view Ge Compton Camera loaded on a few balloon experiments. In 2009, COSI detected Crab at the 4 (Bandstra et al.,, 2011) significance level. In 2016, they detected the annihilation line from GCR at the 7 significance level (Kierans et al.,, 2020; Siegert et al.,, 2020).
MeV observations have been bottlenecked by the huge background and difficulty of imaging. Unlike visible light or X-rays, MeV gamma-ray wavelengths are is too short to focus by a mirror or lens. Obtaining their total energy is also difficult because whereas most incident photons deposit only part of their energy via Compton scattering, Compton scattering domainates the interactions between MeV gamma-rays and materials. In addition, observations are obstructed by huge amounts of background photons produced by hadronic interactions between cosmic rays and the material surrounding the detector (Weidenspointner et al.,, 2001). The SPI spectrometer and other detectors based on coded aperture imaging infer the intensity map of incident gamma-rays from the pattern of the shadow image. Such detectors need many photons to obtain the directions of celestial objects. Coded aperture imaging telescopes are usually equipped with an active veto counter, but heavy anti-coincidence counters scarcely improve the signal to noise ratio because the gamma rays produced by cosmic-rays are delayed(Diehl et al.,, 2018). Conventional Compton cameras such as COMPTEL can slightly suppress the contaminating background photons by partially restricting the incident direction of each photon. However, this type of camera measures only one of two angles representing the direction of incident gamma-rays due to the lack of recoil direction. The signal-to-noise ratio depends on the volume of the cone-shape response in the Compton data space (Schönfelder et al.,, 1993), in which the information of recoil directions degenerates. Therefore, the observations are obstructed by large contamination of gamma-rays within the area spanned by a radius defined by the average of the detectable scattering-angle. The detection sensitivity of a non-bijection telescope based on coded aperture imaging or conventional Compton imaging is inherently restricted by the principle confusion limit caused by the overlapped responses of the surrounding sources. In fact, Schönfelder, (2004) argued that above all abilities, next-generation MeV gamma-ray telescopes must distinguish and reject the background based on sharp point spread function (PSF) on the celestial sphere and additional event-selection parameters. In early 2000, the MEGA group measured the tracks of recoil electrons with enegies higher than 2 MeV using a Si-tracker and CsI calorimeters. They reported worse angular resolution measures (ARMs) of tracked events than untracked events because detecting a few sampling points of the electron track requires a high recoil energy(Zoglauer et al.,, 2003). Thus, a tracking detector must finely track electrons, even those with very low energies (10 keV) to obtain a sufficient PSF for MeV gamma-ray astronomy.
As the next MeV gamma-ray telescope for deep sky surveying, we are developing an electron-tracking Compton camera (ETCC), which applies a gaseous electron tracker as the Compton-scattering target and pixel scintillator arrays as the absorbers (Tanimori et al.,, 2004). The ETCC and conventional Compton camera differ in their tracking of Compton-recoil electrons. The ETCC obtaines the momentum of an incident gamma-ray by simply summing the momenta of the scattered gamma-ray and the recoil electron event-by-event. In this way, it completely reconstructs the Compton scattering process. Thus, (like other wavelength telescopes) an ETCC is a bijection telescope, which obtains the incident direction as the zenith and azimuthal angles and forms a proper PSF on the celestial sphere. As the proper PSF defines the minimum size that conserves the intensity of gamma rays, the spectroscopic information at many points beyond the PSF can be independently obtained from one image. Therefore, the ETCC can realize imaging spectroscopy in MeV gamma-ray astronomy. The proper PSF on the celestial sphere enables the determination of the energy spectrum of the observation target by a simple ON-OFF method (Tanimori et al.,, 2017). Moreover, from the recoil-electron track, the background can be rejected using two powerful tools (Tanimori et al.,, 2015): particle identification based on the energy deposition rate in the gaseous electron tracker, and a Compton-scattering kinematic test based on the angle between the directions of scattered gamma-ray and recoil electron. These background rejection tools enables ETCC observations without a heavy veto counter; consequently, the ETCC has a large field of view (FoV). These unique abilities of ETCC provide a real imaging spectroscopy to MeV gamma-ray observations. In future observations with ETCCs loaded on a satellite (Hamaguchi et al.,, 2019), we are planning balloon experiments, named Sub-MeV/MeV gamma-ray Imaging Loaded-on-balloon Experiments (SMILE). As the first step, we launched a small ETCC having an electron tracker with a sensitive volume of 101015 cm3 in 2006. This launch was intended as a background study at high altitudes (SMILE-I) and confirmation of the background rejection power of the ETCC (Takada et al.,, 2011). SMILE-I successfully detected diffuse cosmic and atmospheric gamma-rays and performed powerful background rejection based on particle identification. As the second step, SMILE was tested on imaging-spectroscopy observations of bright celestial objects. To this end, we set the Crab nebula and GCR as the observation targets, and constructed a middle-size ETCC a sensitive volume of 303030 cm3. Assuming a background of extragalactic diffuse and atmospheric gamma rays, the Crab nebula should be detected at the 3–5 significance level. The second balloon SMILE-2+ was launched at Alice Springs, Australia, on April 7 of 2018.
Herein, we assess the gamma-ray detection abilities of the ETCC from ground calibrations, details of the SMILE-2+ flight, and the observation results of the Crab nebula. We additionally discuss the detection sensitivities of next ETCC observations by comparing the realized detection sensitivity with that estimated from ground calibrations.
2 Instruments
2.1 SMILE-2+ ETCC and control system
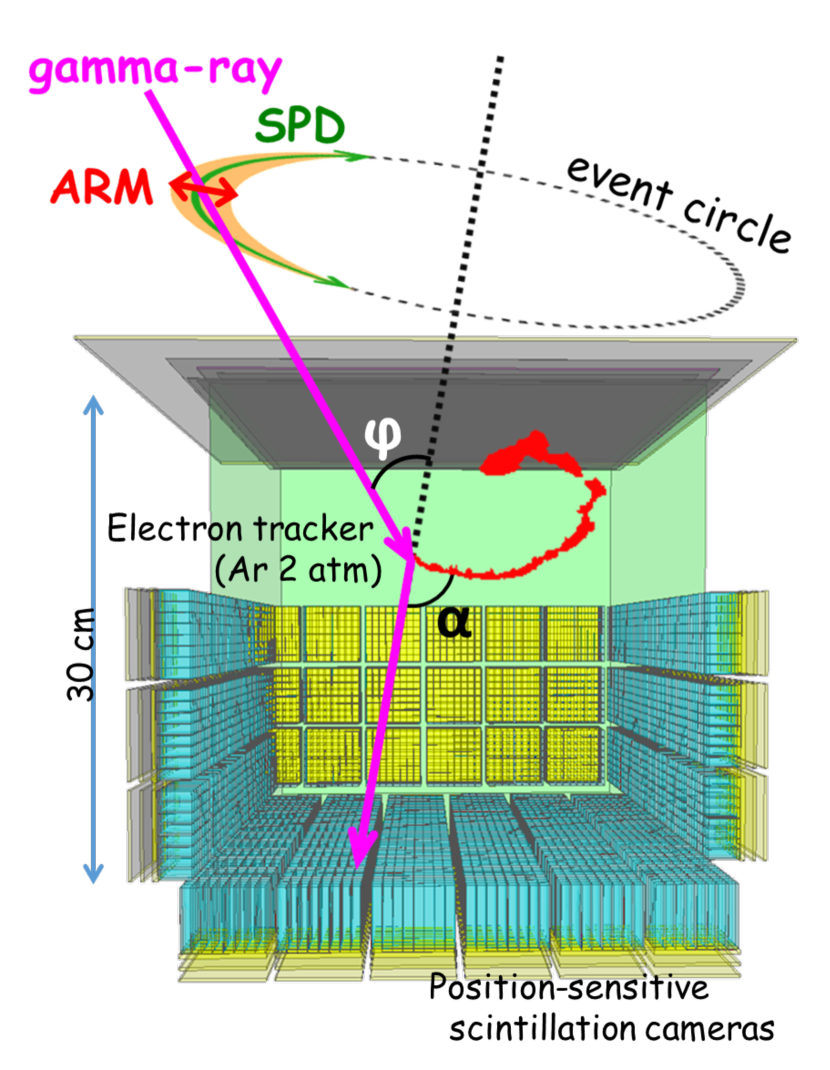
At middle latitudes in the southern hemisphere, the large zenith angle (45 degrees) reduces the flux of the Crab nebula by one half from that at low zenith angles; consequently, the air mass is twice that at the zenith. Thus, Crab nebula is difficult to detect even after several hours of balloon observations. To detect the Crab nebula at the 3–5 significance level within during a few hours in the 0.2–2 MeV energy band at 40 km altitude in the southern hemisphere, the ETCC requires a minimum effective area of 1 cm2 (0.3 MeV). The required PSF is 30 degrees for 0.6 MeV detection at the half power radius (HPR), and the instrumental background must be suppressed to below the background of the diffuse cosmic and atmospheric gamma-rays. Figure 1 is a schematic of SMILE-2+ ETCC.
The material of a Compton-scattering target should have a high electron density to increase the Compton scattering probability and a low atomic-number to suppress the photoabsorption. For this purpose, the electron tracker of SMILE-2+ ETCC with a sensitive volume of cm3 is filled with an argon-based gas (Ar : CF4 : iso C4H10; in pressure ratio = 95 : 3 : 2) at a pressure of 2 atm. The approximate drift velocity of the electrons in this gas is 3.7 cm s-1. As the ETCC needs three-dimensional (3D) precise electron tracks for the gamma-ray reconstruction, we adopted a time projection chamber (TPC) with a micro pixel chamber (-PIC) (Ochi et al.,, 2001; Takada et al.,, 2005) and a gas electron multiplier (Sauli,, 1997; Tamagawa et al.,, 2006) insulated by 100 m liquid crystal polymer. To reduce the power consumption, we combined two adjacent readout-strips of -PIC into one preamplifier. The readout pitch of the tracker is 800 m and the energy resolution of the tracker through the whole volume is 45.9% for 0.043 MeV (GdK) at full-width half maximum (FWHM).
As the gamma-ray absorber, we selected GSO (Gd2SiO5:Ce) pixel scintillator arrays (PSAs) each containing pixels. The pixel size is mm2. The GSO scintillator is 26 and 13 mm thick at the bottom and sides of the electron tracker, respectively. To efficiently absorb the scattered gamma-rays, we placed 36 PSAs at the bottom and 18 PSAs at each side of the tracker. The total number of scintillation pixels was 6912. For the photo readout, we adopted the 4-channel (ch) charge division method with a resistor network (Sekiya et al.,, 2006) and multi-anode photomultiplier tubes (Hamamatsu Photonics, flat-panel H8500). The energy resolutions of the bottom and side PSAs for 0.662 MeV are 13.4% and 10.9%, respectively, at FWHM. The PSAs are placed in the TPC vessel, whereas the scintillators of the previous ETCC (SMILE-I) were placed outside of the vessel. The total number of readouts of TPC and PSAs are 768 ch for TPC and 432 ch, respectively. SMILE-2+ employs the same data acquisition system as the middle-size ETCC prototype (Mizumoto et al.,, 2015), but with the VMe bus replaced by a gigabit Ethernet link for fast data transference. The top of the TPC vessel is installed with a 5 mm thick plastic scintillator to reduce the number of triggers by charged particles.
The SMILE-2+ ETCC is set above the control system, as shown in Fig. 2.
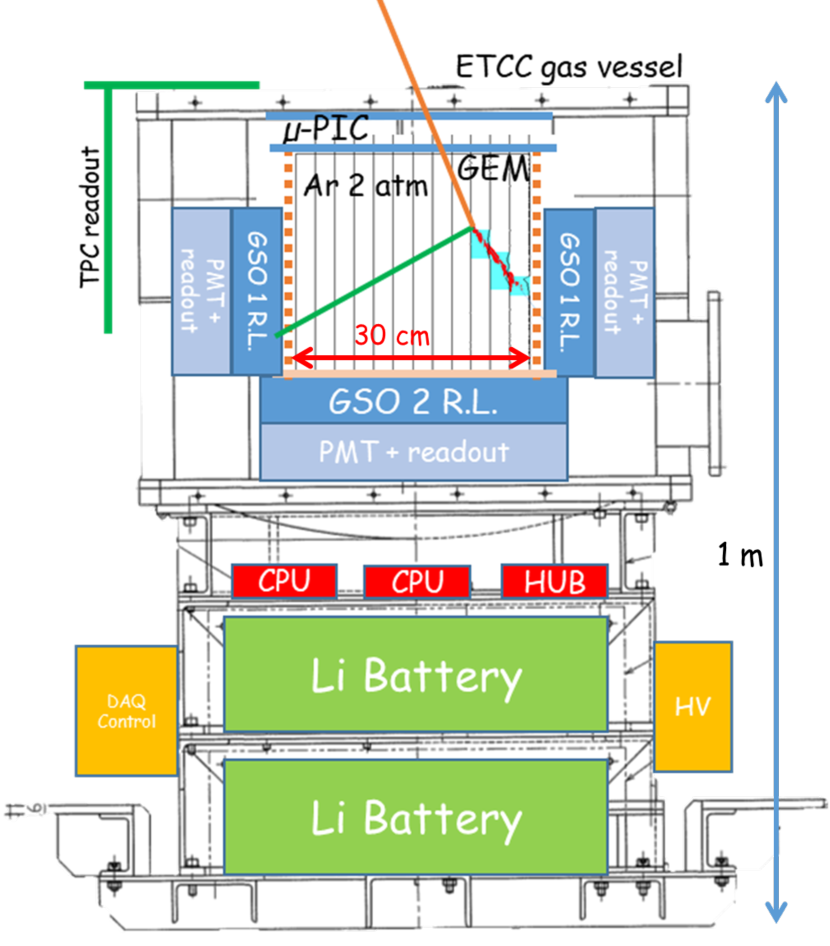
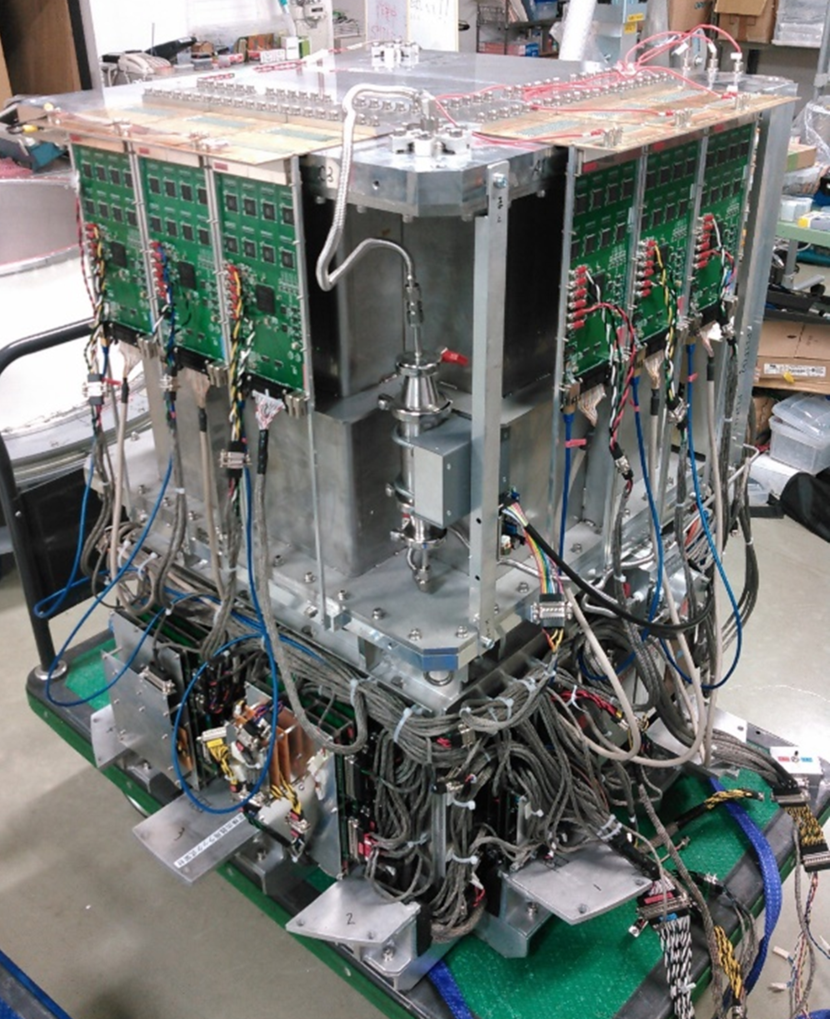
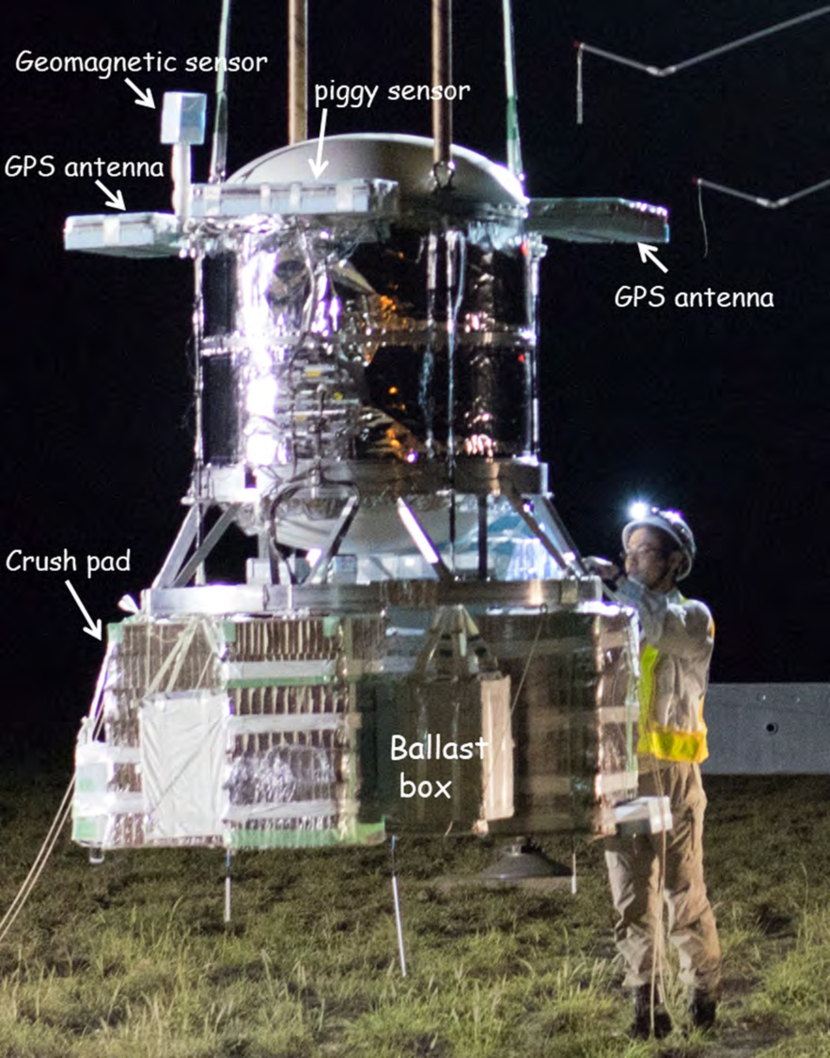
The control system includes a central processing unit (CPU) for communication with the balloon control system, two CPUs with 1 TB solid-state drives for data acquisition, a trigger control unit described in Mizumoto et al., (2015), four high-voltage units for the TPC, a power management system with DC/DC converters, and lithium batteries. SMILE-2+ also has a receiver with a global positioning system, an atmospheric pressure gauge, two clinometers, and three geomagnetic aspectmeters (GAs) for measuring the gondola attitude. However, it lacks a feedback system for attitude control. The accuracy of posture measurements is less than 5 degrees. The total power consumption is approximately 250 W. Power is provided by the lithium batteries. The SMILE-2+ system is sealed in a pressured vessel maintained at 1 atm. The side of the outer vessel is covered by multilayered insulators for temperature maintenance, and the outer vessel is placed on the small aluminum gondola, as shown in Fig. 3. The outer vessel is installed with an independent piggyback sensor (Shoji,, 2019) that measures the attitude with three GAs, three accelerometers, and a gyroscope. The gondola attitudes determinanted by the SMILE-2+ sensors and the piggyback sensor were checked for consistency. Without ballast, the SMILE-2+ gondola weights 511 kg in total.
2.2 ground calibration
The gaseous electron tracker on the ETCC obtains the 3D tracks and energies of the Compton-recoil electrons, whereas the absorber detects the absorption points and energies of the Compton-scattered gamma-rays. The momentum of the incident gamma-rays is then obtained by summing the momenta of the recoil electrons and the scattered gamma-rays:
| (1) |
where , , and are the four-dimensional momenta of the incident gamma-ray, scattered gamma-ray, and recoil electron, respectively. Using the measured values, the unit vector of the incident gamma-ray is described by
| (2) |
where and are unit vectors in the directions of the scattered gamma-ray and the recoil electron, respectively, in the laboratory system. is the angle between the scattering and recoil directions (see Fig. 1), and is the scattering angle given by
| (3) |
In Eq. (3), , , , and denote the energy of the scattered gamma-rays, kinetic energy of the Compton-recoil electrons, the electron mass, and light speed, respectively.
The gamma-ray candidate events are reconstructed under the following criteria;
-
1.
Single pixel scintillator hits: When a Compton-scattered gamma-ray hits more than one pixel in the absorber, the incident gamma-ray is difficult to reconstruct because the sequence of interactions in the absorber become confused. Therefore we select only the events with a single pixel scintillator hit.
-
2.
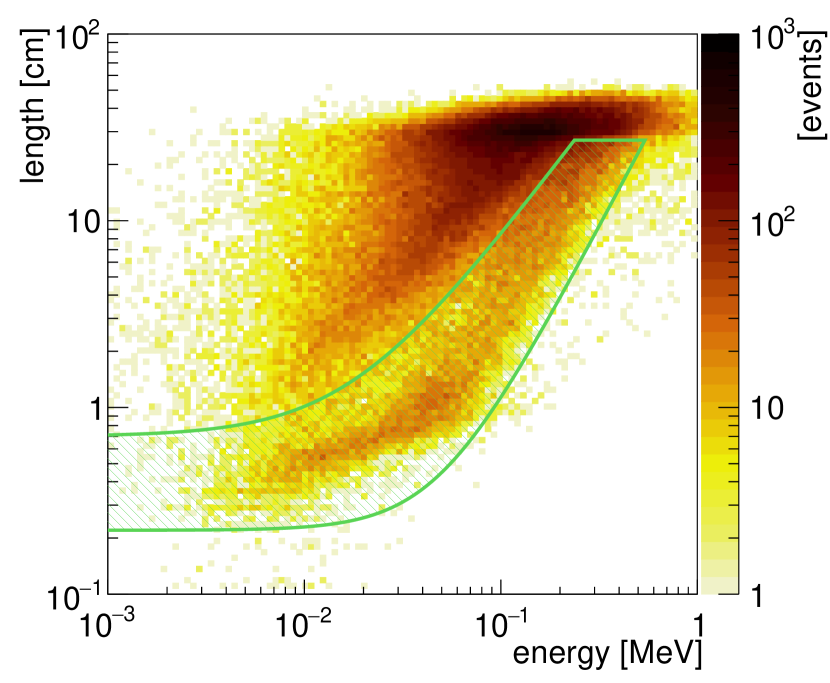
Fully-contained electrons: The gamma-ray reconstruction requires the kinetic energy of a recoil electron. If a recoil electron escapes the sensitive volume of the TPC, the incident gamma-ray cannot be reconstructed because the recoil energy measurement is incomplete. We thus set the TPC fiducial volume at 292929 cm3 and require that the track length matches the expected distance range of electrons depositing their energy in Ar gas (Tanimori et al.,, 2015). Figure 4 plots the track length of the charged particles detected in level flight versus the energy deposited in the TPC. The gradient in this figure represents the energy loss . The events in the hatched area of this figure give rise to fully-contained electrons. The head-tail of the recoil electrons is determined from the skewness of the track image (Dujmic et al.,, 2008) and the recoil direction determined from the time-over-threshold information (Tanimori et al.,, 2015). The angular resolution of the recoil direction and the position resolution of the scattering points are determined by a traditional method (see Ikeda et al., (2021)).
-
3.
Compton scattering kinematics: is defined as
(4) and can be calculated by Compton-scattering kinematics as follows:
(5) Therefore, we can select only Compton scattering events with the condition described by
(6) where is a cut parameter. For SMILE-2+ ETCC, we set .
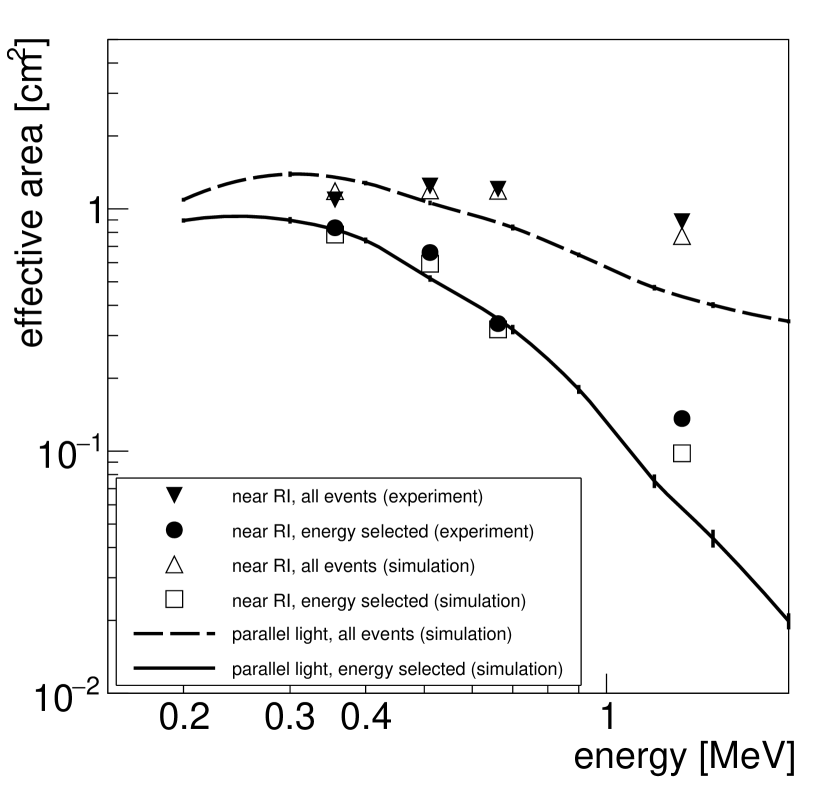
The response function of parallel light, which is required for deconvoluting the gamma-ray fluxes from celestial objects, was obtained in a simulator of SMILE-2+ ETCC based on Geant4 (ver 10.04-patch02; Agostinelli et al.,, 2003). Electromagnetic interactions were calculated in G4EmLivermorePhysics while considering the Doppler broadening effect of Compton scattering. To confirm the reliability of the SMILE-2+ ETCC simulator, we measured the effective area, PSF, and energy resolution under irradiation by line gamma-rays from the checking sources placed approximately 2 m from the center of SMILE-2+ ETCC. The measured performances were compared with the simulated expectations. Figure 5 plots the effective areas as functions of incident energy when the checking sources were placed along on the center axis of the ETCC or when parallel light was irradiated at a zenith angle of 0 degrees. The expected and measured effective areas were consistent. In the energy-selected results, the realized effective area was 1.1 cm2 at 0.356 MeV, which satisfies the criterion for detecting the Crab nebula. The difference between all reconstructed events and the energy-selected events (twice the FWHM of the full-energy peak) increased at the higher energies. This difference is caused by the scattered component, namely, the scattered gamma-rays in the surrounding materials (e.g., the pressured vessel, TPC vessel, and PSA support structures) before the radiation enters the ETCC. As the major interaction between incoming rays and materials is Compton scattering, observations are considered to be confused not only by PSF blurring of the surrounding sources (the expected contamination) but also by components scattered from the structures. Therefore, an accurate response function is critical for obtaining the true fluxes of celestial objects.
The zenith angle dependence of the effective area at 0.662 MeV is shown in Fig. 6. As mentioned above, SMILE-2+ ETCC has a large FoV (3.1 sr). This FoV is defined as the field covering more than half the effective area at the zenith. In the ETCC simulator, the accuracy of the effective area was better than 10% over the energy range 0.15–2.1 MeV within the FoV.
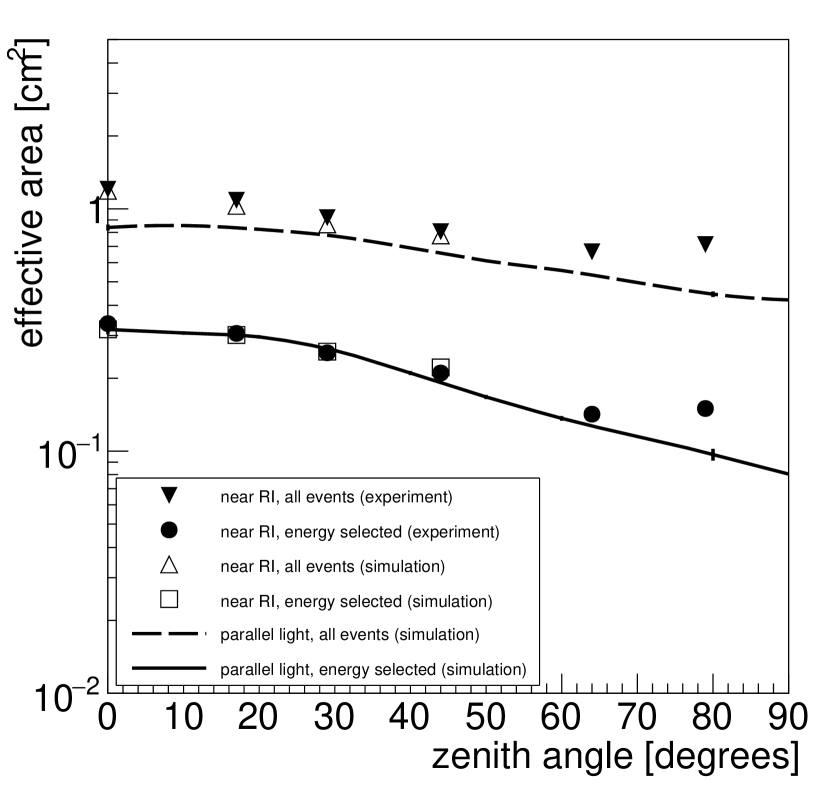
Figure 7 plots the Half-power radius (HPR) of PSF as a function of incident energy. The PSF size of SMILE-2+ ETCC is 30 degrees at the HPR for 0.662 MeV. Furthermore, the angular resolution measure (ARM) and scatter plane deviation (SPD) at the FWHM for 0.662 MeV, which define the accuracies of the scattering angle and the scattering plane, respectively, are 10.5 and 148 degrees for 0.662 MeV at FWHM. The PSF of the ETCC depends on the energy resolution of the PSAs, the position accuracy of the Compton-scattering point, and the angular resolution of the direction of the Compton-recoil electrons. Although SMILE-2+ ETCC has poorer spatial resolution than the advanced telescopes that observe other wavelengths, it satisfies the criteria for detecting the Crab nebula with powerful background rejection capability.
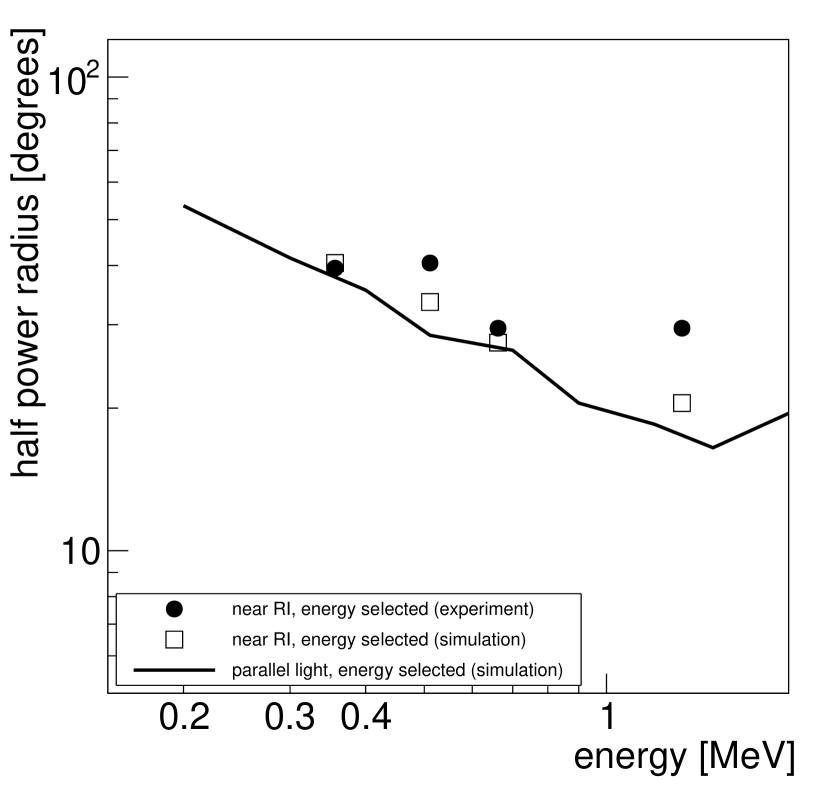
Figure 8 shows the energy resolutions of SMILE-2+ ETCC, TPC and PSA. The fully-contained electron events are limited to recoil energies lower than 0.3 MeV because the TPC gas lacks any stopping power. Therefore the energy of the scattered gamma-ray exceeds that of the recoil electron and the energy resolution of the ETCC is dominated by that of PSAs.

3 SMILE-2+ Balloon flight
The SMILE-2+ balloon was launched by ISAS/JAXA from the Australian balloon launch station, Alice Springs, Australia, on April 7 of 2018. Three hours before launching at 06:24 Australian Central Standard Time (ACST), the SMILE-2+ system was switched on the data acquisition was running even during the ascent. The time variations of the altitude and atmospheric pressure are shown in the upper and lower panels of Fig. 9, respectively.
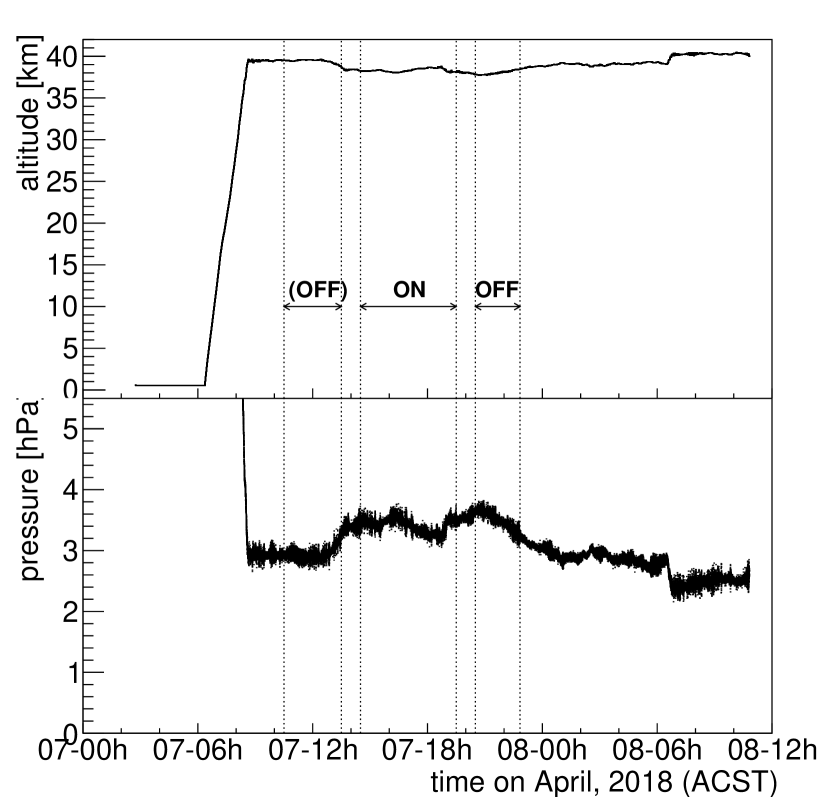
At 08:44 ACST, the balloon reached an altitude of 39.6 km. SMILE-2+ performed observations until 10:45 ACST on April 8 of 2018, and was switched off at 10:53 ACST. At 06:30 ACST on April 8 of 2018, the balloon slightly ascended owing to sunrise. The duration of the level flight, in which the atmospheric depth was maintained between 2.4–3.8 hPa (altitude 37.8–40.4 km), was approximately 26 h. On April 9 of 2018, we approached and successfully recovered the SMILE-2+ gondola, which had landed approximately 190 km from Alice Springs.
Figure 10 shows the flight path of the SMILE-2+ balloon from the launch time until turn-off of the SMILE-2+ system.
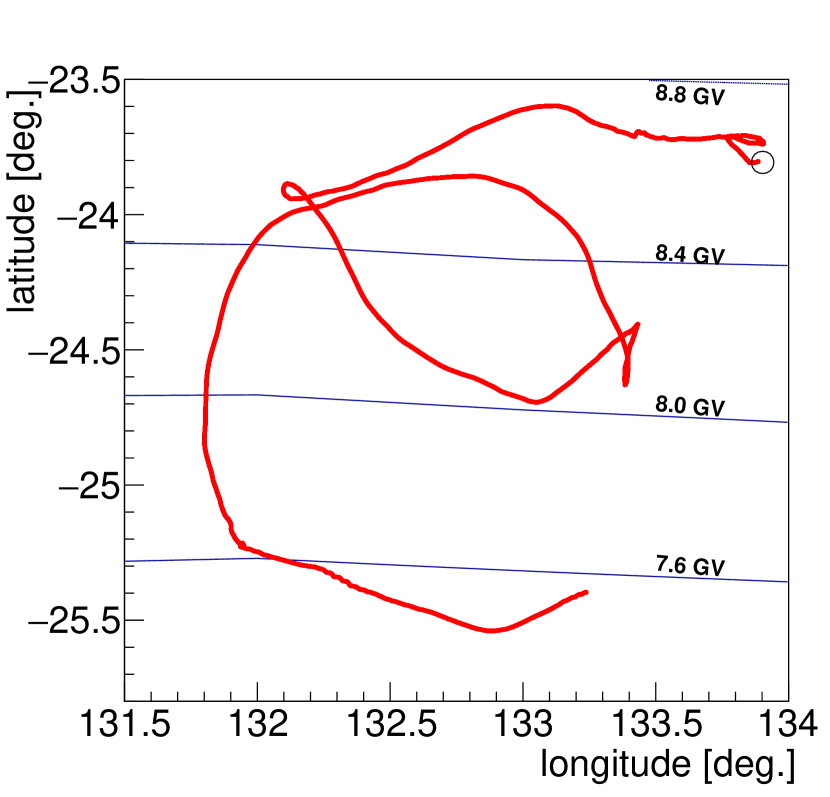
The cutoff rigidity (marked by the contours in Fig. 10) were calculated by PARMA (Sato et al.,, 2008) based on MAGNETOCOSMICS (Desorgher et al.,, 2005). The time-averaged cutoff rigidity was 8.20.4 GV during the level flight, and the index, which indicades an indicator of the disturbances in the Earth’s magnetic field, was below 2111https://www.gfz-potsdam.de/en/kp-index. The low index confirmed a stable and quiescent magnetic field condition, under which the intensities of cosmic rays should cause negligible fluctuations in the SMILE-2+ observation. In contrast, the intensity of atmospheric gamma-rays is proportional to (Schönfelder et al.,, 1977; Thompson et al.,, 1981), where and are the atmospheric depth and the cutoff rigidity, respectively. Between 13:32 and 23:00 ACST on April 7 of 2018 (see Fig. 9), the balloon altitude decreased with a concomitant 20% increase in atmospheric depth. The intensity of atmospheric gamma-ray was expected to rise at this time.
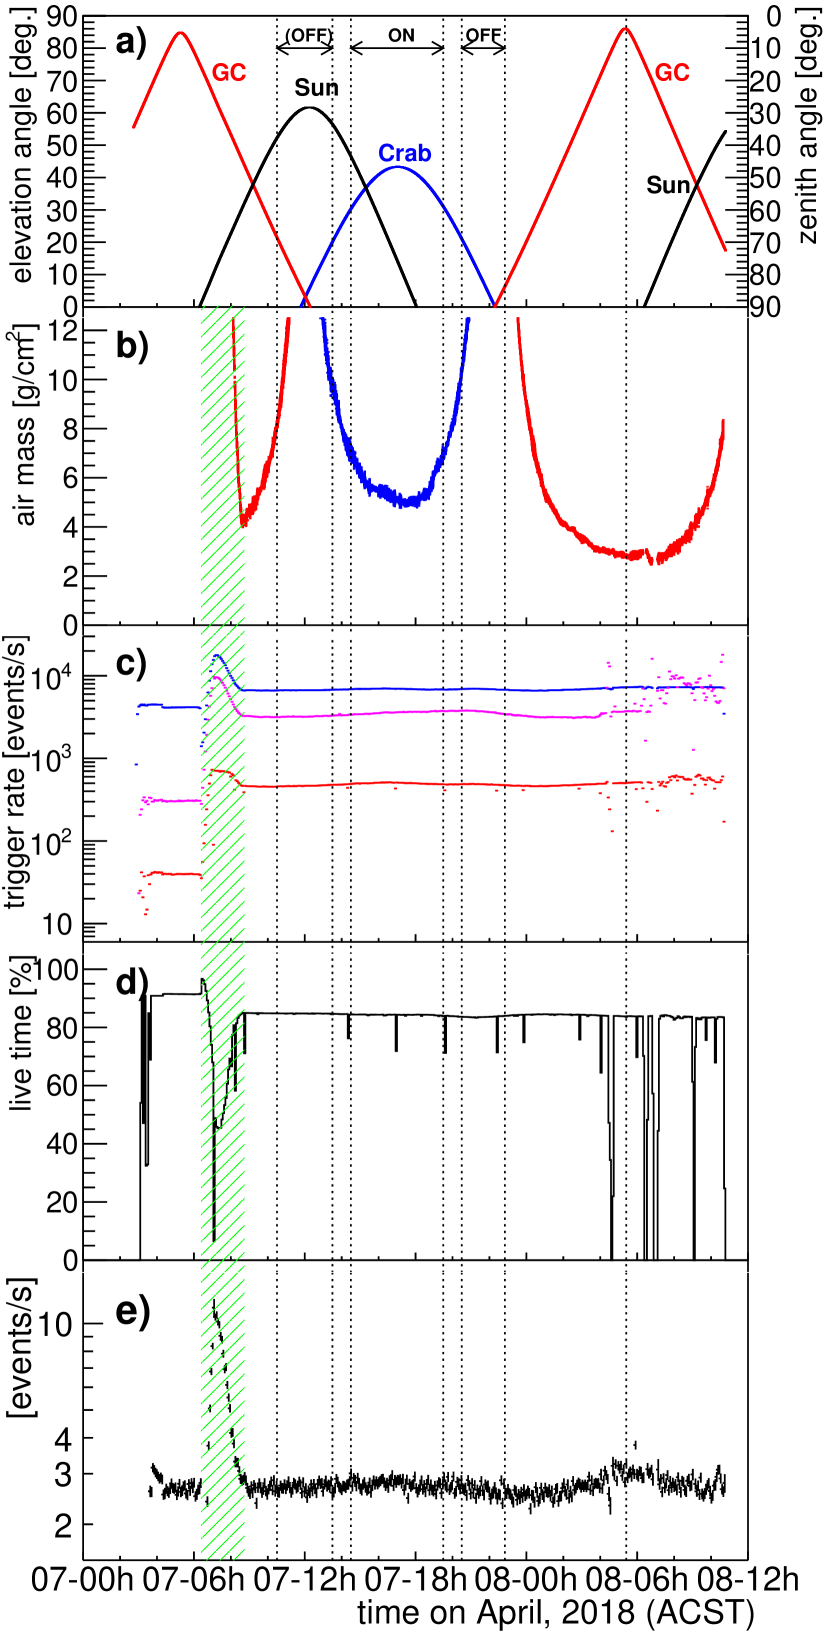
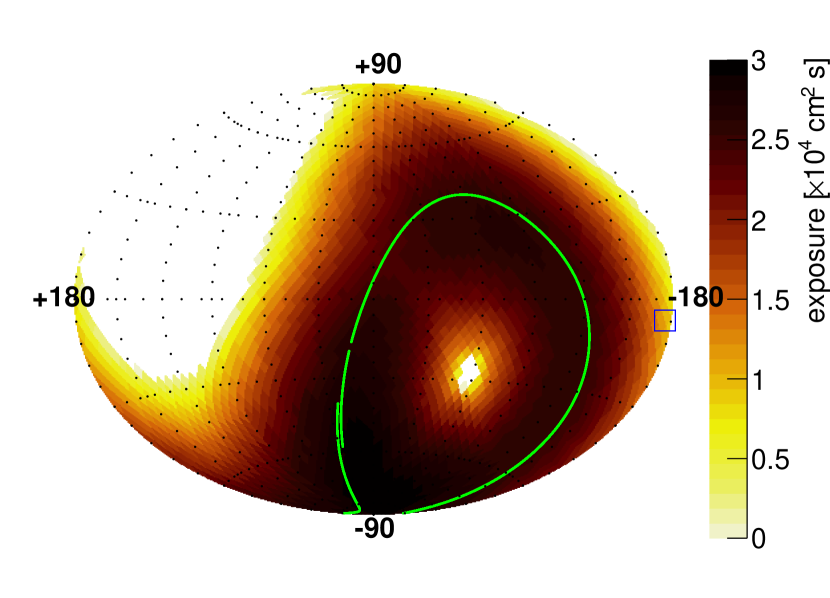
The time variations of the elevation angles and air masses of the observation targets are shown in panels a) and b) of Fig. 11, respectively. Panel c) of this figure shows the count rates of PSAs, TPC, and ETCC. The live times of SMILE-2+ observing the Crab nebula and the Galactic center were 5.1 h and 10.2 h, respectively. The data acquisition rate (red plots in Fig. 11) was 40 events s-1 on the ground, 700 events s-1 near the Pfotzer maximum (live time 45%), and approximately 450 events s-1 at 39.6 km altitude. After 06:45 ACST on April 8 of 2018, the count rate of the TPC was raised by small discharges occuring in the TPC. However, as these discharge events can be clearly discriminated from the charged particle tracks in the track images, they do not disturb the gamma-ray observations. During level flight, the live time of the data-acquisition was maintained above 82% (Fig. 11 d)), sufficient for observing the Crab nebula and Galactic center. Figure 12 represents the exposure map with the definition of the observation area by the zenith angle below 60 degrees.
4 Analysis
4.1 gamma-ray reconstruction
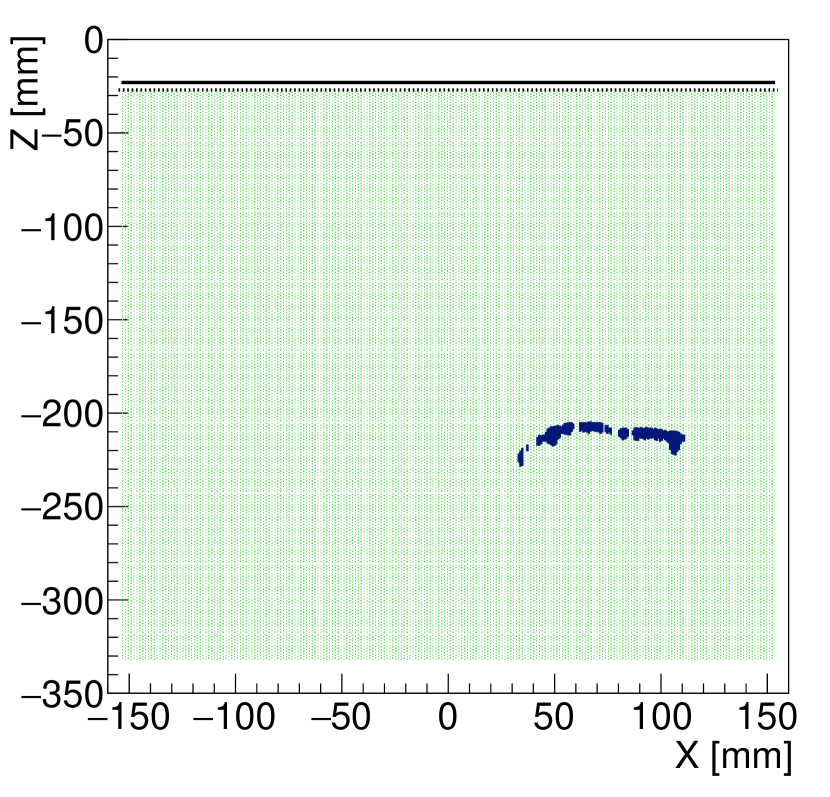
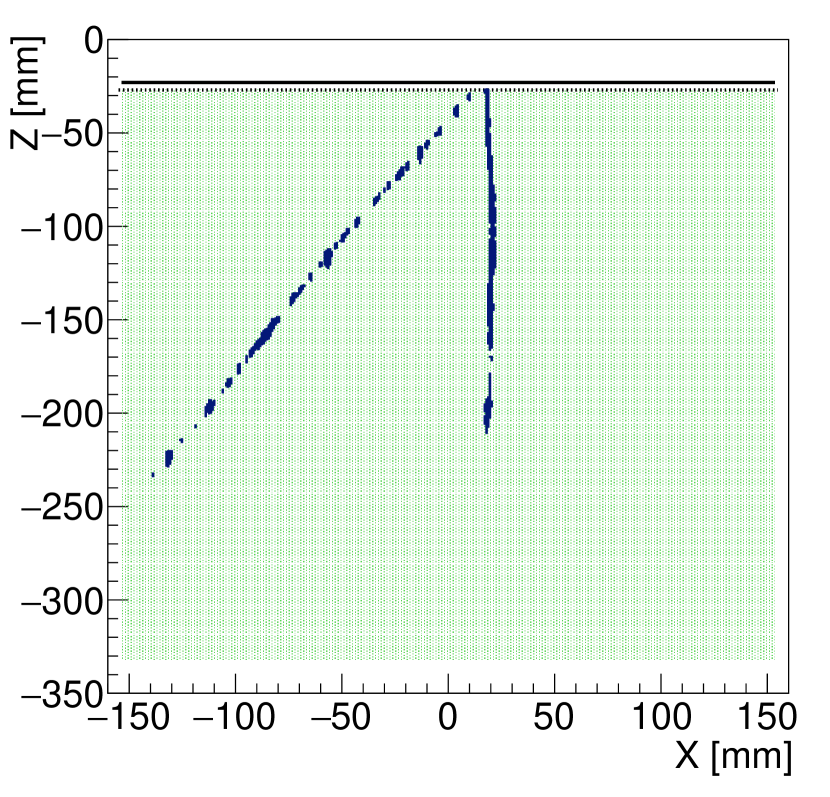
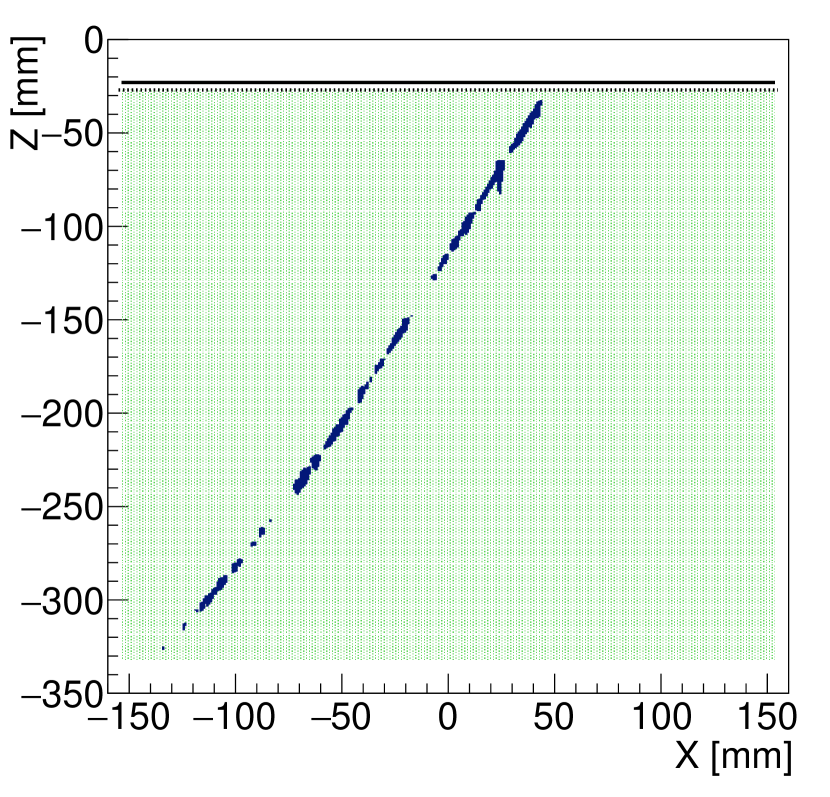
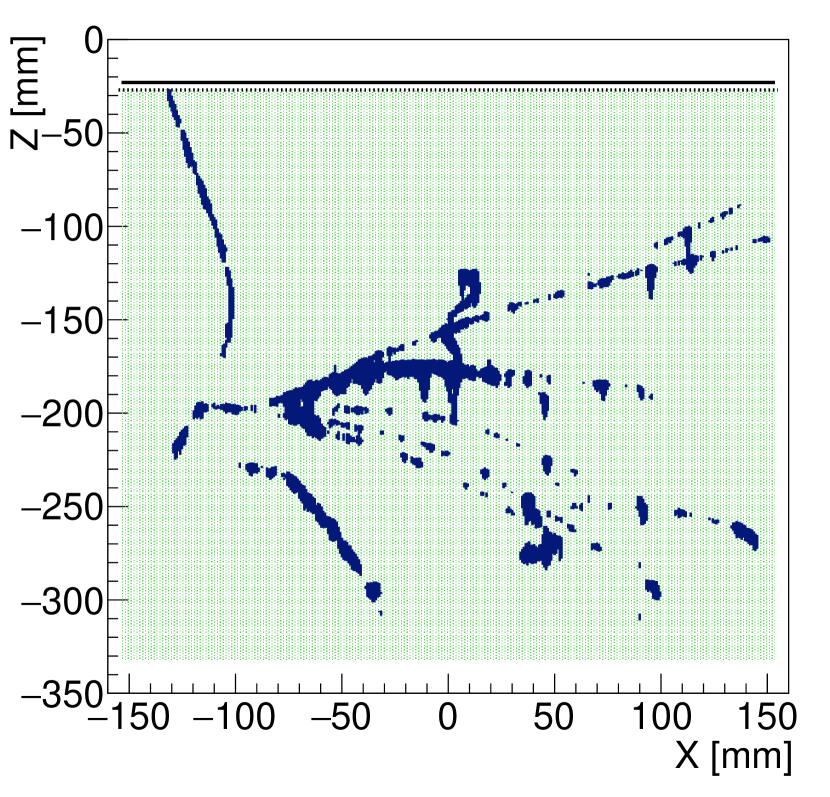
SMILE-2+ ETCC recorded events after turn-on. Typical tracks detected during level flight are shown in Fig. 13. Single-electron events were selected for the gamma-ray reconstruction as described in Section 2.2. The measured track images clearly showed the occurrences in SMILE-2+ ETCC from which select single-electron events were selected. Thus, the track image itself provides a simple and powerful means of noise suppression.
At balloon altitudes, cosmic-rays interact with the structural materials to produce positrons or gamma-rays. Because the ETCC is triggered by coincident PSAs and TPC, many cosmic-ray induced events including the electron-positron annihilation line absorbed in PSA were recorded. Using the cosmic-ray or shower events in the flight data, we corrected the gain of the scintillators by the annihilation line every 30 min and the TPC gain by the energy deposition rate of the minimum ionizing particles every 10 min. Figure 14 shows the energy spectrum of each event selection during level flight, and the spectrum obtained by selecting all events, when events remained. After selecting the fully-contained electrons, the spectrum showed a clear excess at 0.511 MeV.
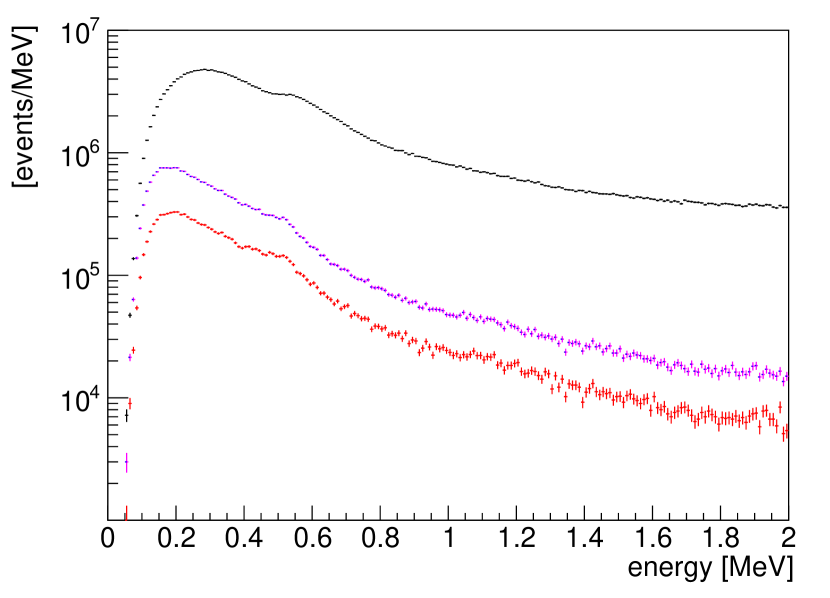
Figure 11 e) shows the light curve obtained by the gamma-ray reconstruction in all directions with the live-time correction. The gamma-ray event rate in all directions was 2.7 events s-1 and remained stable during level flight. When the air mass of the Galactic center is less than 4 g cm-2, the light curve rises with increasing elevation angle of the Galactic center. The excess at the culmination time of the Galactic center is 0.5 events s-1, so the estimated intensity of the GCR is 0.15 photons s-1 cm-2 sr-1 MeV-1 with an effective area of 1.1 cm2 and FoV of 3.1 sr. The intensity result is roughly consistent with the intensity measured SPI/INTEGRAL (Bouchet et al.,, 2011).
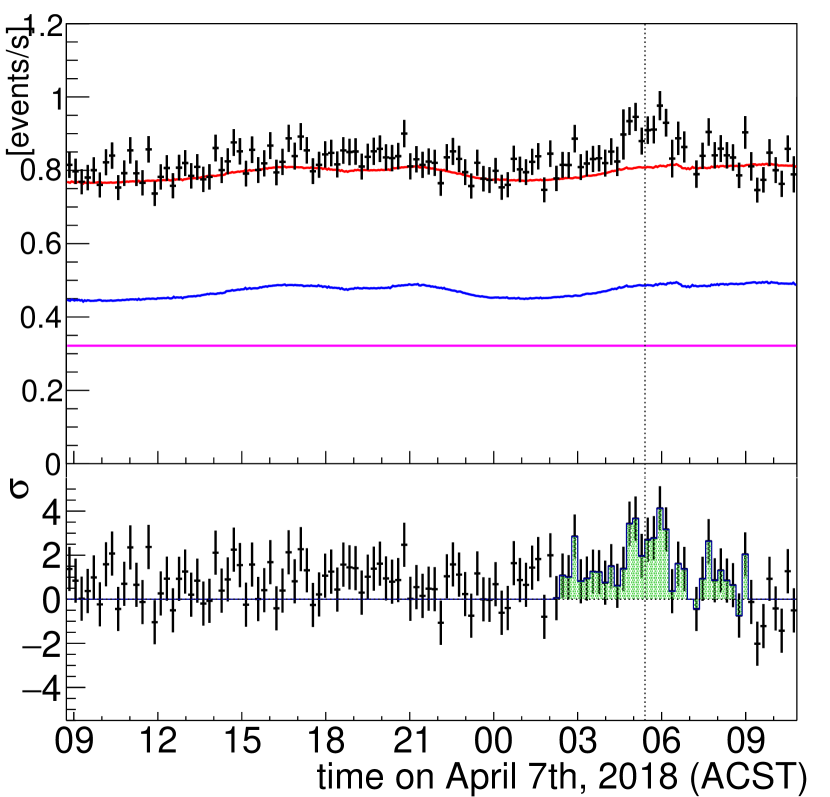
Figure 15 shows the light curve at zenith angles below 60∘ in the 0.15–2.1 MeV energy band. Plotted are the expected event rate at which SMILE-2+ detects the extragalactic diffuse and atmospheric gamma-rays (blue curve) and the expected instrumental background event rate induced by protons, neutrons, electrons and positrons (magenta line), which was calculated by PARMA (Sato et al.,, 2008) and Geant4. The intensity of atmospheric gamma-rays depends on the atmospheric depth, cutoff rigidity , and solar modulation. Here, we adopted the semiempirical model by Ling, (1975) to the atmospheric depth dependence of extragalactic diffuse and atmospheric gamma-rays. We additionally assumed that the intensity of atmospheric gamma-rays is proportional to , as detailed in Section 5. The red line in Figure 15 plots the total event rate of SMILE-2+ estimated independently of the observation results. Over most of the level flight period, the observed rate 0.15–2.1 MeV events at a zenith angle of 60∘ is explained by the sum of extragalactic gamma-rays, atmospheric gamma-rays, and the instrumental background. The differential between the obtained and estimated event rates (lower panel of Figure 15) shows a significant excess around the culmination time of the Galactic center. The detector count rates of SMILE-2+ clearly reveal an enhanced gamma-ray emission from the GCR.
In contrast, no clear excess appeared in Fig. 11 e) when the Crab nebula was observed. This absence is explained by the low flux of the Crab nebula (only 3% of the photon number of extragalactic diffuse gamma-rays in the FoV of the ETCC in the energy range 0.2–2.1 MeV). During the ON-region of Crab nebula observation, we considered that the Crab nebula ( = 184.6∘, = -5.8∘) was centered in a circle of radius 40 degrees, which defines the HPR of the PSF at 0.3 MeV. The spectrum obtained in the ON-region is the red spectrum in Fig. 16.
4.2 background estimation
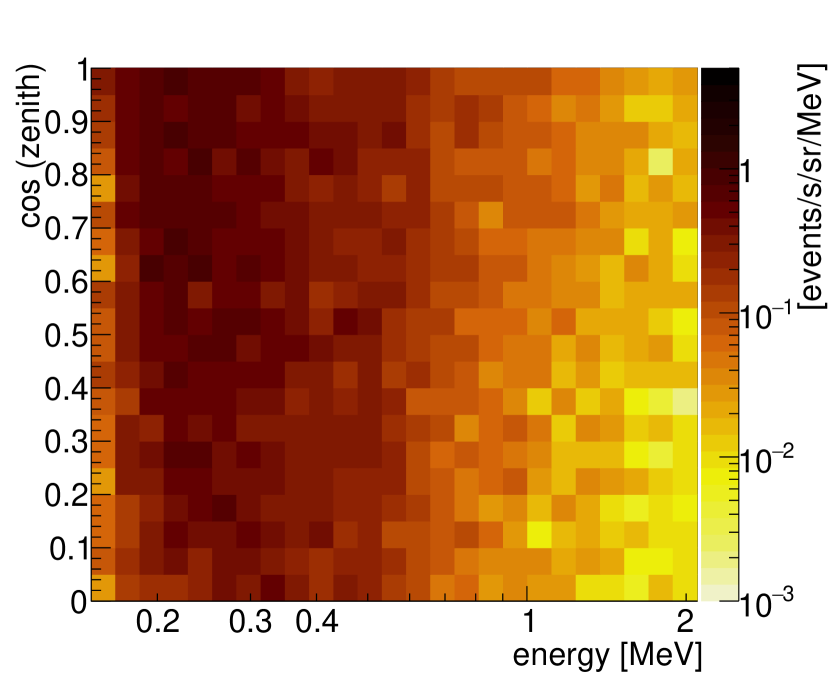
In celestial gamma-ray observations at balloon altitudes, the gamma-ray background comprises extragalactic diffuse gamma-rays, atmospheric gamma-rays, and instrumental gamma-rays. Although extragalactic diffuse gamma-rays are isotropic at the top of the atmosphere, they are scattered and attenuated in the atmosphere at balloon altitudes. The intensities of atmospheric gamma-rays and the instrumental gamma-rays depend on the atmospheric depth, zenith angle, and intensity of cosmic-rays. Unfortunately, the atmospheric depth increased by 20% during observations of the Crab nebula. We thus defined an OFF-period of 20:30–22:50 ACST on April 7 of 2018, when the balloon altitude decreased over the Crab observation period (Fig. 9) and no bright celestial objects appeared inside the FoV. Figure 17 maps the event intensity on the detected energy versus zenith angle plane during the OFF period. This event intensity map was assumed as the sky image of background gamma-rays in horizontal coordinates.
Because the zenith angle of the ON-region avaried over time, we calculated the average background energy spectrum over the Crab observation period;
| (7) |
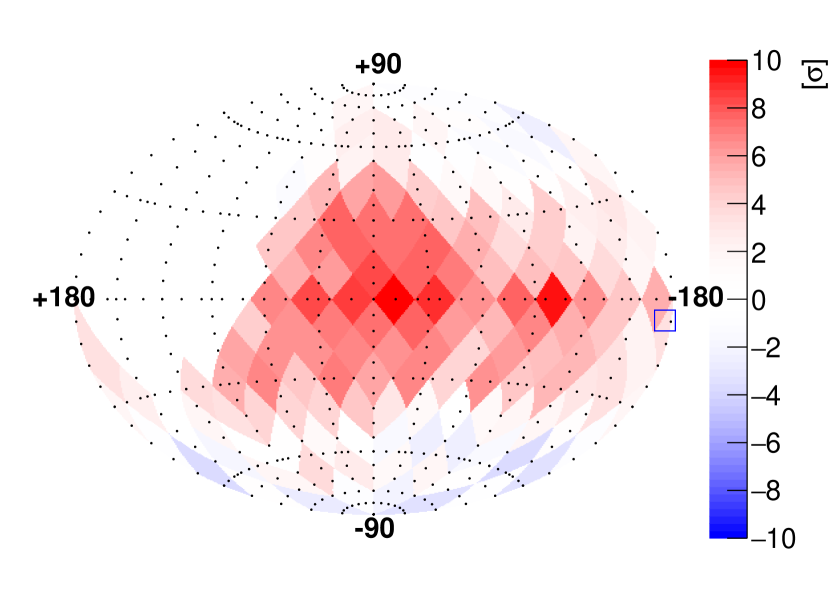
where is the live time of the Crab observation period (hatched spectrum in Fig. 16). After subtracting the estimated background from the ON-region events, we obtained , the energy spectrum of gamma-rays from the Crab nebula. The magenta spectrum in Fig. 16 displays as a function of . The convolved significance is 4.0. Applying the same method to the observed data from 08:44 ACST on April 7 of 2018 to 06:30 ACST on the following day, we calculated the significance map shown in Fig. 18. Because the balloon altitude varied in time, we defined in two time period: from 10:30 to 13:30 ACST on April 7 of 2018, when the atmospheric depth was less than 3.1 g cm-2, and from 20:30 to 22:50 ACST on April 7 of 2018, when the atmospheric depth exceeded 3.1 g cm-2. In addition to the light curve, SMILE-2+ significantly detected the GCR. A detailed study of the GCR will be described elsewhere.
4.3 calculation of flux
The background-subtracted spectrum in Fig. 16 includes the detector response and attenuation by the atmosphere,
| (8) |
where and are the true energy and true zenith angle of the incident photons, respectively, is the response matrix of the ETCC, and , , and denote the atmospheric depth, cross section of total attenuation in the atmosphere, and photon flux of the celestial object, respectively. can be estimated using the ETCC simulator described in Section 2.2. Because , , and are temporally variable in balloon observations, we calculated the time-averaged response matrix as follows:
| (9) |
where and are integers denoting specific energy bins. The resultant spectrum is then described as
| (10) |
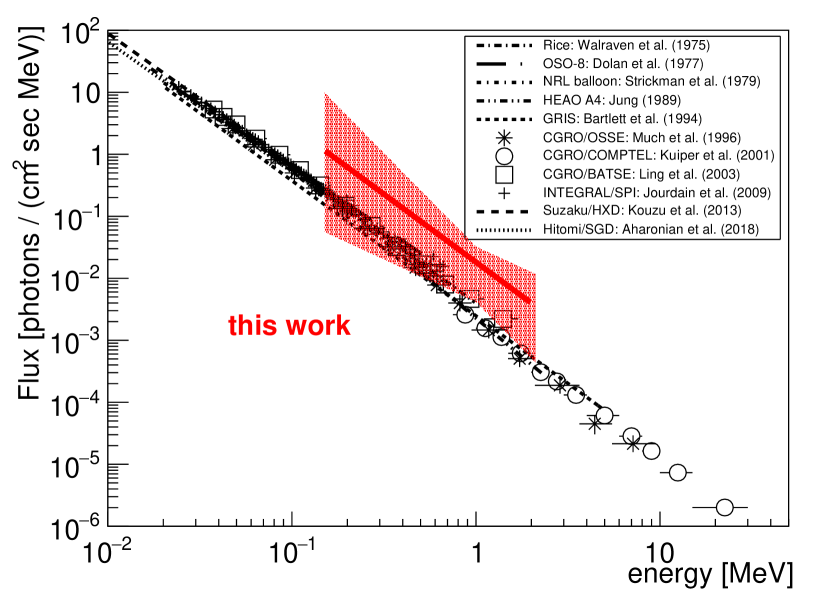
where can be obtained thorough deconvolution. Assuming that follows a single power-law, the deconvolved photon flux was detemined as photons s-1 cm-2 MeV-1. This flux spectrum is shown in Fig. 19 together with its 1 error band. The Swift/BAT transient monitor (Krimm et al.,, 2013) revealed no significant flares during the observation time222https://swift.gsfc.nasa.gov/results/transients/index.html. Therefore, as a consistency check, we can compare our result with other observations of the Crab nebula. Our result is indeed consistent with previous observations of the Crab nebula.
To investigate any time-dependence of the OFF-period, we calculated the photon fluxes during two additional background periods. 10:30–13:30 ACST on April 7 of 2018 and the Crab observation period. During the first of these period, the atmospheric depth was 3.01 g cm-2, 13% thinner than during the Crab observation period (14:30–19:30 ACST on April 7 of 2018). Therefore, the intensity of atmospheric gamma-rays should decrease and the resulting gamma-ray flux of the Crab nebula based on this background period should be overestimated. The selection of the Crab observation period is justified because the Crab nebular’s flux is negligibly smaller than the intensity of extragalactic diffuse and atmospheric gamma-rays within ETCC’s FoV. The single power-law spectra within these additional two background periods were calculated as described for the original background period. The obtained parameters are listed in Table 1. As the parameters were quite simillar in each case, the obtained photon flux little depended on the selection of the OFF-period.
| BG timeaatime on April 7, 2018 in ACST | 20:30–22:50 | 10:30–13:30 | 14:30–19:30 |
|---|---|---|---|
| normalizationbbunit in photons s-1 cm-2 MeV-1 | |||
| photon index | |||
| significance | 4.0 | 6.6 | 2.9 |
5 Discussion
In general, the detection sensitivity in some energy band is defined by the detectable flux with a significance of 3, an observation time of 106 s, and an energy window of . The background rate and the detection sensitivity of SMILE-2+ are respectively estimated by Eq. (7) and by
| (11) |
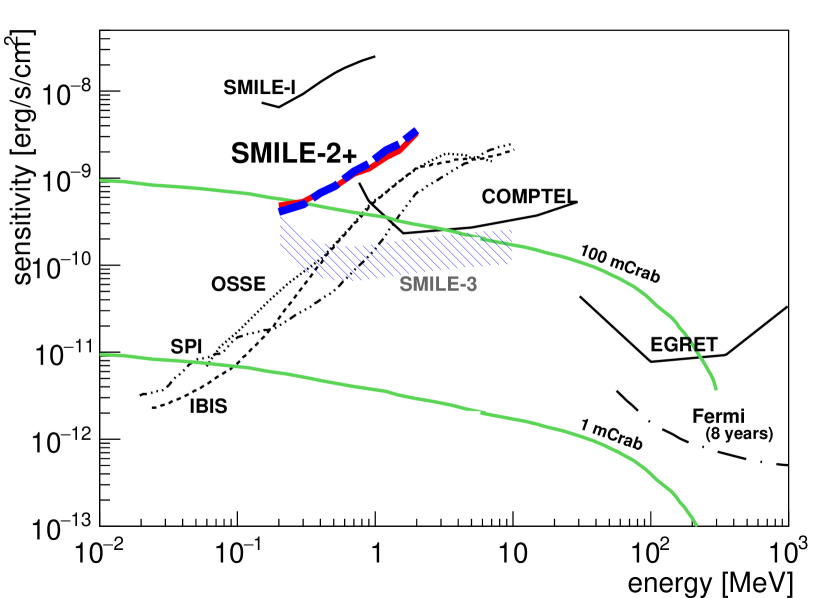
in the zenith direction ( = 0∘). When is defined by the HPR (see in Fig. 7), the detection sensitivity of SMILE-2+ is the blue long-dashed line in Fig. 20. The realized sensitivity, at which the Crab nebula was detected within a few hours, was approximately ten times better than that of SMILE-I.
The background events comprise extragalactic diffuse gamma-rays, atmospheric gamma-rays, instrumental gamma-rays, and other particles (such as neutrons). Radioactivation is negligible because the duration time is too short in balloon observation. Therefore the background event intensity will be described as
| (12) |
where and are intensities of extragalactic diffuse and atmospheric gamma-rays, respectively, and is the event intensity of the instrumental background. The intensity of extragalactic diffuse gamma-rays depends on the zenith angle and changes with atmospheric attenuation and scattering at balloon altitudes (Makino,, 1970; Horstman & Horstman-Moretti,, 1971; Schönfelder et al.,, 1977; Takada et al.,, 2011). In contrast, it is uniform at the top of the atmosphere. Atmospheric gamma-rays, produced when cosmic-rays interact with the atmosphere, depend on the atmospheric depth, cutoff rigidity, and solar modulation. Among several models for atmospheric gamma-rays is PARMA (Sato et al.,, 2008), an analytical model based on PHITS simulations (Iwase et al.,, 2002). PARMA models the intensity of atmospheric gamma-rays with respect to energy, zenith angle, atmospheric depth, solar modulation, and cutoff rigidity, but does not consider the primary cosmic electrons/positrons as the initial particles. Ling, (1975) and Ling et al., (1977) included extragalactic diffuse gamma-ray in a semiempirical model based on balloon observations. Their model considers the gamma-ray energy, zenith angle and atmospheric depth, but not consider the effect of cutoff rigidity and solar modulation on gamma-ray intensity. Nevertheless, this model is often cited in observational studies.
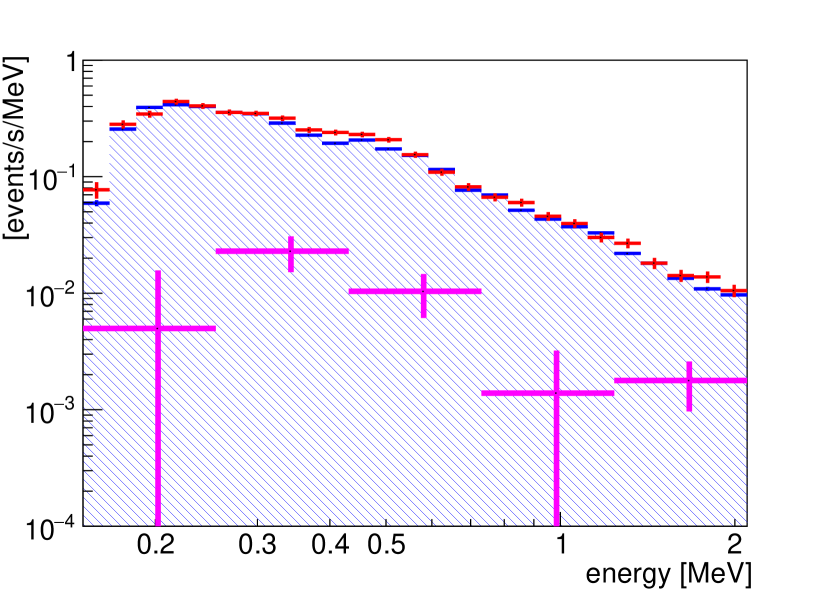
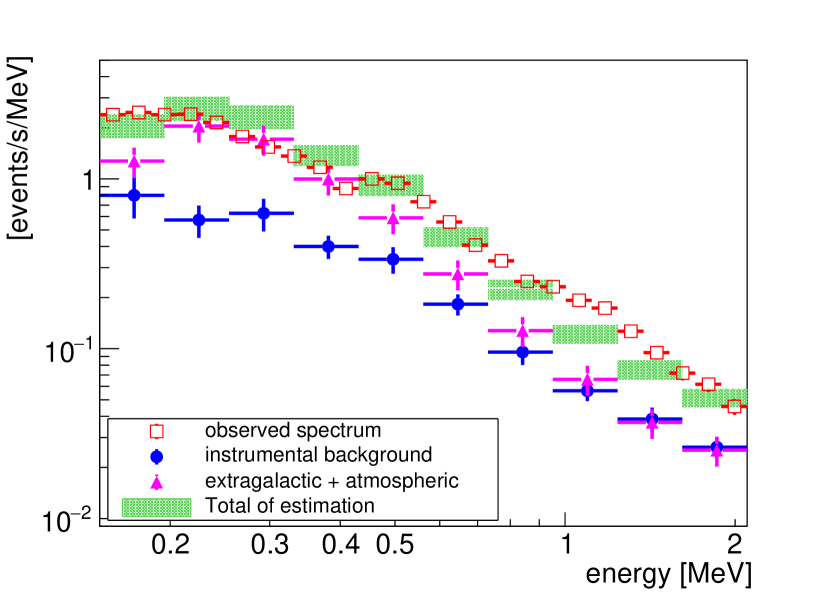
As the intensity model of extragalactic diffuse and atmospheric gamma-rays, we adopted the Ling, (1975) and Ling et al., (1977) model and scaled by the dependences of cutoff rigidity and solar modulation. To correct the cutoff rigidity, we scaled the atmospheric component in the models by . Meanwhile, the balloons referred by Ling’s models were launched around the solar maximum, whereas SMILE-2+ was launched near the solar minimum. As the atmospheric gamma-ray intensity is around 1.2–2.0 times larger at the solar minimum than at the solar maximum (Morris,, 1984; Sazonov et al.,, 2007), we scaled the intensity of atmospheric gamma-rays by a factor of1.2. Assuming the gamma-ray intensity at an atmospheric depth of 3.0 g cm-2, we expected the SMILE-2+ ETCC spectrum represented by the filled triangles in Fig. 21. To evaluate the instrumental background , we simulated the reconstructed events of the ETCC simulator using the PARMA-calculated intensities of the initial particles (protons, neutrons, electrons, and positrons). The filled circles in Fig. 21 describe the estimated energy spectrum of the instrumental background at the same altitude. The amount of instrumental background was one-half that of the essential background composed of extragalactic diffuse and atmospheric gamma-rays. Thus the instrumental background negligibly affected the detection sensitivity of SMILE-2+. The expected total background spectrum (indicated by the hatched area in Fig. 21) approximately matched with the observed energy spectrum (described by the open squares in Fig. 21). Against this estimated total background, we can obtain the detection sensitivity independently of the sensitivities mentioned above. The estimated detection sensitivity of SMILE-2+ (red solid line in Fig. 20) was also consistent with the realized sensitivity.
As confirmed in these results, the background spectrum and the detection sensitivity of observations by an ETCC in space are well embodied in the results of the ground calibrations. In contrast, the obtained sensitivities of COMPTEL and most of the other conventional Compton cameras are several times worse than the expected sensitivities (Schönfelder,, 2004; Bandstra et al.,, 2011). The above estimationis strongly and independently supported by the enhanced light curve at the culmination time of the Galactic center. If the instrumental background was several times more intense than the extragalactic gamma-rays, such as COMPTEL, this enhancement could not be observed. The instrumental background of ETCC observations is mainly contributed by gamma-rays generated by interactions between cosmic rays and the instrumental material. Other disturbances are diminished or removed by powerful background-rejection tools such as particle identification, track image, and a Compton kinematics test. The upward instrumental gamma-rays are intense because of the instrumental material is below the ETCC. However, because the ETCC can pinpoint the direction of an incident gamma-ray to a point in each event. SMILE-2+ can suppress the instrumental background within the FoV to the expected contamination level the PSF. Under this noise condition, the detection sensitivity of the next observation (SMILE-3) can be estimated both easily and realiably. After constructing a new TPC of volume cm3 filled with CF4 gas at a 3 atm pressure and optimizing the structural design, the effective area of ETCC will be approximately 10 cm2 for 0.4 MeV and 1 cm2 for 2.5 MeV. To improve the PSF, we are developing an analysis method based on machine learning. In the first trial, deep learning of the recoil direction and scattering point improved the PSF to double that of the present paper (Ikeda et al.,, 2021). If the direction accuracy of Compton-recoil electrons could be improved to the limiting accuracy of multiple scattering, the PSF of the ETCC will improve to 10 degrees and 2 degrees at HPR for 0.4 MeV and 2.5 MeV, respectively. The sensitivity of an ETCC loaded on a long-duration balloon (SMILE-3)should exceed that of COMPTEL by several times (indicated by the blue hatched area in Fig. 20). Recently, a super-pressure balloon has been launched for over one month at middle latitudes in the southern hemisphere (Kierans et al.,, 2017). colorblueTherefore, if we can launch an updated ETCC on a long-duration balloon in the SMILE-3 mission, we could significantly surpass the COMPTEL observations because the large FoV of the ETCC enables observation times of 106 s.
6 Summary
To advance MeV gamma-ray astronomy, we are developing an ETCC with imaging spectroscopy ability. The ETCC is based on bijection imaging and utilizes powerful background rejection tools (particle identification, Compton-scattering kinematics test, and charged-particle track imaging). A proper PSF is performed on the celestial sphere, enabling acquisition of the energy spectrum of the observation target by simple ON-OFF method. In 2018, we launched the second balloon (SMILE-2+) to confirm ETCC observations of celestial objects. The effective area of the ETCC loaded on SMILE-2+ is 1.1 cm2 for 0.356 MeV, the PSF is 30 degrees at HPR for 0.662 MeV, and the FoV is 3.1 sr when a 303030 cm3 TPC is filled with argon gas at 2 atm pressure. The observed flux and energy spectrum during the level fight, estimated independently of the experimental results, were well explained by a background of extragalactic diffuse, atmospheric, and instrumental gamma-rays. With this good understanding of the sensitivity and background, we achieved the pre-launch expectations (a significance level of 4.0) of SMILE-2+ observations of gamma-rays from the Crab nebula. The obtained flux was also consistent with other flux observations. In addition, the light curve and the significance survey map show that the GCR is very bright with a significance of 10 in the 0.2–2.1 MeV energy range. Thus, SMILE-2+ is the first application of imaging spectroscopy based on a proper PSF and bijection imaging to MeV gamma-ray astronomy. The observed energy spectrum during level flight was explained by the background noise, which contains extragalactic diffuse, atmospheric, and instrumental gamma-rays. The achieved detection sensitivity of SMILE-2+ matched the sensitivity estimated from ground calibrations, whereas the sensitivities of most conventional Compton cameras are several times worse than their expected values. The instrumental gamma-rays little affected the detection sensitivity of SMILE-2+, because they constituted only one-third of the background. For this reason, the ETCC overcomes the large background problem. When designing a Compton camera, the sensitivity must be estimated with a PSF (not an ARM), similarly to telescopes operating in the X-ray or GeV bands. In the near future, the ETCC will be updated to an approximate effective area of 10 cm2 and a PSF of several degrees at the HPR, and we will then launch a long-duration balloon flight (SMILE-3) for scientific observations. The ETCC can become a unique pioneer with deeper survey ability than COMPTEL in MeV gamma-ray astronomy.
References
- Agostinelli et al., (2003) Agostinelli, S., et al. 2003, Nucl. Instr. Meth. A, 506, 250
- Aharonian et al., (2018) Aharonian, F., et al., 2018, PASJ, 70, 113
- Aprile et al., (2008) Aprile, E., et al. 2008, Nucl. Instr. Meth. A, 593, 414
- Attwood et al., (2009) Attwood, W. B., et al., 2009, ApJ, 697, 1071
- von Ballmoos, (1995) von Ballmoos, P. 1995, Exp. Astron., 6, 85
- Bandstra et al., (2011) Bandstra, M. S., et al. 2011, ApJ, 738, 8
- Bartlett et al., (1994) Bartlett, L. M., et al., 1994, AIP Conf. Proc., 304, 67
- Boggs et al., (2000) Boggs, S. E., et al. 2000, ApJ, 544, 320
- Bouchet et al., (2008) Bouchet, L., et al. 2008, ApJ, 679, 1315
- Bouchet et al., (2011) Bouchet, L., et al., 2011, ApJ, 739, 29
- Briggs et al., (1999) Briggs. M. S., et al. 1999, ApJ, 524, 82
- Carr et al., (2010) Carr, B. J., et al. 2010, Phys. Rev. D, 81, 104019
- Chrazov et al., (2015) Churazov, E., et al. 2015, ApJ, 812, 62
- Desorgher et al., (2005) Deaorgher, L., et al. 2005, JMPA, 20, 6802
- Diehl et al., (2015) Diehl, R., et al. 2015, Science, 345, 1162
- Diehl et al., (2018) Diehl, R., et al. 2018, A&A, 611, 12
- Dolan et al., (1977) Dolan, J. F., et al., 1977, ApJ, 217, 809
- Dujmic et al., (2008) Dujmic, D., et al., 2008, Nucl. Instr. Meth. A, 584, 327
- Hamaguchi et al., (2019) Hamaguchi, K., et al., 2019, BAAS, 51, 145
- Horstman & Horstman-Moretti, (1971) Horstman, H., & Horstman-Moretti, E. 1971, Nature, 229, 148
- Ikeda et al., (2021) Ikeda, T., et al., 2021, submitted in PTEP (arXiv:2105.0251)
- Iwase et al., (2002) Iwase, H., Niita, K., & Nakamura, T., 2002, J. Nucl. Sci. Technol. 39, 1142
- Jourdain & Roques, (2003) Jourdain, E., & Roques, J. P., 2009, ApJ, 704, 17
- Jung, (1989) Jung, G. V., 1989, A&A, 338, 972
- Kamiya, (2011) Kamiya, K 2011, Ph.D. University of California
- Kierans et al., (2017) Kierans, C., et al., 2017, PoS, INTEGRAL2016, 075
- Kierans et al., (2020) Kierans, C., et al., 2020, ApJ, 895, 44
- Kouzu et al., (2013) Kouzu, T., et al., 2013, PASJ, 65, 74
- Krimm et al., (2013) Krimm, H. A., et al., 2013, ApJS, 209, 14
- Kuiper et al., (2001) Kuiper, L., et al., 2001, A&A, 378, 918
- Ling, (1975) Ling, J. C. 1975, J. Geophys. Res., 80, 3241
- Ling et al., (1977) Ling, J. C., et al., 1977, J. Geophys. Res., 82, 1463
- Ling & Wheaton, (2003) Ling, J. C., & Wheaton, Wm. A., 2003, ApJ, 598, 334
- Mahadevan et al., (1997) Mahadevan, R., Narayan, R., & Krolik, J. 1997, ApJ, 486, 268
- Makino, (1970) Makino, F. 1970, Ap&SS, 8, 251
- Matz et al., (1988) Matz, S. M., et al. 1988, Nature, 331, 416
- McConnell et al., (1996) McConnell, M. L., et al. 1996, A&AS, 120, 149
- Mészáros & Rees, (2010) Mészáros, P., & Rees, M. J. 2010, ApJ, 715, 967
- Mizumoto et al., (2015) Mizumoto, T., et al. 2015, Nucl. Instr. Meth. A, 800, 40
- Morris, (1984) Morris, D. J., 1984, J. Geophys. Res., 89, 10685
- Much et al., (1996) Much, R., et al., 1996, A&A, 120, 703
- Ochi et al., (2001) Ochi, A., et al. 2001, Nucl. Instr. Meth. A, 471, 264
- Prantzos et al., (2011) Prantzos, N., et al. 2011, RvMP, 83, 1001
- Sato et al., (2008) Sato, T., et al. 2008, Radiation Research, 170, 244
- Sauli, (1997) Sauli, F. 1997, Nucl. Instr. Meth. A, 386, 531
- Sazonov et al., (2007) Sazonov, S., et al., 2007, MNRAS, 377, 1726
- Schönfelder et al., (1977) Schönfelder, V., Graser, U., & Daugherty, J. 1977, ApJ, 217, 306
- Schönfelder et al., (1993) Schönfelder, V., et al. 1993, ApJS, 86, 657
- Schönfelder et al., (2000) Schönfelder, V., et al. 2000, A&AS, 143, 145
- Schönfelder, (2004) Schönfelder, V. 2004, New Astron. Rev., 48, 193
- Sekiya et al., (2006) Sekiya, H., et al. 2006, Nucl. Instr. Meth. A, 563, 49
- Shoji, (2019) Shoji, Y., 32nd International Symposium on Space Technology and Science, 2019-m-18, 2019
- Siegert et al., (2020) Siegert, T., et al., 2020, ApJ, 897, 45
- Strickman et al., (1979) Strickman, M. S., Johnson, W. N., & Kurfess, J. D., ApJ, 230, L15
- Strong et al., (2000) Strong, A. W., Moskalenko, I. V., & Reimer, O. 2000, ApJ, 537, 763
- Takada et al., (2005) Takada, A., et al. 2005, Nucl. Instr. Meth. A, 546, 258
- Takada et al., (2011) Takada, A., et al. 2011, ApJ, 733, 13
- Takahashi et al., (2013) Takahashi, T., et al., 2013, APh, 43, 142
- Tamagawa et al., (2006) Tamagawa, T., et al. 2006, Nucl. Instr. Meth. A, 560, 418
- Tanimori et al., (2004) Tanimori, T., et al. 2004, New Astron. Rev., 48, 263
- Tanimori et al., (2015) Tanimori, T., et al. 2015, ApJ, 810, 28
- Tanimori et al., (2017) Tanimori, T., et al. 2017, Scientific Reports, 7, 41511
- Thompson et al., (1981) Thompson, D. J., Simpson, G. A., & Özel, M. E. 1981, J. Geophys. Res., 86, 1265
- Toma et al., (2011) Toma, K., et al. 2011, ApJ, 731, 127
- Trombka et al., (1973) Trombka, J. I., et al., 1973, ApJ, 181, 737
- Urry & Padovani, (1995) Urry, C. M., & Padovani, P. 1995, PASP, 107, 803
- Walraven et al., (1975) Walraven, G. D., et al., 1975, ApJ, 202, 502
- Weidenspointner et al., (2001) Weidenspointner, G., et al. 2001, A&A, 368, 347
- Zoglauer et al., (2003) Zoglauer, A., et al., 2003, Nuclear Science Symposium Conference Records 2003 IEEE, 3, 1694–1698