Present address: ]Department of Physics, Carnegie Mellon university, Pittsburgh, PA, 15213, USA
Origin of Nonlinear Damping due to Mode Coupling in Auto-Oscillatory Modes Strongly Driven by Spin-Orbit Torque
Abstract
We investigate the physical origin of nonlinear damping due to mode coupling between several auto-oscillatory modes driven by spin-orbit torque in constricted Py/Pt heterostructures by examining the dependence of auto-oscillation on temperature and applied field orientation. We observe a transition in the nonlinear damping of the auto-oscillation modes extracted from the total oscillation power as a function of drive current, which coincides with the onset of power redistribution amongst several modes and the crossover from linewidth narrowing to linewidth broadening in all individual modes. This indicates the activation of another relaxation process by nonlinear magnon-magnon scattering within the modes. We also find that both nonlinear damping and threshold current in the mode-interaction damping regime at high drive current after transition are temperature independent, suggesting that the mode coupling occurs dominantly through a non-thermal magnon scattering process via a dipole or exchange interaction rather than thermally excited magnon-mediated scattering. This finding presents a promising pathway to overcome the current limitations of efficiently controlling the interaction between two highly nonlinear magnetic oscillators to prevent mode crosstalk or inter-mode energy transfer and deepens understanding of complex nonlinear spin dynamics in multimode spin wave systems.
Spin-orbit torque driven magnetic nano-oscillators have recently emerged as potential charge current tunable microwave sources for spintronics devices[1, 2, 3, 4, 5, 6, 7, 8, 9, 10, 11, 12, 13], as well as fundamental elements for neuromorphic computing [14]. These oscillators use spin Hall effect to convert the charge current into a pure spin current which is injected into the ferromagnet, exerting an anti-damping torque on the magnetization. Above the threshold current, coherent magnetic auto-oscillations (AO) are generated at microwave frequencies.
In principle, these planar spin Hall nano-oscillators (SHNO) need not be limited in size and are expected to provide larger AO power because the Oersted field is relatively small and uniform in the device unlike nano-pillar spin-torque nano-oscillators (STNO). However, additional damping channels arise in extended thin film structures through nonlinear magnon scattering that prevents auto-oscillation [4]. These damping channels can be suppressed by restricting the area of the AO by fabricating a nano-constriction [3, 10] as well as other methods of spatial mode confinement such as dimensional reduction [4, 15] and local dipolar field [16, 17, 18, 19].
Nevertheless, in constriction-based SHNOs, mode splittings are often observed [3, 10], leading to substantial linewidth broadening which degrades performance in terms of AO coherence and power. So far, little is known about the origins of nonlinear damping as a consequence of multimode excitation in this system, and the mechanism underlying mode coupling is still unknown. In nano-pillar STNOs, similar multimode behaviors such as mode hopping [20, 21, 22, 23, 24, 25, 26], mode coexistence [27, 28, 29] and 3-magnon process [30, 31], have been reported along with theoretical studies [32, 20, 21, 22, 23, 24, 25, 29, 26, 33] of mode coupling, including its description [21, 22, 23, 24, 25, 26, 33], its effect on mode decoherence [22, 24, 25] and its temperature dependence [22, 24, 25, 33], however, much remains to be understood.
For this study, we fabricate Pt(5nm)/Py(5nm) bilayer devices in the form of a bow tie with an active center area of 600 nm 1 m, as shown in Fig. 1(a). This sample structure allows the generation of multiple AO modes by applying a high current density that is converted into a spin current that, in turn, exerts a spin torque on the magnetization of the Py (See Fig. 1(b)). By changing the orientation of the magnetic field applied at angle with respect to the x-axis of the microstrip line, we tune the eigenmodes of the spin waves defined by the spatial pattern of the internal field in Py, which is significantly modified by its dipolar, or demagnetizing field.
Indeed, when the orientation of the applied field changes relative to the device edges causing mode constriction, spectral and spatial distributions of the resulting AO modes vary significantly. Fig. 2(a) shows the angle dependence of the AO spectrum measured with bias current 7 mA at temperature K in an applied field Oe. As increases, more excitation modes appear over a wider frequency range as a result of stronger mode constriction. We perform micromagnetic simulations using MuMax3 [34](see Appendix B) to understand the complex spectra at various and to identify the relevant AO modes. Fig. 2(b) shows the angle dependence of the AO spectra obtained from simulations conducted with the current density distribution and Oersted field in Fig. 10 of Appendix. It well describes the overall evolution of the experimental AO spectrum with increasing angle in Fig. 2(a), although more accurate spatial information reflecting the high current density nonlinearity and structural defects in the AO active region seems necessary to fully account for the spectral shape details. Fig. 2(c)-(g) show the spatial profiles of the spin wave eigenmodes corresponding to the spectral peaks in Fig. 2(b) at various angles . We find that for , the edge and bulk modes are combined, whereas for , the edge and bulk modes are spatially separated due to the significant difference in the demagnetizing field between the edge and center regions. This separation also occurs spectrally (see Fig. 2(a) and 2(b)) and the largest AO peak appears in one of the bulk modes at frequencies higher than edge modes, which is in good agreement with previous AO results obtained on nanowires with [4].
The spectral and spatial mode profiles for AO in the active mode shown in Fig. 2 differ significantly from those of the linear spin wave mode (see Fig. 6 in Appendix). This demonstrates that the dynamics of the AO mode are different from those of the linear spin wave mode, arising from nonlinear effects such as complex bullet mode dynamics involved with mode size reduction[1, 3, 35] or mode size oscillation[5, 36]. In particular, this bullet mode effect appears to be more pronounced in bulk mode 3a and 3b in Fig. 2(c) and bulk mode 3 in Fig. 2(d), away from the edge effect. The frequency jump as the signature of the bullet mode is also discussed in Appendix D.
In the evolution of the auto-oscillation modes with increasing bias current, we observe a transition in nonlinear damping due to mode-mode coupling. As can be seen in Fig. 3(a) obtained by measuring at , as the current –and hence the anti-damping torque– increases. the three main modes C1, C2, and C3 (labelled in Fig. 3(e)) appear in the spectrum above each threshold current. We characterize these modes evolving at various with the resonance frequency , linewidth , and power obtained from Lorentzian fits, which are shown in Fig. 3(b)-(d). Associated with the transition of nonlinear damping, we observe noticeable abrupt changes at the current mA, such as the turnover from the linewidth narrowing to linewidth broadening (sign change of ) for all excitation modes (Fig. 3(c)) and power saturation in C1 mode (Fig. 3(d)). This transition marks the onset of another relaxation process with additional damping. However, as increases in the high current regime (), we also observe i) a monotonic redshift of the frequency for all three modes reflecting a monotonic reduction in saturation magnetization due to magnon excitation [37] (Fig. 3(b)), ii) a power increase in the C2 and C3 modes despite their linewidth broadening (Fig. 3(c) and 3(d)), and iii) an increase in the total power (Fig. 3 (d)). All of these imply that the magnon population is growing faster than excited magnons can decay to other thermal reservoirs. Therefore, we conclude that nonlinear damping in the high current regime occurs through magnon redistribution from low-frequency modes to high-frequency modes via nonlinear magnon-magnon scattering as shown schematically in Fig. 1(c) or 1(d).
There are other possible causes for the nonlinear damping transition at . The transition in the dependence of power on current shown in Fig. 3(d) may be described by the selective excitation and selective saturation of each mode. However, C2 and C3 in multimode excitation cannot be explained this way because their linewidth broadening, along with the power increase, at is not consistent with typical single-mode AO behavior which exhibits linewidth narrowing with increasing as C1 does for . Power saturation of C1 may be caused by Joule heating or spin pumping. However, Joule heating cannot saturate the power of C1 without similarly affecting C2 and C3. Crucially, Joule heating can be observed in the spin torque FMR by applying a high negative current () corresponding to the positive damping in which the spin current driven magnons are not generated. As the absolute value of increases, the decreasing resonance field can change to an increasing resonance field due to the decrease in saturation magnetization caused by Joule heating, similar to the previous Brillouin light scattering results [37]. However, this effect does not appear up to = -8 mA in our data (see Fig. 13 in Appendix), showing that Joule heating has a small effect. The intensity of spin pumping is proportional to the power of the AO mode [38]. As shown in Fig. 3(c) and 3(d), the linewidths of C1, C2 and C3 with different powers start to increase together at with increasing , which cannot be explained by spin pumping. Therefore, we conclude that only mode-mode interaction can explain the coincidence of both the power transfer from C1 to the higher frequency modes C2 and C3 and the turnover from linewidth broadening to linewidth narrowing of all three modes at for increasing , eventually leading to an almost even power distribution in the spectrum at 8 mA, as shown in Fig. 3(e).
In Fig. 4 we show the temperature dependence of the nonlinear damping of the AO system along with the threshold current and transition current . Fig. 4(a) shows the total power summed for all excitation modes as a function of obtained at various temperatures for . For each temperature, has two current regimes, ‘A’ for in which a single mode is dominant, and ‘B’ for in which mode-mode interaction is active amongst multiple excitation modes, separated by the kink in at which in the lowest frequency mode saturates. One of our remarkable findings is that total power for all temperatures in regime B falls onto a single common curve (black line in Fig. 4(a)), whereas total power in regime A is temperature dependent. This suggests that the mode-mode coupling occurs through a non-thermal process (Fig. 1(d)) originating from exchange or dipole interactions instead of the thermally excited magnon-mediated scattering (Fig. 1(c)). The rapid growth of (color lines in Fig. 4(a)) from each threshold current is eventually limited by (black line in Fig. 4(a)) at each corresponding transition current for all temperatures. This indicates that the much faster relaxation process arising from the temperature-independent mode-mode interactions in regime B predominates over the temperature dependent single mode relaxation process occurring in regime A. Note that magnon thermalization through redistribution within the dynamic magnetic system is possible only if the relaxation via nonlinear magnon scattering arising from mode coupling is much faster than the relaxation to the external non-magnetic systems in individual modes by intrinsic Gilbert damping or spin pumping.
In order to quantify the nonlinear damping of the AO system, we discuss the parameter that represents the change in positive nonlinear damping with increasing AO power, where is the Gilbert damping [39]. as well as can be obtained from the relationship between the normalized AO power and (see Appendix C). Fig. 4(b) and 4(c) show the temperature dependence of the AO parameters in the regimes A and B discussed above: temperature-dependent , , , and temperature-independent ,. The larger value of relative to observed in Fig. 4(b), indicates that the mode couplings in regime B cause additional nonlinear damping compared to regime A. In regime A where a single mode C1 is dominant, depends on temperature such that it is almost constant at K but increases for 125 K. This reflects the temperature dependence of the minimum linewidth and maximum power of C1 in Fig. 4(g) and 4(h) and the existence of another temperature-independent relaxation mechanism below 125 K for an individual AO mode. Also, as increases, both and decrease linearly, demonstrating that thermal fluctuation noise facilitates the generation and stabilization of the AO mode and of mode-mode coupling with the smaller such as
| (1) | ||||
| (2) |
where and are the intrinsic threshold and transition currents with thermal fluctuation excitation effects removed, and and are coefficients with respect to temperature change. The temperature dependence of the intrinsic threshold, , can be obtained from a separately measured spin torque FMR, where is estimated to be almost constant in the temperature range of 5 - 300 K (See Appendix E).
There are significant changes in the current evolution of the AO modes when changes from to as shown in Fig. 3(a) and 3(f). Edge-bulk combined modes (C1, C2, C3) at (see Fig. 2(e) and Fig. 3(a)-(e)) are spectrally and spatially separated into edge (E1, E2) and bulk (B1, B2, B3) modes at (see Fig. 2(d) and Fig. 3(f)-(j)). As a result, for the AO modes existing at (see Fig. 3(g)-(i)), the evolution of , , and of the AO modes with increasing are more complex than for : the E1 and E2 modes split at 7 mA, and there can be various mode-mode couplings with different strengths of dipolar and exchange interactions depending on the spatial distance between the two interacting modes (e.g., edge-edge, edge-bulk and bulk-bulk). This information can be valuable in developing strategies that employ spectral and spatial mode separation to reduce mode couplings and thus enhance the performance of auto-oscillators. We note that these mode couplings should be distinguishable from the nonlinear bullet mode dynamics. The power sum of E1 and E2 monotonically increases up to mA until it saturates creating a kink in as shown in Fig. 3(i). The temperature dependence of the AO parameters for shown in Fig. 4(e) and 4(f) is generally similar to that for , except for a further increased value, perhaps due to the increased number of intermode interaction routes allowed between a larger number of AO modes.
In conclusion, we observe the nonlinear damping transition of the auto-oscillation modes through the total power as a function of drive current, which coincides with the onset of power distribution amongst multiple modes and linewidth broadening of all individual modes. We find the nonlinear damping due to mode-mode coupling to be independent of temperature, which suggests that the mode coupling occurs through intermode interactions such as dipole and exchange interactions rather than thermally excited magnon mediated nonlinear scattering. This study of nonlinear damping due to mode couplings presents a promising pathway to overcome the current limitations of efficiently controlling mode interactions in spin Hall nano-oscillators to prevent mode crosstalk or inter-mode energy transfer and deepens understanding of complex nonlinear spin dynamics in multimode spin wave systems. As one solution, we can generate well-defined AO modes locally excited by the dipole field from a nano- or micron-scale permanent magnet [19], where the number of modes and their frequency distribution can be tuned by changing the local dipole field by moving a permanent magnet relative to the sample surface. Furthermore, the interaction between two spatially separated AOs can be controlled by adjusting the relative lateral distance in a scanned system [16, 17, 18, 19].
Acknowledgements.
We thank Denis V. Pelekhov for helpful discussions. This work was primarily supported by the Center for Emergent Materials, an NSF MRSEC, grant DMR-2011876.Appendix A Angle Dependence of auto-oscillation spectrum over extended angle range
Fig. 5 shows the dependence of the auto-oscillation spectrum on angle, similar to Fig. 2(a), but over an extended angular range: . At , the lowest frequency mode has the largest amplitude and shifts slightly towards lower frequencies as increases. The mode starts to split and its amplitude decreases above while the frequency shifts monotonically lower with increasing . On the other hand, the high frequency modes hardly shift with increasing , and at , one of them has the largest amplitude among all excited AO modes in the spectrum instead of the lowest frequency mode. Our micromagnetic simulations in the next section show that edge modes at low frequencies shift monotonically to lower frequencies, while bulk modes at high frequencies hardly shift; this characteristic behavior allows edge and bulk modes to be differentiated for .
Appendix B Micromagnetic Simulations
We perform micromagnetic simulations using MuMax3 [34] to understand complex AO spectra and identify their relevant spatial mode profiles. In simulations, the computational dimension 2.6 m 9 m 5 nm is subdivided into 5 nm 17.5 nm 5 nm cells. As magnetic parameters, we use the gyromagnetic ratio of 2.8 MHz/G and effective magnetization 6502 G obtained from the ST-FMR data (see Appendix D) measured at 0 via Kittel equation.
| (3) |
The standard values of exchange stiffness J/m and the Gilbert damping constant 0.01 for permalloy are used.
B.1 Linear Spin Wave Eigenmode
First, we perform micromagnetic simulations in the linear regime of magnetodynamics with no bias current. Initially, the magnetic system is excited by a sinc rf field with an amplitude of 10 mT and a cutoff frequency of 40 GHz. Then Gilbert damping is turned off by making , allowing the magnetic dynamic system to proceed freely for 187 ns. We obtain the spectral and spatial profiles of the modes by performing Fourier transform with dynamic motion after 62 ns to avoid initial transients [9].
Fig. 6(b)-(f) show the spatial profile of the linear spin wave eigenmodes corresponding to each spectral peak indicated by the number in Fig. 6(a) for each angle . The edge and bulk modes are combined for , whereas the edge and bulk modes are spatially and spectrally separated for due to the significant difference in the demagnetizing field between the edge and center regions. Edge modes at low frequencies shift monotonically to lower frequencies, and bulk modes at high frequencies shift little.
B.2 Self-Oscillatory Mode
The auto-oscillation mode of the system is obtained by solving the Landau-Lifshitz-Gilbert equation with an anti-damping spin torque applied to the active region of the AO device. In the simulations, we try two different current density distributions shown in Fig. 7 and Fig. 10 considered for a 1 mA bias current.
As an initial state in the simulation, the magnetic system is allowed to relax to a state close to the ground state. The anti-damping torque proportional to the current density in Fig. 7 and 10 scaled by the current value is activated at 0 ns. If this anti-damping torque is smaller than the Gilbert damping, the magnetization oscillations decay, whereas if the anti-damping torque is larger than the Gilbert damping, the magnetization oscillations grow until their amplitude saturates. We define a threshold current as that at which anti-damping is balanced with Gilbert damping, where the magnetization oscillates with a constant amplitude over time. The scale factor for the current in the simulations is chosen so that the threshold currents in the simulations are as close as possible to the threshold currents in the actual experimental data. The spectral and spatial profiles of the excitation modes are obtained by performing Fourier transforms of the time dependence of the magnetization dynamics.
B.2.1 Micromagnetic simulation using current density distribution calculated in COMSOL
Fig. 7 shows the current density distribution of the AO system for a 1 mA current calculated using COMSOL [40] and the Oersted field produced by it. These determine the anti-damping torque in micromagnetic simulations, and the corresponding results are shown in Fig. 8 and Fig. 9.
Figs. 8(a) and 8(b) show the evolution of power spectral density (PSD) with increasing bias current for and , respectively, and their representative linecuts are shown in Fig. 8(c) and 8(d), respectively. These simulation data show the key features of the experimental data in Fig. 3 of the main text, such as monotonic redshift of the resonant frequency, mode amplitude growing and mode amplitude saturation with increasing . In the simulation, the strong mode broadening starts at a relatively lower compared to the experimental data, so Fig. 8 shows the simulation result applicable only to the low current region of the experimental data Fig. 3. This indicates that the nonlinear magnonic effect occurring at high currents, which can cause stronger self-excitation of the AO mode with high coherence, seems to be lacking in the simulations. Since thermal effects play no role in the simulations, the mode broadening seen at high arises purely from dipole or exchange spin-spin interactions of dynamic magnetization occurring at relatively large cone angles. This directly demonstrates nonlinear damping due to mode couplings that occur via dipole or exchange interactions, supporting the main conclusion of the paper.
Fig. 9(a) shows the spectrum for various and Fig. 9(b)-(f) show the spatial eigenmode profiles corresponding to the spectral peaks indicated by the numbers in Fig. 9(a). Most of the AO modes excited by the anti-damping torque are edge modes that shift only to lower frequencies with increasing , while the barely shifted bulk modes shown in the linear spin wave modes in Fig. 6 are mostly suppressed. Compared with the spatial mode profiles of the linear spin wave modes in Fig. 6, the edge modes in this simulation seems to be selectively excited and evolved from the linear spin wave modes by the inhomogeneous current density distribution.
B.2.2 Micromagnetic simulation using current density distribution of 2D Gaussian model
In order to test the effect of the inhomogeneous current density distribution on the excitation of the AO modes in the simulation, we try a micromagnetic simulation using the different current density distribution in Fig. 10(a), where the current density has a 2D Gaussian distribution with a maximum at the center and a broader distribution as function of position in the device compared to Fig. 7(a), and . Indeed, the spectral shapes in this simulation are considerably different as shown in Fig. 2(b) of the main text and Fig. 11(c) and 11(d). In contrast to Fig. 9, bulk modes excited around the central region are unsuppressed for and and can have larger mode amplitudes than edge modes, as shown in Fig. 2. These bulk modes exhibit improved agreement with experimentally observed AO modes, in particular small frequency shift with increasing as shown in Fig. 2(a) and Fig. 5. Also, the overall spectral shapes associated with the number of the excited AO modes, their relative frequencies and amplitudes, their frequency shift behaviors for varying in Fig. 2(b) better match the experimental data in Fig. 2(a) compared to the other AO simulations in Fig. 6(a) and Fig. 9(a). Therefore, we conclude that the actual current density distribution is closer to the 2D Gaussian function in Fig. 10 than that calculated using COMSOL in Fig. 7. We note that unidentified structural defects around the edges of the AO active region of the sample can significantly alter the spectral shapes, especially for and , where the mode constriction effect is stronger.
This conclusion is further supported by the evolution of the power spectral density (PSD) with increasing bias current for and shown in Fig. 11(a) and 11(b), respectively. In Fig. 11(a) and 11(c) for , the edge mode at the lowest frequency has the largest amplitude at any whereas in Fig. 11(b) and 11(d) for , the bulk mode at 5.6 GHz grows with increasing and eventually has the larger amplitude than any edge modes located at the lower frequencies at high , which agrees well with our experimental data in Fig. 3.
Appendix C Quantifying Nonlinear Damping with the Coefficient
The nonlinear single-mode auto-oscillator can be described with a universal oscillator model, another form of the Landau-Lifshitz equation, derived by Slavin and Tiberkevich [39],
| (4) |
where is the complex dimensionless dynamic magnetization amplitude, is the oscillation power, is the power-dependent nonlinear frequency,
| (5) | ||||
| (6) |
are the positive and negative damping constant, respectively, is the thermal fluctuation noise, is the Gilbert damping, is the nonlinear damping coefficient, is the spin-current efficiency, and is the drive current. On the left side of Eq. (4), the second term describes precession, the third term describes damping, and the fourth term describes anti-damping. Note that , , and are auto-oscillation power dependent.
.
In order to describe the nonlinear damping of the multimode AO system in a simple and quantitative way, we calculate from the relationship with , where for ,
| (7) |
for ,
| (8) |
In these expressions, is the power conversion factor for the normalized , , is the threshold current, is the effective noise power, , and [39]. Note that the Slavin-Tiberkevich model was originally intended to describe single-mode auto-oscillators, so in the multimode excitation regime of is an “effective”nonlinear damping parameter of the entire AO system. We also obtain in Eq. (7) along with other AO parameters presented in Fig. 4 by fitting, but Fig. 12 reveals no credible temperature dependence to .
Appendix D Spin Torque Ferromagnetic Resonance
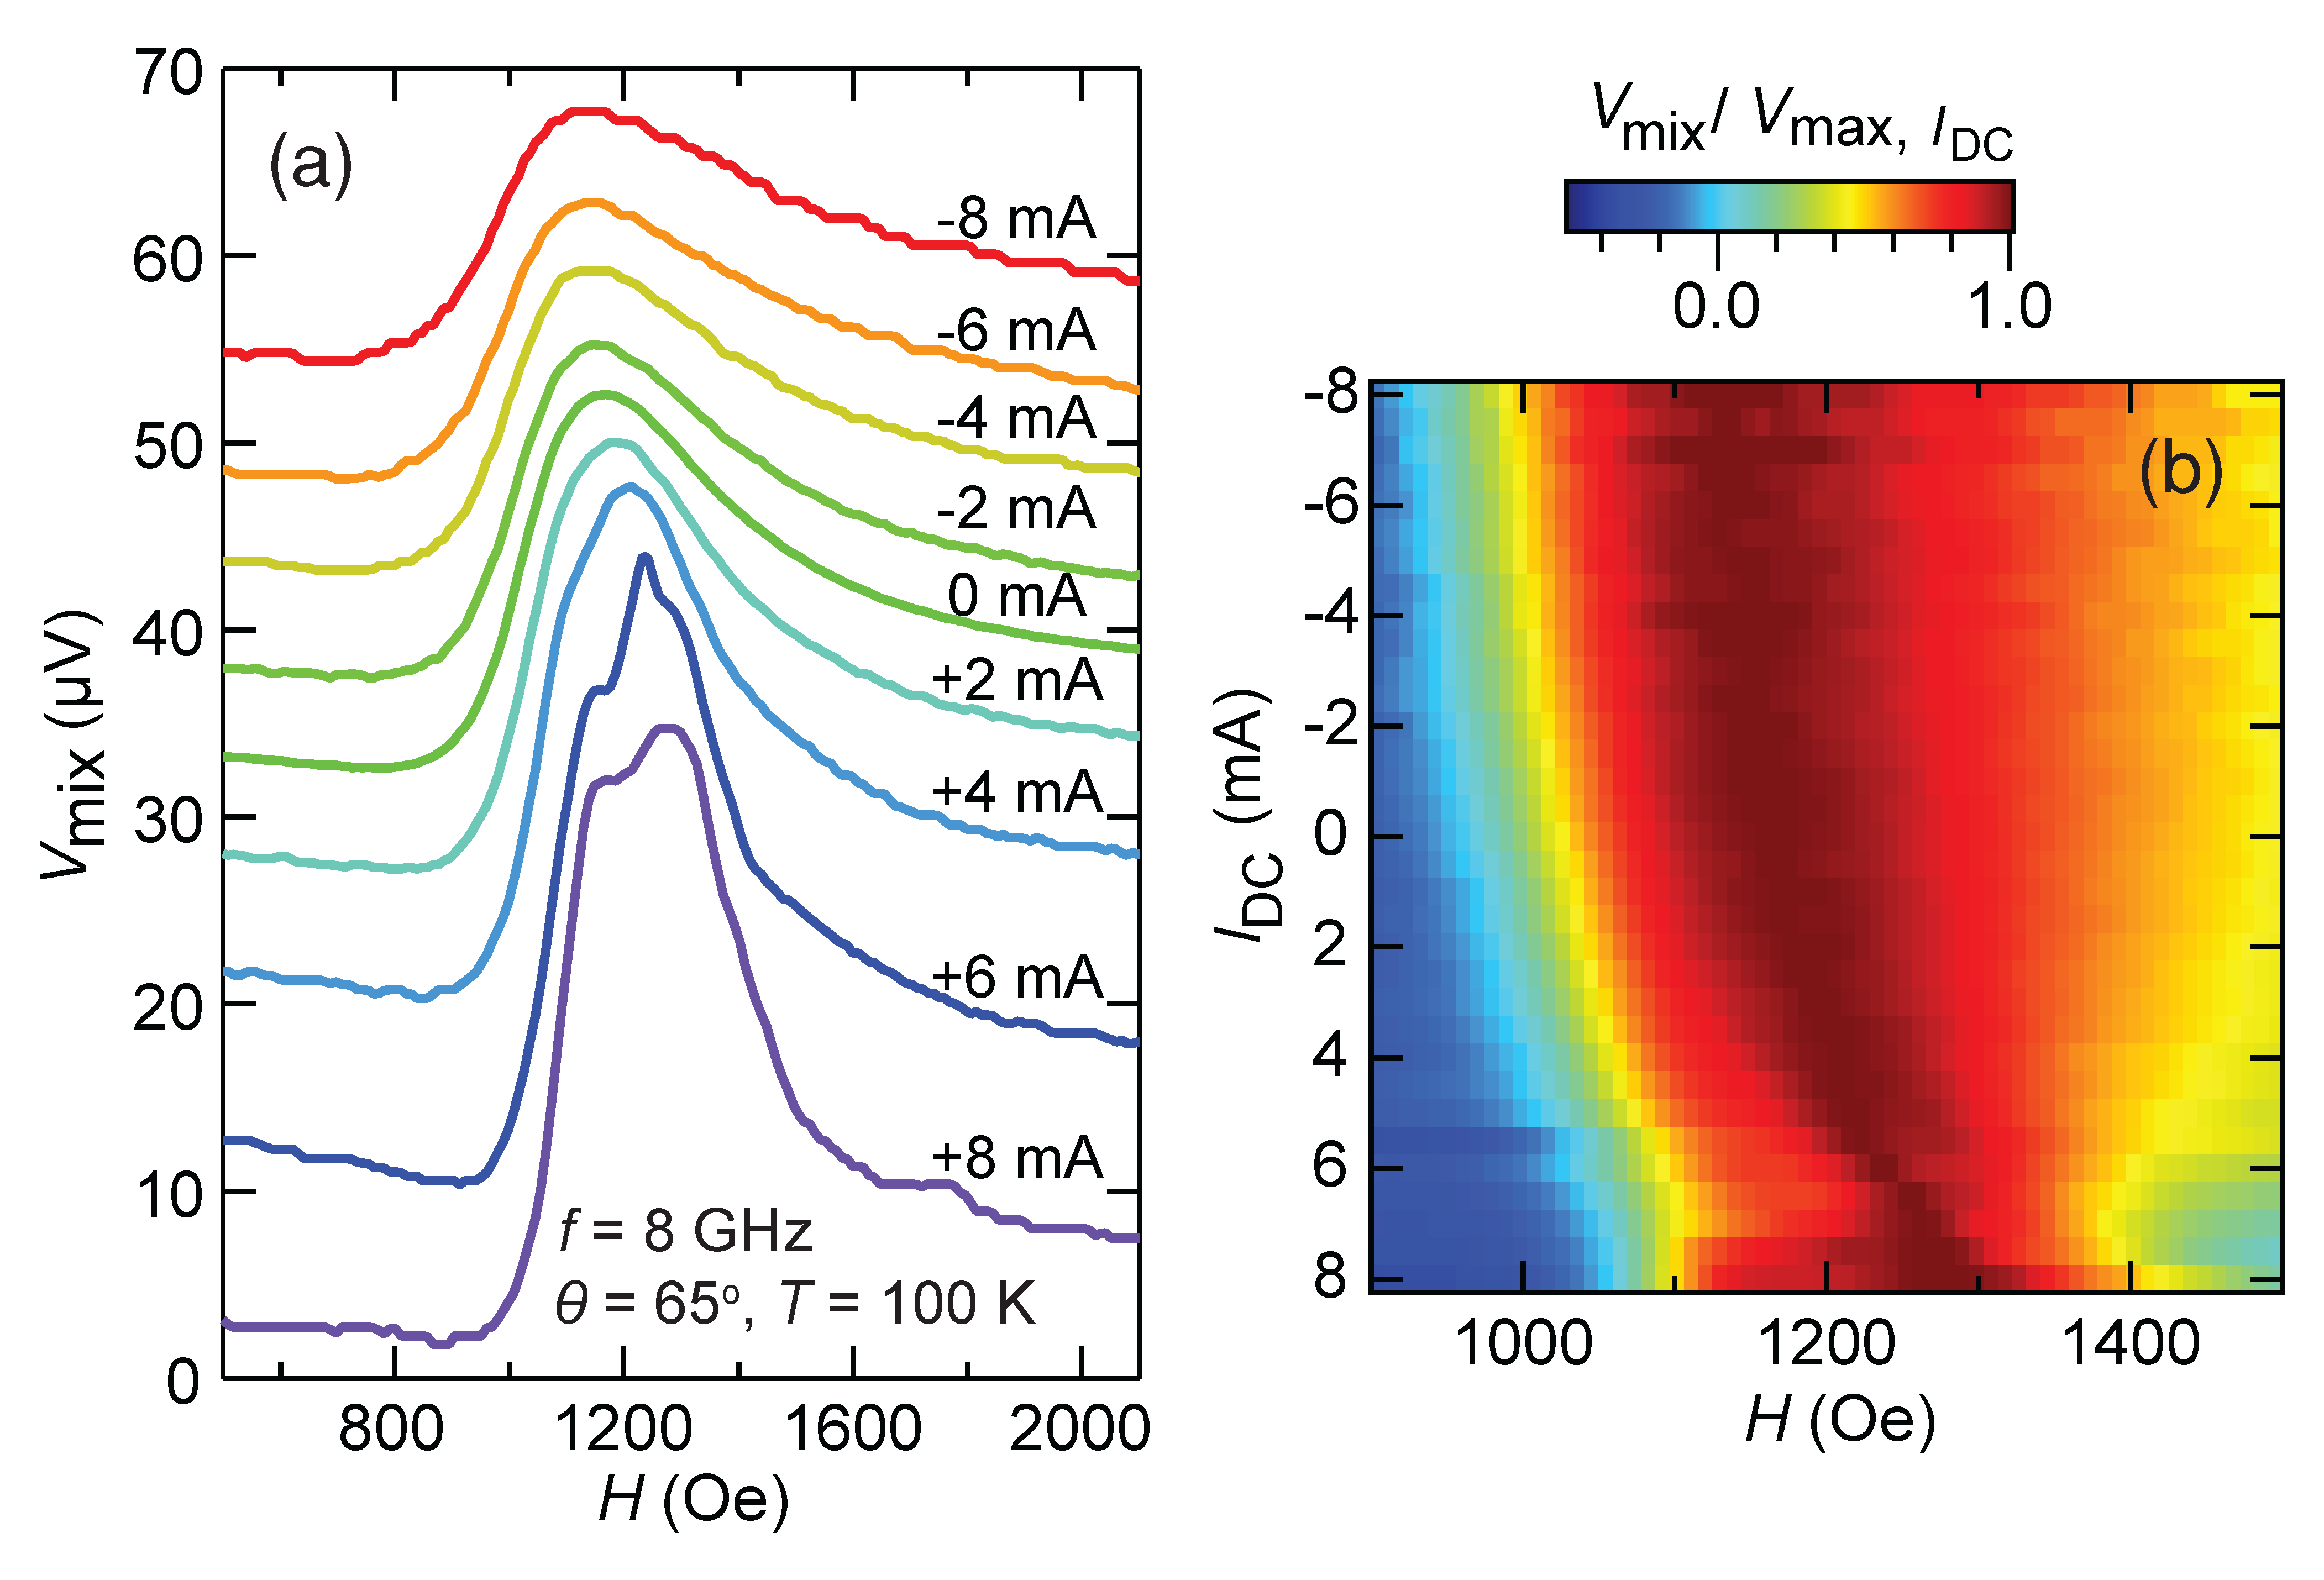
Fig. 13 (a) shows a typical spin torque ferromagnetic resonance (ST-FMR) spectrum measured at various DC currents ranging from -8 mA to 8 mA. As the absolute value of increases, the ST-FMR peak broadens due to the enhanced damping, while as increases, the mode becomes narrower due to anti-damping and eventually splits into a couple of modes. In order to see the overall shift of the ST-FMR peak, we normalize the signal to the maximum at each , which is shown in Fig. 13 (b). With increasing , the ST-FMR peak shifts to the higher field because as the amplitudes of self-localized AO modes grow, the static magnetization decreases. On the other hand, as the absolute value of increases up to -8 mA, the ST-FMR peak shifts monotonically to the lower field and does not show a shift to the higher field that might occur due to the decrease in saturation magnetization by Joule heating. This means that even at mA regardless of its sign, our device’s magnetic system has not reached the current regime where the saturation magnetization decreases by Joule heating [37]. This provides crucial evidence that the contribution of Joule heating to the nonlinear damping of the AO system described in the main text is not significant at high up to 8 mA.
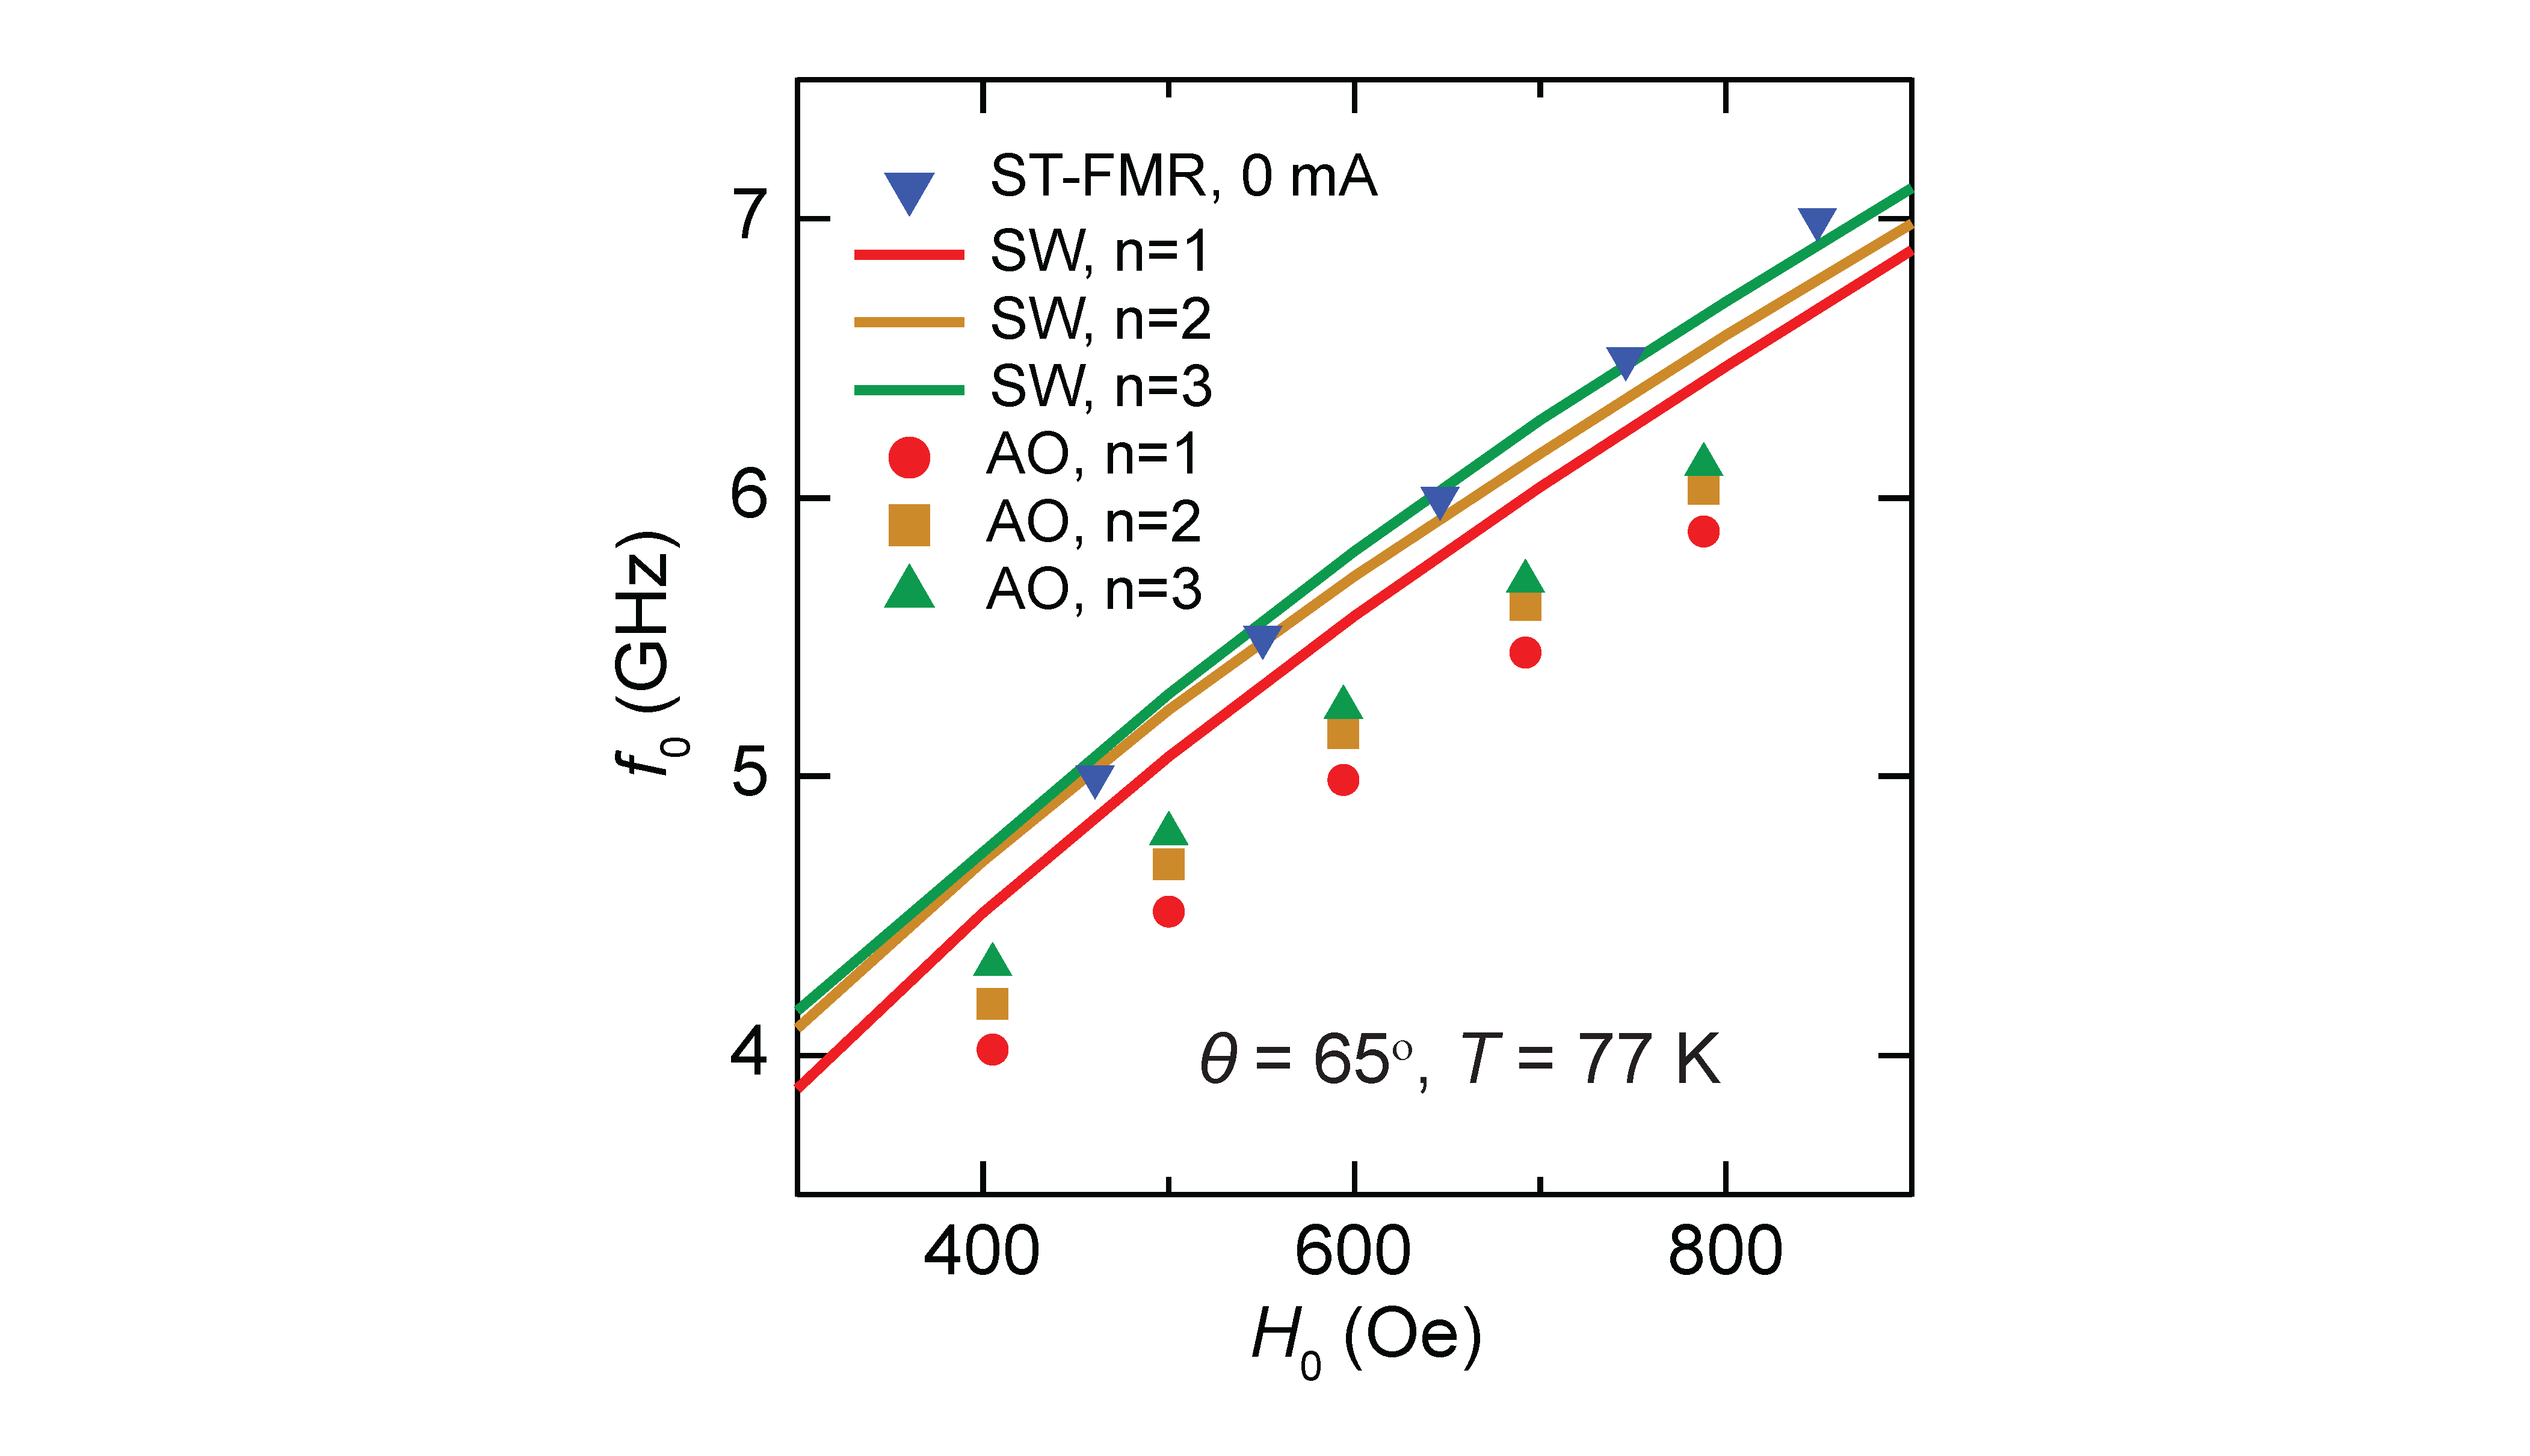
Fig. 14 shows the resonance frequency of the auto-oscillation as a function of the applied magnetic field compared to the linear spin wave eigenmode frequency and the resonance frequency of ST-FMR at mA. The AO mode appears below the corresponding linear spin wave mode with the discrepancy of 0.5 GHz due to two contributions: One by 0.2 GHz is the reduction of static magnetization due to increased cone angle shown in Fig. 3(b) and 3(g), and the other by 0.3 GHz is the frequency jump of the AO mode from the linear spin wave mode frequency occurring near the onset . The latter has been observed as the signature of the bullet mode in self-localization [1, 3, 35].
Appendix E Temperature dependence of the intrinsic threshold current
The threshold current we obtain from measurement of the AO power has two contributions as expressed in Eq. (1) of the main text: i) that due to thermal fluctuation, , and ii) an intrinsic threshold current arising from the anti-damping torque due to the applied spin current. Here we estimate the temperature dependence of the intrinsic threshold current from the ST-FMR data. According to the Slavin-Tiberkevich theory described in Appendix C, the intrinsic arising from the spin Hall effect is given by
| (9) |
The spin-current efficiency is proportional to the temperature-dependent in our AO system [41].
| (10) |
From Eq. (9) and (10), the intrinsic threshold is given as
| (11) |
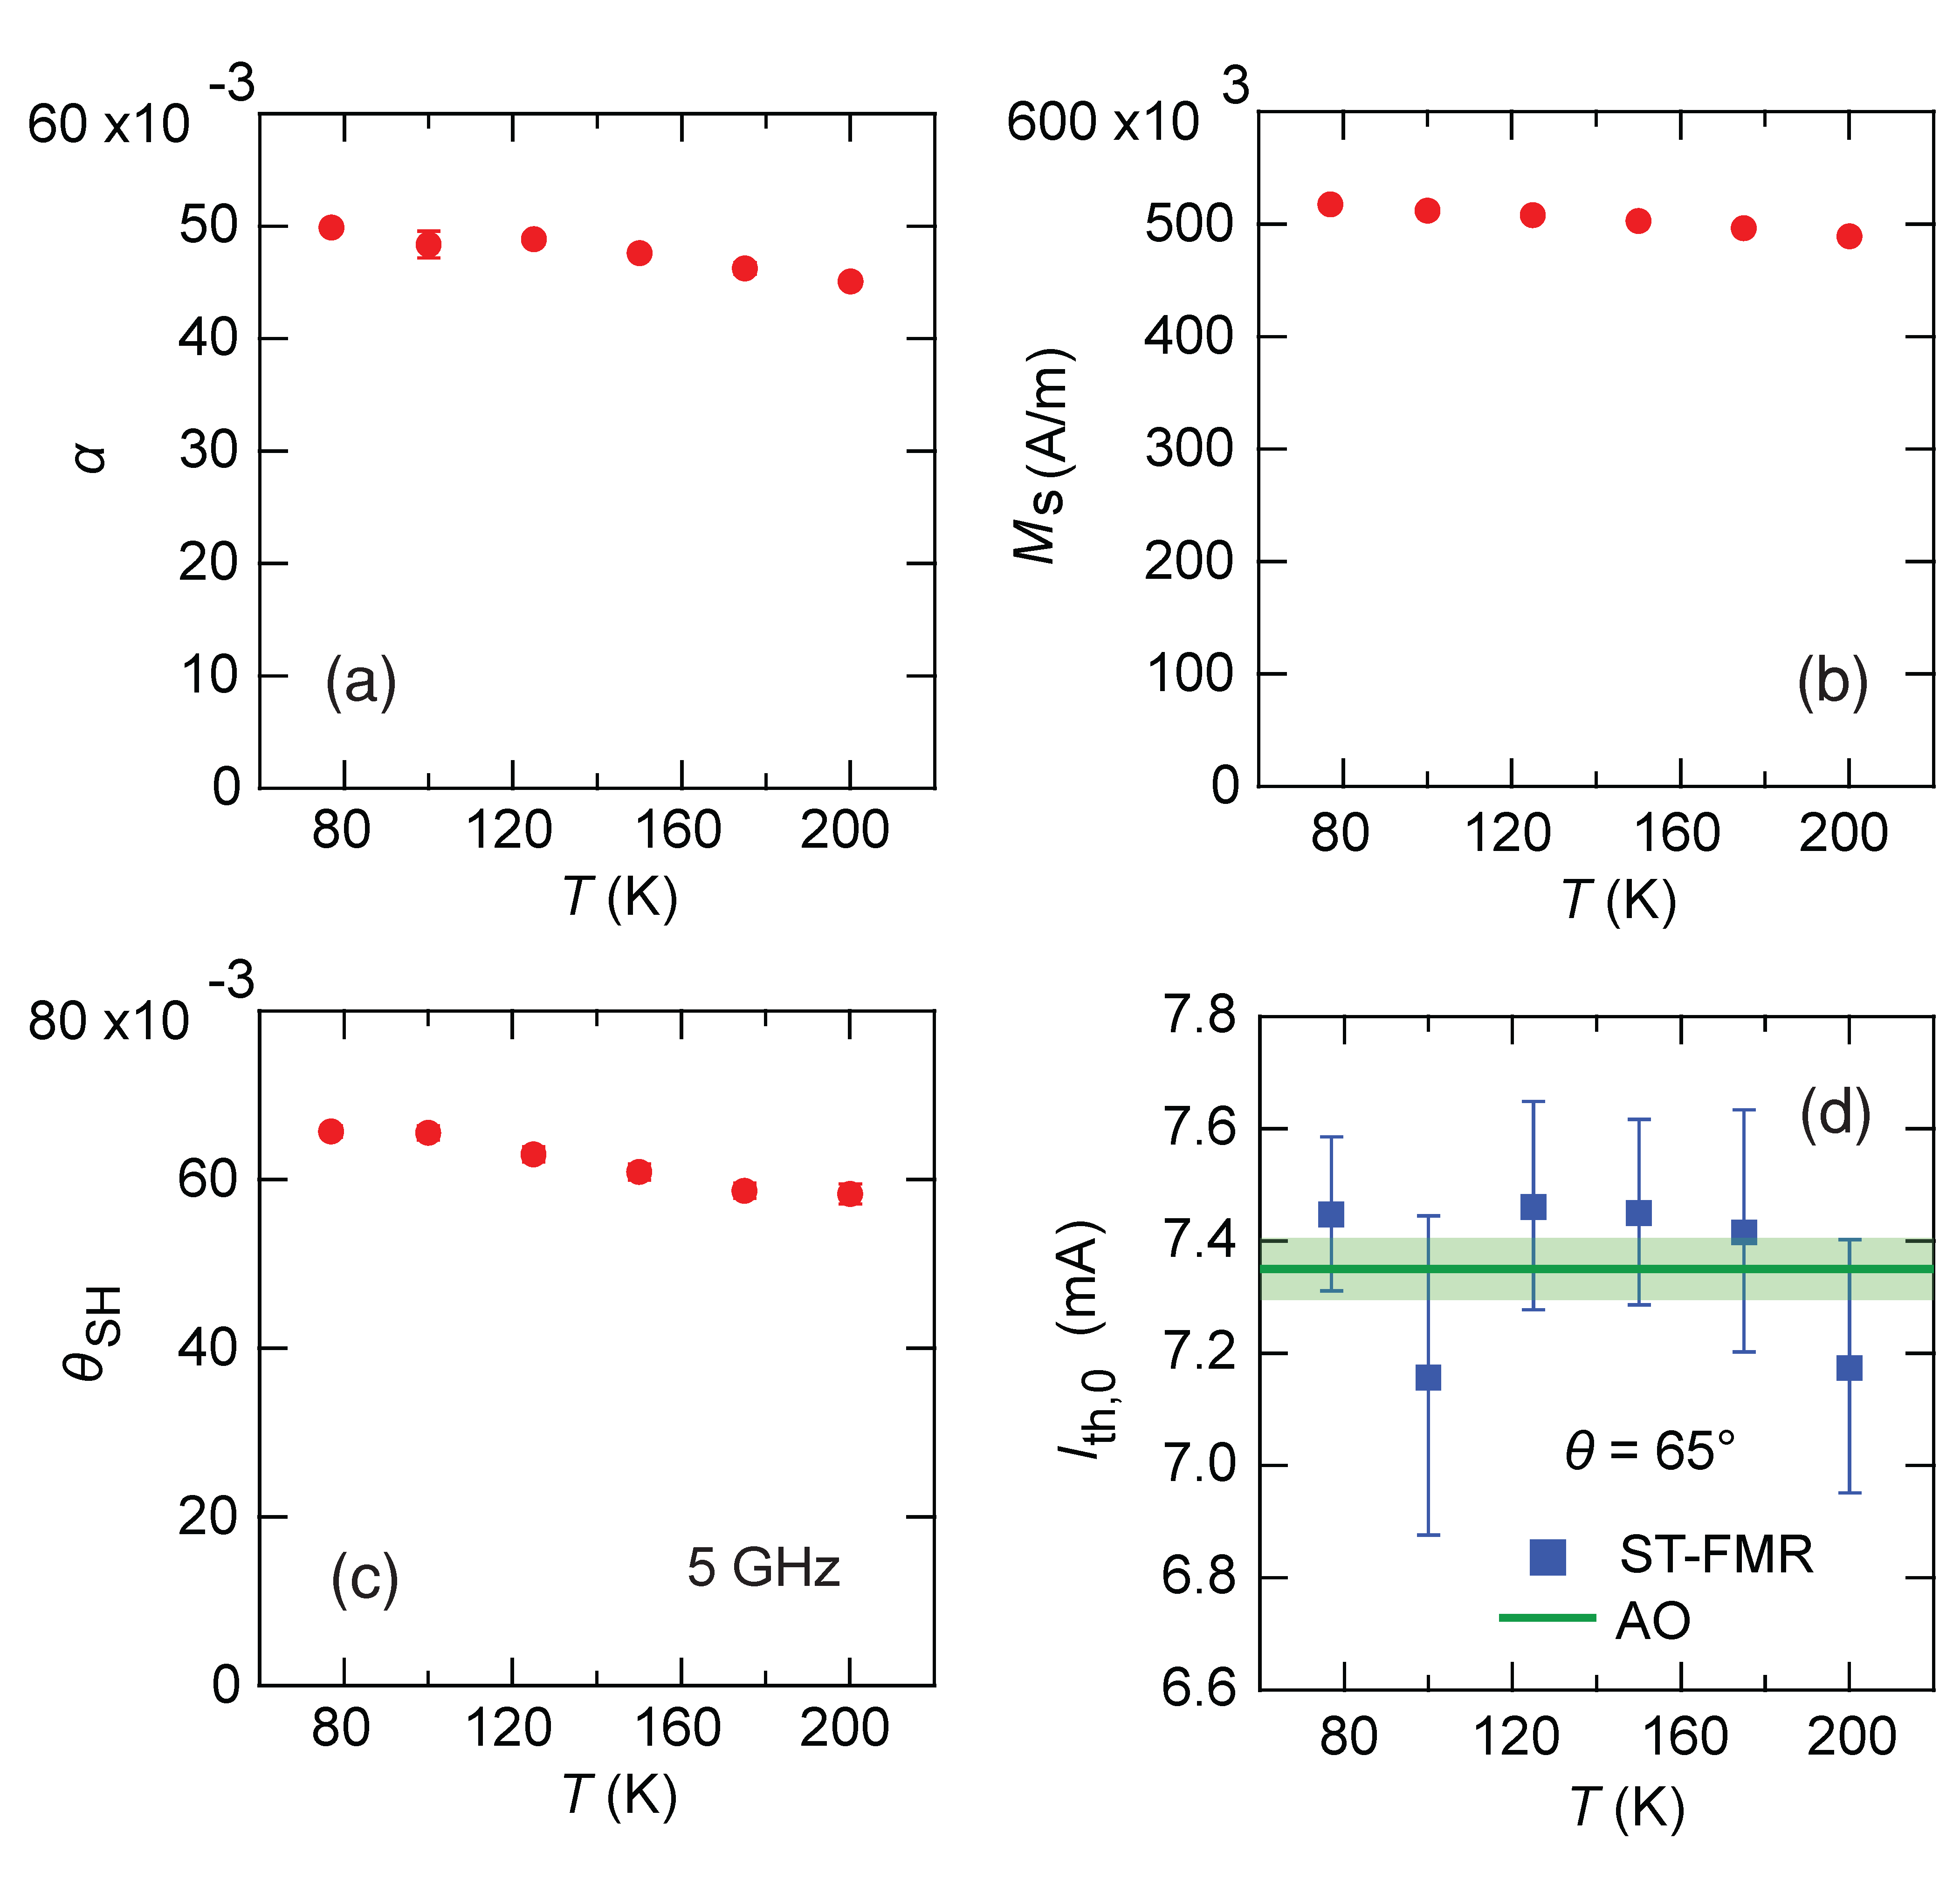
where is a temperature independent constant. has been found to be temperature independent with a value of 0.068 for 13 - 300 K [42], and for Py film with same thickness 5 nm is also almost constant in the temperature range of 5 - 300 K regardless of capping materials even though there is a slight temperature dependence of surface damping around 50 K [43]. Also, can be considered to be almost constant at . Therefore, can be taken to be almost constant for varying temperature. Based on this, we express determined from our AO power in Fig. 4 as a simple sum of the temperature independent and additional thermal fluctuation contribution linearly decreasing with temperature as Eq. (1) in the main text. We also measured almost constant , , and from the ST-FMR in the temperature range of 77 - 200 K as shown in Fig. 15 (a)-(c), and Fig. 15(d) shows our estimated temperature dependence of intrinsic threshold , which is almost constant over the temperature within our estimation uncertainty.
References
- Demidov et al. [2012] V. E. Demidov, S. Urazhdin, H. Ulrichs, V. Tiberkevich, A. Slavin, D. Baither, G. Schmitz, and S. O. Demokritov, Magnetic nano-oscillator driven by pure spin current, Nature Materials 11, 1028 (2012).
- Liu et al. [2013] R. H. Liu, W. L. Lim, and S. Urazhdin, Spectral characteristics of the microwave emission by the spin hall nano-oscillator, Phys. Rev. Lett. 110, 147601 (2013).
- Demidov et al. [2014] V. E. Demidov, S. Urazhdin, A. Zholud, A. V. Sadovnikov, and S. O. Demokritov, Nanoconstriction-based spin-hall nano-oscillator, Applied Physics Letters 105, 172410 (2014), https://doi.org/10.1063/1.4901027 .
- Duan et al. [2014] Z. Duan, A. Smith, L. Yang, B. Youngblood, J. Lindner, V. E. Demidov, S. O. Demokritov, and I. N. Krivorotov, Nanowire spin torque oscillator driven by spin orbit torques, Nature Communications 5, 5616 (2014).
- Yang et al. [2015] L. Yang, R. Verba, V. Tiberkevich, T. Schneider, A. Smith, Z. Duan, B. Youngblood, K. Lenz, J. Lindner, A. N. Slavin, and I. N. Krivorotov, Reduction of phase noise in nanowire spin orbit torque oscillators, Scientific Reports 5, 16942 (2015).
- Collet et al. [2016] M. Collet, X. de Milly, O. d’Allivy Kelly, V. V. Naletov, R. Bernard, P. Bortolotti, J. Ben Youssef, V. E. Demidov, S. O. Demokritov, J. L. Prieto, M. Munoz, V. Cros, A. Anane, G. de Loubens, and O. Klein, Generation of coherent spin-wave modes in yttrium iron garnet microdiscs by spin-orbit torque, Nature Communications 7, 10377 (2016).
- Mazraati et al. [2016] H. Mazraati, S. Chung, A. Houshang, M. Dvornik, L. Piazza, F. Qejvanaj, S. Jiang, T. Q. Le, J. Weissenrieder, and J. Åkerman, Low operational current spin hall nano-oscillators based on nife/w bilayers, Applied Physics Letters 109, 242402 (2016), https://doi.org/10.1063/1.4971828 .
- Awad et al. [2017] A. A. Awad, P. Durrenfeld, A. Houshang, M. Dvornik, E. Iacocca, R. K. Dumas, and J. Åkerman, Long-range mutual synchronization of spin Hall nano-oscillators, Nature Physics 13, 292 (2017).
- Dvornik et al. [2018] M. Dvornik, A. A. Awad, and J. Åkerman, Origin of magnetization auto-oscillations in constriction-based spin hall nano-oscillators, Phys. Rev. Applied 9, 014017 (2018).
- Mazraati et al. [2018] H. Mazraati, S. R. Etesami, S. A. H. Banuazizi, S. Chung, A. Houshang, A. A. Awad, M. Dvornik, and J. Åkerman, Auto-oscillating spin-wave modes of constriction-based spin hall nano-oscillators in weak in-plane fields, Phys. Rev. Applied 10, 054017 (2018).
- Fulara et al. [2019] H. Fulara, M. Zahedinejad, R. Khymyn, A. A. Awad, S. Muralidhar, M. Dvornik, and J. Åkerman, Spin-orbit torque–driven propagating spin waves, Science Advances 5, 10.1126/sciadv.aax8467 (2019), https://advances.sciencemag.org/content/5/9/eaax8467.full.pdf .
- Haidar et al. [2019] M. Haidar, A. A. Awad, M. Dvornik, R. Khymyn, A. Houshang, and J. Åkerman, A single layer spin-orbit torque nano-oscillator, Nature Communications 10, 2362 (2019).
- Safranski et al. [2019] C. Safranski, E. A. Montoya, and I. N. Krivorotov, Spin-orbit torque driven by a planar Hall current, Nature Nanotechnology 14, 27 (2019).
- Zahedinejad et al. [2020] M. Zahedinejad, A. A. Awad, S. Muralidhar, R. Khymyn, H. Fulara, H. Mazraati, M. Dvornik, and J. Åkerman, Two-dimensional mutually synchronized spin Hall nano-oscillator arrays for neuromorphic computing, Nature Nanotechnology 15, 47 (2020).
- Verba et al. [2020] R. V. Verba, V. S. Tiberkevich, and A. N. Slavin, Dipole-dominated dissipative magnetic solitons in quasi-one-dimensional spin-torque oscillators, Low Temperature Physics 46, 773 (2020), https://doi.org/10.1063/10.0001539 .
- Lee et al. [2010] I. Lee, Y. Obukhov, G. Xiang, A. Hauser, F. Yang, P. Banerjee, D. V. Pelekhov, and P. C. Hammel, Nanoscale scanning probe ferromagnetic resonance imaging using localized modes, Nature 466, 845 (2010).
- Lee et al. [2011] I. Lee, Y. Obukhov, A. J. Hauser, F. Y. Yang, D. V. Pelekhov, and P. C. Hammel, Nanoscale confined mode ferromagnetic resonance imaging of an individual ni81fe19 disk using magnetic resonance force microscopy (invited), Journal of Applied Physics 109, 07D313 (2011), https://doi.org/10.1063/1.3536821 .
- Zhang et al. [2017a] C. Zhang, Y. Pu, S. A. Manuilov, S. P. White, M. R. Page, E. C. Blomberg, D. V. Pelekhov, and P. C. Hammel, Engineering the spectrum of dipole field-localized spin-wave modes to enable spin-torque antidamping, Phys. Rev. Applied 7, 054019 (2017a).
- Zhang et al. [2021] C. Zhang, I. Lee, Y. Pu, S. A. Manuilov, D. V. Pelekhov, and P. C. Hammel, Spin-Orbit Torque Nano-oscillators by Dipole-Field-Localized Spin Wave Modes, Nano Letters 21, 10208 (2021), pMID: 34870431, https://doi.org/10.1021/acs.nanolett.1c03075 .
- Bonetti et al. [2010] S. Bonetti, V. Tiberkevich, G. Consolo, G. Finocchio, P. Muduli, F. Mancoff, A. Slavin, and J. Åkerman, Experimental evidence of self-localized and propagating spin wave modes in obliquely magnetized current-driven nanocontacts, Phys. Rev. Lett. 105, 217204 (2010).
- Muduli et al. [2012a] P. K. Muduli, O. G. Heinonen, and J. Åkerman, Decoherence and mode hopping in a magnetic tunnel junction based spin torque oscillator, Phys. Rev. Lett. 108, 207203 (2012a).
- Muduli et al. [2012b] P. K. Muduli, O. G. Heinonen, and J. Åkerman, Temperature dependence of linewidth in nanocontact based spin torque oscillators: Effect of multiple oscillatory modes, Phys. Rev. B 86, 174408 (2012b).
- Bonetti et al. [2012] S. Bonetti, V. Puliafito, G. Consolo, V. S. Tiberkevich, A. N. Slavin, and J. Åkerman, Power and linewidth of propagating and localized modes in nanocontact spin-torque oscillators, Phys. Rev. B 85, 174427 (2012).
- Heinonen et al. [2013] O. G. Heinonen, P. K. Muduli, E. Iacocca, and J. Akerman, Decoherence, mode hopping, and mode coupling in spin torque oscillators, IEEE Transactions on Magnetics 49, 4398 (2013).
- Iacocca et al. [2014] E. Iacocca, O. Heinonen, P. K. Muduli, and J. Åkerman, Generation linewidth of mode-hopping spin torque oscillators, Phys. Rev. B 89, 054402 (2014).
- Zhang et al. [2016] S. S.-L. Zhang, Y. Zhou, D. Li, and O. Heinonen, Mode coupling in spin torque oscillators, Journal of Magnetism and Magnetic Materials 414, 227 (2016).
- Sankey et al. [2005] J. C. Sankey, I. N. Krivorotov, S. I. Kiselev, P. M. Braganca, N. C. Emley, R. A. Buhrman, and D. C. Ralph, Mechanisms limiting the coherence time of spontaneous magnetic oscillations driven by dc spin-polarized currents, Phys. Rev. B 72, 224427 (2005).
- Dumas et al. [2013] R. K. Dumas, E. Iacocca, S. Bonetti, S. R. Sani, S. M. Mohseni, A. Eklund, J. Persson, O. Heinonen, and J. Åkerman, Spin-wave-mode coexistence on the nanoscale: A consequence of the oersted-field-induced asymmetric energy landscape, Phys. Rev. Lett. 110, 257202 (2013).
- Iacocca et al. [2015] E. Iacocca, P. Dürrenfeld, O. Heinonen, J. Åkerman, and R. K. Dumas, Mode-coupling mechanisms in nanocontact spin-torque oscillators, Phys. Rev. B 91, 104405 (2015).
- Barsukov et al. [2019] I. Barsukov, H. K. Lee, A. A. Jara, Y.-J. Chen, A. M. Goncalves, C. Sha, J. A. Katine, R. E. Arias, B. A. Ivanov, and I. N. Krivorotov, Giant nonlinear damping in nanoscale ferromagnets, Science Advances 5, eaav6943 (2019).
- Etesamirad et al. [2021] A. Etesamirad, R. Rodriguez, J. Bocanegra, R. Verba, J. Katine, I. N. Krivorotov, V. Tyberkevych, B. Ivanov, and I. Barsukov, Controlling magnon interaction by a nanoscale switch, ACS Applied Materials & Interfaces 13, 20288 (2021).
- de Aguiar et al. [2007] F. M. de Aguiar, A. Azevedo, and S. M. Rezende, Theory of a two-mode spin torque nanooscillator, Phys. Rev. B 75, 132404 (2007).
- Zhang et al. [2017b] S. S.-L. Zhang, E. Iacocca, and O. Heinonen, Tunable mode coupling in nanocontact spin-torque oscillators, Phys. Rev. Applied 8, 014034 (2017b).
- Vansteenkiste et al. [2014] A. Vansteenkiste, J. Leliaert, M. Dvornik, M. Helsen, F. Garcia-Sanchez, and B. Van Waeyenberge, The design and verification of mumax3, AIP Advances 4, 107133 (2014), https://doi.org/10.1063/1.4899186 .
- Slavin and Tiberkevich [2005] A. Slavin and V. Tiberkevich, Spin wave mode excited by spin-polarized current in a magnetic nanocontact is a standing self-localized wave bullet, Phys. Rev. Lett. 95, 237201 (2005).
- Wagner et al. [2018] K. Wagner, A. Smith, T. Hache, J.-R. Chen, L. Yang, E. Montoya, K. Schultheiss, J. Lindner, J. Fassbender, I. Krivorotov, and H. Schultheiss, Injection locking of multiple auto-oscillation modes in a tapered nanowire spin hall oscillator, Scientific Reports 8, 16040 (2018).
- Demidov et al. [2011] V. E. Demidov, S. Urazhdin, E. R. J. Edwards, M. D. Stiles, R. D. McMichael, and S. O. Demokritov, Control of magnetic fluctuations by spin current, Phys. Rev. Lett. 107, 107204 (2011).
- Jungfleisch et al. [2015] M. B. Jungfleisch, A. V. Chumak, A. Kehlberger, V. Lauer, D. H. Kim, M. C. Onbasli, C. A. Ross, M. Kläui, and B. Hillebrands, Thickness and power dependence of the spin-pumping effect in /pt heterostructures measured by the inverse spin hall effect, Phys. Rev. B 91, 134407 (2015).
- Slavin and Tiberkevich [2009] A. Slavin and V. Tiberkevich, Nonlinear auto-oscillator theory of microwave generation by spin-polarized current, IEEE Transactions on Magnetics 45, 1875 (2009).
- Inc. [2019] C. Inc., Comsol (2019).
- Liu et al. [2011] L. Liu, T. Moriyama, D. C. Ralph, and R. A. Buhrman, Spin-torque ferromagnetic resonance induced by the spin hall effect, Phys. Rev. Lett. 106, 036601 (2011).
- Wang et al. [2014] Y. Wang, P. Deorani, X. Qiu, J. H. Kwon, and H. Yang, Determination of intrinsic spin hall angle in pt, Applied Physics Letters 105, 152412 (2014), https://doi.org/10.1063/1.4898593 .
- Zhao et al. [2016] Y. Zhao, Q. Song, S.-H. Yang, T. Su, W. Yuan, S. S. P. Parkin, J. Shi, and W. Han, Experimental investigation of temperature-dependent gilbert damping in permalloy thin films, Scientific Reports 6, 22890 (2016).