[1]The University of Texas at Austin, Department of Physics, Austin, Texas 78712-1081, USA. \affil[2]The Helmholtz-Zentrum Dresden-Rossendorf, Institute for Radiation Physics, 01328 Dresden, Germany \corresp[cor1]downer@physics.utexas.edu
Nonlinear Inverse Compton Scattering from a Laser Wakefield Accelerator and Plasma Mirror
Abstract
We generate inverse Compton scattered X-rays in both linear and nonlinear regimes with a 250 MeV laser wakefield electron accelerator and plasma mirror by retro-reflecting the unused drive laser light to scatter from the accelerated electrons. We characterize the X-rays using a CsI(Tl) voxelated scintillator that measures their total energy and divergence as a function of plasma mirror distance from the accelerator exit. At each plasma mirror position, these X-ray properties are correlated with the measured fluence and inferred intensity of the laser pulse after driving the accelerator to determine the laser strength parameter . The results show that ICS X-rays are generated at ranging from to , and exceed the strength of co-propagating bremsstrahlung and betatron X-rays at least ten-fold throughout this range of .
1 INTRODUCTION
The discovery and development of X-ray sources has spurred progress over the last 100 years in material science Jaeschke et al. (2016), geology Ketcham and Carlson (2001), industry Hanke, Fuchs, and Uhlmann (2008), diagnostic medicine Lewis (1997); Suortti and Thomlinson (2003), high-Z radiography Chen, Bennett, and Perticone (2007) and probing warm dense matter (WDM) Falk et al. (2014). Many such X-ray sources require meter- to kilometer-scale radio frequency (RF) accelerators to generate synchrotron or bremsstrahlung radiation. Laser plasma accelerators (LPAs) Tajima and Dawson (1979); Esarey, Schroeder, and Leemans (2009) offer a compact alternative, capable of accelerating electrons up to MeV energies over millimeters or GeV energies over centimeters Wang et al. (2013); Gonsalves et al. (2019) with narrow bandwidth (1-15%) and 100s of pC of charge Couperus et al. (2017); Götzfried et al. (2020). When the accelerated electrons scatter from a counter-propagating laser pulse, they transfer energy to the photons via inverse Compton scattering (ICS) Corde et al. (2013). The laser strength parameter plays a significant role in X-ray generation via ICS and defines the scattering regime. For , the emitted radiation is narrowband and peaks at where is the electron Lorentz factor and is the energy of the scattering laser photons. As approaches 1 the scattering becomes relativistic as the laser imparts significant momentum to the electrons, resulting in high flux and broadband X-rays Corde et al. (2013); Krämer et al. (2018); Khrennikov et al. (2015). Such tabletop LPA-based ICS sources, or “all-optical undulators”, can generate hard X-ray pulses comparable in peak brilliance to those from large-scale synchrotrons Corde et al. (2013).
There are two methods for generating ICS X-ray beams from a compact LPA. The first method uses two separate laser pulses; the first drives the accelerator while the second, split from the drive pulse before acceleration, scatters nearly head-on with the accelerated electron bunch. The secondary pulse can reach when focused tightly with low f/# optics to the collision point Yan et al. (2017); Cole et al. (2018); Sarri et al. (2014), but is difficult to align and borrows energy from the LPA drive pulse. The second method for generating ICS uses a single laser pulse that first drives the LPA and then reflects from a plasma mirror (PM) to scatter from the trailing relativistic electrons Ta Phuoc et al. (2012); Tsai et al. (2015). Because the LPA drive pulse leads the electrons by no more than tens of microns the reflected pulse is automatically overlapped with the electrons. This ”self-aligning” feature makes ICS highly reproducible, ideal for use as an electron beam diagnostic Krämer et al. (2018) or an experimental probe without requiring an additional laser pulse or reducing the drive laser energy. It is therefore the method of choice for smaller LPA laboratories with limited available laser power and funds. However, the properties of ICS X-rays generated in this way have not been systematically characterized. In particular, the ability of this method to reach the important relativistic ICS regime () has not previously been demonstrated.
Here, we characterize an ICS X-ray source based on a 250 MeV laser wakefield electron accelerator and a plasma mirror in both linear and nonlinear scattering regimes. The laser fluence is measured after driving the LPA and the radiative properties of the ICS source are characterized with a compact scintillating detector. We demonstrate that the scattering regime can be easily tuned by changing the placement of the PM relative to the gas jet.
1.1 PROCEDURE
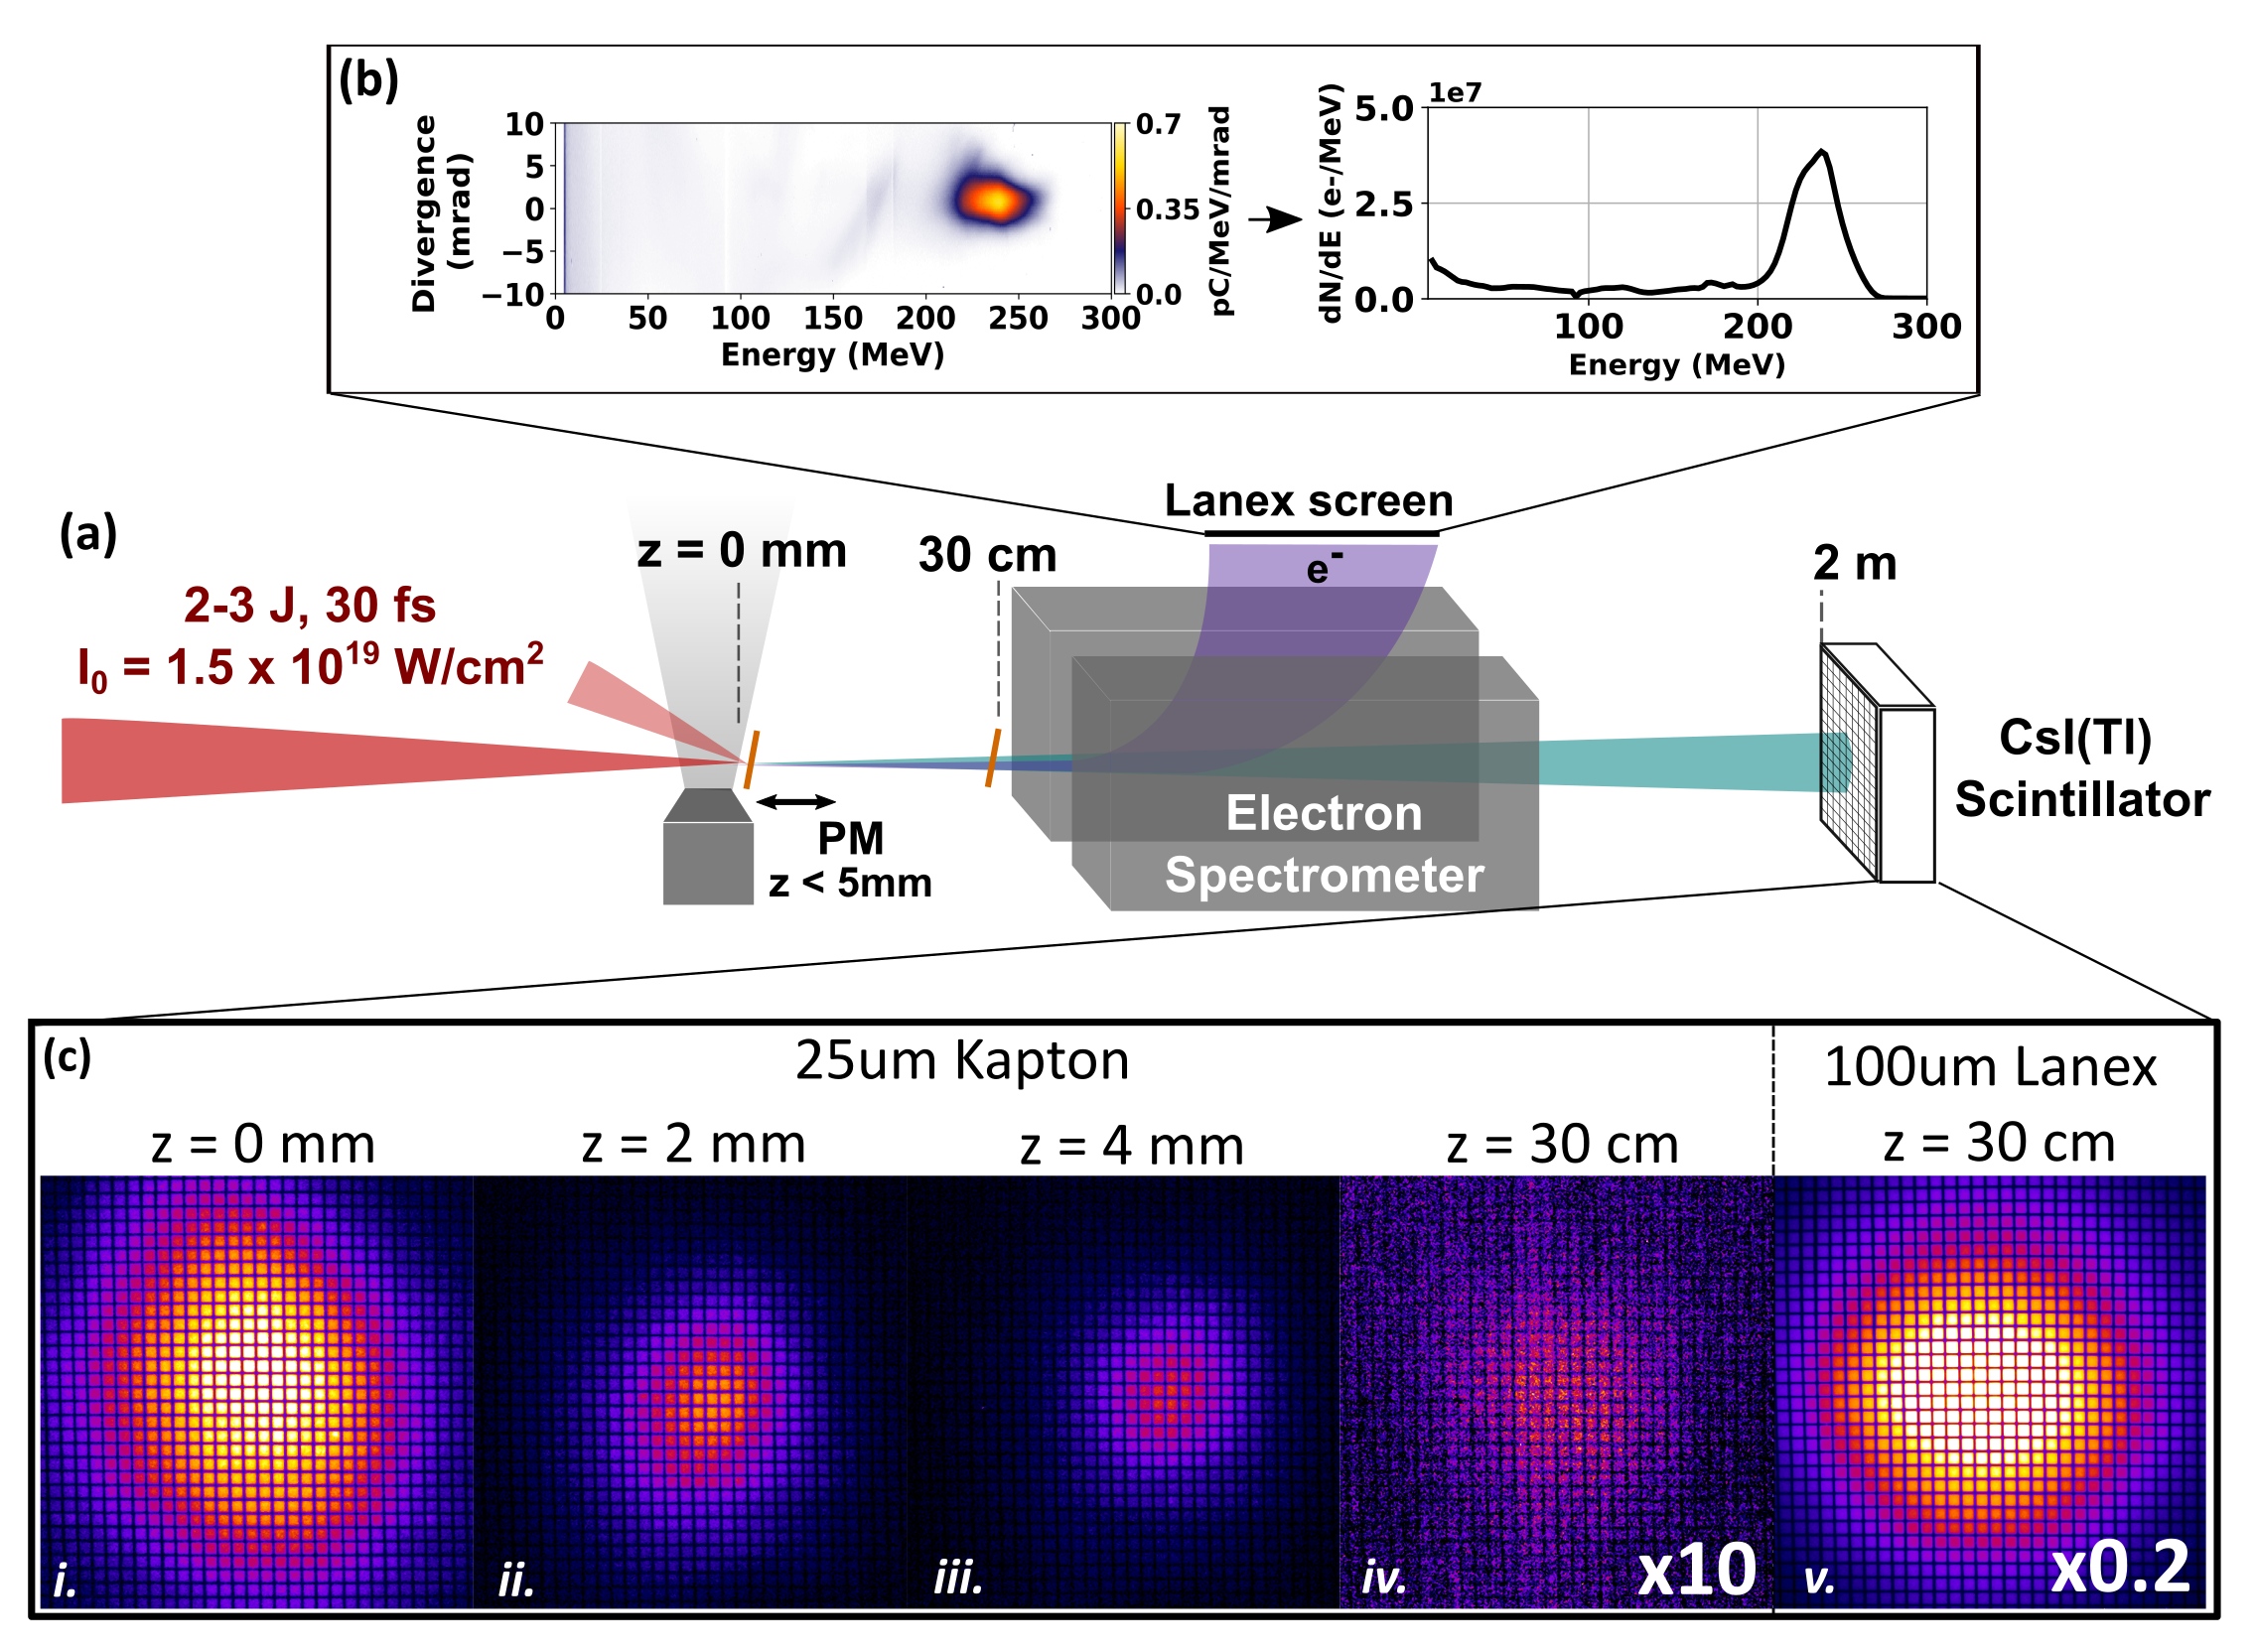
Experiments were performed on the DRACO Ti:Sa chirped pulse amplification laser system at Helmholtz-Zentrum Dresden-Rossendorf (HZDR) Irman et al. (2018) which can deliver up to 4 J, 30 fs pulses with a spot size of 20 m (FWHM) to a 3 mm long He gas jet with 1 % Nitrogen doping [see Fig. 1(a)]. The accelerator operates in a self-truncated ionization injection regime Couperus et al. (2017); Mirzaie et al. (2015) and the typical parameters for the experiments presented here are 2 J on target and electron density of . A magnetic spectrometer placed 30 cm downstream from the gas jet sweeps accelerated electrons off-axis vertically and measures their spectrum and horizontal divergence Schramm et al. (2017); Kurz et al. (2018) [see Fig. 1(b)]. The profile and fluence of the laser pulse were characterized by picking off the drive laser after the magnet with no PM in place and imaging the profile to a camera outside the target chamber under acceleration conditions with and without gas. The total laser energy on target was calibrated with a power meter and the beam size was calibrated by imaging a 20 m tungsten wire placed at the exit of the gas jet. The laser fluence is characterized at selected positions downstream of the accelerator by integrating the camera signal within a calibrated radius of 4 m at the maximum. This area is chosen to best match the interaction area of the electrons with the reflected laser. The ICS profile and total radiated energy are diagnosed at an electron density of by a cm CsI(Tl) profiling scintillator placed on-axis 2 m after the gas jet and outside of vacuum. Scintillating crystal detectors are well-suited for detecting X-rays between 0.1 and several MeV photon energy because of their high Z, high photon output and relatively flat spectral response in this range. They measure changes in total radiated energy accurately. To determine the range of over which we can generate ICS photons with a PM, we varied the position of the PM between mm (inside the accelerator) and mm downstream and imaged the total scintillator signal with a CCD camera. Figure 1(c) shows the ICS profile from a 25 m Kapton PM placed 0 (i.), 2 (ii.), and 4 (iii.) mm after the accelerator. The profiles generated by a target placed at the entrance of the magnet (z = 30 cm) are dominated by bremsstrahlung and are multiplied by the factor shown to compare to the ICS shots on the same scale. Bremsstrahlung from a 25 m Kapton film (iv.) is less bright than the ICS signal, while bremsstrahlung from a 100 m Lanex screen (GdS:Tb, v.) is brighter. Betatron radiation can also deposit energy in the scintillator, however no observed signal is recorded by the scintillating camera when the LPA is on but no material is placed in the accelerated electron beam path.
2 RESULTS
2.1 Laser fluence
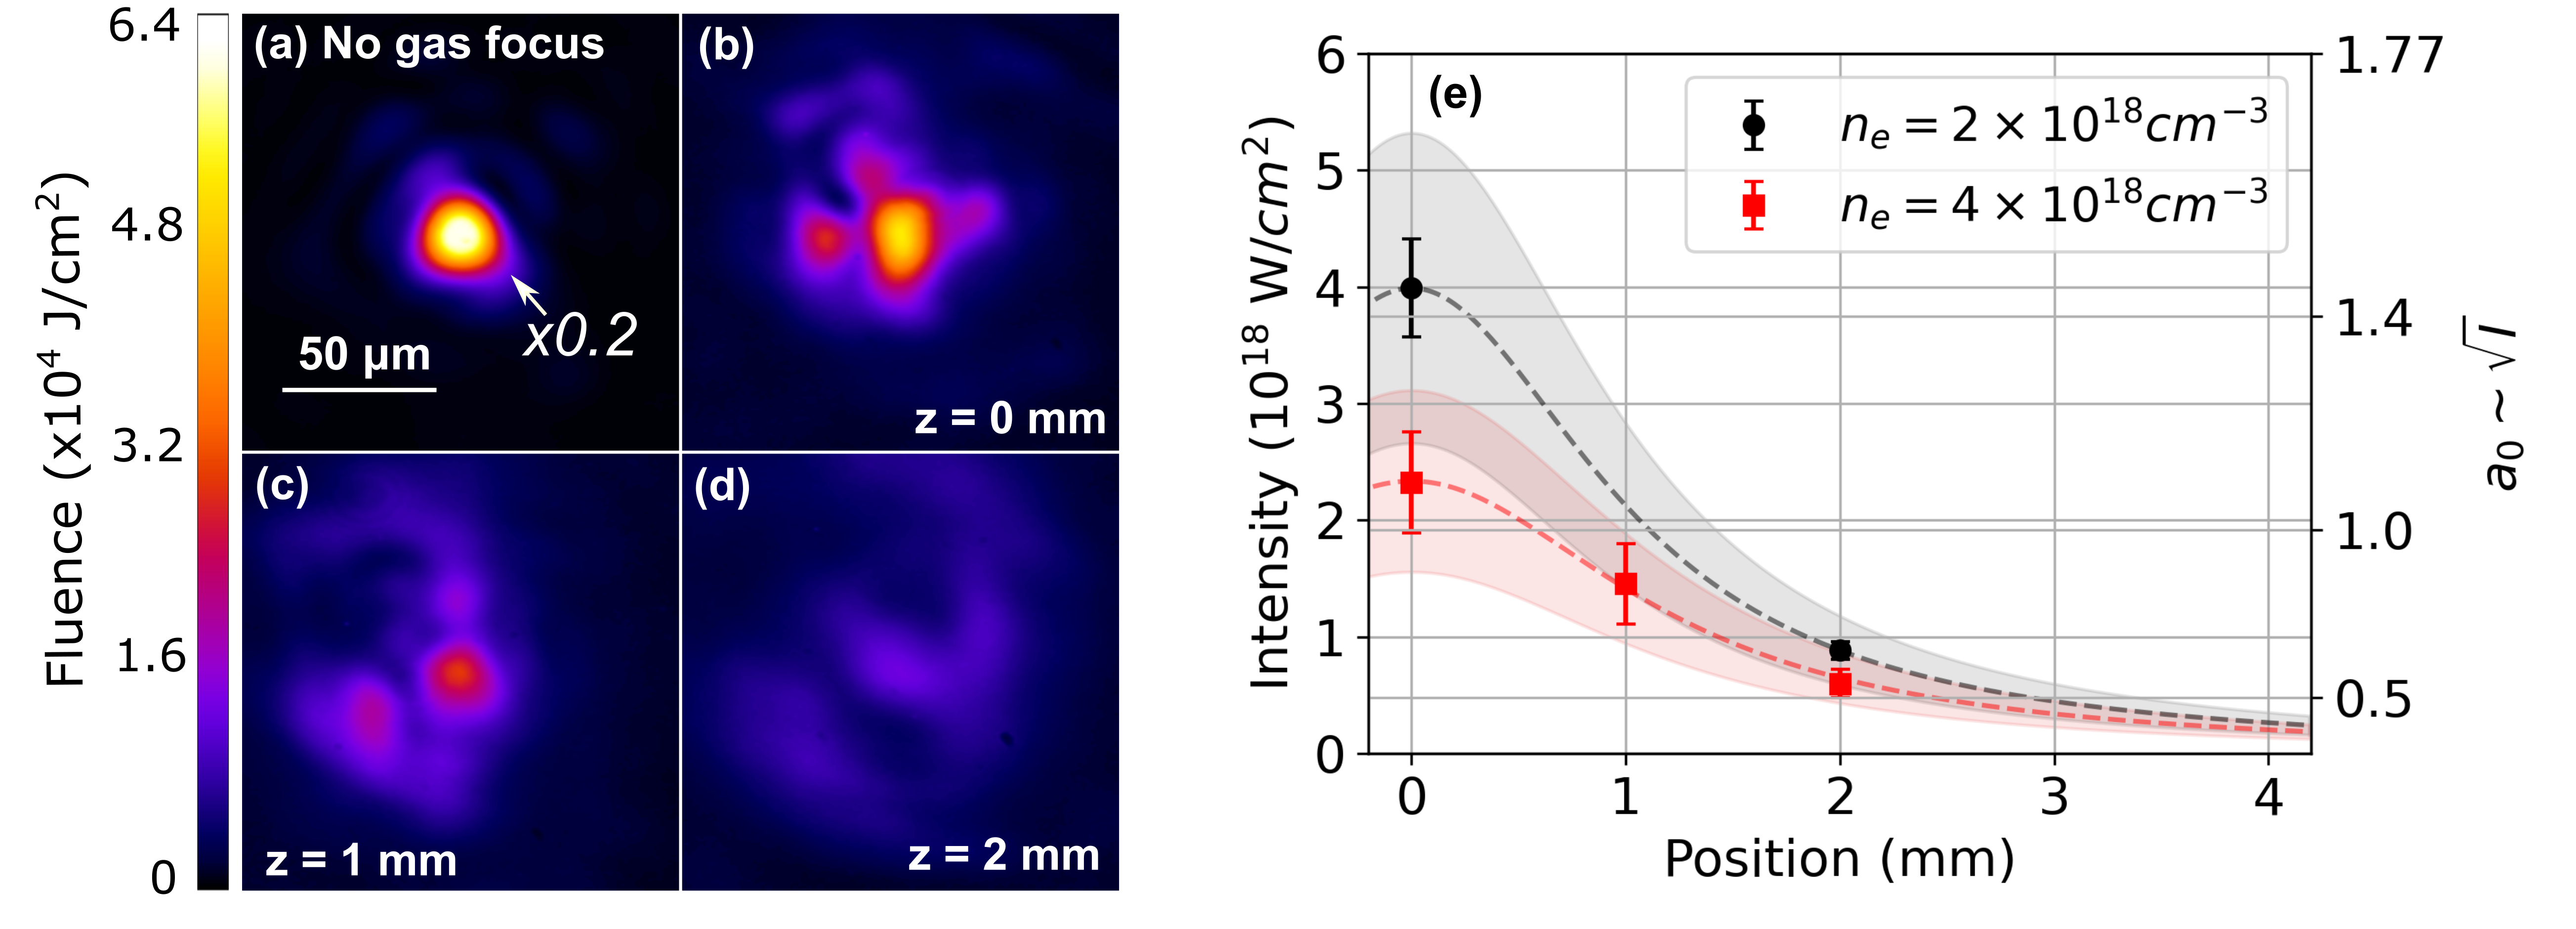
Figure 2 shows the (a) vacuum focus laser profile with a FWHM beam size of 20 m, the laser profile after propagating through 3 mm of He at a density at (b) , (c) mm ,and (d) mm downstream of the gas jet exit. Before acceleration, the laser has a FWHM pulse duration of 30 fs, peak intensity of and . During acceleration, the laser loses energy to the plasma and the spatial profile modulates, however, the pulse duration is expected to decrease as the front edge of the laser etches back Decker et al. (1996); Zhu, Palastro, and Antonsen (2012). Simulations predict that under the acceleration conditions presented here the laser pulse can decrease to as low as fs. Figure 2(e) shows the calculated laser intensity based on the measured fluence for a pulse duration of 20 fs and density of (black circles) and (red squares). The error bars represent the statistical error from the standard deviation over shots and the shaded regions give the range from the lower bound intensity which assumes a pulse duration of 30 fs, and an upper bound intensity that assumes a pulse duration of 15 fs. The calculated intensity after acceleration (data points) is fit to which assumes a local Gaussian propagation of Rayleigh length once the laser leaves the gas jet. These fits are shown by the dotted lines for both densities.
2.2 Total Radiated Energy
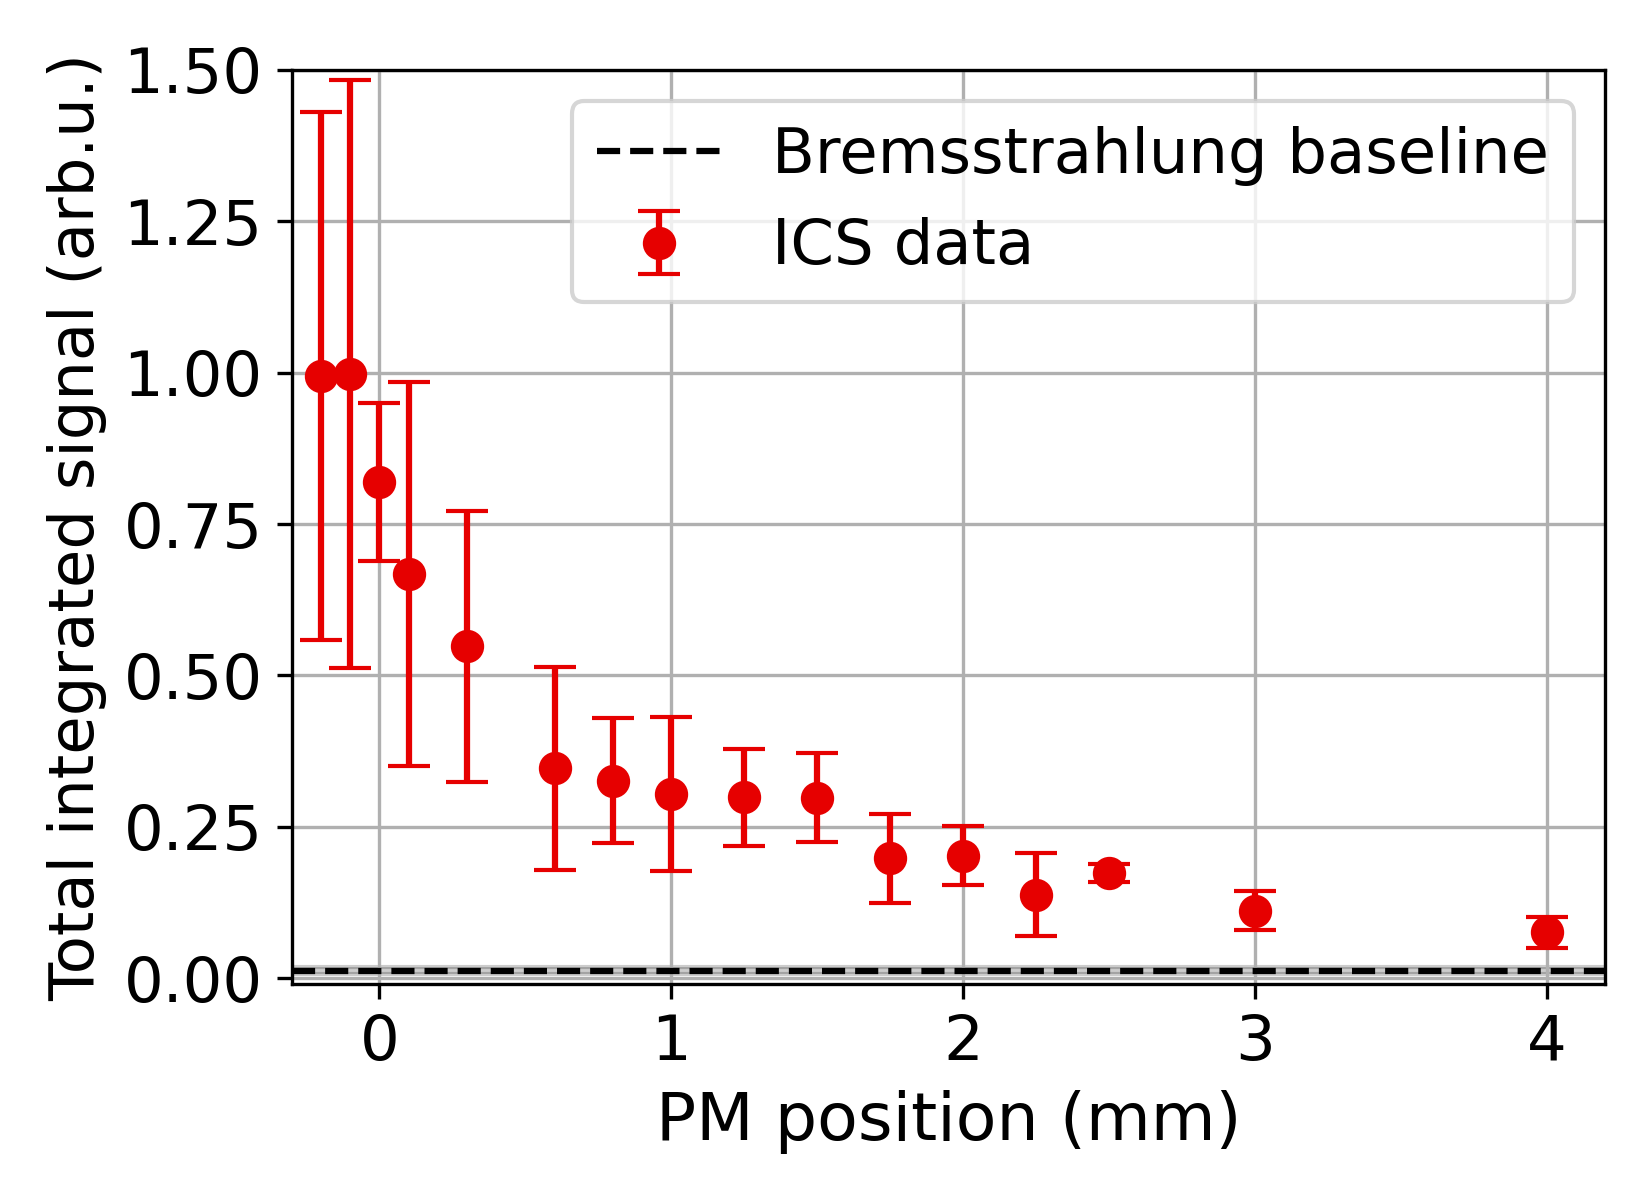
Figure 3 shows the background subtracted total integrated scintillator signal averaged over shots (red circles) for each position of the PM relative to the exit of the gas jet at . The data is scaled to the maximum value and the black dashed line provides the normalized scintillator signal when the PM was moved 30 cm downstream, indicating a baseline for the bremsstrahlung signal generated through the 25 m-thick Kapton film. The weakest signal generated via ICS with the PM at z = 4 mm has more energy than this baseline, indicating that the measurements are dominated by the ICS contribution. Furthermore we observe a increase in the signal when the PM is placed within the jet exit versus 4 mm downstream offering a simple but robust tunability of the scattering regime.
2.3 Divergence
Figure 4(a) shows the HWHM divergence of the electrons for different plasma mirror positions (green triangles) averaged over 5 shots. The dashed line represents the average HWHM divergence of electrons without the PM in place of mrad. The shaded bar shows the standard deviation of the unperturbed electrons to indicate the shot to shot fluctuations during the experiment. We observe an increase of in the electron divergence when the PM is close to the jet ( 1 mm) resulting from strong magnetic fields within the plasma mirror at relativistic laser intensities Raj et al. (2020); Schumaker et al. (2013).
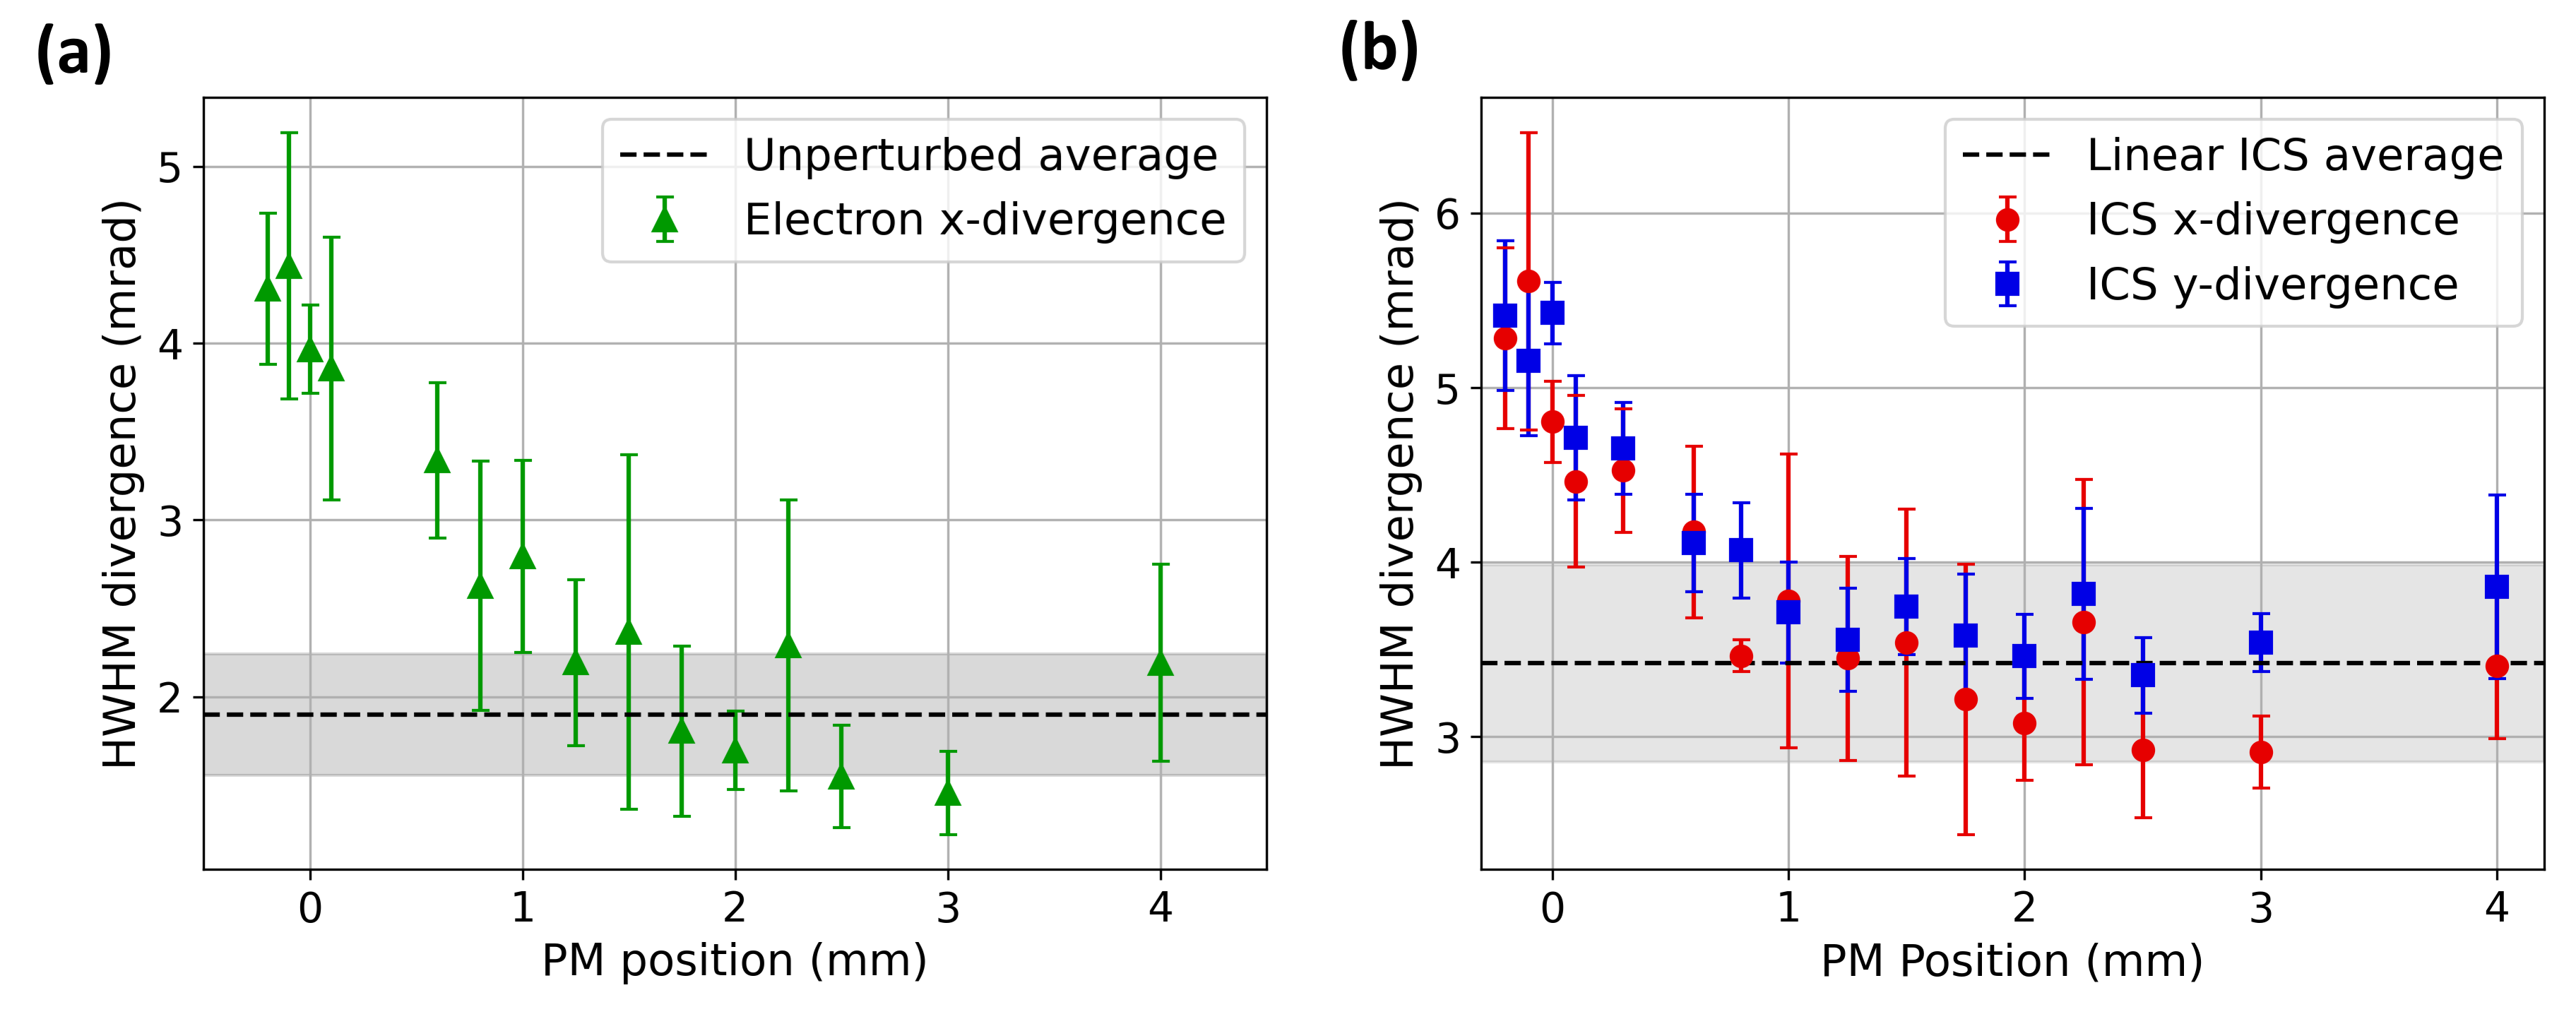
The perturbation from the electrons passing through the PM bulk occurs after the reflected laser scatters from the accelerated electrons, thus we can assume that the electron divergence remains constant at mrad during the ICS interaction.
Figure 4(b) shows the HWHM divergence of the ICS X-rays as a function of plasma mirror position where we observe divergence growth in the X-rays as the PM is moved mm. The linear ICS divergence can be found by averaging the divergence of the X-ray beam when the PM is placed at mm downstream. The result is mrad HWHM, indicated by the dashed line and shaded region in figure 4(b). The ICS divergence is up to larger than this baseline when the PM is place mm after the gas jet and, assuming the electron divergence remains constant, this X-ray divergence growth is caused by nonlinear ICS scattering effects. Expectations of the ICS divergence dependence on electron divergence will be discussed in more detail in the Discussion.
3 DISCUSSION
Understanding the strength of the laser during the scattering process is important for predicting the scattering regime and diagnosing the emitted radiation. For applications that require a narrowband source of X-rays, the laser strength parameter must remain small () so that the interaction with the accelerated electrons is linear. If a higher flux source is needed and a narrowband source is not, then a nonlinear interaction is required (). Estimates can be made based on the measured laser fluence prior to PM reflection and the resulting relative integrated signal observed with the profiling scintillator. The expected energy radiated from a single relativistic electron is proportional to , and when integrated over the total electron spectrum . Inverse Compton scattered radiation is additionally proportional to Esarey, Ride, and Sprangle (1993) such that . The integrated scintillator signal, which is roughly proportional to the total radiated energy of the ICS source, can be normalized to the electron bunch parameter which reduces the shot-to-shot variation observed in Fig. 3 and isolates the effect has on the resulting ICS radiation.
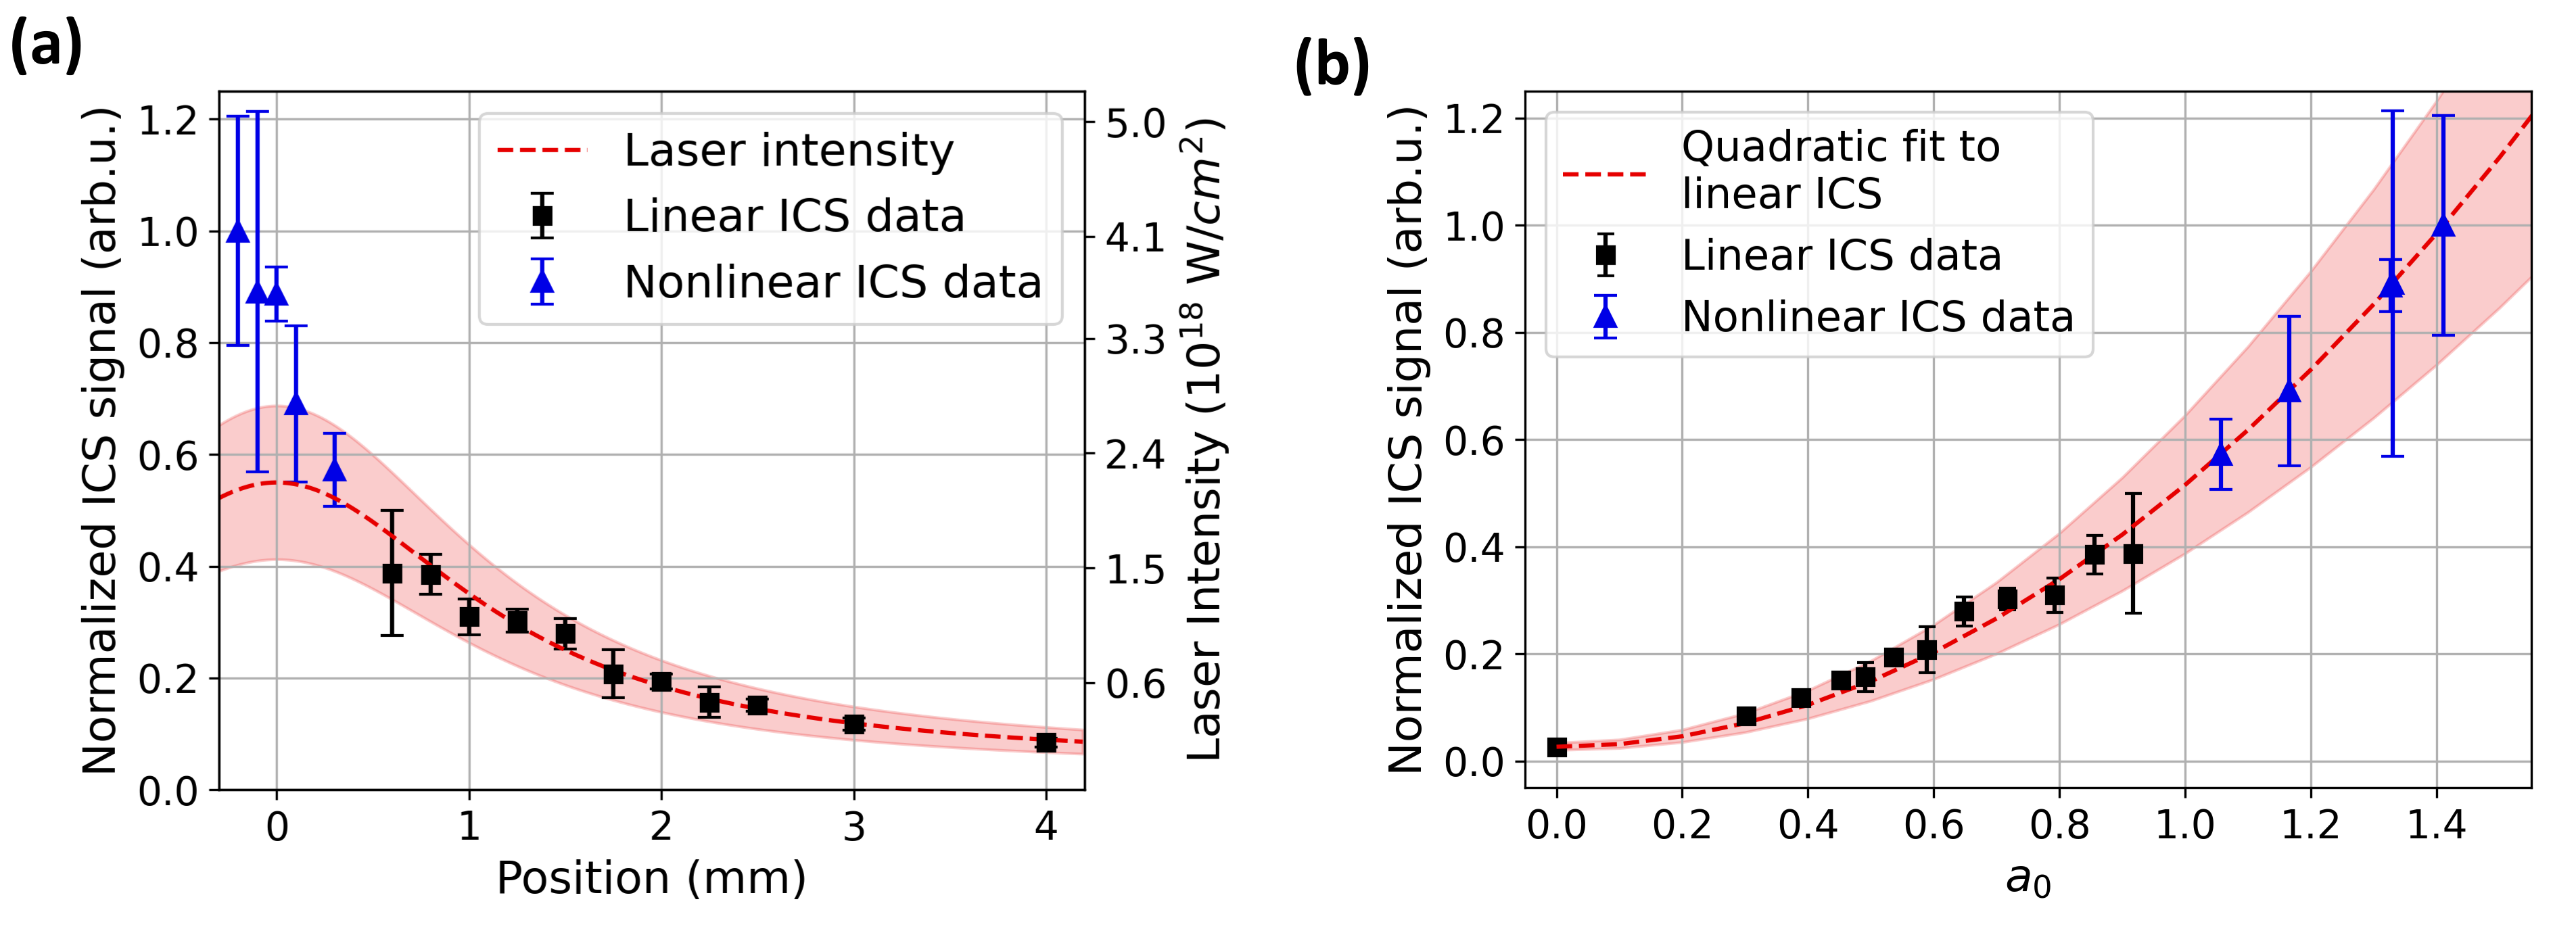
Figure 5(a) shows the normalized ICS integrated scintillator signal (data points) on the left axis and the calculated laser intensity (red dashed curve) on the right axis. The laser intensity is calculated from the measured fluence, assuming a 20 fs pulse duration and an 85% reflectivity efficiency of the PM Tsai et al. (2017). The shaded region represents a combined uncertainty in the pulse duration and reflectivity of the PM and the two sets of data are linearly fit to find the corresponding scattering intensity at each PM position. However, this procedure only allows for an estimate of the ICS scattering intensity for PM positions mm, referred to as ”Linear ICS data” in Fig. 5(a) (black squares). For PM positions mm, the ICS intensity deviates from the laser intensity curve, suggesting that the real scattering intensity and is larger than that estimated by the laser intensity curve alone. This observation may indicate a nonlinear response of the PM to the incident laser intensity. Simulations and experiments have shown that a laser pulse with induces a curvature at the PM surface and focuses the laser pulse with a focal length as small as 25 m, resulting in a larger intensity of the reflected pulse compared to the incident pulse Tsai et al. (2017).
To estimate the value of at PM positions near the gas jet exit (Fig. 5(a) ”Nonlinear ICS data”, blue triangles), the linear ICS data can be plotted as a function of and a quadratic fit can be performed, including the normalized bremsstrahlung baseline as the y-intercept. The resulting quadratic function that relates the normalized integrated scintillator signal and the corresponding values of from Fig. 5(a) enables extrapolation of the nonlinear ICS values. Figure 5(b) illustrates this procedure where the ”Nonlinear ICS data” for PM positions mm (Fig. 5(b) blue triangles) is extrapolated based on the quadratic fit of the ”Linear ICS data” to (Fig. 5(b) red dashed curve). This extrapolation indicates that the intensity of the scattering laser can reach up to . The possible PM focusing effect suggests that the PM method for generating ICS radiation is not wholly limited by the intensity of the laser after driving the acceleration process, and is capable of generating radiation in both the linear () and nonlinear () ICS regime.
The observed divergence growth when the PM is placed further supports the conclusion that we observe both linear and nonlinear ICS from an LPA and PM. ICS from a single electron has a HWHM divergence for and increases to when Corde et al. (2013). When scattering from an electron bunch with HWHM divergence , the resulting ICS divergence can be approximated as . Assuming the scattering electron divergence remains constant for each PM position, the expected linear ICS divergence based on this equation is and agrees with the measured linear ICS divergence to within uncertainty. The observed divergence growth of the ICS when the PM is placed mm is a result of nonlinear ICS when the value of approaches and exceeds 1. This nonlinear divergence growth has been observed in ICS experiments using a separate colliding pulse instead of a PM Yan et al. (2017). Finally, the unperturbed electron divergence and the linear ICS divergence can be used to estimate an upper bound value of for the nonlinear ICS data of .
4 CONCLUSION
We have presented scintillator based measurements of the nonlinear characteristics of ICS radiation from a 250 MeV LPA and plasma mirror. The total radiated energy of the linear ICS beam is larger than the bremsstrahlung generated from the 25 m Kapton plasma mirror when placed 4 mm after the accelerator exit. Moreover, we observe more energy radiated when the PM is placed 200 m within the gas jet compared to 4 mm downstream indicating a increase in the scattering parameter . Measurements of the laser fluence and inferred intensity show that the laser remains relativistic with of after driving the LPA and reduces to after propagating 4 mm from the gas jet. By assuming a PM reflectivity of 0.85 and pulse duration of 20 fs we are able to fit the integrated scintillator signal from the linear ICS to the corresponding laser intensity, providing a method for extrapolating the value of when the PM is placed mm. We find that the scattering laser intensity could reach as high as of when the PM is placed within the exit of the gas jet. This increase is also more than would be suggested by the measured fluence of the laser pulse and may be caused by an induced curvature of the PM by the intense laser pulse resulting in a focused and higher reflected intensity at the point of interaction with the electrons. These measurements are supported by the increase in the ICS divergence from the linear to nonlinear ICS scattering regime. To the best of our knowledge this is the first observation of both linear and nonlinear ICS from a laser plasma accelerator and plasma mirror.
5 ACKNOWLEDGMENTS
U. Texas authors acknowledge support from U. S. Department of Energy grant DE-SC0011617, A.H. from the National Science Foundation Graduate Research Fellowship grant No. DGE-1610403 and M. C. D. from the Alexander von Humboldt Foundation. HZDR authors acknowledge support from the Helmholtz Association under program Matter and Technology, topic Accelerator R & D.
References
- Jaeschke et al. (2016) E. J. Jaeschke, S. Khan, J. R. Schneider, and J. B. Hastings, Springer Reference (2016).
- Ketcham and Carlson (2001) R. A. Ketcham and W. D. Carlson, Computers and Geosciences 27, 381–400 (2001).
- Hanke, Fuchs, and Uhlmann (2008) R. Hanke, T. Fuchs, and N. Uhlmann, Nuclear Instruments and Methods in Physics Research, Section A: Accelerators, Spectrometers, Detectors and Associated Equipment 591, 14–18 (2008).
- Lewis (1997) B. Lewis, Physics in Medicine and Biology 42, 1213–1243 (1997).
- Suortti and Thomlinson (2003) P. Suortti and W. Thomlinson, Phys. Med. Biol. 48, R1–R35 (2003).
- Chen, Bennett, and Perticone (2007) G. Chen, G. Bennett, and D. Perticone, Nuclear Instruments and Methods in Physics Research, Section B: Beam Interactions with Materials and Atoms 261, 356–359 (2007).
- Falk et al. (2014) K. Falk, L. A. Collins, E. J. Gamboa, G. Kagan, J. D. Kress, D. S. Montgomery, B. Srinivasan, P. Tzeferacos, and J. F. Benage, Physics of Plasmas 21, 056309 (2014).
- Tajima and Dawson (1979) T. Tajima and J. M. Dawson, Physical Review Letters 43, 267–270 (1979).
- Esarey, Schroeder, and Leemans (2009) E. Esarey, C. B. Schroeder, and W. P. Leemans, Reviews of Modern Physics 81, 1229–1285 (2009).
- Wang et al. (2013) X. Wang, R. Zgadzaj, N. Fazel, Z. Li, S. A. Yi, X. Zhang, W. Henderson, Y. Y. Chang, R. Korzekwa, H. E. Tsai, C. H. Pai, H. Quevedo, G. Dyer, E. Gaul, M. Martinez, A. C. Bernstein, T. Borger, M. Spinks, M. Donovan, V. Khudik, G. Shvets, T. Ditmire, and M. C. Downer, Nature Communications 4, 1988 (2013).
- Gonsalves et al. (2019) A. J. Gonsalves, K. Nakamura, J. Daniels, C. Benedetti, C. Pieronek, T. C. De Raadt, S. Steinke, J. H. Bin, S. S. Bulanov, J. Van Tilborg, C. G. Geddes, C. B. Schroeder, C. Tóth, E. Esarey, K. Swanson, L. Fan-Chiang, G. Bagdasarov, N. Bobrova, V. Gasilov, G. Korn, P. Sasorov, and W. P. Leemans, Physical Review Letters 122, 084801 (2019).
- Couperus et al. (2017) J. P. Couperus, R. Pausch, A. Köhler, O. Zarini, J. M. Krämer, M. Garten, A. Huebl, R. Gebhardt, U. Helbig, S. Bock, K. Zeil, A. Debus, M. Bussmann, U. Schramm, and A. Irman, Nature Communications 8, 487 (2017).
- Götzfried et al. (2020) J. Götzfried, A. Döpp, M. F. Gilljohann, F. M. Foerster, H. Ding, S. Schindler, G. Schilling, A. Buck, L. Veisz, and S. Karsch, Physical Review X 10, 041015 (2020).
- Corde et al. (2013) S. Corde, K. Ta Phuoc, G. Lambert, R. Fitour, V. Malka, A. Rousse, A. Beck, and E. Lefebvre, Reviews of Modern Physics 85, 1–48 (2013).
- Krämer et al. (2018) J. M. Krämer, A. Jochmann, M. Budde, M. Bussmann, J. P. Couperus, T. E. Cowan, A. Debus, A. Köhler, M. Kuntzsch, A. Laso García, U. Lehnert, P. Michel, R. Pausch, O. Zarini, U. Schramm, and A. Irman, Scientific Reports 8, 1–11 (2018).
- Khrennikov et al. (2015) K. Khrennikov, J. Wenz, A. Buck, J. Xu, M. Heigoldt, L. Veisz, and S. Karsch, Physical Review Letters 114, 195003 (2015).
- Yan et al. (2017) W. Yan, C. Fruhling, G. Golovin, D. Haden, J. Luo, P. Zhang, B. Zhao, J. Zhang, C. Liu, M. Chen, S. Chen, S. Banerjee, and D. Umstadter, Nature Photonics 11, 514–521 (2017).
- Cole et al. (2018) J. M. Cole, K. T. Behm, E. Gerstmayr, T. G. Blackburn, J. C. Wood, C. D. Baird, M. J. Duff, C. Harvey, A. Ilderton, A. S. Joglekar, K. Krushelnick, S. Kuschel, M. Marklund, P. McKenna, C. D. Murphy, K. Poder, C. P. Ridgers, G. M. Samarin, G. Sarri, D. R. Symes, A. G. Thomas, J. Warwick, M. Zepf, Z. Najmudin, and S. P. Mangles, Physical Review X 8, 011020 (2018).
- Sarri et al. (2014) G. Sarri, D. J. Corvan, W. Schumaker, J. M. Cole, A. Di Piazza, H. Ahmed, C. Harvey, C. H. Keitel, K. Krushelnick, S. P. Mangles, Z. Najmudin, D. Symes, A. G. Thomas, M. Yeung, Z. Zhao, and M. Zepf, Physical Review Letters 113, 224801 (2014).
- Ta Phuoc et al. (2012) K. Ta Phuoc, S. Corde, C. Thaury, V. Malka, A. Tafzi, J. P. Goddet, R. C. Shah, S. Sebban, and A. Rousse, Nature Photonics 6, 308–311 (2012).
- Tsai et al. (2015) H. E. Tsai, X. Wang, J. Shaw, A. V. Arefiev, Z. Li, X. Zhang, R. Zgadzaj, W. Henderson, V. Khudik, G. Shvets, and M. C. Downer, Physics of Plasmas 22, 023106 (2015).
- Irman et al. (2018) A. Irman, J. P. Couperus, A. Debus, A. Köhler, J. M. Krämer, R. Pausch, O. Zarini, and U. Schramm, Plasma Physics and Controlled Fusion 60, 044015 (2018).
- Mirzaie et al. (2015) M. Mirzaie, S. Li, M. Zeng, N. A. Hafz, M. Chen, G. Y. Li, Q. J. Zhu, H. Liao, T. Sokollik, F. Liu, Y. Y. Ma, L. M. Chen, Z. M. Sheng, and J. Zhang, Scientific Reports 5, 1–9 (2015).
- Schramm et al. (2017) U. Schramm, M. Bussmann, A. Irman, M. Siebold, K. Zeil, D. Albach, C. Bernert, S. Bock, F. Brack, J. Branco, J. P. Couperus, T. E. Cowan, A. Debus, C. Eisenmann, M. Garten, R. Gebhardt, S. Grams, U. Helbig, A. Huebl, T. Kluge, A. Köhler, J. M. Krämer, S. Kraft, F. Kroll, M. Kuntzsch, U. Lehnert, M. Loeser, J. Metzkes, P. Michel, L. Obst, R. Pausch, M. Rehwald, R. Sauerbrey, H. P. Schlenvoigt, K. Steiniger, and O. Zarini, Journal of Physics: Conference Series 874, 012028 (2017).
- Kurz et al. (2018) T. Kurz, J. P. Couperus, J. M. Krämer, H. Ding, S. Kuschel, A. Köhler, O. Zarini, D. Hollatz, D. Schinkel, R. D’Arcy, J. P. Schwinkendorf, J. Osterhoff, A. Irman, U. Schramm, and S. Karsch, Review of Scientific Instruments 89, 093303 (2018).
- Decker et al. (1996) C. D. Decker, W. B. Mori, K. C. Tzeng, and T. Katsouleas, Physics of Plasmas 3, 2047–2056 (1996).
- Zhu, Palastro, and Antonsen (2012) W. Zhu, J. P. Palastro, and T. M. Antonsen, Physics of Plasmas 19, 033105 (2012).
- Raj et al. (2020) G. Raj, O. Kononenko, A. Doche, X. Davoine, C. Caizergues, Y. Y. Chang, J. P. Couperus Cabada, A. Debus, H. Ding, M. Förster, M. F. Gilljohann, J. P. Goddet, T. Heinemann, T. Kluge, T. Kurz, R. Pausch, P. Rousseau, P. San Miguel Claveria, S. Schöbel, A. Siciak, K. Steiniger, A. Tafzi, S. Yu, B. Hidding, A. Martinez de la Ossa, A. Irman, S. Karsch, A. Döpp, U. Schramm, L. Gremillet, and S. Corde, Phys. Rev. Research 2, 023123 (2020).
- Schumaker et al. (2013) W. Schumaker, N. Nakanii, C. McGuffey, C. Zulick, V. Chyvkov, F. Dollar, H. Habara, G. Kalintchenko, A. Maksimchuk, K. A. Tanaka, A. G. Thomas, V. Yanovsky, and K. Krushelnick, Physical Review Letters 110, 015003 (2013).
- Esarey, Ride, and Sprangle (1993) E. Esarey, S. Ride, and P. Sprangle, Physical Review E 48, 3003–3021 (1993).
- Tsai et al. (2017) H. E. Tsai, A. V. Arefiev, J. M. Shaw, D. J. Stark, X. Wang, R. Zgadzaj, and M. C. Downer, Physics of Plasmas 24, 013106 (2017).