Study of (6Li, ) and (6Li, ) reactions on 22Ne and implications for -process nucleosynthesis
Abstract
We studied cluster states in 26Mg via the 22Ne(6Li,)26Mg reaction in inverse kinematics at an energy of MeV/nucleon. States between = 4 - 12 MeV in 26Mg were populated and relative spectroscopic factors were determined. Some of these states correspond to resonances in the Gamow window of the 22Ne(,n)25Mg reaction, which is one of the main neutron sources in the astrophysical -process. We show that -cluster strength of the states analyzed in this work have critical impact on s-process abundances. Using our new 22Ne(,n)25Mg and 22Ne(,)26Mg reaction rates, we performed new s-process calculations for massive stars and Asymptotic Giant Branch stars and compared the resulting yields with the yields obtained using other 22Ne+ rates from the literature. We observe an impact on the s-process abundances up to a factor of three for intermediate-mass AGB stars and up to a factor of ten for massive stars. Additionally, states in 25Mg at 5 MeV are identified via the 22Ne(6Li,)25Mg reaction for the first time. We present the (6Li, ) spectroscopic factors of these states and note similarities to the ) reaction in terms of reaction selectivity.
pacs:
I Introduction
Most of the elements heavier than iron are made by neutron capture processes in stars. In the solar system, about half of the abundances of heavy elements are made by the slow neutron-capture process (-process) Kappeler2011 , while most of the remaining abundances are made by the rapid neutron-capture process (-process) cowan:21 . Additional contributions from the intermediate neutron-capture processes (-process) cowan:77 are still a matter of debate Denissenkov2017 , and explosive nucleosynthesis components from supernovae are expected to be potentially relevant only up to the the Sr-Pd region roberts:10 ; arcones:11 . The -process occurs in extreme stellar environments such as neutron star mergers LIGO2017 ; Drout2017 and rare types of supernovae cowan:21 . Its constituent reactions involve extremely neutron-rich nuclei far from stability Arnould2007 ; Sneden2008 . In contrast, the -process occurs during hydrostatic stellar evolution, and because of the lower neutron densities the -process nucleosynthesis path proceeds along the valley of stability. As a result, the -process can potentially be better constrained through accessing the relevant nuclear physics, e.g., Ref, Bao2000 , and stellar computational modeling Karakas2012 . By studying the isotopic pattern of the solar abundances for heavy -process elements, three different -process components have been identified. The main and the strong components are mostly formed in low-to-intermediate mass Asymptotic Giant Branch (AGB) stars in the He-rich intershell region Straniero2006 (–), producing most of the solar -process abundances in the – range—i.e., beyond the =50 peak at 88Sr gallino:98 ; kaeppeler:11 . The ‘weak’ -process components are made in massive stars (), during the convective He core and C shell burning phases. The neutron exposures optained in these conditions produce nuclides in the – mass region, possibly contributing also to the long-lived radioactive isotope 60Fe rauscher:02 ; the:07 ; pignatari:10 ; pignatari:16 .
The accurate knowledge of the rates of neutron-generating reactions and of relevant neutron-capture cross sections are crucial to move toward a complete understanding of -process nucleosynthesis. Along with the reaction, has long been recognized as one of the most important -process neutron sources peters:68 ; Iben1975 . For the main -process in AGB stars, most of the neutrons are made by the 13C()16O reaction. However, during the Thermal Pulse the 22Ne()25Mg reaction is partially activated for temperatures larger than about 0.25 GK, providing an additional neutron exposure and higher neutron densities karakas:14 . In the He intershell region just below the H shell, 12C is produced via triple- reactions during the convective Thermal Pulses. The 12C captures protons brought in the He-rich material by the Third-Dredge Up events, ultimately forming 13C following decay of the generated 13N, and creating the 13C-pocket, where the O reaction activates the s-process in radiative conditions Straniero2006 . The following Thermal Pulse mixes the s-process rich material from the ashes of the 13C-pocket in the He-intershell. The high neutron density generated by the 22Ne()25Mg reaction allows activation of several s-process branching points (e.g., 95Zr), modifying the isotopic pattern and producing isotopes not accessible during the neutron exposure in the 13C-pocket bisterzo:15 .
In the weak -process, 22Ne()25Mg is the dominant neutron source throughout both the He core and the C shell over a range of stellar temperatures between about 0.25 GK and 1 GK raiteri:91 ; kaeppeler:94 ; Chieffi1998 ; pignatari:10 . In C-shell burning, long-lived 60Fe is also made, thus contributing to the total ejected amount of this isotope jones:19 . The production of galactic 60Fe is of significant interest since it is detected as a diffusive -ray source in the Galaxy Wang2007 and has a signature is identified in the Early Solar System lugaro:18 .
After many theoretical and experimental efforts over the past few decades, there still exist significant uncertainties in the stellar rate of 22Ne(,)25Mg, as well as the competing reaction 22Ne(,)26Mg, e.g. as discussed in Ref Longland2012 . The uncertainties are dominated by ambiguous strength of some resonances in the Gamow window (=0.2-0.3 GK, corresponding to =11.1-11.4 MeV in 26Mg). This is due in large part to difficulties in isolating specific states due to the high level density of 26Mg in this excitation region, as well as the low overall cross sections which challenge direct measurements. In the last decade, many new experiments targeting the role of 26Mg resonances in 22Ne(,)25Mg have been published, building upon the knowledge of resonance properties accumulated in the 1980s and 1990s. These have indicated that the 22Ne)25Mg reaction is dominated by the resonance at MeV, and possibly a second resonance in the –11.17 MeV region Wolke1989 ; Drotleff1991 ; Jaeger2001 . Additionally, Koehler Koehler2002 pointed out that a resonance just above the neutron threshold, at MeV may dominate the rate at low temperatures. Massimi et al. later performed a precise measurement of the neutron and -ray partial widths of this state in a scan of ) resonances using a Time-of-Flight neutron beam, confirming Koehler’s claim Massimi2012 ; Massimi2017 .
In the 11.15–11.17 MeV region, a candidate state at 11.15 MeV was originally considered as a potential contributor to both capture reactions. Upper limits on were set both from Giesen1993 and direct Jaeger2001 measurements. However, this state was later shown to be (and hence non-natural parity) by experiments by Longland et al. Longland2009 ; Longland2012 . Talwar et al. later suggested the presence of a natural parity ( or ) resonance at 11.17 MeV, with a large -ray partial width, indicating an enhanced (,) cross section that suppresses the total neutron production by consuming 22Ne in competition with the weaker (,) channel Talwar2016 . Adsley et al. performed high energy-resolution measurements of 26Mg(,’), 26Mg(,’), and 26Mg(,’), and provided important properties of these resonances above such as excitation energy with high precision Adsley2017 ; Adsley2018 . Lotay et al. observed a strong transition from the 11.17 MeV state Lotay2019 . This result was consistent with Talwar et al.’s claim of a large , but suggestive of a higher spin state (–6). Most recently, Jayatissa et al. failed to observe a state at 11.17 MeV in a measurement of the 22Ne(6Li,)26Mg reaction at sub-Coulomb energies Jayatissa2019 . This reaction mechanism is likely to be capable of populating natural-parity states only with , suggesting that the state observed at 11.17 MeV by Talwar et al. is high spin (). All together, the latest experimental results indicate that the 11.17 MeV state has a large and high spin (), thus making its contribution to the s-process negligible.
For the remaining 11.32 MeV resonance, the resonance strength is well established, with earlier measurements Wolke1989 ; JaegerPhD recently confirmed by the new study of Hunt et al., which reported eV. The weighted average of published direct-measurement strengths for this resonance is eV. The strength of this resonance is more uncertain, with the results of direct measurements in poor statistical agreement Longland2012 . A recent letter published by the present authors determined the / branching ratio of this resonance via the 22Ne()26Mg reaction in inverse kinematics Ota2019 . This was done by observing the decay of the recoil 26Mg into either or . Normalizing to the strength of eV, this established an (,) strength of eV, which is a factor smaller than the past direct measurements. Based on the results of recent experiments, the 11.32 MeV resonance appears to be the main contributor to the stellar rate across the important temperature range for the -process. At the same time, the 11.17 MeV resonance observed by Talwar et al. is unlikely to contribute to the stellar reaction. The main outstanding uncertainty concerns the 11.11 MeV resonance identified by Massimi et al. Massimi2017 . This state has the potential to dominate the rate at low temperatures (below GK). The Monte Carlo rate calculations presented in Ref. Ota2019 , which sample the possible strengths from a Porter-Thomas distribution, indicate a large uncertainty in the contribution of this resonance to the stellar rate in this temperature range.
In the present paper, we significantly expand our first letter paper Ota2019 wherein we reported / at =11.32 MeV. In particular, we present a complete description of the experimental setup, which combined the TIARA Si detector array with four HPGe detectors and the MDM spectrometer at Texas A&M University. Additionally, we present an analysis of the complete range of strong cluster states in 26Mg populated in the reaction, as well as states in 25Mg observed in the reaction. Finally, we present the results of a large scale computer simulation, which determines the effect on s-process abundances of replacing the literature values of the and rates with the new rates presented in Ref. Ota2019 . For the simulations, we used a multi-zone post-processing code, MPPNP Herwig2018 , to study the sensitivity at various stellar masses and initial metallicities. The simulations also demonstrate, in a more general way, the sensitivity of the abundance to the ambiguous reaction rates, by varying the cluster strength of relevant resonances.
II Experimental Setup
We performed the experiment at the Texas A&M University Cycloton Institute, using the K150 cyclotron to produce a beam of 154 MeV 22Ne(7+) ions. We studied the reaction using beam in inverse kinematics, impinging the beam onto an isotopically-enriched 6LiF target mounted on a carbon backing. We detected both the deuteron ejectiles and unambiguously identified recoils in coincidence, along with the rays resulting from the de-excitation of states populated in 25,26Mg. Deuterons, recoils, and -decays were measured with the TIARA Si detector array, the MDM spectrometer, or an array of four closely-packed HPGe detectors, respectively. A detailed description of each of these components is given in the following sub-sections.
II.1 TIARA
TIARA consists of two sets of Si detectors called the “Hyball” and “Barrel”, respectively Labiche2010 . The Hyball consists of six wedge-shaped, double-sided Si detectors with 16 rings and 8 sectors for each. The effective area of each detector covers an azimuthal angle of . Together, the six wedges form an annular shape with inner and outer radii of 32.6 mm and 135.0 mm, respectively. The Hyball was placed at 15 cm upstream from the target position and thus detected ejectiles emitted at laboratory polar angles from = 148–168∘ (note that angles from = 138 to 148∘ were not illuminated in the present experiment because they were shadowed by the Barrel detector). The Hyball consists of a single active layer of Si with a nominal thickness of 400 m.
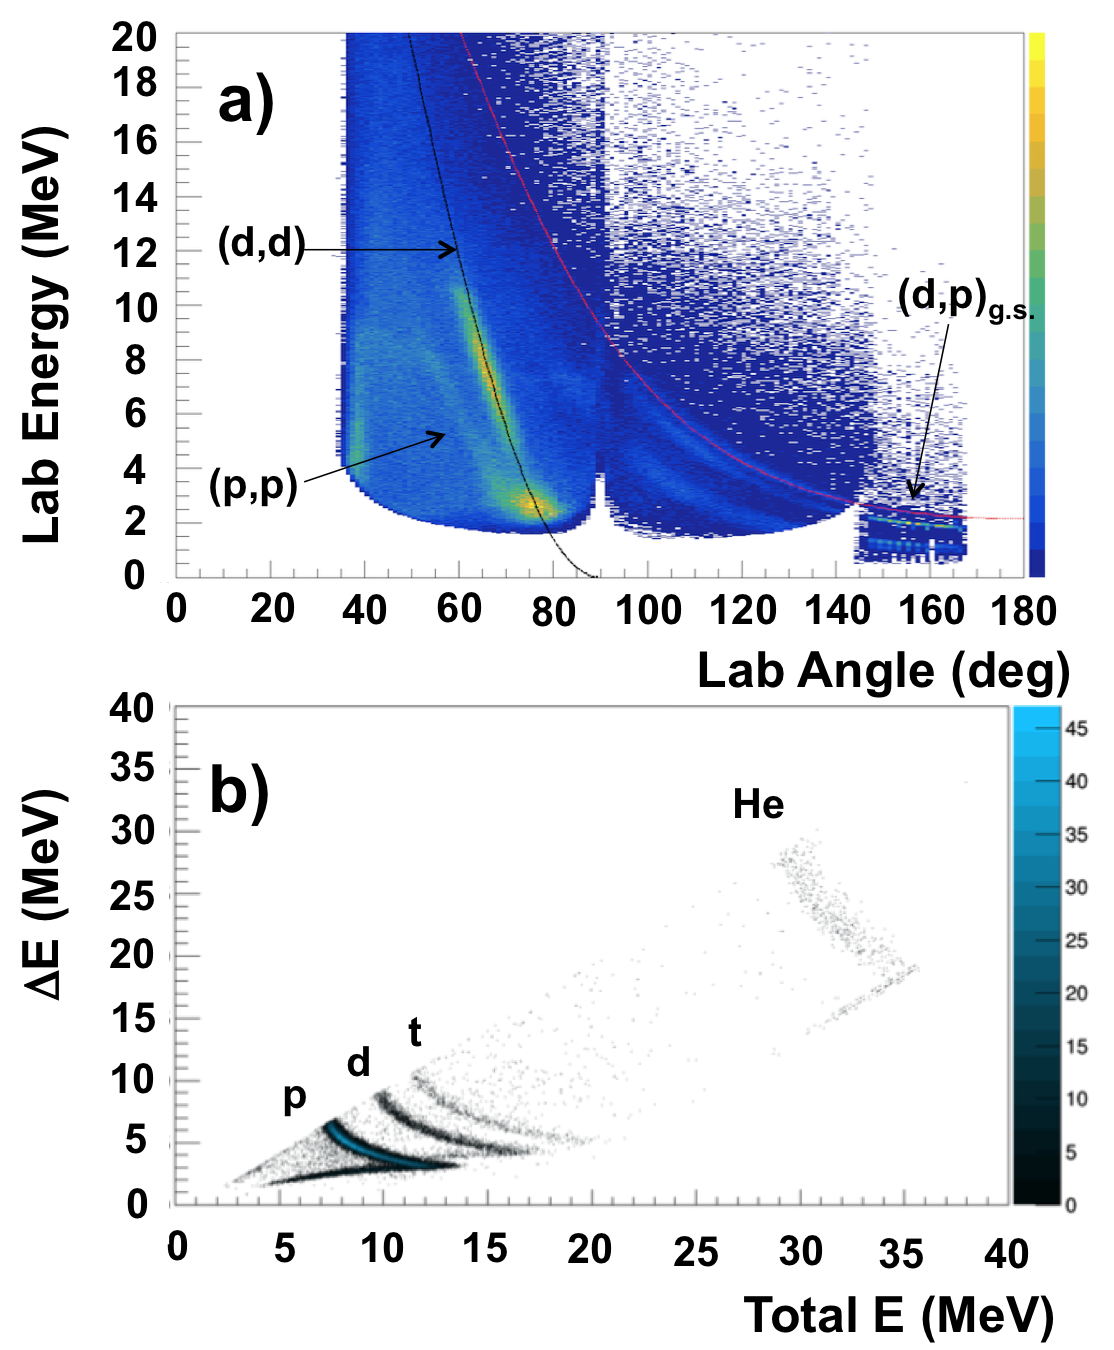
The Barrel consists of eight resistive charge division Si detectors forming an octagonal barrel around the beam axis, surrounding the target and covering polar angles from = 40–145∘. Each Barrel detector is segmented by four strips in the azimuthal () direction. The z-position (along the beam axis) of incident particles is determined from the ratio of deposited energies in the upstream and downstream electrodes, after correcting for the ballistic deficit. The z-axis position along the barrel directly corresponds to in the present geometry. The expected z-position resolution is 1 mm (FWHM) BrownPhD , leading to the resolution better than 2∘. Further details about energy and angle measurements in the Barrel can be found in, e.g. Ref. BrownPhD . The resistive-strip layer of the Barrel (“Inner Barrel”) has a nominal thickness of 400 m and is backed by an unsegmented outer layer (“Outer Barrel”) with 1 mm active thickness. Thus, particles which punch through the Inner Barrel can be identified by the conventional - method (see Figure 2b).
From measurements using multi-nuclide (239Pu, 241Am and 244Cm) sources, the intrinsic energy resolutions of the Hyball and Barrel were determined to be 40 and 100 keV FWHM, respectively. These correspond to 180–280 keV and 400–600 keV resolutions in the center-of-mass system for the and reactions. Center-of-mass resolutions in the barrel are dominated by the poor angular resolution 1∘, relative to the steep slope of the vs. kinematic curves in the corresponding angular region. As the Barrel’s energy resolution is insufficient to separate states in the 26Mg excitation energy spectrum, and furthermore because the 26Mg in coincidence with most of deuterons detected by the Barrel are beyond the MDM acceptance, the barrel was used mostly for monitoring elastic scattering.
II.2 MDM spectrometer
The MDM spectrometer downstream of the target transports particles scattered at forward angles less than =2∘ in both the dispersive (x) and non-dispersive (y) planes. Transported particles are detected in the Oxford detector Pringle1986 ; Spiridon2016 . The Oxford detector consists of three ionization detector zones and four wire proportional counter zones. Energy deposit signals in the two ionization zones in the downstream side are amplified with Micrcromegas plates. The isobutane gas pressure was adjusted so that the incident recoil ions of interest are stopped in the last ionization zone (35 torr for (6Li,) and 70 torr for (,) reactions, respectively). Thus recoil particles were identified by E-E method with high energy-resolution. The resistive wires provided the particle positions and trajectories with a few mm resolution in x-z plane. Thus particles incident on the Oxford detector are identified in mass (A) and atomic number (Z) from the E, E, and x-position information at the focal plane position, which is approximately located at the second resistive wire. The charge state (Q) distribution of 26Mg after passing the target is estimated to be dominated by 12+ LISE2018 . Thus the magnet rigidity was set to accept 25,26Mg recoils with charge .
II.3 HPGe array
Four closely-packed HPGe clovers Lesher2010 were placed at a distance of about 10 cm from the target position (distance is quoted to the detector surface). Each clover consists of four crystals and is also electrically segmented into three sections toward the beam direction (downstream, middle, upstream). The segmentation information was used to correct for doppler shift of the -rays emitted from beam-like recoils (). The energy resolution achieved for beam recoil -rays is 2–3% at FWHM for 1 MeV rays. This is primarily limited by angular resolution in the Doppler correction. Photopeak efficiency was measured using some conventional -ray sources. Absolute efficiency was determined from the coincidence measurements of 60Co -rays (1173 and 1332 keV), and 22Na pair-production -rays (511 keV). The total efficiency curve was then determined with 152Eu and 133Ba source measurements, normalizing to the absolute efficiency measurements. Figure 1 shows the measured photopeak efficiency for this setup, together with a fit to the following function (0.1 MeV): Knoll2010 , where a fixed reference energy is 1 MeV and the average values of for each clover are 4.1979, 0.6096, and 0.0353, respectively.
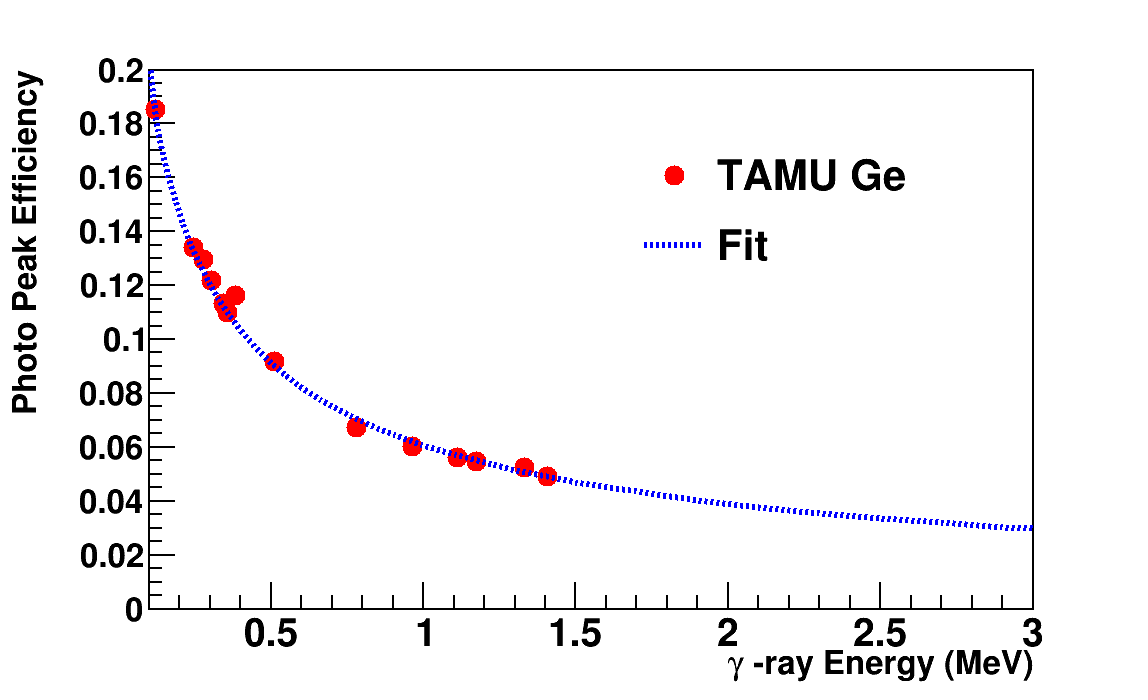
The distance from the chamber surface is about 1 cm. Because of the proximity to the target position, photopeak -ray detection efficiencies achieved in this geometry are 23.5%, 9%, and 6%, and 1% (estimated) at 100, 500, 1, and 10 MeV, respectively. Since -ray energies of our interest range from a few hundred keV Glatz1986 ; NNDC2018 to 11 MeV Longland2009 , -rays were simultaneously measured with two shaping amplifiers with different gains: “low gain” (up to 20 MeV) and “high gain” (up to 6 MeV). The two spectra were finally merged into one spectrum with = 2.5–3 MeV (depending on crystals) as a cross-over point (i.e., below , the high gain spectrum was used).
II.4 Test measurement with 22Ne()
To test the reliability of our experimental setup, we performed a measurement of 22Ne() reaction, whose cross sections, , and spectroscopic factors are well determined by Refs. Lutz1967 ; Howard1970 . The beam impinged on a 500 g/cm2 CD2 target with the intensity of 1 pnA. The outgoing target-like protons were detected in the Hyball which measured their kinetic energy and angle with respect to the incoming beam. The reconstructed deuteron momenta were used to determine the excitation energy of states using the missing mass technique. Elastically scattered target nuclei were detected in the TIARA Si barrel array and used to continuously monitor the incoming beam rate.
Figure 2 shows an angle versus energy plot, in which theoretically calculated kinematic curves are also drawn. For elastic scattering events, we can see the expected correlation between the deuteron energy and scattering angles. The location of the elastic scattering kinematic curves was used to determine the position of the incoming beam, by comparing theoretical curves over a range of incident beam positions using a minimization technique. From this procedure, we obtained a beam position of x,y,z = –2, –1, 4 mm, which was used in later analysis of and data as well. The beam size was also evaluated from the observed elastic scattering kinematic curves, and determined to have a FWHM of 4–5 mm. This agrees with the size determined from the luminescence produced by impinging the beam onto a phosphor-coated viewer plate.
The elastic scattering cross sections observed in the Barrel detector were compared with optical model calculations to determine the absolute beam + target luminosity normalization. A variety of available optical potential models Lutz1967 ; Howard1970 ; Daehnick1980 ; An2006 were used to calculate the elastic cross sections using the FRESCO code Thompson1988 and compared with our experimental data. The optical potential by Daehnick et al. Daehnick1980 best reproduces the shape of our elastic cross section data and the beam intensity was normalized using this potential.
The 22Ne() excitation spectrum and cross sections for some low-lying states are shown in Figure 3, together with DWBA calculations from the TWOFNR code Twofnr20 using the optical potentials from Refs. Daehnick1980 and Perey1976 for the deuteron and proton channels, respectively, assuming known . Our data are well reproduced by the model calculations. Extracted spectroscopic factors are listed in Table 1. These values agree with past measurements, thus confirming that our measurement system works well.
The data were also used to determine the intrinsic efficiency of the Oxford detector for detecting beam-like recoils. This was measured to be by dividing the number of proton + 23Ne coincidence events by the number of proton singles events. For these calculations, the MDM angular acceptance was taken to be since recoils in coincidence with the Hyball protons are emitted within the entrance aperture. The MDM angular acceptance declines with decreasing proton scattering angle, dropping below for events detected in the Barrel. For these events, the coincidence efficiency was estimated using Geant4 with the NPTOOL interface Matta2016 . This efficiency correction for Barrel events is included in the cross sections shown in Figure 3.
The data were also used to test and optimize our particle- coincidence measurements. Because of Doppler broadening, the -ray energy resolution is strongly affected by the accuracy of the HPGe detector positions. Hence the position of each HPGe detector was systematically varied, and the position resulting in the narrowest Doppler-corrected energy resolution was taken for the final analysis. The photopeak efficiencies for selected -ray transitions observed in coincidence with events were also used to confirm the accuracy of our source-determined efficiency curve out to high -ray energies ( MeV).
III 22Ne + 6Li Experiment
For the 22Ne + 6Li portion of the experiment, the 22Ne beam impinged on a 30 g/cm2 6LiF target (95.0% purity) with a 10 g/cm2 carbon backing, with an intensity of 3 pnA. Recoil particle identification plots based on - measurements in the Oxford detector, as well a plot of the 26Mg excitation energy spectrum gated on 25Mg and 26Mg recoils can be found in Ref. Ota2019 . Unlike the measurements, the kinematic locus of elastic scattering events is contaminated by background from elastic scattering on the fluorine and carbon contained in the target. Therefore, we focused on determining relative -particle strengths, normalized to the well-constrained state at =11.32 MeV (see Ref. Ota2019 ). Note the Barrel was not used for the 22Ne + 6Li analysis due to its poor excitation energy resolution.
| (keV) | (present) | (Ref. Howard1970 ) | (Ref. Lutz1967 ) | |
|---|---|---|---|---|
| 0.22 | 0.24 | |||
| 0.70 | 0.40 | |||
| 0.050.01 | 0.07 |
III.1 Recoil energy and focal plane position
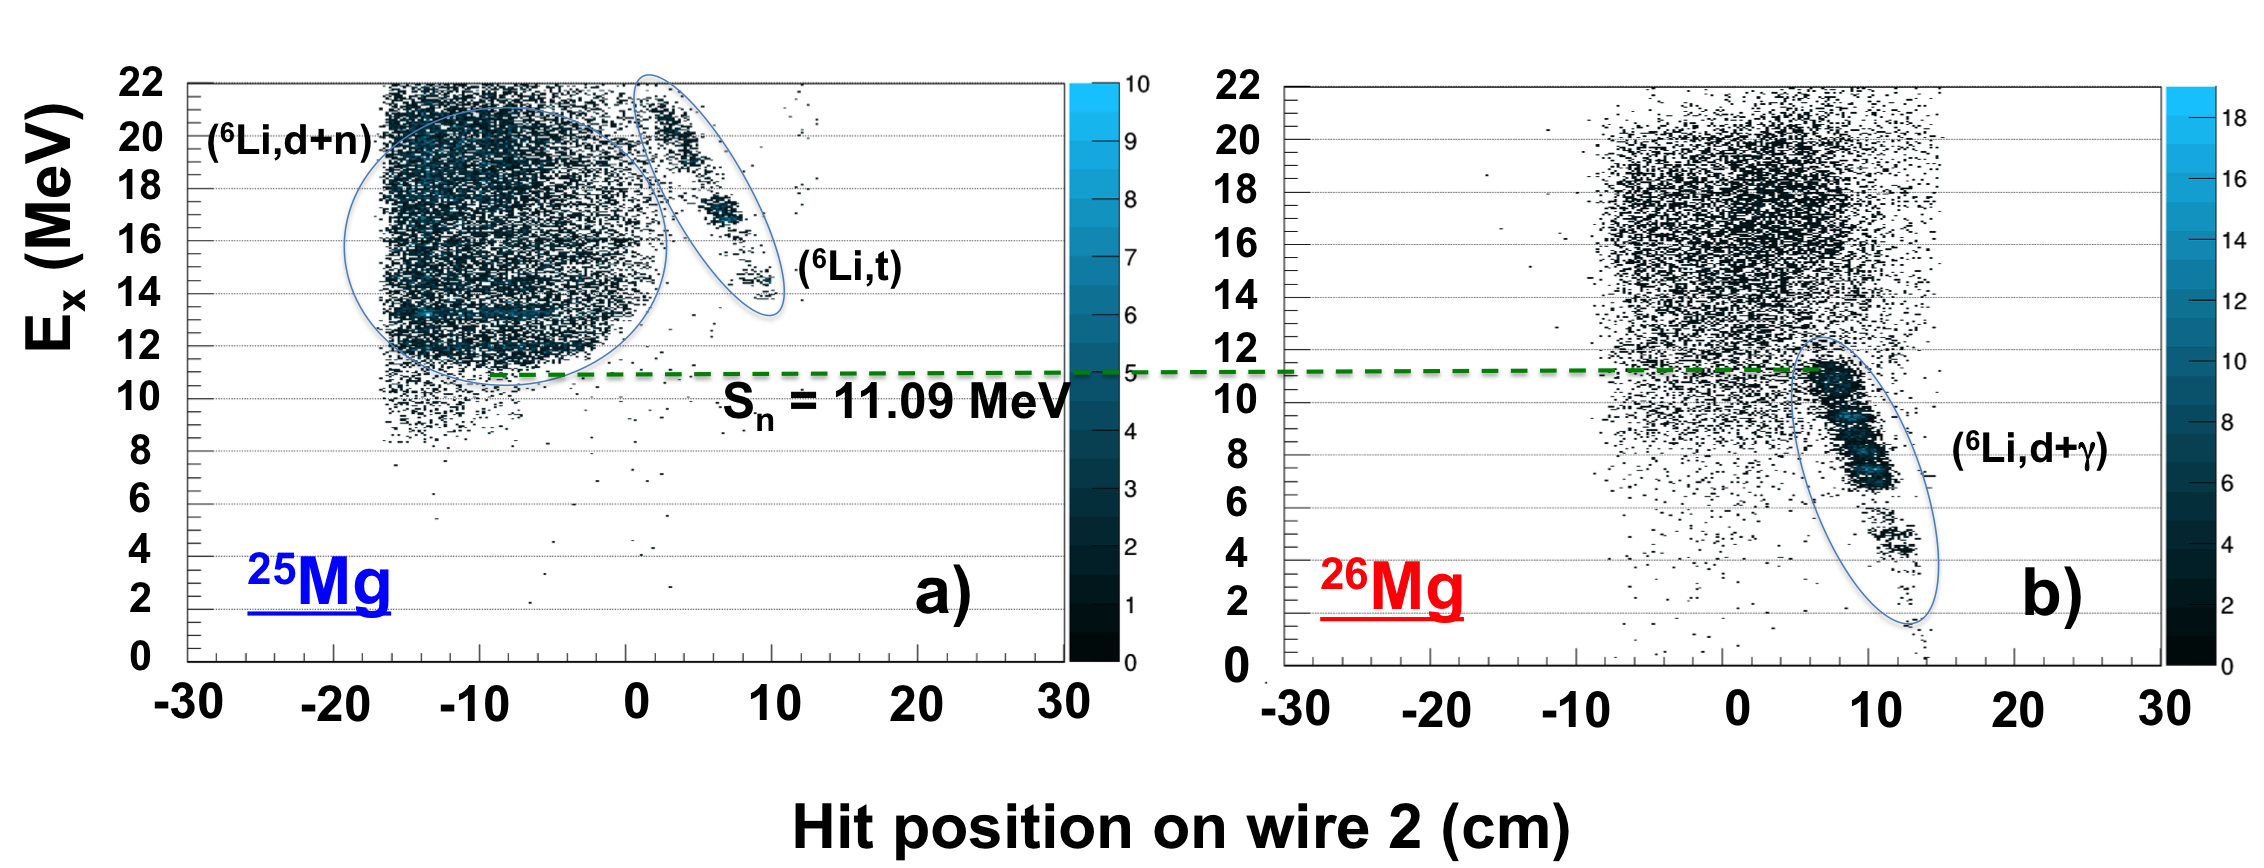
Figure 4 shows the correlation of the recoil particle positions at the focal plane and 26Mg excitation energies calculated from the Hyball signals assuming the 22Ne(6Li,)26Mg reaction. Clear correlations are seen in both figures, which are gated on 25,26Mg recoils, respectively. These correlated loci correspond to two separate binary reaction mechanisms as explained below. Since the Hyball detector does not have particle identification capability, this correlation is essential to separate the two binary reactions observed in this study. The observed correlations occur because the 25,26Mg recoils have lower kinematic energies when they are more highly excited in the binary reactions. Thus recoils with increasing excitation energy move towards the lower-rigidity (decreased position) side of the focal plane. It is also noticeable that the correlation disappears from 26Mg events when the excitation energy becomes greater than the neutron separation energy (11.09 MeV). Instead, the excited 26Mg decays into . This process gives a substantial momentum kick to 25Mg following the neutron decay, which effectively destroys the kinematic correlations especially for large neutron decay energies (e.g., 12 MeV).
If only 22Ne(6Li,)26Mg reactions were present, it would be expected that the - plot gated on 25Mg events would display no kinematic correlation, as all events would arise from the 22Ne(6Li,) process described above. However, it is clear from Figure 4(b) that a correlated locus occurs in the high excitation energy and the large positive -position side of the plot. This correlation occurs because these events arise from the 22Ne(6Li,)25Mg reaction. The association of these events with the reaction channel is confirmed by calculating the excitation energy assuming the reaction mechanism. When calculated as such, the excitation energy spectrum starts from 0 MeV as would be expected (see Figure 5). This reaction mechanism is further discussed in Section III.2.
In the figures, background events can be seen behind the correlated loci of binary reactions. These events are mostly due to protons arising from compound nuclear reactions. We confirmed this by constructing the same plots using Barrel-MDM coincidence events. In the barrel, light-particle identification is possible using the - method (see 2(b)), and the observed uncorrelated events were thus identified to be protons. In the binary-reaction analysis, the shape of the proton background was estimated from the uncorrelated events located near the binary events in Figure 4. These background contributions composed – of the total events, and were subtracted in bulk in the final excitation energy spectrum.

III.2 22Ne(6Li,)25Mg reaction
We analyzed the 22Ne(6Li,)25Mg data to identify the states in 25Mg that are strongly populated in this reaction and determine their spectroscopic factors. To date, there are no published data on the 22Ne(6Li,)25Mg reaction and hence this represents the first analysis of states in 25Mg populated through this reaction mechanism. However, the (6Li,) reaction mechanism has been studied on a variety of light-to-medium mass targets including 13C Bassani1969 ; Bassani1971 ; Avila2018 , 16O Panagiotou1972 ; Garrett1972 ; Martz1979 , 24Mg, 28Si, 40Ca, 54,56Fe, and 58Ni Lindgren1974 ; Woods1978 , as a potential method for spectroscopy. Most of these studies were carried out in the 1970s or earlier except for the recent 13C(6Li,) study of Ref. Avila2018 . Despite the large binding energy (15.8 MeV), appreciable +3He clustering in the ground state of 6Li is reported in those past studies.
A few potential direct reaction mechanisms were proposed in the earlier (6Li,) studies. One is that the proton pair goes into the lowest accessible orbits, while the odd neutron is transferred into single-particle states (in the present experiment, this would populate a similar set of 25Mg states as 24Mg()25Mg) Woods1978 . Another possibility is that one proton is transferred to the lowest-available orbital and the remaining proton-neutron pair is transferred as in the (,) reaction (analogous to 23Na()25Mg in the present case) Bassani1971 . Finally, an analogous mechanism to direct () reactions with transfer of a 3He cluster (22Ne()25Mg at present) has also been proposed Woods1978 . However, the reaction’s selectivity in populating the specific levels observed in the past experiments Bassani1969 ; Bassani1971 ; Panagiotou1972 ; Lindgren1974 ; Woods1978 are not universally explained by any of the above mechanisms.
The background-subtracted 25Mg excitation spectrum from the present experiment is shown in Figure 5. A number of narrow small peaks and some large peaks are evident, indicating the strongly selective population of discrete states through a direct transfer mechanism. This is consistent with existing (6Li,) studies. Due to the low statistics, we were unable to perform a particle- coincidence analysis to unambiguously identify the populated states through their -ray transitions. Instead, we made a tentative assignment of the populated states based purely on excitation energies observed from (the excitation energy uncertainty is 20 keV). Due to the energy resolution of the present setup (200 keV), it is possible that the observed peaks may contain transitions to two or more states. Hence, for each peak we have performed a separate analysis of all candidate states that overlap in energy.
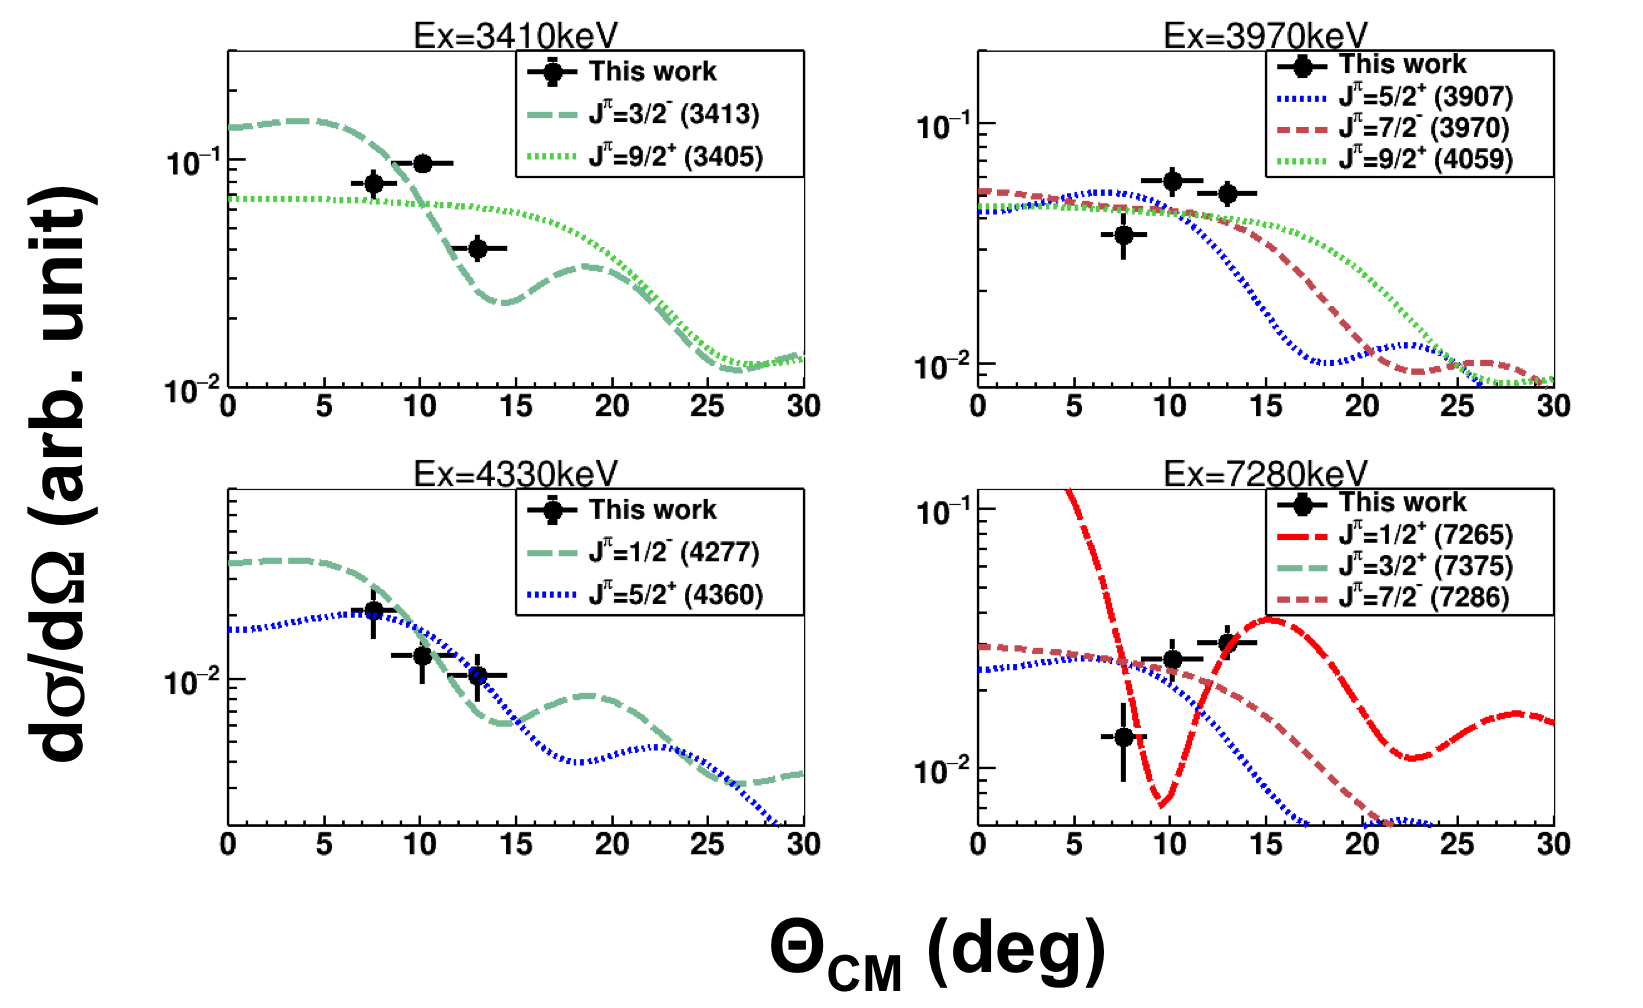
The strongest peaks in the observed spectrum appear at =3410 (=3/2-), 3973 (7/2-), 4277 (1/2-), and 7280 (7/2-) keV, respectively. Notably, these peaks all appear at energies that are close to known negative parity states, only a handful of which exist, especially in the low energy range (5 MeV) NNDC2018 . If these peaks do indeed correspond to the negative parity candidate states, this suggests a possible strong contribution from the shell. The =3410, 3973, 4277 keV states are rotational members of the =1/2- band ([]=[330 1/2]), which is obtained from one-particle excitation in the -shell Ropke1974 ; Heidinger1991 ; Hamamoto2012 . It is therefore reasonable to deduce that the mechanism is similar to transfer of a neutron into the shell in 24Mg(. The spectra obtained by 24Mg( reactions are indeed similar to our spectra to some degree, e.g. showing highly populated =3410, 3973, 4277, and 7200 keV states Heidinger1991 ; Meurders1975 ; Hinds1957 .
Concerning the other two proposed transfer mechanisms, there are currently no 23Na() reaction data available for comparison, and while some relevant 22Ne() data do exist Butler1975 ; Christiansson1976 ; Heidinger1991 , the associated publications do not show excitation spectra of 25Mg or report specific selectivity of the reaction. As a result comparisons with () or () spectra are not currently possible.
Another point of interest is that our (6Li,)25Mg spectra continues beyond the neutron separation energy (=7331 keV) up to =8.5–9 MeV, without neutron decaying into 24Mg (note the spectrum is gated on 25Mg). This indicates high spin states, are populated since these states would have a suppressed neutron decay probability resulting from the large centrifugal barrier. The enhancement of high-spin states is to be expected due to the highly negative -value of the reaction ( MeV). However, we also note that similar high spin states were observed by the 24Mg() reaction Heidinger1991 .
Figure 6 shows the angular distribution of =3410, 3973, 4330, and 7280 keV peaks. DWBA calculations were made in the same manner as Ref. Ota2019 using the optical potential parameters Li2007 in Table 3. The calculations were compared with the data to extract spectroscopic factors given by , along with spin-parity assignments. The results of this analysis are shown in Table 2. The cross sections and spectroscopic factors were extracted using a similar normalization technique to the data (Section II.4), i.e. normalizing to elastic scattering cross sections in the Barrel detector. While this technique produced cross sections that are in the ballpark of expected (6Li,) cross sections, the elastic-scattering spectra unfortunately contained unknown levels of contamination from F and C components of the target. As a result, the cross sections and spectroscopic factors should be cautiously treated as being arbitrarily normalized. However, comparisons of relative spectroscopic factors between states are expected to be robust.
In the following paragraph, we discuss some of the extracted features of the most strongly observed peaks in the spectrum. Since these peaks may contain two or more unresolved states, we have used the shapes of the measured angular distributions to determine the most likely constituents, when possible. Additionally, we have used the published 24Mg() data as a tentative guide to understanding the spectrum. This follows the arguments given previously that the (6Li,) reaction may populate a similar set of states as 24Mg(). A similar analysis was performed for the less strongly populated peaks in the spectrum, with results reported in Table 2.
The =3410 keV peak is likely to be dominated by the 3413 keV (=3/2-) state, as the calculated angular distribution is a much better match to the data. This is consistent with the 24Mg() experiment, which also shows a much stronger transition to the 3414 keV state, compared to the 3405 keV state Meurders1975 . The =3970 keV peak may come from multiple candidate states—3907 keV (=5/2+), 3970 keV (=7/2-), or 4059 keV (=9/2+). All of these candidate states have calculated angular distributions consistent with the data. For the =4277 keV peak, both the 4277 keV (=1/2-) and 4360 keV (=5/2+) keV states are possibilities, having angular distributions consistent with the data. These two peaks, however, are also likely to be dominated by one single state, (3970 and 4277 keV, respectively), again following the 24Mg() experiment. The =7280 keV peak likely comes from the 7265 keV state (=1/2+).
Despite the difficulty of interpreting the present spectrum, the selectivity observed in detail in the (6Li,) reaction indicates that it may be a useful tool for future nuclear structure studies, e.g., as an experimental alternative to use of () reaction, including experiments utilizing unstable beams in inverse kinematics. The disadvantage is that the theoretical interpretation and the direct reaction mechanism are significantly more complex.
| (keV) | ||
|---|---|---|
Li2007 . All radii except those for the + channel are given such that . For the channel, . Channel (fm) (MeV) (fm) (fm) (MeV) (fm) (fm) (MeV) (fm) (fm) (MeV) (fm) (fm) 22Ne+6Li 1.30 117.04 1.80 0.40 48.60 1.99 0.62 26Mg+ 1.30 79.07 1.17 0.79 2.99 1.33 0.74 10.51 1.33 0.74 5.88 1.07 0.66 + 1.90 111Adjusted to give the correct 6Li binding energy 1.90 0.65 Final State 1.40 222Adjusted to give the correct final state binding/resonance energy 1.40 0.70 25Mg+ 1.42 149.57 1.07 0.74 9.65 1.26 1.18 31.95 1.09 0.85 1.90 0.51 0.20 3He+ 1.25 111Adjusted to give the correct 6Li binding energy 1.25 0.65 Final State 1.40 333Adjusted to give the correct final state binding energy 1.40 0.70
IV 22Ne(6Li,)26Mg reaction
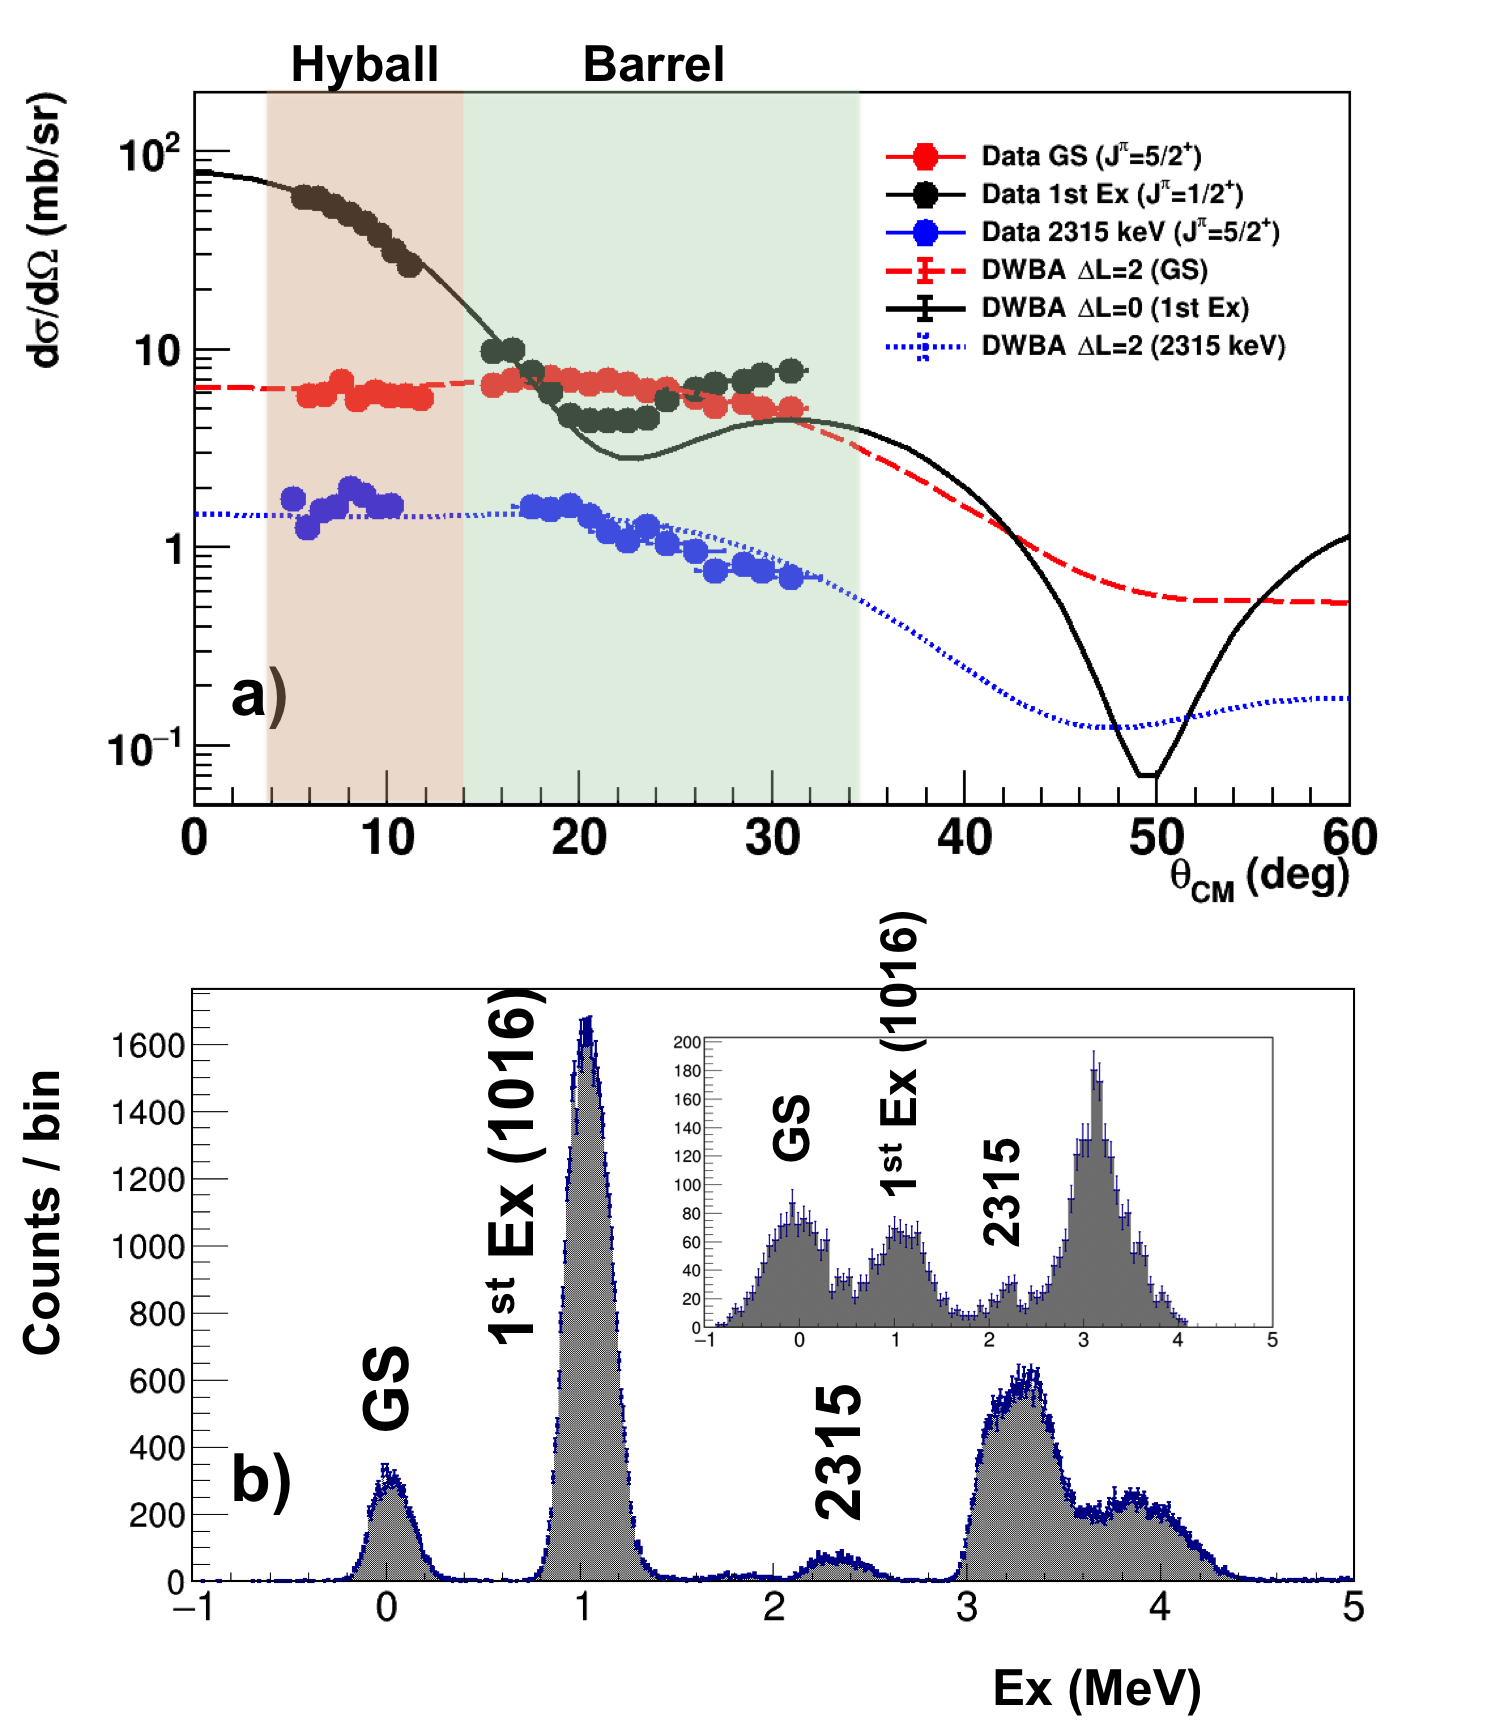
Figure 7 shows the 26Mg excitation spectrum obtained from the reaction in the present experiment. A number of resolved and unresolved peaks are evident. In the following sections, the states populated in the reaction are identified and analyzed using the angular distributions of the deuterons, along with the coincident rays detected in the HPGe detectors. The assumed states thus identified are annotated in Figure 7. We also compare our results with those of past (normal kinematics) studies: Refs. Anantaraman1977 ; Giesen1993 ; Ugalde2007 ; Talwar2016 , which utilized 6Li beams with energies of 5.3 Anantaraman1977 , 5.3 Giesen1993 , 5.0 Ugalde2007 , and 13.5 MeV/nucleon Talwar2016 , respectively. The previous studies varied in the range of excitation energies to which they were sensitive: 0–9 MeV (but with peaks identified and analyzed only up to 5.7 MeV) Anantaraman1977 , 9.3–12 MeV Giesen1993 , 9–11 MeV Ugalde2007 , and 7.3–11.4 MeV Talwar2016 . The present experiment is sensitive to MeV. Below MeV, the ejected deuterons punch through the Hyball, and 26Mg recoils are also outside of the Oxford detector acceptance window.
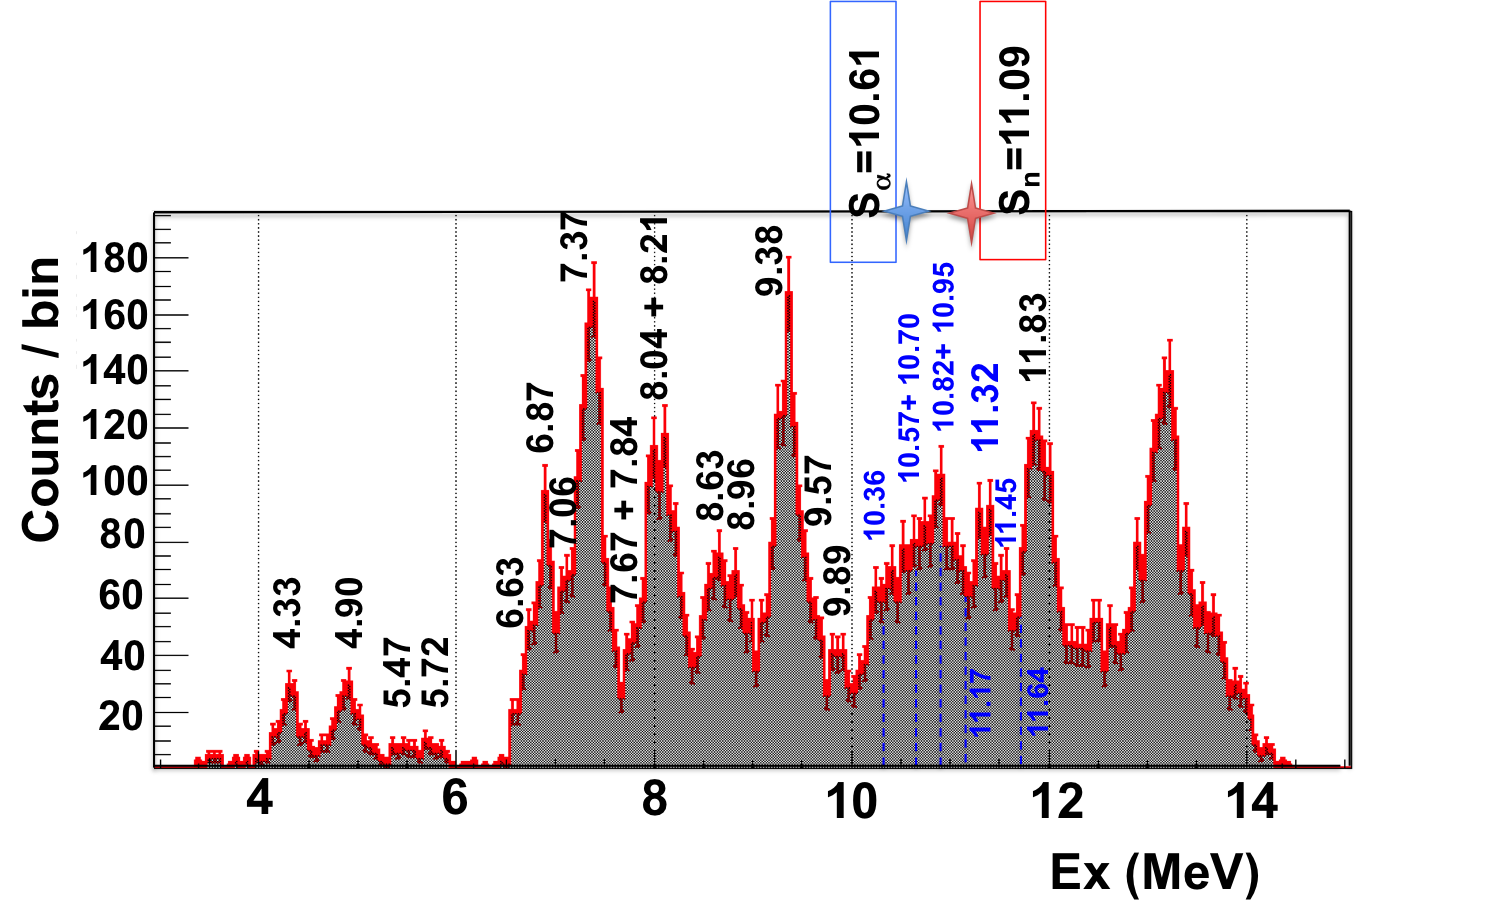
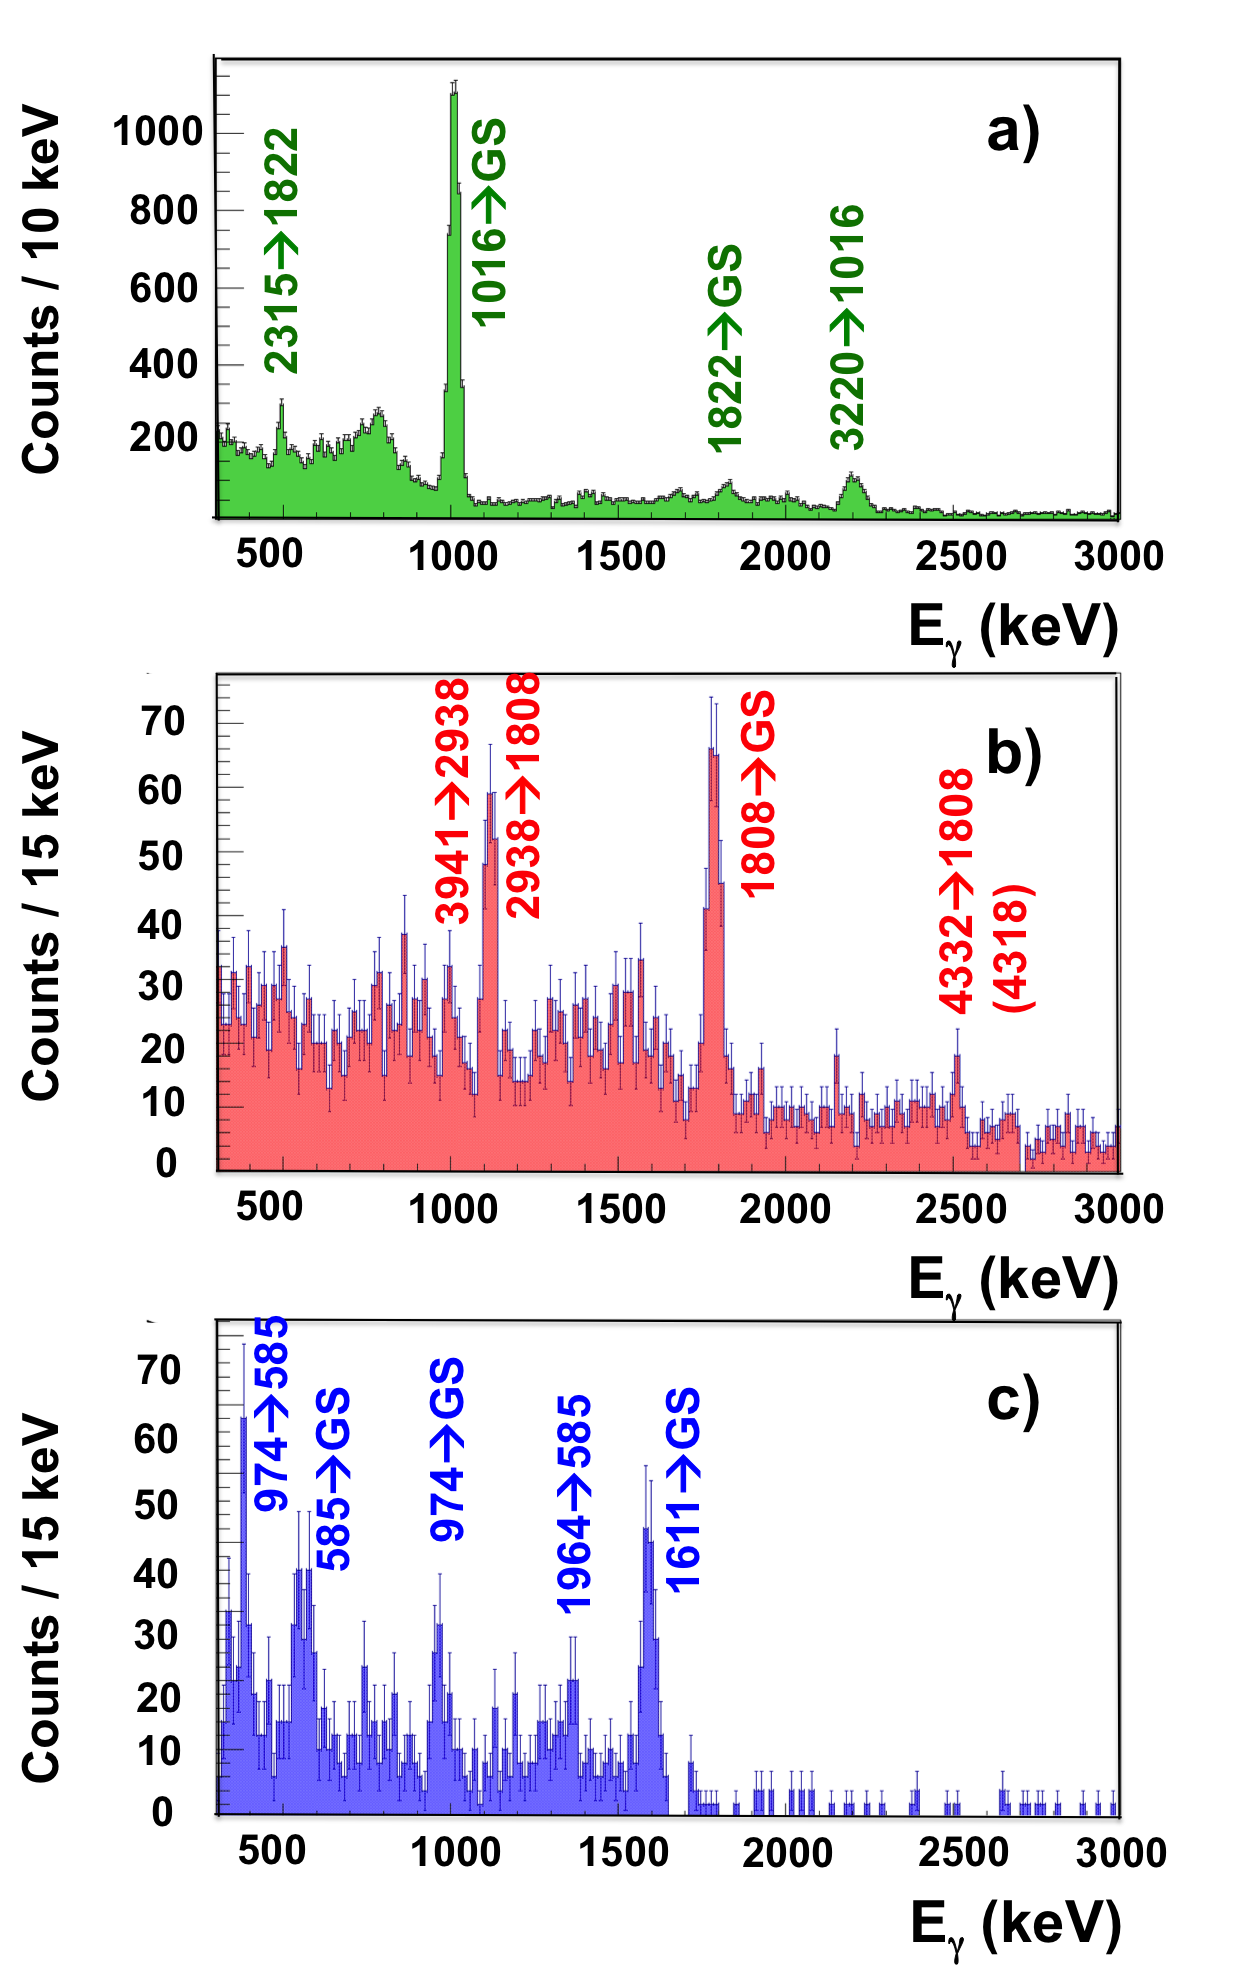
Figure 8 shows -ray spectra in coincidence with 25,26Mg, as well as the spectrum of -rays in coincidence with from the measurement (Section II.4). The high statistics of the latter spectrum make it a useful guide in interpreting the rays from the measurement. Before discussing the -ray spectra in coincidence with specific excitation energy regions, we briefly discuss some features of the total spectrum here.
In the 26Mg coincidence data, two large peaks (first excited state: 1808GS) and (second excited state: 29381808) are evident. This is to be expected as these transitions are fed by a large number of higher-lying states. Additionally, small peaks (4318/4332/43501808) and (39412938) are present. These smaller peaks are more easily observed when we gate on a specific excitation energy from the deuteron spectrum, as discussed in the subsequent sections. In addition to the prominent peaks, we also observe a background from Compton scattering (our HPGe detectors are not Compton-suppressed). To better understand this, we used the high-statistics 22Ne() data (Figure 8a) to estimate the ratio of events in the well-separated 1016 and 2203 keV photopeaks to their respective Compton edges. This analysis suggests a 20–25% ratio for –2 MeV -rays.
In the bottom panel of Figure 8, we show the -ray spectrum in coincidence with 25Mg recoils and deuterons in the 11–14 MeV excitation energy range of 26Mg. The observed rays correspond to transitions in 25Mg following neutron evaporation of states in 26Mg. We observe 384, 585, 974, 1611 keV -ray transitions from the first, second, and third excited states of 25Mg, suggesting that states in this region have a significant neutron decay branch to low-lying excited 25Mg states. This is consistent with Ref. Wolke1989 , which reported significant and strengths for a number of states observed in a direct experiment. Since we do not measure neutrons, it is not realistic to estimate the populated 26Mg states from the -ray transitions alone. However, limited information about the decay properties of 26Mg states in this region can still be obtained from the coincident -ray analysis, as discussed in Section IV.1.13.
deuterons.
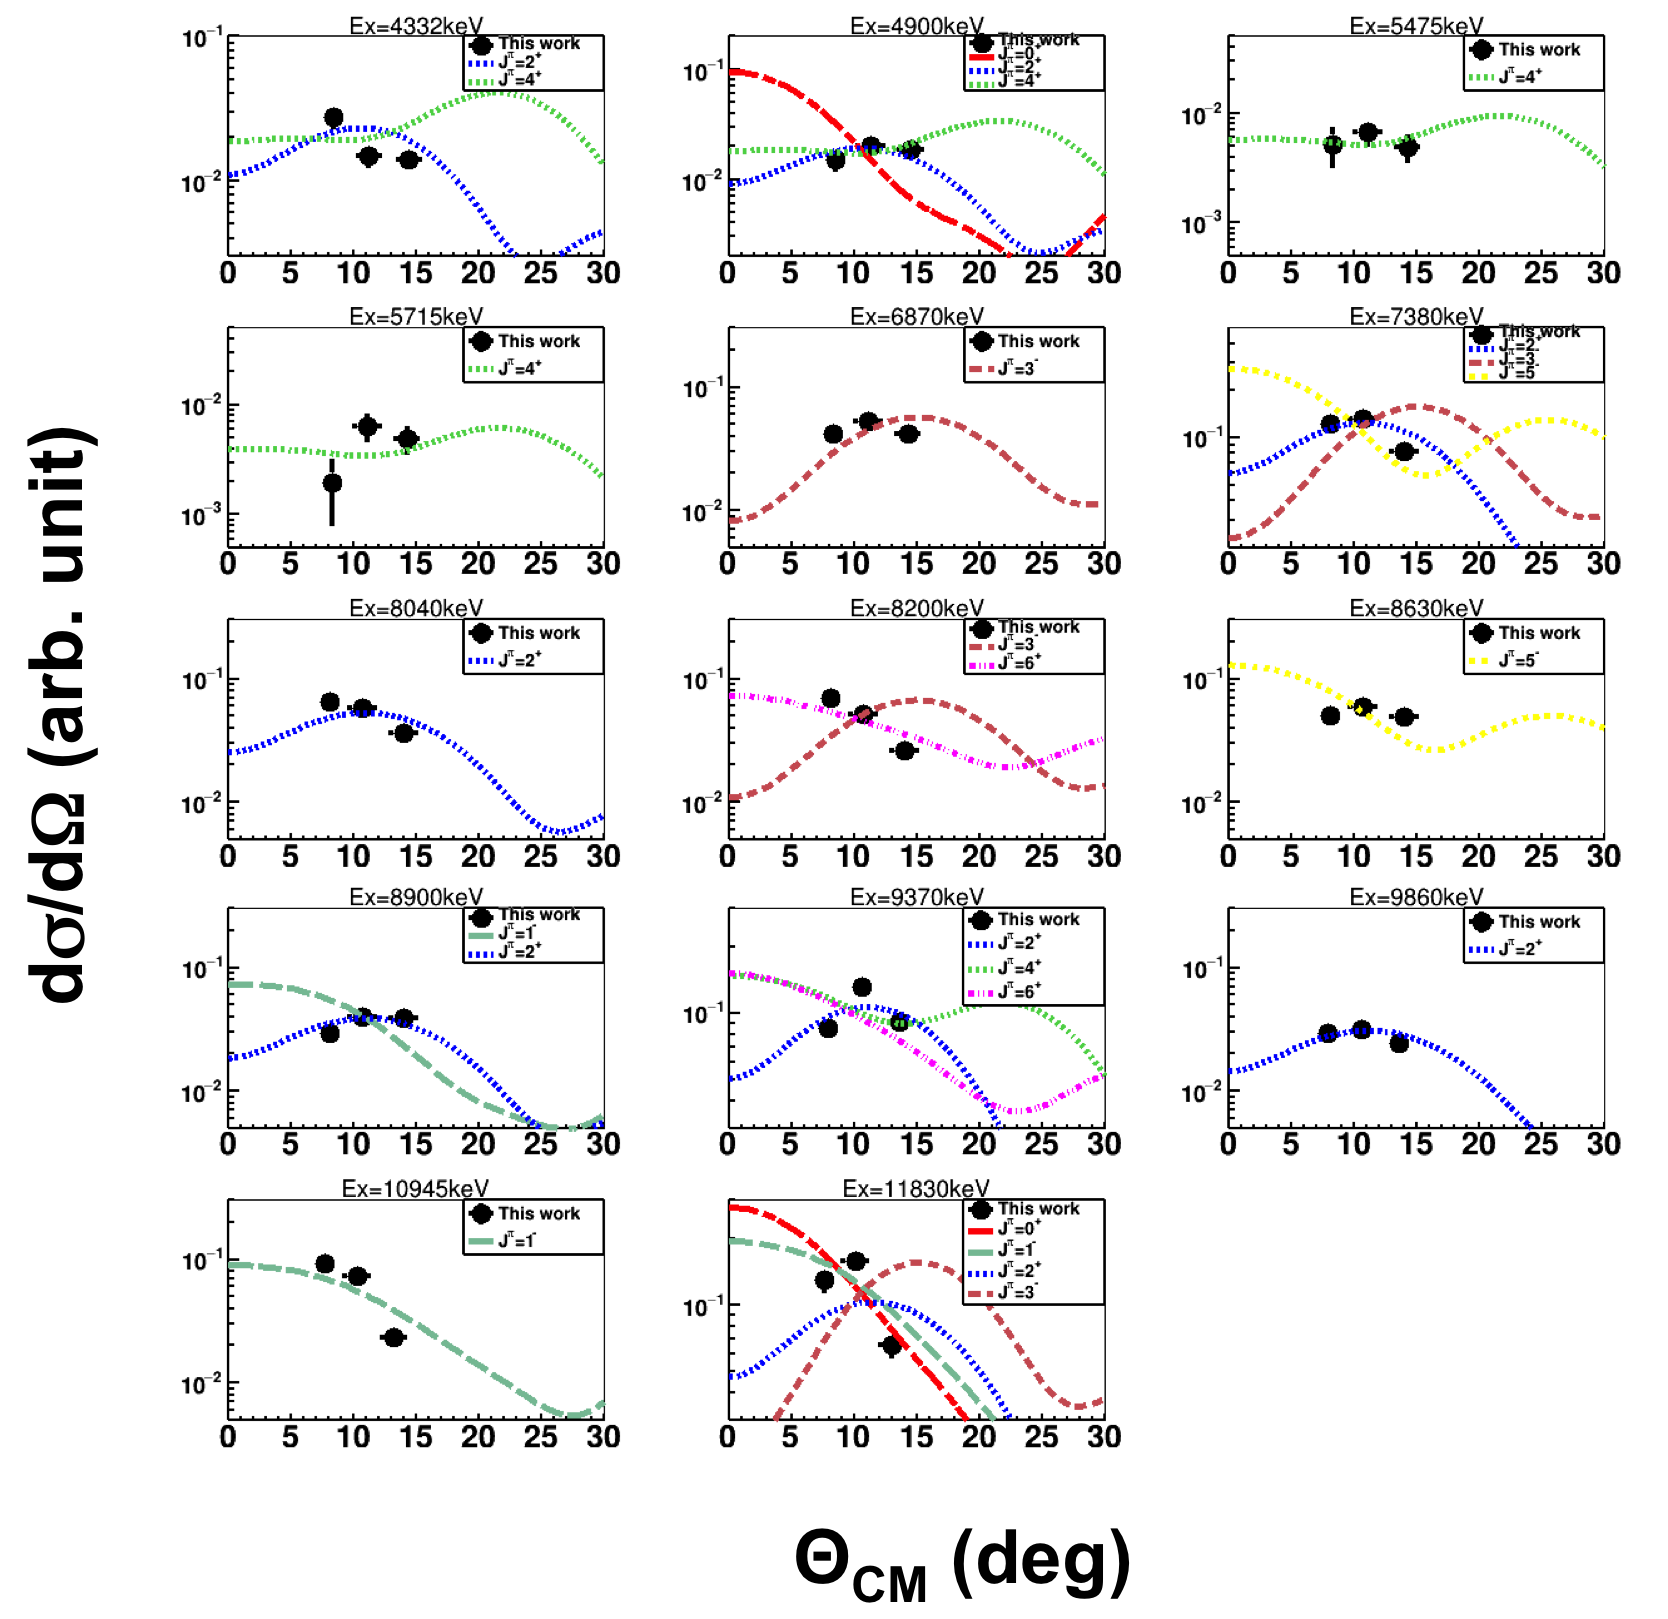
After identifying the set of populated states, using particle- coincidences with the help of past (6Li,) data, we performed a multiple Gaussian fit to peaks in the deuteron-reconstructed excitation energy spectrum. These fits were then used to determine cross sections and angular distributions of a given peak. For the fits, the centroid of each Gaussian was taken to be the literature energy of the corresponding state, and the width of each Gaussian was set according to the experimental energy resolution (FWHM 200-250 keV, depending on excitation energy). Amplitudes were allowed to freely vary, and the resulting Gaussian integrals were used to determine a differential cross section for each state. The resulting angular distributions for each of the noticable peaks in the deuteron spectrum are displayed in Figure 9. Using these distributions, spins and relative spectroscopic factors were calculated, as presented in Table 4 and discussed in Section IV.2.
IV.1 Populated states
Figure 10 shows -ray spectra in coincidence with specific 26Mg total excitation energy ranges. Simple Monte Carlo simulations of spectra from the respective states were also made to estimate the expected counts of respective -ray transitions, with the level table NNDC2018 and our HPGe detector efficiency as inputs. Background counts by random coincidence were estimated from events located near the photopeaks of interest.

IV.1.1 =4.0 – 4.6 MeV
Possible states making up the peak in this region are 4.318 (4+) or 4.332 MeV (2+). The possible transitions from states in this region are therefore (43181808G.S.) (99%) and (43321808G.S.) (79%) / (433229381808G.S.) (15%), where percentages in parenthesis denote the -decay branching ratios from the state. Since there seems to be the 1394 keV transition from 43322938 keV, as well as the subsequent 1129 keV transition from 29381808 keV, it is most likely that the peak exclusively consists of the 4332 keV state. There are total deuteron events in the peak, and these two coincident -ray transitions both contain 3–5 counts after background subtraction. These rates are slightly higher than, but statistically consistent with, the expected 1–2 counts in these peaks after accounting for branching ratios and detection efficiencies. From both states, 3–5 counts of another major transition (2510/2523 keV) are expected. No such transitions are, however, observed. The assignment of the 4.332 MeV state is supported by the angular distribution, which is consistent with a 2+ DWBA calculation (see Figure 9).
IV.1.2 =4.6 – 5.2 MeV
There is an evident peak around =4.901 MeV (4+), which could be contaminated by =4.835 MeV (2+) or 4.972 MeV (0+). Figure 10 shows the coincident spectrum. While 4.835 and 4.970 MeV states have the major 1129 keV transition (29381808) with expected 6–7 counts, this line is not present in the -ray spectrum. Therefore, the 4.901 MeV state is likely the main contributor to the peak. This is supported by our angular distribution, which is consistent with 2+ or 4+ calculations. We note that the 1808 keV -transition (1808GS) is expected from any of the candidate states with 100% probability. The observed number of 1808 keV events (5 counts) is consistent with the expectations for this peak (5–6 counts for any of the states).
IV.1.3 =5.2 – 6.0 MeV
There is a small peak on the left side of this region, which we assign to the =5.476 MeV (4+) state reported by Ref. Anantaraman1977 . No clear evidence for the population of this state can be found in the -ray spectrum; however, the angular distribution is consistent with the 4+ calculation.
Another small peak (on the right side of this region) is assigned to the 5.715 MeV state (4+), also reported by Ref. Anantaraman1977 . For this peak, no decisive -ray transition was observed due to poor statistics. Our measured angular distribution agrees poorly with the 4+ calculation; however, the same inconsistency is observed in Ref. Anantaraman1977 , where it is attributed to possible multi-step reaction contributions.
IV.1.4 =6.0 – 7.0 MeV
There are no states populated between =6.0 – 6.5 MeV, which agrees well with Ref. Anantaraman1977 . A coincident 1808 keV -ray transition is clearly seen in coincidence with the excitation range of 6.5–7 MeV. This supports population of the =6.876 MeV (3-) state, which dominantly decays via the 1808 keV transition. This assignment is further supported by agreement of the angular distribution with the 3- calculations. It is also worth mentioning that Ref. Anantaraman1977 observed states at 6.63 and 7.06 MeV as well, but with much weaker intensity than the 6.876 MeV. Evidence for a MeV shoulder is present in the deuteron spectrum, although no clear rays from this state are observed. We also note that there appears to be a -ray transition around 1600 keV in coincidence with this excitation region, even though no known states populated by (6Li,) reactions are expected to generate this -ray Glatz1986 ; NNDC2018 .
IV.1.5 =7.0 – 7.7 MeV
The large peak observed in this region by this and other (6Li, ) experiments Anantaraman1977 ; Talwar2016 could arise from any of the 7.348, 7.371, or 7.396 keV states NNDC2018 . The coincident -ray spectrum shows two strong transitions at 1808 and 1129 keV (i.e., decay through the =2.938 MeV state), with another peak at 2510 keV. The 7.371 and 7.396 MeV states have dominant -ray transitions at 1003 keV and 1680 keV (expected 11 and 17 counts each), respectively. Neither of these transitions are observed, leading to the conclusion that the peak is dominated by the 7.348 MeV state (3-), together with the consistency between observed and expected 1129, 1808 keV, and 2510 keV counts for this state (30, 30, and 7 counts, respectively). However, the observed angular distribution is not consistent with the 3- calculation. Therefore, an unambiguous assignment is not possible in this region.
IV.1.6 =7.7 – 8.3 MeV
There is a peak at =8.04 MeV, which is likely a doublet consisting of the 8.034 (2+) and 8.201 MeV (6+) states seen by Anantaraman et al. Anantaraman1977 and Talwar et al. Talwar2016 . The observed angular distribution supports both 2+ and 6+ assignments; however, the -ray spectrum indicates that the 8.034 MeV state is dominant. Two -ray transitions are strongly observed: 1129 and 1808 keV, and additionally there is evidence for a 511 keV transition. The presence of the 511 keV line would be expected from the high-energy (80342938) transition from the 8.034 MeV state. At the same time, the lack of a 2510 keV transition suggests an absence of the 8.201 MeV state, which is expected to give a 2510 keV line with the intensity of the 1808 keV line. Similarly, the roughly equal 1129 and 1808 keV intensities observed in the spectrum are not consistent with decay from the 8.201 MeV state, which is expected to produce the 1129 keV line with only as many counts as the 1808 keV transition.
The absence of the 8.201 MeV state is inconsistent with the results of Talwar et al.; however, this may be due to the higher beam energy used in that study, which increases population of high-spin states.
IV.1.7 =8.3 – 9.0 MeV
There are two peaks at =8.63 and 8.93 MeV observed by Talwar et al. Talwar2016 , and seemingly Anantaraman et al. Anantaraman1977 as well. The -ray spectrum shows some possible transitions, including the 1129 and 1808 keV. Presence of the =8625 keV state (5-) and 8931 keV state (1- or 2+) both explain these transitions well. The observed angular distribution is inconsistent with the 8625 (5-) assignment, while it is consistent with the 8931 (2+) assignment.
IV.1.8 =9.0 – 9.7 MeV
In this region there is a strong peak observed by Talwar et al. Talwar2016 , Giesen et al. Giesen1993 , and Ugalde et al. Ugalde2007 . Possible states in this region are 9.325 (Ugalde), 9.371, and 9.383 (Talwar) MeV. Looking at the -ray spectrum, the number of observed 1129 keV and 1808 keV counts are almost the same. Hence, it is probable that a large fraction of transitions occur via the 2938 keV state. There is also a noticeable transition from either the 2510 or 2523 keV ray, which indicates decay via the 4318 or 4331 keV state (1808 or 29381808).
If the peak is dominated by the 9.371 MeV state, a 1003 keV -ray transition (39412938) is expected to be observed, with similar intensity to the 1129 keV and 1808 keV transitions. This is seen in the spectrum; thus it is possible the 9.371 MeV state is a significant contributor to the peak. If the peak is dominated by the =9.325 MeV state, the 2510/2523 keV -ray transition is expected with fewer counts than a dominant =9.383 MeV state (expected and 10 counts, respectively). However, due to the low numbers of expected and observed counts, we cannot make a definitive distinction between these two states on this basis.
Turning to the angular distributions, the observed shape supports a 2+ assignment. This tentatively favors a dominant 9.325 MeV state, which is reported to have spins in the ranging from 2+ to 4+ NNDC2018 . Conversely, the 9.383 MeV state claimed by Talwar et al. was reported having 0+ or 1- Talwar2016 , or 6+ NNDC2018 , and the 9.371 MeV state was reported having 4+ NNDC2018 , neither of which (although 0+ and 1- are not shown in the figure) is not consistent with the present data.
IV.1.9 =9.7 – 10.0 MeV
While Talwar et al. and Giesen et al. both report a state at =9.99 MeV, we instead observed a peak at 9.856 MeV. The angular distribution supports a 2+ assignment, which agrees with our assignment to the 2+, 9.856 MeV state NNDC2018 . No clear -ray transitions were observed in this region.
IV.1.10 =10 – 10.7 MeV
In this excitation region, clear -ray peaks are observed at 1003, 1129, and 1808 keV. The states observed in past (6Li, ) measurements are 10.36, 10.57, 10.70 MeV Giesen1993 ; Talwar2016 (note that Talwar et al. Talwar2016 did not observe the 10.57 MeV state). For the 10.57 MeV state, reliable -ray transition data are also available from a () experiment Longland2012 . Possible candidate states around the 10.36 MeV region are 10.362 and 10.377 MeV NNDC2018 . The 10.362 MeV state decays dominantly via the 103621808GS scheme with some weaker schemes, generating a 100% 1808 keV ray which is several times more intense than the next strongest transition (1129 keV). The 10.377 MeV state can emit a 1003 keV -ray with some strength (25%) after transitioning through the 5.715 MeV state (5.7154.3501.808GS or 5.7153.9412.9381.808GS). Hence both are reasonably consistent with the observed -ray spectrum.
The 10.57 MeV state reported by Longland et al. Longland2012 decays through the 4.972 MeV state, generating 1129, 1808, 2003 keV rays. For this decay scheme, the 2003 keV transition is expected to have nearly half the intensity of the 1808 keV transition. We do not observe a 2003 keV transition at all, making it likely that the 10.57 MeV state is only weakly populated. This agrees with both Giesen et al. Giesen1993 and Talwar et al. Talwar2016 .
The counts around 10.70 MeV can arise from two possible candidate states. The first is at 10.707 MeV and decays via the 5.715 MeV state. The second is at 10.693 MeV that also decays through the 5.715 (10.6937.3965.715). Thus, the two states generate similar -ray spectra, except for the 1680 keV transition from (7.3965.715) in the 10.693 MeV state. Both states generate a 1129 and 1003 keV transition (via the 2.938 and 3.941 MeV states, respectively), so the observed -ray transitions could be attributed to either candidate. However, since the 1680 keV transition is not observed, the 10.707 MeV state is more likely as a candidate for the 10.70 MeV state populated by other (6Li,) experiments.
Taking the observed -rays into consideration, it is likely that multiplets near both 10.36 MeV and 10.7 MeV are present. However, the identifying -ray transitions are not seen, e.g., the 1003 keV transition, in coincidence with the –11.1 MeV region (where half of the strength of a state around 10.7 MeV is expected to lie). This indicates that population of states near 10.7 MeV is weak. This is supported by both Giesen et al. and Talwar et al., who report the 10.36 MeV as being the strongest of the three observed states.
Further assignment to specific states is not possible given the energy resolution and ambiguous origin of the observed rays. Similarly, we made no attempt to extract angular distributions due to the complicated and uncertain mix of multiple states in this region.
IV.1.11 =10.7 – 11.1 MeV
States observed in the past (6Li, ) experiments are the 10.805 (or 10.823) and 10.949 MeV. The -ray spectrum shows only a single strong transition at 1808 keV. This indicates there there is a direct transition from the initial state to the 1808 keV state. This agrees with both the 10.805 and 10.949 MeV states observed by Longland et al. Longland2012 (78% and 95% via the 1808 keV, respectively). It also rules out the possibility of the 10.823 MeV state being strongly populated since comparable 1129 and 1808 keV transitions are expected from that state, according to the findings of Lotay et al. Lotay2019 , who observed that the 10.823 MeV state decays via the 5.476 MeV state, which should generate 1157, 1808, and 2510 keV rays (assuming the 10.8235.746 MeV transition is dominant). In contrast, only the 1808 keV line is present in our spectrum.
It was not possible to draw any further conclusions about the relative intensities of the 10.805 and 10.953 MeV states composing the peak. Similarly, we did not attempt to construct an angular distribution due to the uncertain mix of states in this region.
IV.1.12 =11.1 – 11.5 MeV
This region includes excitation energies above the neutron decay threshold, and here (in the lower-middle panel of Fig. 10) we show only -ray transitions in coincidence with 26Mg recoils. The astrophysically-important peak at =11.32 MeV in the deuteron spectrum can be clearly observed, consistent with Giesen et al. and Talwar et al. According to past measurements Wolke1989 ; NNDC2018 , this state decays directly via the 1808 keV state (11.3181.808) with 474%, through the 11.3187.060GS scheme (191%), or through the 11.3187.0603588 scheme (181%), or 11.3187.0602938 scheme (5.30.4%), or 11.3187.0601808 scheme (110.8%). All together, the expected 1808 keV -ray probability from this state is 815%. Considering the -ray branchings, the deuteron events in this peak in coincidence with 26Mg recoils, and the 5 -ray detection efficiency at 1808 keV, we expect to see 71 1808 keV counts from the 11.32 MeV state. This is consistent with the 103 counts seen for this peak. The next-most-probable transition from the 11.32 MeV state is the 1129 keV line (29381808). This has an intensity 10% of the total 1808 keV intensity and hence should not be observable above background, which is consistent with our spectrum ( 3 counts after background subtraction).
Concerning other candidate peaks in this region, Lotay et al. observed that the =11.17 MeV level decays via the 5.476 MeV state, which eventually leads to 1129 (69%), 1157 (51%), 2510 (51%), and 1808 keV (100%) rays Lotay2019 . Since we do not observe measurable 1129, 1157 keV and 2510 keV transitions (2–3, 2–3 and 0 counts at most, respectively), it appears that this state is weakly populated compared to the 11.32 MeV. This conclusion is consistent with our earlier publication Ota2019 , which set an upper limit of 0.15 on the spectroscopic factor from an analysis of the 25Mg-gated deuteron spectrum (without considering rays). However, it should be noted that the branching ratio of the transition (11.17 MeV5.476 MeV) is unknown. Thus, assuming the possibility that the decay mode is not dominant, it is not possible to draw a firm conclusion. Lotay et al. also reported that the =11.08 MeV state decays via the 4.318 MeV state, which eventually generates 2510 and 1808 keV rays. We do not observe a transition at 2510 keV. Although branching ratios of the respective decay transitions are not available, assuming the decay via the 4.318 MeV state is dominant, this state appears to also be only weakly populated compared to the =11.32 MeV. This is consistent with both Giesen et al. and Talwar et al., who also failed to observe this state Giesen1993 ; Talwar2016 . However, the state was strongly populated and observed in the sub-Coulomb (6Li, ) and (7Li, ) measurements of Jayatissa et al Jayatissa2019 .
IV.1.13 =11.5 – 12.2 MeV
Peaks in this region are exclusively neutron unbound and hence the corresponding -ray spectrum (lower-right panel of Fig. 10) is gated on 25Mg- coincidences. In particular, we note that the strongly-populated peak at MeV comes in coincidence with a 585 keV -ray transition from the first excited state of 25Mg by (6Li,). We also note that the 585 keV state is an isomer with a ns half life NNDC2018 . Therefore, the average position of 25Mg ions when the -rays are emitted is 10 cm off from the target position along the beam direction (). Given the dimension of our HPGe clover detectors ( cm), a large portion of the -rays are emitted outside the detector array. As a result, the efficiency for observing the delayed rays is significantly lower than for prompt decays. Nevertheless, 5 counts were observed for the transition, which is significantly more than the expected 0.4 counts based on observed 550 counts of deuterons, the reported / ratio of 0.01 Wolke1989 , and 8% -ray efficiency for prompt -rays (note we have not attempted to calculate the reduction in efficiency resulting from the ns half life). This suggests that either the / ratio for this state is significantly larger than reported in Ref. Wolke1989 , or that there are multiple states besides the 11.83 MeV state populated in this region.
IV.2 Relative strength
As mentioned, the partial decay width, , of -unbound resonances within the Gamow window is the most important parameter determining the total stellar reaction rate. For a given spin and resonance energy, this parameter is proportional to the spectroscopic factor, . The spectroscopic factor is also an indicator of possible cluster structures in both bound and unbound states in 26Mg. For a given spin, the spectroscopic factor can be extracted from the angular distributions shown in Fig. 9. Table 4 shows the extracted spectroscopic factors of the states which were clearly observed in the present experiment. Between excitation energies of 5.7–9.3 MeV, this is the first time that individual states have been identified and assigned spectroscopic factors.
As in Ref. Ota2019 , the presented in Table 4 are normalized to the spectroscopic factor for the state at MeV. The for this state was calculated from the ratio , where the single-particle width was calculated numerically from the wave function used in the DWBA calculation. The partial width was taken from the results of direct measurements, , with eV (the weighted average of Refs. Wolke1989 ; Hunt2019 ) and from Ref. Ota2019 . Separate normalizations assuming and were calculated and are presented in Table 4. A separate normalization was also performed to the excited state at 4.332 MeV, which was reported as having in Ref. Anantaraman1977 . For this normalization, was fixed at 0.29, effectively giving the same normalization as Ref. Anantaraman1977 , which fixed .
The spectroscopic factors and associated partial widths (or upper limits) for states from 11.11–11.32 MeV have already been discussed in Ref. Ota2019 . Between 5.7–9.3 MeV, the presently determined spectroscopic factors are reported for the first time. We note the presence of a number of possible strong cluster states (–0.5) in this region. More detailed conclusions about these states would require additional studies that focus more directly on this region. For excitation energies below MeV, we can make direct comparisons to Ref. Anantaraman1977 when normalizing to . In this region, the spectroscopic factor for the =5.475 MeV state agrees with Ref. Anantaraman1977 , while spectroscopic factors for the and MeV states are 2–3 times larger. This latter difference likely results from the present treatment of the observed peak as a single state. In contrast, Ref. Anantaraman1977 treated their peak as a triplet and obtained separate for individual states using a least-squares fit to their angular distribution. We note that the ratios of differential cross sections to the 4.3 and 4.9 MeV states at , are consistent for the two experiments. As a result, we can claim reasonable agreement between observed spectra for states in this region, although the interpretations differ.
Above MeV, we focus on the partial width extracted for the strongly-populated resonance at MeV. This resonance is the dominant contributor to the rate in the high-temperatures ( GK) realized during the C-shell burning phase of the -process. This state has been observed in a number of past direct measurements, which report values of meV Wolke1989 , meV Jaeger2001 , and meV Drotleff1993 . These results are in poor statistical agreement (). Hence, we calculate an inflated weighted average of the three measurements, meV, as prescribed by Longland et al. Longland2012 and use this value for comparisons with the present data.
In Table 5, we show the resonance strength of this state extracted from the present data, calculated as . The calculations were done assuming both and spin-parity for the MeV state (used for normalization) and for separate values of as reported in Ref. Wolke1989 . Taken at face value, the resonance strengths support a assignment to the 11.83 MeV state when compared with the direct-measurement strength of 930(170) meV. We stress, however, that these calculations assume only the 11.83 MeV state exists in the observed peak, whereas both the width of the observed peak and the intensity of coincident 585 keV rays (Section IV.1.13) indicate other states being populated in this energy region—for example at =11.89 or 11.93 MeV. A similar conclusion was also made about the spectrum observed in Ref. Giesen1993 . As a result, the resonance strengths reported in Table 5 are most conservatively treated as upper limits. Taken as such, comparison with the direct measurements rules out the assignment and leaves a possibility for or . The possibility is also consistent with the presently-observed angular distribution (see Fig. 9).
| (keV) | Refs. Giesen1993 ; Talwar2016 ; Anantaraman1977 | ||||
|---|---|---|---|---|---|
| 111Observed by Anantaraman1977 . 5.715 MeV are observed in this work by digitizing the spectrum from Anantaraman1977 . | 666Excitation energies and spin-parities are from NNDC2018 | 0.29(4)111111normalized to Anantaraman1977 , where . | 0.29(4)121212from Anantaraman1977 , normalized to . | ||
| 111Observed by Anantaraman1977 . 5.715 MeV are observed in this work by digitizing the spectrum from Anantaraman1977 . | 666Excitation energies and spin-parities are from NNDC2018 | 0.22(2), 0.45(4) | 0.06(2)121212from Anantaraman1977 , normalized to . , 0.20(4)121212from Anantaraman1977 , normalized to . | ||
| 111Observed by Anantaraman1977 . 5.715 MeV are observed in this work by digitizing the spectrum from Anantaraman1977 . | 666Excitation energies and spin-parities are from NNDC2018 | 0.11(2) | 0.08121212from Anantaraman1977 , normalized to . | ||
| 111Observed by Anantaraman1977 . 5.715 MeV are observed in this work by digitizing the spectrum from Anantaraman1977 . | 666Excitation energies and spin-parities are from NNDC2018 | 0.07(1) | |||
| 111Observed by Anantaraman1977 . 5.715 MeV are observed in this work by digitizing the spectrum from Anantaraman1977 . | 666Excitation energies and spin-parities are from NNDC2018 | 0.40(4) | |||
| 111Observed by Anantaraman1977 . 5.715 MeV are observed in this work by digitizing the spectrum from Anantaraman1977 . 333Observed by Talwar2016 | 777Excitation energies and spin-parities are from Talwar2016 , 666Excitation energies and spin-parities are from NNDC2018 | 1.12(12), 1.12(12) | |||
| 111Observed by Anantaraman1977 . 5.715 MeV are observed in this work by digitizing the spectrum from Anantaraman1977 . 333Observed by Talwar2016 | 777Excitation energies and spin-parities are from Talwar2016 | 0.45(4) | |||
| 111Observed by Anantaraman1977 . 5.715 MeV are observed in this work by digitizing the spectrum from Anantaraman1977 . 333Observed by Talwar2016 | (666Excitation energies and spin-parities are from NNDC2018 | 0.62(8) | |||
| 111Observed by Anantaraman1977 . 5.715 MeV are observed in this work by digitizing the spectrum from Anantaraman1977 . 333Observed by Talwar2016 | 666Excitation energies and spin-parities are from NNDC2018 | 0.36(4) | |||
| 111Observed by Anantaraman1977 . 5.715 MeV are observed in this work by digitizing the spectrum from Anantaraman1977 . 333Observed by Talwar2016 | 777Excitation energies and spin-parities are from Talwar2016 | 0.31(4) | |||
| 111Observed by Anantaraman1977 . 5.715 MeV are observed in this work by digitizing the spectrum from Anantaraman1977 . 222Observed by Giesen1993 333Observed by Talwar2016 444Observed by Ugalde2007 | 0.80(8) | ||||
| 666Excitation energies and spin-parities are from NNDC2018 | 0.22(4) | ||||
| 222Observed by Giesen1993 333Observed by Talwar2016 444Observed by Ugalde2007 555Observed by Jayatissa2019 | 888Excitation energies and spin-parities are from Longland2012 | 0.45(4) | 131313from Talwar2016 | ||
| 222Observed by Giesen1993 333Observed by Talwar2016 555Observed by Jayatissa2019 | 999Excitation energies and spin-parities are from Ota2019 | 1.16(12), 0.67(8) | 0.04141414from Giesen1993 , 131313from Talwar2016 | ||
| 222Observed by Giesen1993 | 101010Excitation energy is from Giesen1993 | 0.45(5), 0.31(3) | 1.00(12), 0.67(8) | 0.20141414from Giesen1993 , 0.11141414from Giesen1993 |
| 730(168) | 194(45) | ||
| 1215(279) | 323(74) |
V Astrophysical implications
To investigate the impact of our recent measurements on -process nucleosynthesis, we have performed abundance calculations using the 22Ne(,)25Mg and 22Ne(,)26Mg reaction rates presented in Ref. Ota2019 . The calculations were performed using the post-processing nucleosynthesis code MPPNP Herwig2018 , which was developed by the NuGrid collaboration. The code takes as an input the stellar evolution trajectories calculated by the one-dimensional stellar evolution code MESA Paxton2010 . The MESA trajectories employed in the present work represent a variety of initial stellar conditions and were prepared by the NuGrid collaboration in previous works Pignatari2016 ; Ritter2018 ; Battino2019 . In the present calculations, we only varied the 22Ne(,)25Mg and 22Ne(,)26Mg reaction rates and kept the values of all other input parameters fixed. As a result, the present calculations only probe the impact of the reactions on the final -process abundances.
For the AGB stars with initial mass M=3 and 5, we consider abundances at the stellar surface after the last Third Dredge Up episode. For the massive star models, we focus on the pre-supernova abundances in the middle of the convective C shell once the -process nucleosynthesis has finished and before the final core-collapsed supernova (CCSN) explosion. However, we also consider abundances at the end of the He core burning, to better understand the total nucleosynthesis.
In the first part of our calculations (Section V.1), we show the sensitivity of the predicted -process to variance in the reaction rates as given in prior studies: Massimi et al Massimi2017 (where only an upper limit was given), Longland et al Longland2012 , Talwar et al Talwar2016 , and Adsley et al. Adsley2021 , as well as our previous publication Ota2019 ). These rates are hereafter referred to as MA17, LO12, TA16, AD21, and OT20, respectively. These calculations are made for 3, 5 and 25 stars with metallicity from the beginning of H-burning until the end of hydrostatic stellar evolution. The 3 model is from Ref. Battino2019 , and the 5 and 25 models are from Ref. Ritter2018 .
In the second part of the calculations (Section V.2), we investigate the impact of hypothetical changes of selected resonances on predicted final s-process abundances. In particular, we show the sensitivity of the -process abundances to uncertainties in the strength of three resonances (=11.112, 11.171, and 11.319 MeV). These resonances were chosen for study because they have the potential to dominate one or both of the rates in certain temperature regimes and furthermore, because the present literature is either lacking key information or contains discrepancies between studies.
V.1 Impact of new reaction rates
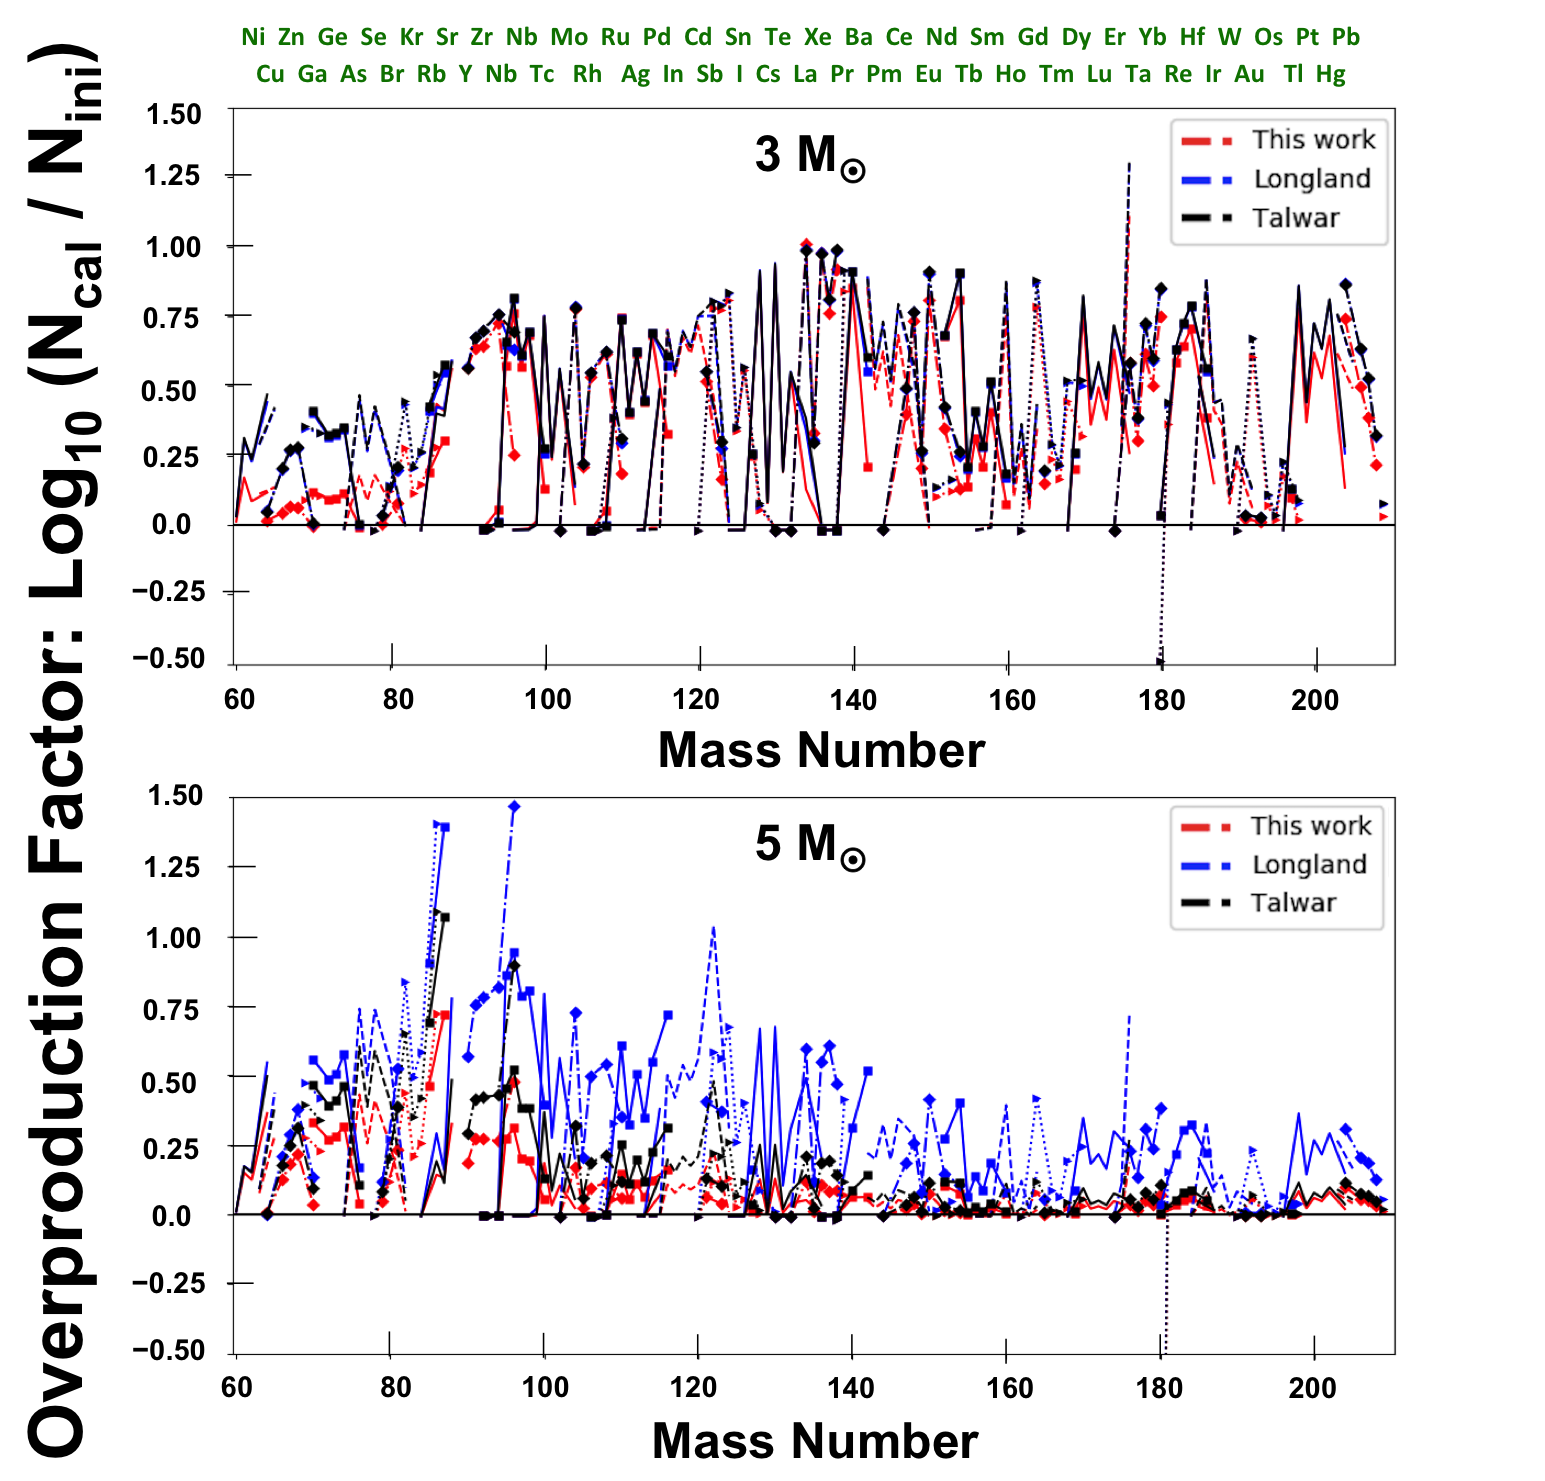
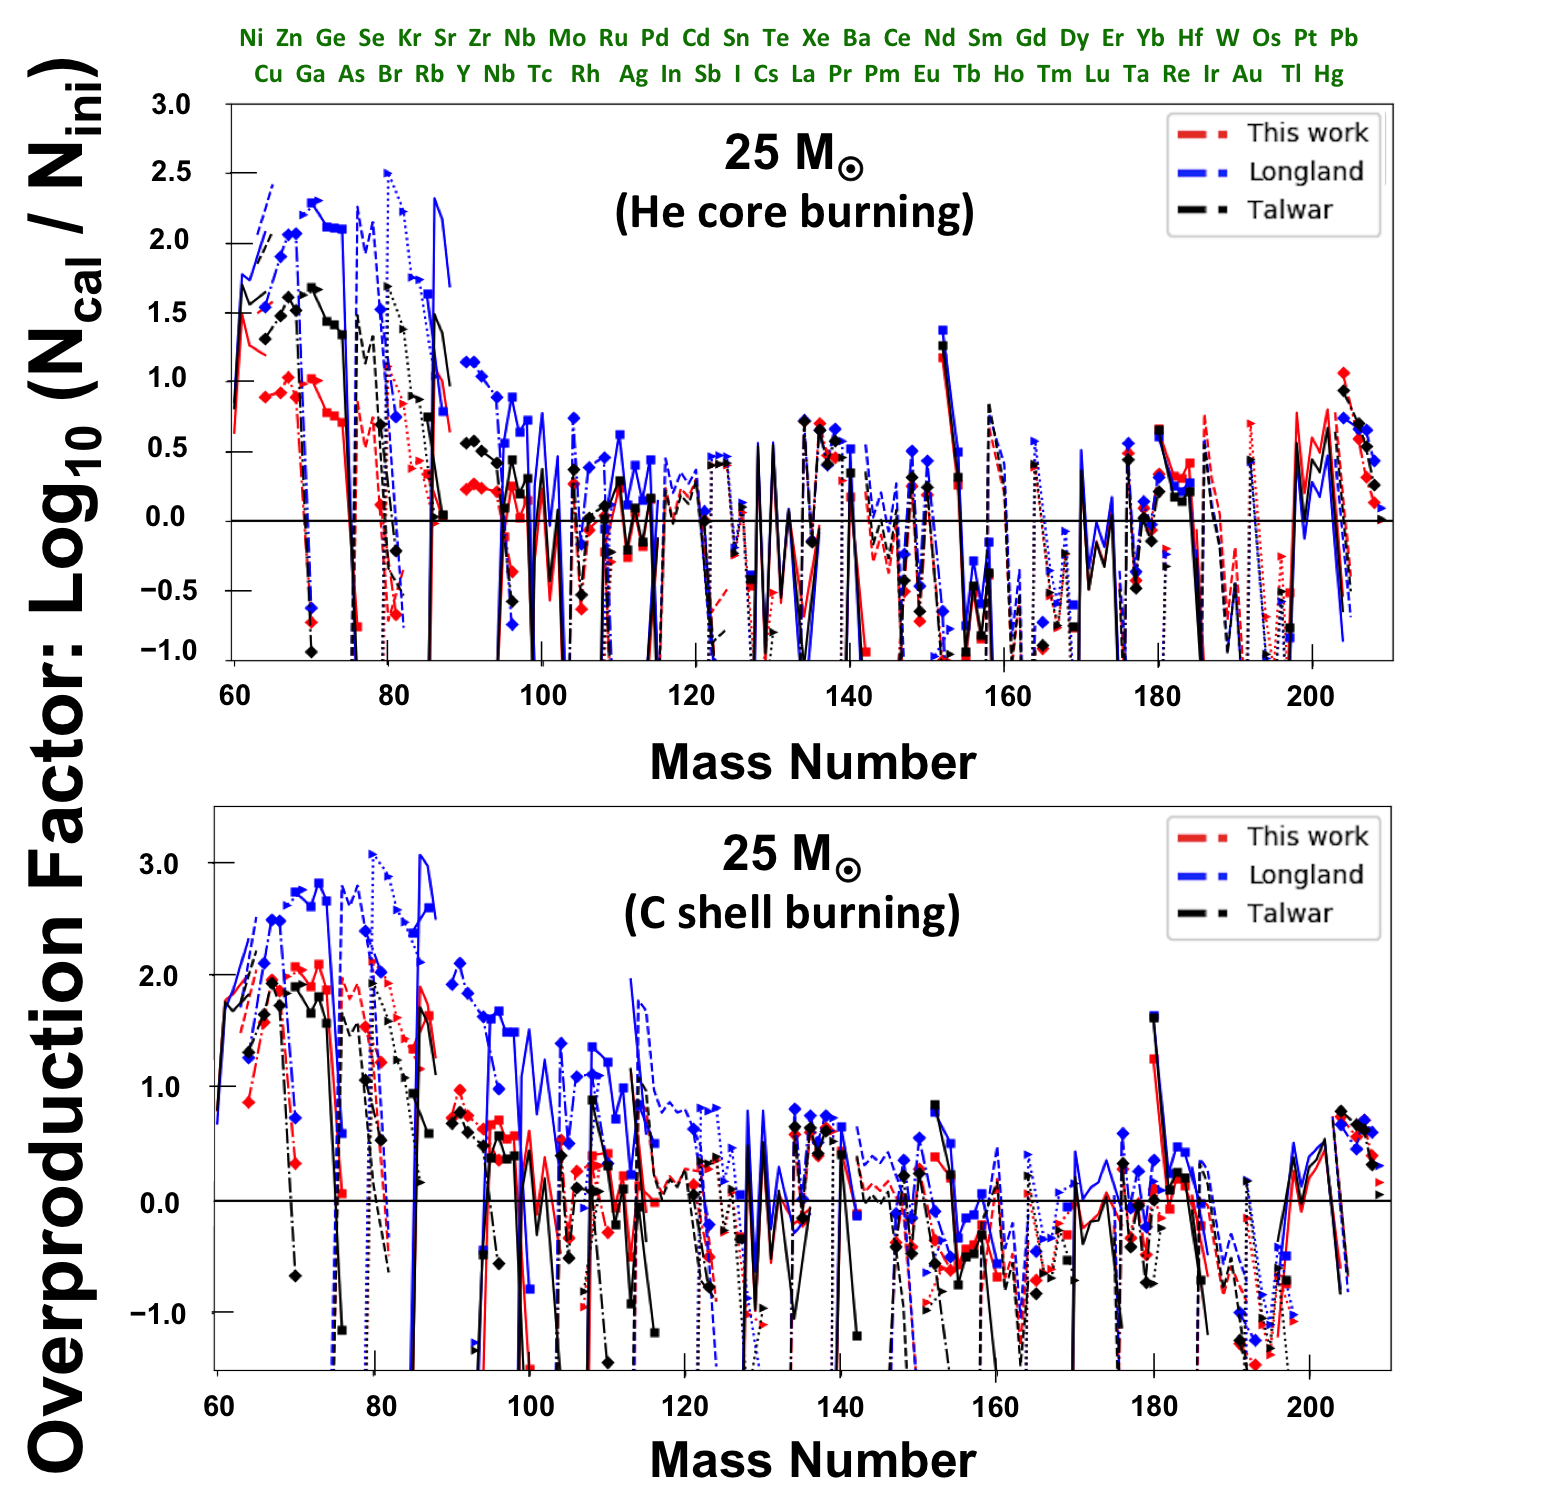
Figure 11 shows the isotopic abundances produced using different 22Ne+ reaction rates by LO12, TA16 and OT20 for 3 and 5 with Z=0.02, respectively. For all three cases, the “recommended” rates published in the respective papers were used in the calculations. Figure 12 shows the same abundances as Figure 11 but for 25 at the end of He core burning and in the middle of C shell burning, respectively. Abundances are shown as overproduction factors, which are defined by log10(), where and represent the final and initial mass fractions, respectively. The mass fraction, , is given by where is mass of isotope and is its abundance. The sum of all mass fractions from hydrogen up to bismuth is equal to unity. The initial abundance is solar-scaled as in Ref. Pignatari2016 , based on Grevesse and Noels Grevesse1993 and with the isotopic ratios from Lodders Lodders2003 .
The largest impact from using different rates is generated in mass –90 (–40) in all the models considered. The large overproduction factors of heavier elements in the 3 model is predominantly driven by neutrons from 13C()16O, not from the 22Ne()25Mg reaction. Thus, only marginal differences are generated by using different reaction rates in the mass region (90). In this case, the contribution to heavy elements from 22Ne()25Mg reaction is generally more limited to isotopes near s-process branching points, that are affected by its short but high neutron flux. For a comprehensive list of branching points we refer to Ref. bisterzo:15 .
As a general trend, the LO12 rates produce the highest s-process abundances, while our rates show the lowest s-process efficiency. Using the TA16 rates, we obtain s-process yields that are somewhere in between. The main difference of the TA16 rate from LO12 is the treatment of =11.17 MeV resonance. While LO12 did not include the resonance, TA16 assigned a large strength in addition to the upper limit imposed by Ref. Jaeger2001 . Thus, TA16 rates, especially the rate, are much larger than LO12 at the -process temperature range. In the 3 star, the differences between LO12 and TA16 are minor; however, the impact becomes clearly visible in the 5 and 25 stars. This is because the TA16’s large rate is more efficient in depleting 22Ne in competition with the reaction, leading to the reduced neutron flux. The main difference of our rates from LO12 is the reduced strength in =11.32 MeV resonance, by about a factor of 3. This generates the lower efficiency in producing neutrons for the s-process shown in Figure 11 and 12 by using the 22Ne+ rates presented in this work. In the 25 star, it should be noted that the overproduction factors by TA16 nearly remain unchanged in the C shell burning compared to the He core burning, while the overproduction factors by LO12 and OT20 are largely enhanced. This is because 22Ne are drastically consumed during the He core burning using TA16, thus s-process in the C shell burning is largely suppressed.
Figure 13 shows the isotopic abundances of representative s-only nuclei (see e.g., Prantzos2020 ), produced by using the same three rates considered for Figure 11 and 12. Additionally, we have considered the upper-limit 22Ne+ rates given in MA17. Calculations using the AD21 rates were also performed with results indistinguishable from the TAMU rates. This is expected since both studies use very similar 22Ne+ rates, with only minor rate differences resulting from the treatment of low energy resonances. As a result, the AD21 calculations are not shown in Figure 13. For all the rates excluding MA17, error bars are provided for the s-process abundances. Uncertainties are estimated by using the combination of the upper limit of the () and of the lower limit of the (yielding the highest s-process efficiency), and the lower limit of the () with the upper limit of the (yielding the lowest s-process efficiency).
Overall, the upper limit by MA17 is consistent with all the other rates. Indeed, the MA17 rate includes contributions from all possible low energy resonances (=11.1-11.25 MeV), all of which are overwhelmed by the () strength and the is negligible. In particular, the lowest resonance at =11.11 MeV is the main source of the enhanced 22Ne()25Mg rate.
Compared to the rates given in TA16, our recommended rates produce up to a factor of 3 lower s-process abundances. However, the two sets of s-process calculations are consistent within the rate uncertainties given in the two studies. On the other hand, we obtain a reduction up to a factor of 10 compared to the results using the LO12 rates. In this case, the variation between the two sets of abundances is not compatible with the errors given. In general, we may conclude that within the uncertainties of our new 22Ne+ rates, we obtain a significant reduction in the s-process contribution to the galactic chemical evolution of elements between iron and the s-process peak of Sr, Y and Zr. The significance of these effects will be studied in a forthcoming paper.

V.2 Sensitivity to cluster strength
In order to provide a complementary approach to assess the impact of the 22Ne+ rates provided in the previous section, we also calculated isotropic abundances when varying strengths of key resonances at , 11.17, and 11.32 MeV. Starting with the reaction rates presented in this work, we made calculations assuming four different conditions: 1) change of the 11.32 MeV resonance from 1.14 to 3.78; 2) insert a strong cluster state at 11.17 MeV with significant -ray decay probability; 3) increase of the 11.11 MeV resonance to 13.5 neV; and 4) assume the 11.11 MeV resonance does not exist at all. Each of these changes is intended to probe the impact of existing discrepancies in the literature, or areas where substantial uncertainty still exists.
Specifically, condition 1 probes the impact of the discrepancies between the present work (together with Refs. Ota2019 ; Jayatissa2019 ) and direct measurements. The former established an strength of eV, while the latter have a weighted average of eV for the same. In both cases, the strength is taken to be eV.
Condition 2 probes the impact of a strong cluster state at 11.17 MeV, as claimed by TA16 but absent in the present work and others Giesen1993 ; Jayatissa2019 ; Ota2019 . In this condition, we inserted an “observed” (not upper limit) resonance at 11.17 MeV with neV—the largest possible strength reported in TA16. Note that we modified the energy of this resonance slightly compared to TA16, placing it at 11.171 MeV instead of 11.167 MeV. We did this to account for the findings of MA17, which suggest a state with large -decay probability at MeV. For the reaction, we increased the upper-limit strength of this resonance to neV, as reported by Jaeger et al. Jaeger2001 .
Together, conditions 3 and 4 probe the impact of uncertainties on the width, and hence of the resonance at 11.11 MeV. Condition 3 probes the impact of a stronger 11.11 MeV resonance, up to the neV ( neV) limit used to determine the upper-limit rates reported in MA17 MassimiEmail (note that MA17’s limits on the resonance strength were extracted from Ref. Jaeger2001 ). To evaluate the maximum possible impact of this resonance, we treated it as an “observed” resonance in the Monte Carlo calculations, with a strength of neV (as opposed to an “unobserved” resonance with the strength sampled from a Porter-Thomas distribution with an upper limit of 13.5 neV). As such, this calculation evaluates the impact of there being a strong 11.11 MeV resonance, with a strength just below the observation threshold of Ref. Jaeger2001 .
In contrast to condition 3, condition 4 probes the impact of there being a negligibly small width for the 11.11 MeV resonance, to the point where it can be removed from the rate calculations entirely.
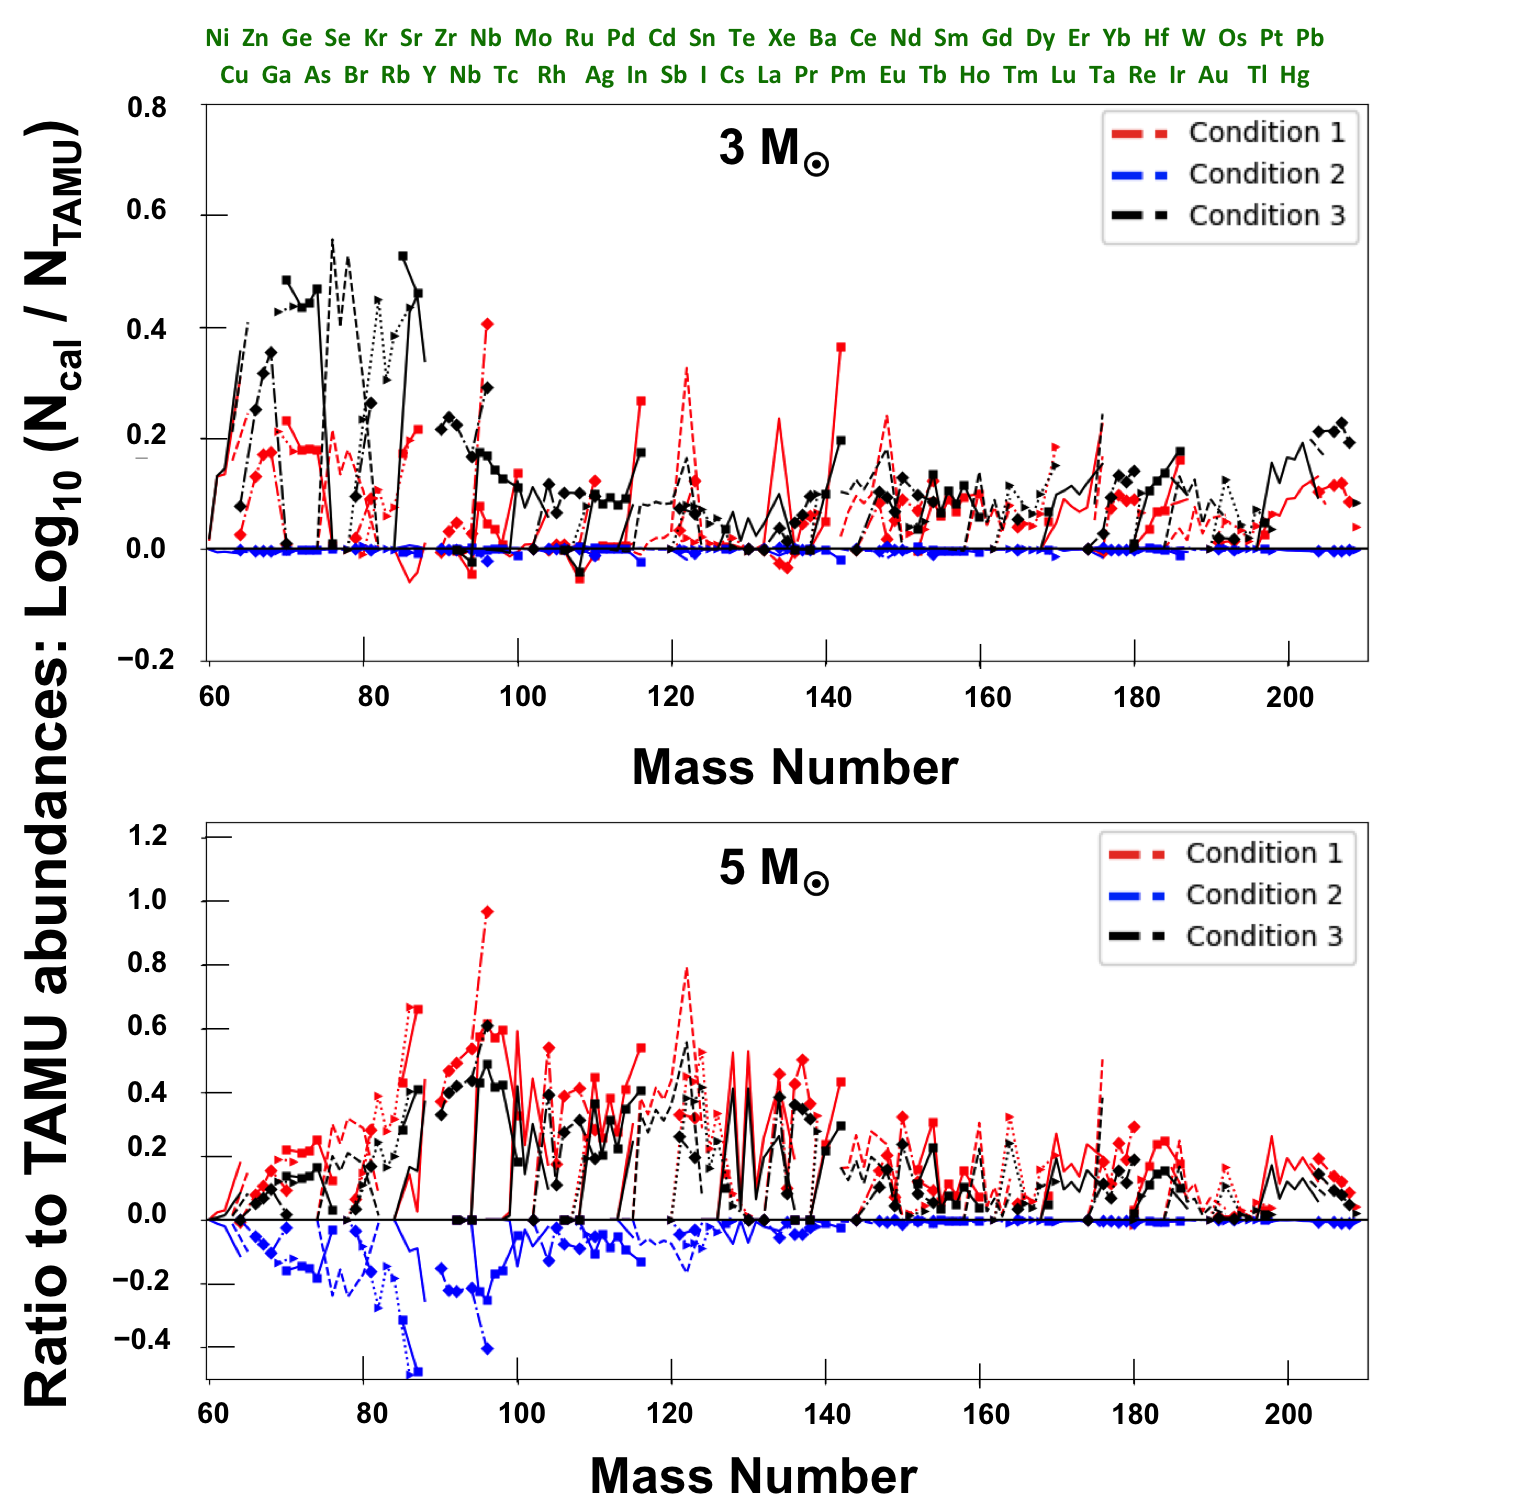
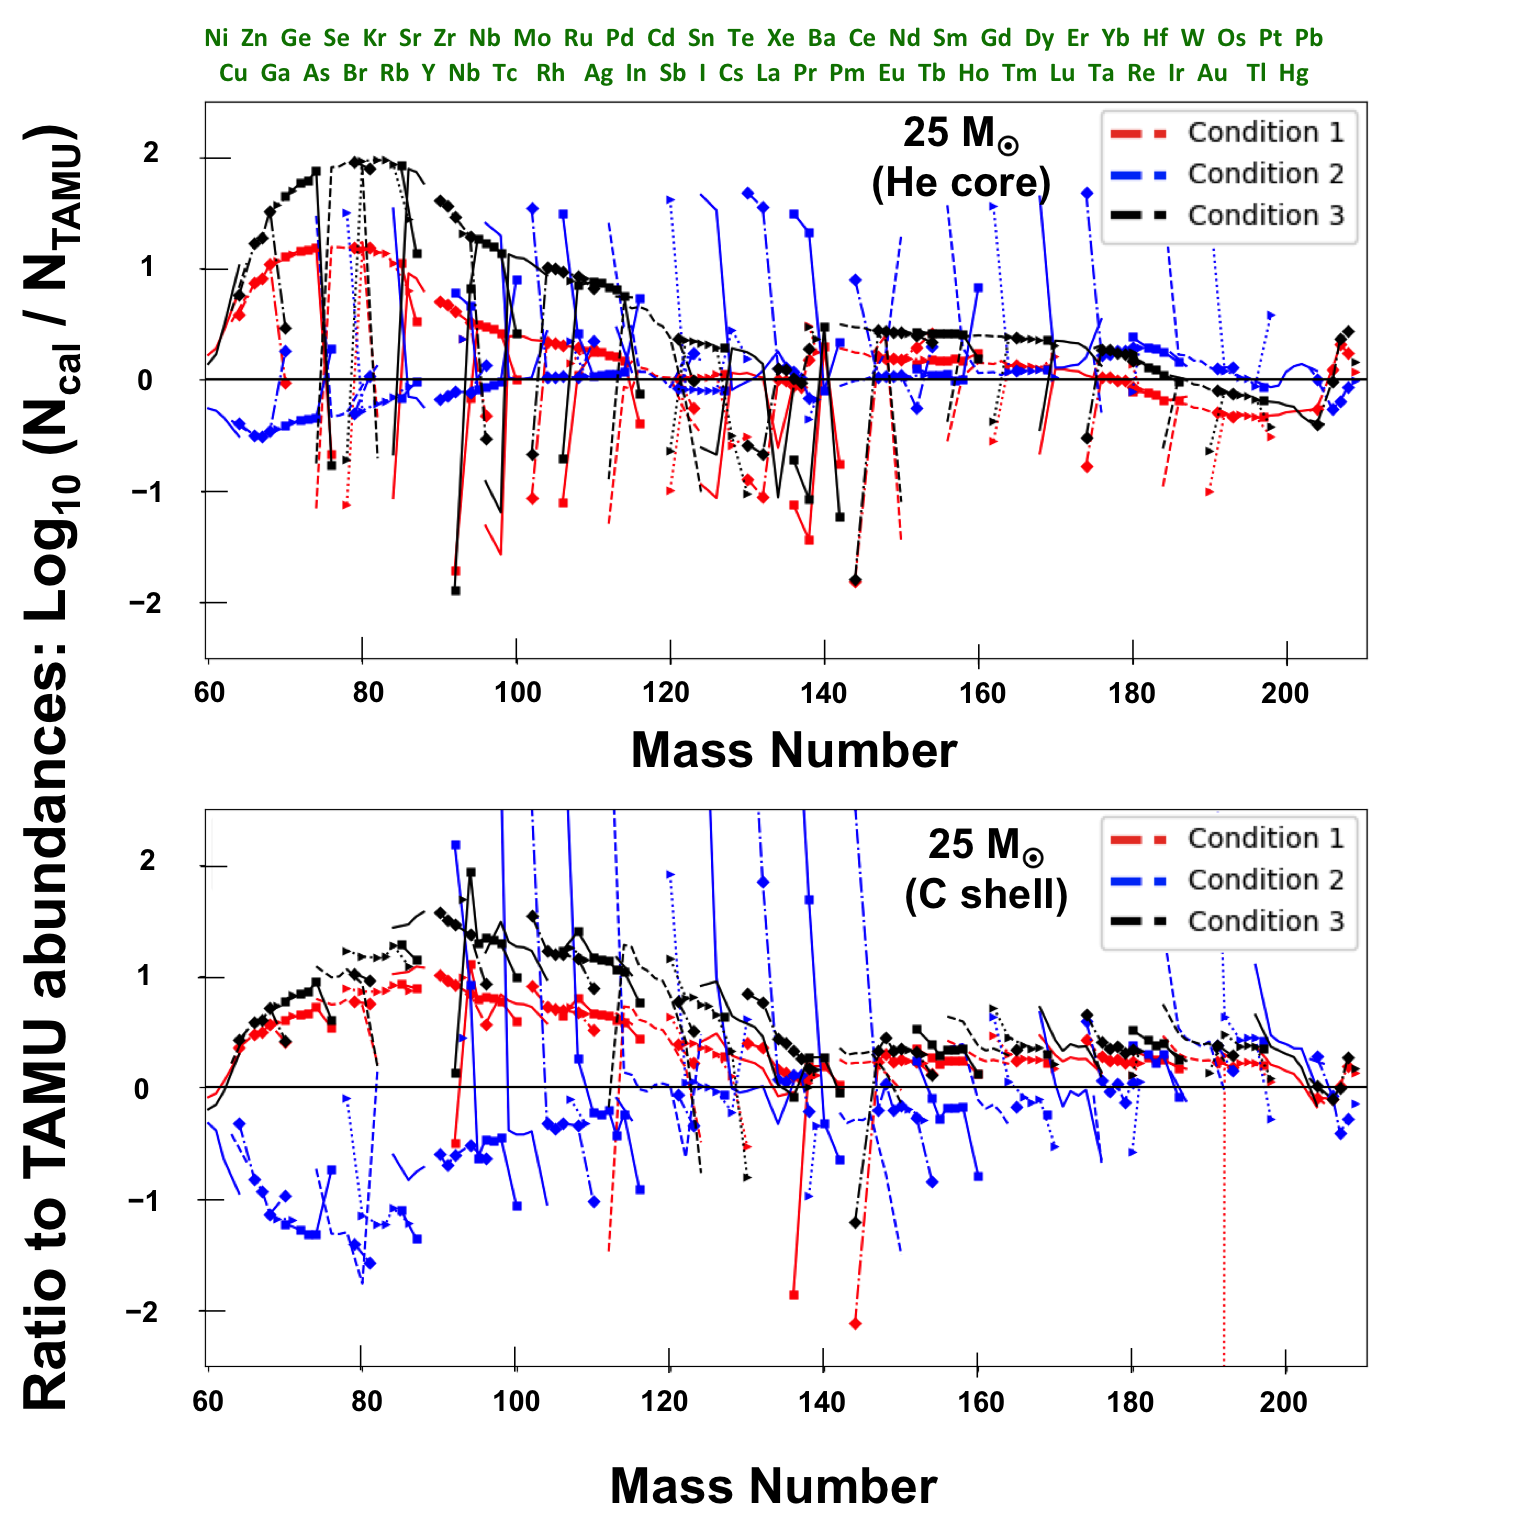
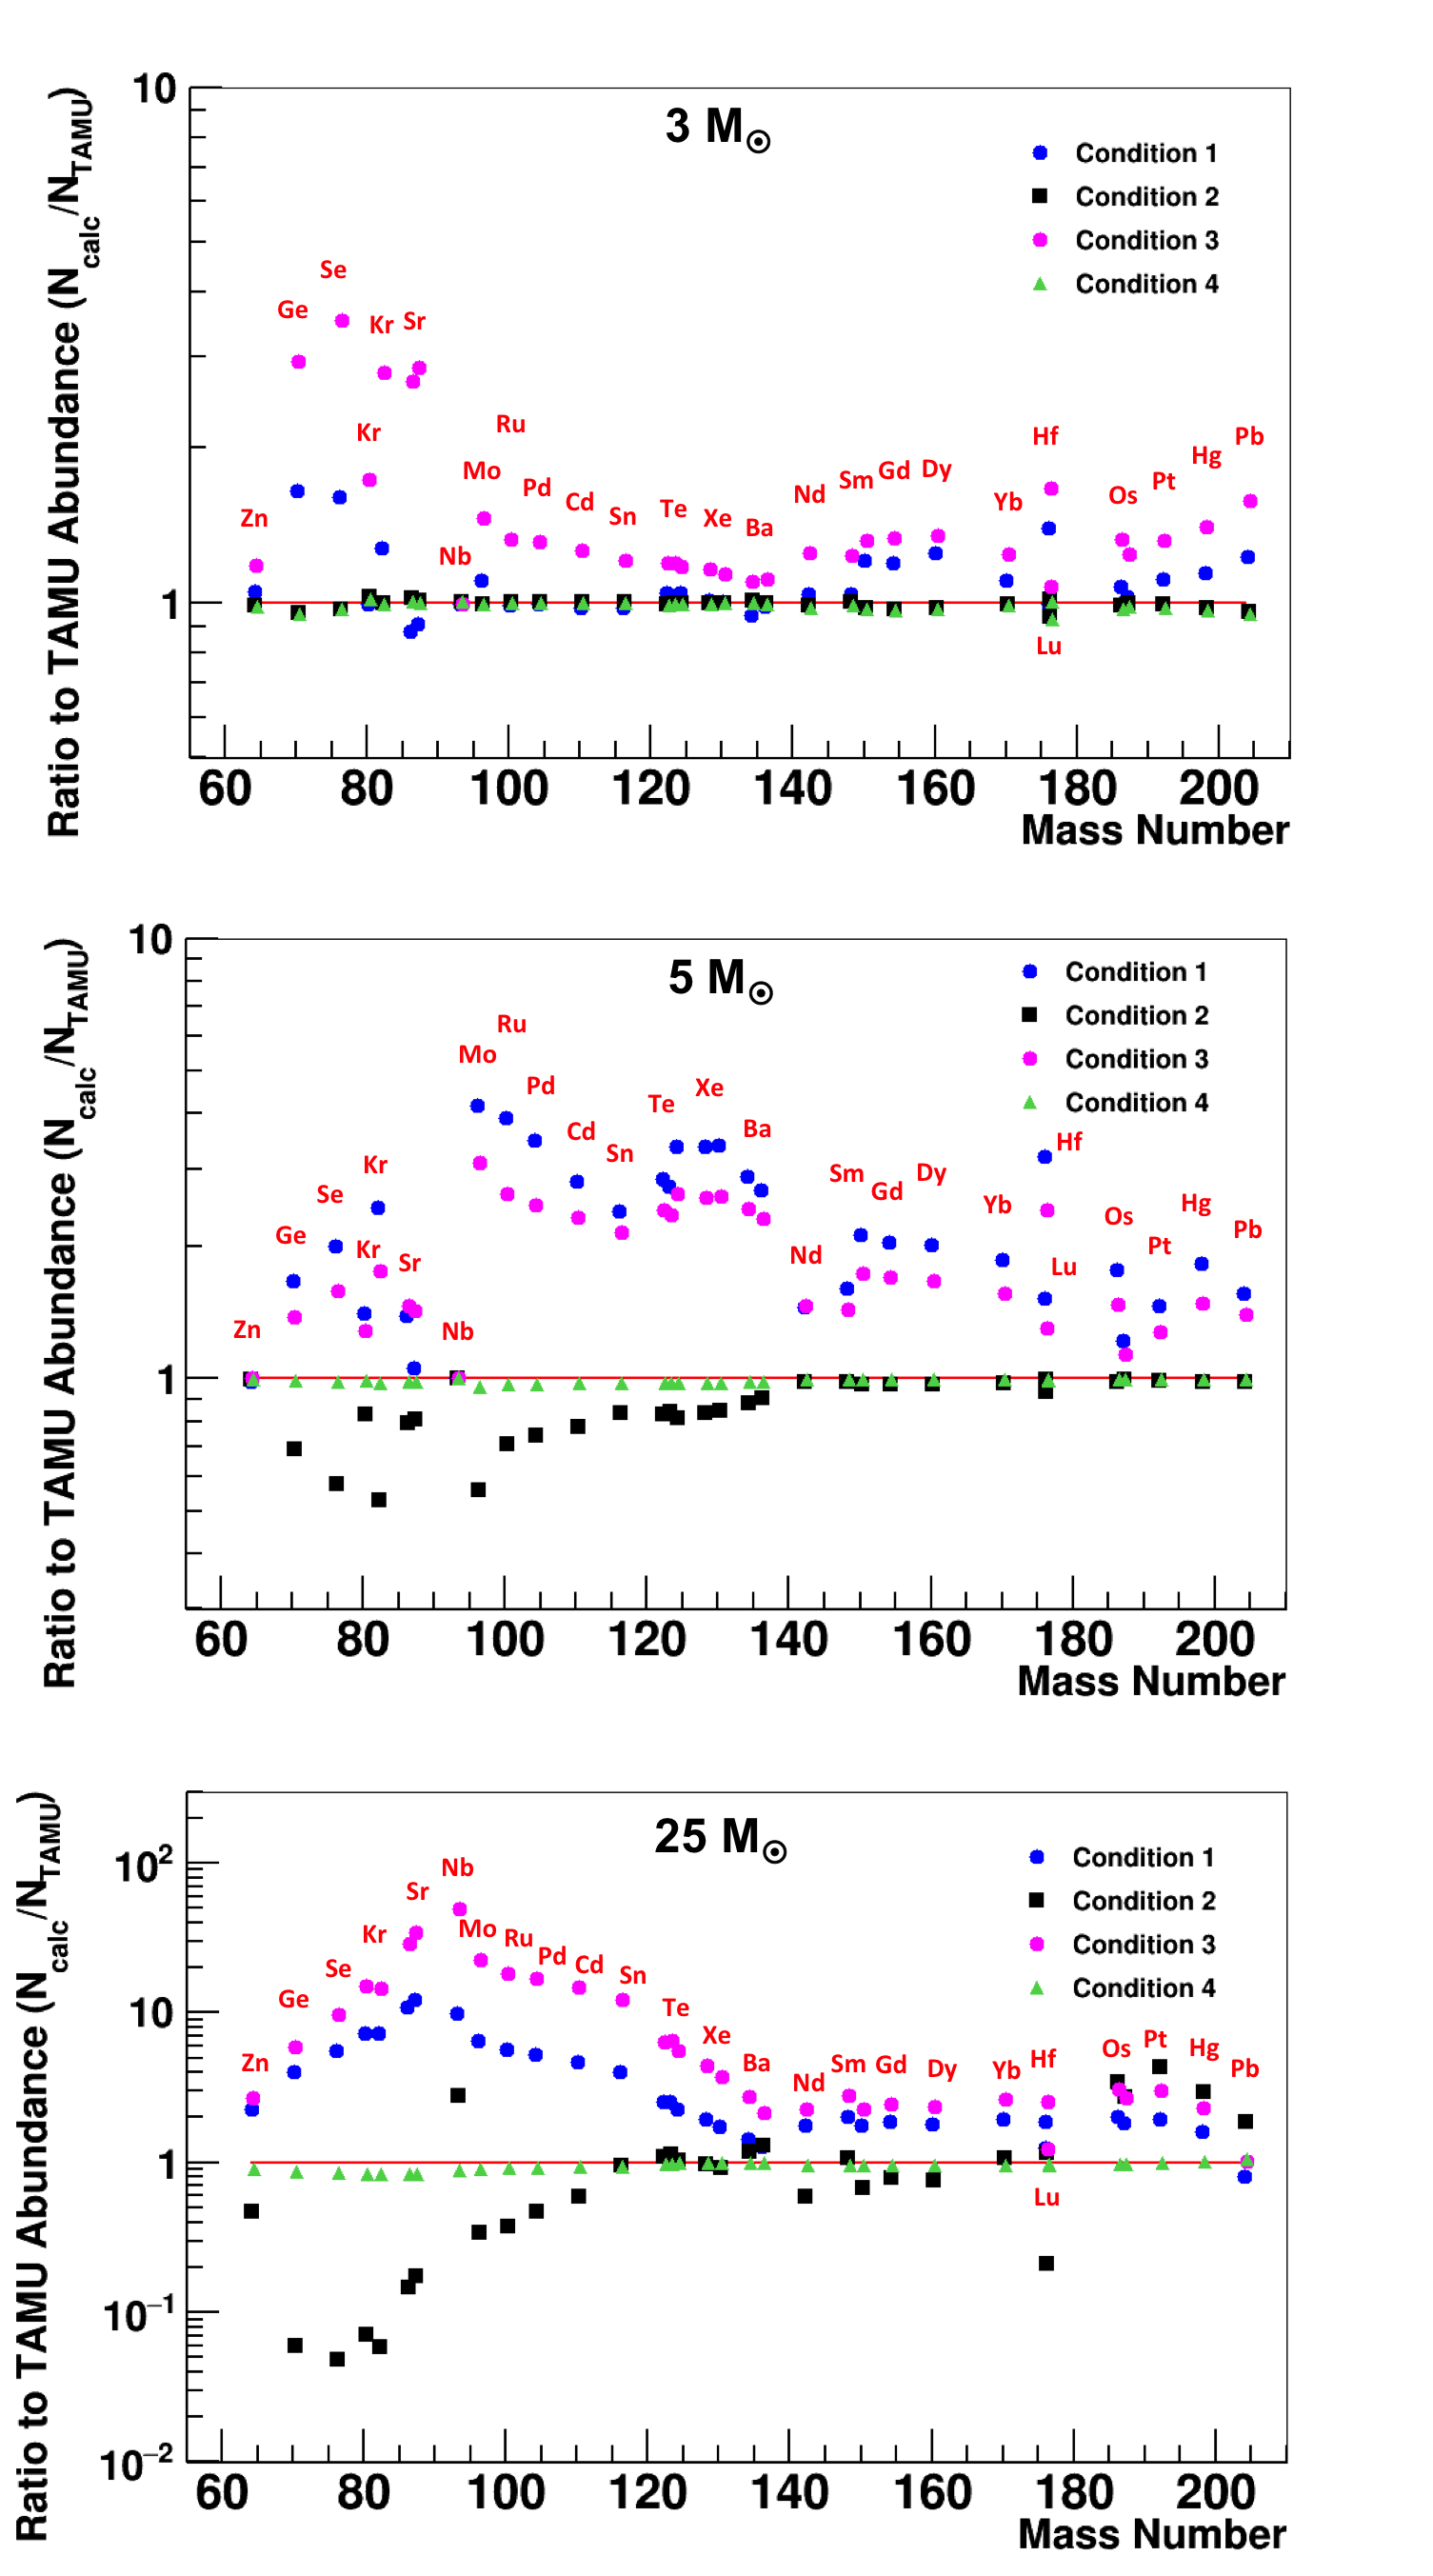
Figure 14 and 15 show the resulting isotopic abundances when the reaction rates defined by conditions 1–3 are used. The abundances from each of the three conditions are plotted as a ratio to the baseline rate from OT20 (Texas A&M (TAMU) abundances). Figure 14 shows abundances for 3 and stars, and Figure 15 shows abundances following both He-core and C-shell burning as indicated. Figure 16 shows the same abundance ratios as the previous two figures but for -only nuclei exclusively. This figure also includes the calculations using the condition 4 rate. These are nearly indistinguishable from the OT20 results and thus were excluded from the previous two plots.
For the 3 model, the abundances are mainly sensitive to the changes in condition 3. The sensitivity to condition 1 is minor (25% increase on average) and the impact of condition 2 is negligible. The insensitivity to condition 2 mirrors the indistinguishable results between the LO12 and TA16 rates in the previous section (Figures 11 and 13). Evidently, the abundances for the 3 model are insensitive to a strong resonance at MeV. The minor sensitivity to the condition 1 rates is limited to 90 nuclides, which again is consistent with the abundance differences from the previous section when comparing our rates and those of LO12 and TA16, which used the higher 11.32 MeV strength established in direct measurements. The large sensitivity to condition 3—increasing the 11.11 MeV resonance strength to MA17’s upper limit—mirrors the previous section’s differences between the present rates and those of MA17. The complete insensitivity to the changes of condition 4—removing the 11.11 MeV resonance—demonstrates that the strength of this resonance is already well constrained when considering its impact on stars.
For the 5 model, conditions 1 and 3 both result in a large increase in predicted abundances. Both rate changes have as much as a factor 3–4 influence on the abundances for certain elements, e.g. Mo. For this model, condition 2 decreases the predicted abundances by a factor of two at most. This reduction is expected because the increased rate, resulting from the strong 11.17 MeV resonance, competes with for fuel. Hence, the stronger rate reduces neutron production via . The increase in the 11.11 MeV resonance strength (condition 3) again increases abundances substantially (although to a lesser degree than the model). The removal of the 11.11 MeV resonance entirely (condition 4) again results in negligible abundance changes.
For the 25 model, the largest sensitivity is observed for condition 3, similar to the other models, although now the impact is as large as a factor for elements near . Condition 1 leads to up to a factor increase in production for the lighter nuclides. The impact of condition 2 is significant, leading to a large (factor ) decrease in abundances for elements near . Condition 4 again has a minor impact, although a perceptible decrease (factor ) in abundances is now present for the lightest nuclides.
V.3 Summary of Astrophysical Implications and Suggested Future Nuclear Physics Studies
The present study demonstrated that the upper limit on the strength of the 11.11 MeV resonance established in OT20 is sufficient to remove any observable impact of this state on -process nucleosynthesis. However, as shown by our condition 3 calculations, if this state is substantially stronger than suggested in OT20, up to the 13.5 neV limit, it will have a dramatic influence on -process nucleosynthesis. Such a scenario does not seem likely and would be inconsistent with the expected Porter-Thomas distribution of strengths. However, given the potential importance of this state to -process nucleosynthesis, we encourage future studies that are specifically targeted at constraining its width.
The second largest uncertainty in the -process predictions appears to come from the 11.32 MeV resonance. The present eV resonance strength of this state has been established in two independent experiments Ota2019 ; Jayatissa2019 . However, this is a significant departure from the factor – larger strength established in direct measurements—one that has a strong observable impact on -process nucleosynthesis. As as result, we also encourage future experiments targeted at corroborating the results of Refs. Ota2019 ; Jayatissa2019 .
Finally, we note that the impact of a strong resonance at 11.17 MeV appears to be relatively minor, limited to a reduction in the synthesis of nuclides for 25 stars. Combined with the good agreement of recent measurements that this state has a negligable strength (e.g., Refs. Ota2019 ; Jayatissa2019 ; Lotay2019 ), we tentatively conclude that this state is not important for the -process.
VI Summary
Natural parity states in 26Mg were studied from =4–12 MeV using the 22Ne(6Li, ) reaction in inverse kinematics. Coincidence tagging with the 25,26Mg recoils identified the first-order decay channels (neutron or ray) of the populated states. The resulting spectra were interpreted with the help of coincident -ray measurements and the results of past 22Ne(6Li, ) measurements. This information was used to identify the most probable states contributing to the deuteron-reconstructed excitation-energy spectrum, which did not have sufficient resolution to separate all states populated in the reaction. Spins and relative spectroscopic factors were assigned to the identified states through comparison of angular distributions with DWBA calculations. The 22Ne(6Li,) reaction was also analyzed. States likely to be strongly populated in this reaction were identified, and (6Li,) spectroscopic factors were reported for the first time.
The analysis of the (6Li, ) data from this experiment, in the region of interest for the astrophysical -process, led to the construction of new Mote-Carlo reaction rates for the stellar and reactions Ota2019 . These rates were used to calculate predicted -process abundances for a range of elements, using three different stellar models with , 5, and 25 and . These calculations show the impact of the 22Ne+ reaction rates on the s-process abundances, using constraints from presently-available nuclear physics information. Using the new rates established by the results of the present experiment, we observe a reduction in the overabundance of certain elements of up to a factor of 3 and 10 compared to the earlier rates published in Talwar et al. (TA16) Talwar2016 and Longland et al. (LO12) Longland2012 , respectively. These difference are mainly observed in mass range –90, for all three stellar mass models.
We also used our stellar models to investigate the impact on -process nucleosynthesis of outstanding uncertainties or literature discrepancies on selected, key resonances. These calculations used the present Monte-Carlo rates as a baseline and subsequently varied strengths of the resonances at , 11.17, and 11.32 MeV. The results highlight the strong astrophysical impact of the factor reduction in the MeV strength, which resulted from the present experiment. The calculations also established that the discrepancies between the present work (along with others Jayatissa2019 ; Giesen1993 ; Longland2012 ) and TA16 concerning the presence of a strong resonance at 11.17 MeV are relatively minor except for the 25 stars. Finally, the calculations established that the presently-determined upper limit on the strength of the resonance at 11.11 MeV is sufficient to constrain -process nucleosynthesis across all models. At the same time, all three models predict a strong enhancement in s-process abundances if a resonance is found just below the observation threshold of Ref. Jaeger2001 . This highlights the significant importance of this resonance to s-process nucleosyntiesis. All together, the calculations point to the 11.11 and 11.32 MeV resonances as being the most important for the s-process. As a result, we encourage future experiments targeted at independently corroborating the strengths of these resonances established by the present experiment.
Acknowledgements.
We express our thanks to the technical staff at the Texas A&M University Cyclotron Institute. Financial support for this work was provided by the US Department of Energy, award Nos. DE-FG02-93ER40773 and DE-SC0018980, the US National Nuclear Security Administration, award No. DE-NA0003841. JAT, WNC., and GL. acknowledge support from the UK STFC, award no. ST/L005743/1. SO acknowledges support from the TAMU CIRD fund. MP acknowledges support from NuGrid, JINA-CEE (NSF Grant PHY-1430152), STFC (through the University of Hull’s Consolidated Grant ST/R000840/1), and ongoing access to viper, the University of Hull High Performance Computing Facility. MP also acknowledges the support from the ”Lendület-2014” Programme of the Hungarian Academy of Sciences (Hungary). We also acknowledge the ChETEC COST Action (CA16117), supported by the European Cooperation in Science and Technology, the CheTEC-INFRA (European Union’s Horizon 2020 research and innovation program, grant agreement No 101008324) and IReNA (USA National Science Foundation under Grant No. OISE-1927130).References
- [1] F. Kappeler, R. Gallino, S. Bisterzo, and W. Aoki. Rev. Mod. Phys., 83(157), 2011.
- [2] John J. Cowan, Christopher Sneden, James E. Lawler, Ani Aprahamian, Michael Wiescher, Karlheinz Langanke, Gabriel Martínez-Pinedo, and Friedrich-Karl Thielemann. Origin of the heaviest elements: The rapid neutron-capture process. Reviews of Modern Physics, 93(1):015002, January 2021.
- [3] J. J. Cowan and W. K. Rose. Production of 14C and neutrons in red giants. Astrophys. J. , 212:149–158, February 1977.
- [4] P. A. Denissenkov, F. Herwig, U. Battino, C. Ritter, M. Pignatari, S. Jones, and B. Paxton. APJ Lett., 2(834), 2017.
- [5] L. F. Roberts, S. E. Woosley, and R. D. Hoffman. Integrated Nucleosynthesis in Neutrino-driven Winds. Astrophys. J. , 722(1):954–967, October 2010.
- [6] A. Arcones and F. Montes. Production of Light-element Primary Process Nuclei in Neutrino-driven Winds. Astrophys. J. , 731(1):5, April 2011.
- [7] LIGO Scientific Collaboration et al. APJ Lett., 848(L12), 2017.
- [8] M. R. Drout, A. L. Prito, and B. J. et al. Shappee. Science, 358:1570–1574, 2017.
- [9] M. Arnould, S. Goriely, and K. Takahashi. Phys. Rep., 450(97), 2007.
- [10] C. Sneden, J. J. Cowan, and Gallino. Annu. Rev. Astron. Astrophys., 46(241), 2008.
- [11] Z. Y. Bao, H. Beer, Kappeler, Voss F., F., and K. Wisshak. Atom. Dat. Nucl. Dat. Tab., 76:70–154, 2000.
- [12] A. I. Karakas, D. A. Garcia-Hernandez, and M. Lugaro. APJ, 751(8), 2012.
- [13] O. Straniero, R. Gallino, and S. Cristallo. Nucl. Phys. A, 777:311, 2006.
- [14] Roberto Gallino, Claudio Arlandini, Maurizio Busso, Maria Lugaro, Claudia Travaglio, Oscar Straniero, Alessandro Chieffi, and Marco Limongi. Evolution and Nucleosynthesis in Low-Mass Asymptotic Giant Branch Stars. II. Neutron Capture and the S-Process. Astrophys. J. , 497(1):388–403, April 1998.
- [15] F. Käppeler, R. Gallino, S. Bisterzo, and Wako Aoki. The s process: Nuclear physics, stellar models, and observations. Reviews of Modern Physics, 83(1):157–194, January 2011.
- [16] T. Rauscher, A. Heger, R. D. Hoffman, and S. E. Woosley. Nucleosynthesis in Massive Stars with Improved Nuclear and Stellar Physics. Astrophys. J. , 576(1):323–348, September 2002.
- [17] Lih-Sin The, Mounib F. El Eid, and Bradley S. Meyer. s-Process Nucleosynthesis in Advanced Burning Phases of Massive Stars. Astrophys. J. , 655(2):1058–1078, February 2007.
- [18] M. Pignatari, R. Gallino, M. Heil, M. Wiescher, F. Käppeler, F. Herwig, and S. Bisterzo. The Weak s-Process in Massive Stars and its Dependence on the Neutron Capture Cross Sections. Astrophys. J. , 710(2):1557–1577, February 2010.
- [19] M. Pignatari, F. Herwig, R. Hirschi, M. Bennett, G. Rockefeller, C. Fryer, F. X. Timmes, C. Ritter, A. Heger, S. Jones, U. Battino, A. Dotter, R. Trappitsch, S. Diehl, U. Frischknecht, A. Hungerford, G. Magkotsios, C. Travaglio, and P. Young. NuGrid Stellar Data Set. I.Stellar Yields from H to Bi for Stars with Metallicities Z = 0.02 and Z = 0.01. apjs, 225(2):24, August 2016.
- [20] James G. Peters. Nucleosynthesis by the s-PROCESS in Stars of 9 and 15 Solar Masses. Astrophys. J. , 154:225, October 1968.
- [21] I. Iben. APJ, 196(525), 1975.
- [22] Amanda I. Karakas and John C. Lattanzio. The Dawes Review 2: Nucleosynthesis and Stellar Yields of Low- and Intermediate-Mass Single Stars. pasa, 31:e030, July 2014.
- [23] S. Bisterzo, R. Gallino, F. Käppeler, M. Wiescher, G. Imbriani, O. Straniero, S. Cristallo, J. Görres, and R. J. deBoer. The branchings of the main s-process: their sensitivity to -induced reactions on 13C and 22Ne and to the uncertainties of the nuclear network. mnras, 449(1):506–527, May 2015.
- [24] C. M. Raiteri, M. Busso, R. Gallino, and G. Picchio. S-Process Nucleosynthesis in Massive Stars and the Weak Component. II. Carbon Burning and Galactic Enrichment. Astrophys. J. , 371:665, April 1991.
- [25] F. Kaeppeler, M. Wiescher, U. Giesen, J. Goerres, I. Baraffe, M. El Eid, C. M. Raiteri, M. Busso, R. Gallino, M. Limongi, and A. Chieffi. Reaction Rates for 18O( alpha , gamma ) 22Ne, 22Ne( alpha , gamma ) 26Mg, and 22Ne( alpha , n) 25Mg in Stellar Helium Burning and s-Process Nucleosynthesis in Massive Stars. Astrophys. J. , 437:396, December 1994.
- [26] A. Chieffi, M. Limongi, and O. Straniero. APJ, 737(502), 1998.
- [27] Samuel W. Jones, Heiko Möller, Chris L. Fryer, Christopher J. Fontes, Reto Trappitsch, Wesley P. Even, Aaron Couture, Matthew R. Mumpower, and Samar Safi-Harb. 60Fe in core-collapse supernovae and prospects for X-ray and gamma-ray detection in supernova remnants. mnras, 485(3):4287–4310, May 2019.
- [28] W. Wang, M. J. Harris, R. Diel, H. Halloin, B. Cordier, A. W. Strong, K. Kretschmer, P. Knodlseder, Jean, G. Lichti, J. P. Roques, S. Schanne, A. von Kienlin, G. Weidenspointner, and C. Wunderer. Astron. & Astrophys., 469(3):1005–1012, 2007.
- [29] M. Lugaro, U. Ott, and Á. Kereszturi. Radioactive nuclei from cosmochronology to habitability. Progress in Particle and Nuclear Physics, 102:1–47, September 2018.
- [30] R. Longland, C. Iliadis, and A. I. Karakas. Phys. Rev. C, 85(065809), 2012.
- [31] K. Wolke, V. Harms, H.W. Becket, J.W. Hammer, K.L. Kratz, C. Rolfs, U. Schroder, H.P. Trautvetter, M. Wiescher, and A. Wohr. Z. Phys. A, 334:491–510, 1989.
- [32] H.W. Drotleff, A. Denker, J.W. Hammer, H. Knee, S. Kuchler, D. Streit, C. Rolfs, and H.P. Trautvetter. Z. Phys. A, 338:367–368, 1991.
- [33] M. Jaeger, R. Kunz, A. Mayer, J. W. Hammer, G. Staudt, K. L. Kratz, and Pfeiffer B. Phys. Rev. Lett, 87(20), 2001.
- [34] P. Koehler. Phys. Rev. C, 66(055805), 2002.
- [35] C. Massimi, P. Koehler, and S. et al. Bisterzo. Phys. Rev. C, 85(044615), 2012.
- [36] C. Massimi, S. Altstadt, and J. et al. Andrzejewski. Phys. Let. B, 768:1–6, 2017.
- [37] U. Giesen, C.P. Browne, J. Gorres, S. Graff, C. Iliadis, H.P. Trautvetter, M. Wiescher, W. Harms, K.L. Kratz, B. Pfeiffer, R.E. Azuma, M. Buckby, and J.D. King. Nucl. Phys. A, 561:95–111, 1993.
- [38] R. Longland, C. Iliadis, G. Rusev, A. P. Tonchev, R. J. deBoer, J. Gorres, and Wiescher M. Phys. Rev. C, 80(055803), 2009.
- [39] R. Talwar, T. Adachi, G. P. A. Berg, L. Bin, S. Bisterzo, M. Couder, R. J. deBoer, X. Fang, H. Fujita, Y. Fujita, J. Gorres, K. Hatanaka, T. Itoh, T. Kadoya, A. Long, K. Miki, D. Patel, M. Pignatari, Y. Shimbara, A. Tamii, M. Wiescher, T. Yamamoto, and M. Yosoi. Phys. Rev. C, 93(055803), 2016.
- [40] P. Adsley, J. W. Brummer, K. C. W. Li, D. J. Marin-Lambarri, N. Y. Kheswa, L. M. Donaldson, R. Neveling, P. Papka, L. Pellegri, L. C. V. Pesudo, Pool, Smit F. D., and van Zyl J. J. Phys. Rev. C, 96(055802), 2017.
- [41] P. Adsley, J.W. Brummer, T. Faestermann, S.P. Fox, F. Hammache, R. Hertenberger, A. Meyer, R. Noveling, D. Seiler, N. de Sereville, and H.-F. Wirth. Phys. Rev. C, 97(045807), 2018.
- [42] G. Lotay, D. T. Doherty, D. Seweryniak, S. Almaraz-Calderon, M. P. Carpenter, C. J. Chiara, H. M. David, C. R. Hoffman, R. V. F. Janssens, A. Kankainen, T. Lauritsen, R. Wilkinson, P. J. Woods, , and S. Zhu. 2019.
- [43] H. Jayatissa, G.V. Rogachev, V.Z. Goldberg, E. Koshchiy, G. Christian, J. Hooker, S. Ota, B.T. Roeder, A. Saastamoinen, O. Trippella, S. Upadhyayula, and E. Uberseder. Phys. Let. B, 802(135267), 2020.
- [44] M. Jaeger. The reaction 22NeMg, the key neutron source in massive stars. PhD thesis, Universität Stuttgart, 2001.
- [45] S. Ota, G. Christian, G. Lotay, W.N. Catford, E.A. Bennett, D.T. Dede, S. Doherty, S. Hallam, J. Hooker, C. Hunt, H. Jayatissa, A. Matta, M. Moukaddam, G. V. Rogachev, A. Saastamoinen, J. A. Tostevin, S. Upadhyayula, and Wilkinson R. Phys. Lett. B, 802(135256), 2020.
- [46] F. Herwig, R. Andrassy, N. Annau, O. Clarkson, B. Cote, A. D’Sa, S. Jones, B. Moa, J. O’Connell, D. Porter, C. Ritter, and P. Woodward. APJ Supple. Lett., 236:2, 2018.
- [47] M. Labiche, W.N. Catford, R.C. Lemmon, C.N. Timis, R. Chapman, and N.A. etl. Orr. Nucl. Instr. Meth. A, 614:439–448, 2010.
- [48] S. M. Brown. Neutron Shell Breaking in Neutron-Rich Neon Isotopes. PhD thesis, University of Surrey, Surrey, UK, 2010.
- [49] D.M. Pringle, W.N. Catford, J.S. Winfield, D.G. Lewis, N.A. Jelley, K.W. Allen, and J.H. Coupland. Nucl. Instr. Meth. A, 245(2-3):230–247, 1986.
- [50] A. Spiridon, E. Pollacco, B. T. Roeder, A. Saastamoinen, R. Chyzh, M. Dag, R. E. Tribble, L. Trache, G. Pascovici, and R. De Oliveira. Nucl. Instr. Meth. B, 376:364 – 368, 2016.
- [51] O. B. Tarasov and D. Bazin. http://lise.nscl.msu.edu/lise.html.
- [52] S.R. Lesher, L. Phair, L.A. Bernstein, D.L. Bleuel, J.T. Burke, J.A. Church, P. Fallon, J. Gibelin, N.D. Scielzo, M. Wiedeking. Nucl. Instr. Meth. A, 621(1-3):286–291, 2010.
- [53] G. F. Knoll. Radiation Detection and Measurement. John Wiley and Sons, New York, 4th edition, 2010.
- [54] F Glatz, S. Norbert, E. Bitterwolf, A. Burkard, F. Heidinger, Th Kern, R. Lehmann, H. Ropke, J. Siefert, C. Schneider, and B.H. Wildenthal. Z. Phys. A, 324:187–204, 1986.
- [55] National Nuclear Data Center website. http://www.nndc.bnl.gov.
- [56] H. F. Lutz, J. J. Wesolowski, Hansen L. F., and S. F. Eccles. Nucl. Phys. A, 95:591, 1967.
- [57] A. J. Howard, J. O. Pronko, and C. A. Whitten. Nucl. Phys. A, 152:317, 1970.
- [58] W.W. Daehnick, J.D. Childs, and Vrcelj Z. Phys. Rev. C, 21(6), 1980.
- [59] H. An and C. Cai. Phys. Rev. C, 73(054605), 2006.
- [60] I.J. Thompson. Comp. Phys. Rep., 7:167–212, 1988.
- [61] J. A. Tostevin. University of Surrey version of the code TWOFNR (of M. Toyama, M. Igarashi and N. Kishida), http://nucleartheory.eps.surrey.ac.uk/NPG/code.htm, 1972.
- [62] C. M. Perey and F. G. Perey. Atom. Dat. Nucl. Dat. Tab., 17:1–101, 1976.
- [63] A. Matta, P. Morfouace, N. de Sereville, F. Flavigny, M. Labiche, and R. Shearman. J. Phys. G, 045113:43, 2016.
- [64] G. Bassani, T. H. Kruse, N. Saunier, and G. Souchere. Phys. Lett., 30B:9, 1969.
- [65] G. Bassani, N. Saunier, and B. M. Traore. J. De. Physique, 11:133, 1971.
- [66] M. L. Avila, L. T. Baby, J. Belarge, N. Keeley, K. W. Kemper, E. Koshchiy, A. N. Kuchera, G. V. Rogachev, K. Rusek, and D. Santiago-Gozalez. Phys. Rev. C, 97(014313), 2018.
- [67] A. D. Panagiotou and H. E. Gove. Nucl. Phys. A, 196:144–155, 1972.
- [68] J. D. Garrett, H. G. Bingham, H. T. Fortune, and R. Middleton. Phys. Rev. C, 5(3):682, 1972.
- [69] L. M. Martz, S. J. Sanders, P. D. Parker, and C. B. Dover. Phys. Rev. C, 20(4):1340–1346, 1979.
- [70] R. A. Lindgren, R. G. Markham, and H. W. Fulbright. Phys. Lett., 48B:3, 1974.
- [71] C. W. Woods, N. Stein, and J. W. Sunier. Phys. Rev. C, 17:1, 1978.
- [72] H. Ropke, G. Hammel, W. Brendler, P. Betz, and V. Glattes. Z. Phys. A, 266:55–64, 1974.
- [73] F. Heidinger, P. Betz, W. Brendler, F. Glaz, A. Hoffmann, H. Ropke, and B.H. Wildenthal. Z. Phys. A, 338(23), 1991.
- [74] I. Hamamoto and Ben R. Mottelson. Scholarpedia, 7 (4)(10693), 2012.
- [75] F. Meurders and G. De Korte. Nucl. Phys. A, 249:205–214, 1975.
- [76] S. Hinds, R. Middleton, and G. Parry. Proc. Phys. Soc. LXXI, I, 1957.
- [77] P. A. Butler, A. J. Brown, L. L. Green, A. N. James, C. J. Lister, J. D. MacArthur, P. J. Nolan, and J. F. Sharpey-Shafer. J. Phys. G, 1(6), 1975.
- [78] J. E. Christiansson, J. Dubois, H. Roth, and L. Jarneborn. Physica Scripta., 14:193–196, 1976.
- [79] X. Li, C. Liang, and C. Cai. Nucl. Phys. A, 789:103–113, 2007.
- [80] N. Anantaraman, H.E. Dove, J. Toke, and J.P. Draayer. Nucl. Phys. A, 279:474–492, 1977.
- [81] C. Ugalde, A. E. Champagne, S. Daigle, C. Iliadis, R. Longland, J. R. Newton, E. Osenbaugh-Stewart, J. A. Clark, C. Deibel, A. Parikh, P. Parker, and C. Wrede. Phys. Rev. C, 76:025802, 2007.
- [82] S. Hunt, C. Iliadis, A. Champagne, L. Downen, and A. Cooper. Phys. Rev. C, 045804:99, 2019.
- [83] H.W. Drotleff, A. Denker, H. Knee, M. Soine, G. Wolf, J.W. Hammer, U. Greifre, C. Rolfs, and H.P. Trautvetter. APJ, 414:735–739, 1993.
- [84] B. Paxton, L. Bildsten, A. Dotter, F. Herwig, P. Lesaffre, and F. Timmes. APJ, 192:1, 2010.
- [85] M. Pignatari, F. Herwig, R. Hirschi, M. Bennett, G. Rockefeller, C. Fryer, F. X. Timmes, C. Ritter, A. Heger, S. Jones, U. Battino, A. Dotter, R. Trappitsch, S. Diehl, U. Frischknecht, A. Hungerford, G. Magkotsios, C. Travaglio, and P. Young. APJ, 225:2, 2016.
- [86] C. Ritter, F. Herwig, S. Jones, M. Pignatari, C. Fryer, and R. Hirschi. Monthly Notice of Royal Astron. Soc., 480:538–571, 2018.
- [87] U. Battino, A. Tattersall, C. Lederer-Woods, F. Herwig, P. Denissenkov, R. Hirschi, R. Trappitsch, J. W. den Hartogh, and M. Pignatari. Monthly Notice of Royal Astron. Soc., 489:1082, 2019.
- [88] P. Adsley, U. Battino, A. Best, A. Caciolli, A. Guglielmetti, G. Imbriani, H. Jayatissa, M. La Cognata, L. Lamia, E. Masha, C. Massimi, S. Palmerini, A. Tattersall, and R. Hirschi. Phys. Rev. C, 103(015805), 2021.
- [89] N. Grevesse and A. Noels. Origin and evolution of the elements. Astronomisches Rechen-Institue, Heidelberg, (15), 1993.
- [90] K. Lodders. APJ, 591(1220), 2003.
- [91] N. Prantzos, C. Abia, S. Cristallo, M. Limongi, and A. Chieffi. MNRAS, 491:1832–1850, 2020.
- [92] C. Massimi. private communication. March 2019.