Toward Efficient Interactions between Python and Native Libraries
Abstract.
Python has become a popular programming language because of its excellent programmability. Many modern software packages utilize Python for high-level algorithm design and depend on native libraries written in C/C++/Fortran for efficient computation kernels. Interaction between Python code and native libraries introduces performance losses because of the abstraction lying on the boundary of Python and native libraries. On the one side, Python code, typically run with interpretation, is disjoint from its execution behavior. On the other side, native libraries do not include program semantics to understand algorithm defects.
To understand the interaction inefficiencies, we extensively study a large collection of Python software packages and categorize them according to the root causes of inefficiencies. We extract two inefficiency patterns that are common in interaction inefficiencies. Based on these patterns, we develop PieProf, a lightweight profiler, to pinpoint interaction inefficiencies in Python applications. The principle of PieProf is to measure the inefficiencies in the native execution and associate inefficiencies with high-level Python code to provide a holistic view. Guided by PieProf, we optimize 17 real-world applications, yielding speedups up to 6.3 on application level.
1. Introduction
In recent years, Python has become the most prominent programming language for data modeling and library development, especially in the area of machine learning, thanks to its elegant design that offers high-level abstraction, and its powerful interoperability with native libraries that delivers heavy numeric computations. Decoupling data analysis and modeling logics from operation logics is the singular mechanism guiding the remarkable improvements in developers’ productivity in the past decade. Python enables small teams to build sophisticated model (Nguyen, 2019) that were barely imaginable a few years ago, and enables large teams of modelers and numeric developers to seamlessly collaborate and develop highly influential frameworks such as Tensorflow (Abadi et al., 2015) and Pytorch (Paszke et al., 2017).
While high-level languages to articulate business logics and native libraries to deliver efficient computation is not a new paradigm, downstream developers have not always understood the details of native libraries, and have implemented algorithms that interacted poorly with native codes. A well-known example of the interaction inefficiency problem occurs when developers, who fail to recognize that certain matrix operations can be vectorized, write significantly slower loop-based solutions. MATLAB and Mathematica can alleviate the problem since these languages usually are locked with a fixed set of native libraries over a long time, and developers can establish simple best practice guidelines to eliminate most interaction inefficiencies (MATLAB contains the command, “try to vectorize whenever possible”).
In the Python ecosystem, native libraries and downstream application codes evolve rapidly so they can interact in numerous and unexpected ways. Therefore, building a list to exhaust all interaction inefficiencies becomes infeasible. We seek a solution that will automatically identify the blocks of Python code that lead to inefficient interactions, through closing the knowledge gap between Python and native code. Existing profiling tools cannot address this issue. Python profiles (Foundation, 2006; Zhou, 2019b; Frederickson, 2018; Uber, 2016; Rickerby, 2014; gak, 2013; Pelletier, 2013; pythonprofilers, 2012; Tornetta, 2018) cannot step in native code so they do not know execution details. Native profiling tools (Reinders, 2005; De Melo, 2010; Nistor et al., 2013; Adhianto et al., 2010; Chabbi and Mellor-Crummey, 2012; Wen et al., 2017; Su et al., 2019b; Wen et al., 2018) can identify hotspots, which sometimes offer leads to problematic code blocks. But because these tools do not have knowledge about Python code’s semantic, they cannot render detailed root cause and thus often make debugging remarkably challenging.
We propose PieProf, the first lightweight, insightful profiler to pinpoint interaction inefficiencies in Python programs. PieProf works for production Python software packages running in commodity CPU processors without modifying the software stacks. Its backbones algorithmic module is a recently proposed technique based on hardware performance monitoring units (PMUs) and debug registers to efficiently identify redundant memory accesses (hereafter, referred to as CL-algorithm111Chabbi-Liu Algorithm. (Wen et al., 2018; Su et al., 2019a)). CL-algorithm intelligently chooses a small collection of memory cells and uses hardware to track accesses to these cells at a fine granularity. For example, when the technique detects two consecutive writes of the same value to the same cell, it determines that the second write is unnecessary, and flags the responsible statement/function for further inspection. The developer can clearly see where a non-opt memory access occurs and why. The technique already shows its potential for eliminating inefficiencies in monolithic codebases that use one programming language.
PieProf leverages the CL-algorithm in a substantially more complex multi-languages environment, in which a dynamic and (predominantly) interpretation-based language Python is used to govern the semantics and native libraries compiled from C, C++, Fortran are used to execute high-performance computation. Doing so requires us to address three major challenges that crosscuts Python and native code.
At the measurement front, we need to suppress false positives and avoid tracking irrelevant memory operations produced from Python interpreter and Python-native interactions. For example, memory accesses performed by Python interpreters may “bait” the CL-algorithm to waste resources (i.e., debug registers) on irrelevant variables such as reference counters. At the infrastructure front, we need to penetrate entire software stacks: it cannot see execution details (i.e, how memory is accessed) with only Python runtime information, or cannot understand program semantics with only native library knowledge. Our main task here is to compactly implement lock-free calling context trees that span both Python code and native libraries, and retain a large amount of information to effectively correlate redundant memory accesses with inefficient interactions. At the memory/safety front, we need to avoid unexpected behaviors and errors caused by Python runtime. For example, Python’s garbage collection (GC) may reclaim memory that our tool is tracking. So delicate coordination between PieProf and Python interpreter is needed to avoid unexpected behaviors and errors.
We note that while most of the downstream applications we examined are machine learning related, PieProf is a generic tool that can be used in any codebase that requires Python-native library interactions.
Contributions. We make three contributions.
-
•
We are the first to thoroughly study the interaction inefficiencies between Python codes and native libraries. We categorize the interaction inefficiencies by their root causes.
-
•
We design and implement PieProf, the first profiler to identify interaction inefficiencies and provide intuitive optimization guidance, by carefully stepping through Python runtimes and native binaries. PieProf works for production Python software packages in commodity CPU processors without modifying the software stacks.
-
•
Following the guidance of PieProf, we examine a wide range of influential codebases and identify interaction inefficiencies in 17 real-world applications and optimize them for nontrivial speedups.
Organization. Section 2 reviews the background and related work. Section 3 characterizes the interaction inefficiencies. Section 4 describes the design and implementation of PieProf. Section 5 explains the evaluation. Section 6 presents case studies. Section 7 discusses some threats to validity. Section 8 presents some conclusions.
2. Background and Related Work
2.1. Python Runtime
Background on Python. Python is an interpreted language with dynamic features. When running a Python application, the interpreter translates Python source code into stack-based bytecode and executes it on the Python virtual machine (PVM), which varies implementations such as CPython (Community, 2007), Jython (Jyphon, 1999), Intel Python (Intel, 2017) and PyPy (Team, 2011). This work focuses on CPython because it is the reference implementation (Foundation, 2014), while the proposed techniques are generally applicable to other Python implementations as well. The CPython PVM maintains the execution call stack that consists of a chain of PyFrame objects known as function frames. Each PyFrame object includes the executing context of corresponding function call, such as local variables, last call instruction, source code file, and current executing code line, which can be leveraged by performance or debugging tools.
Python supports multi-threaded programming, where each Python thread has an individual call stack. Because of the global interpreter lock (GIL) (Foundation, 2010), the concurrent execution of Python threads is emulated as regular switching threads by the interpreter, i.e., for one interpreter instance, only one Python thread is allowed to execute at a time.
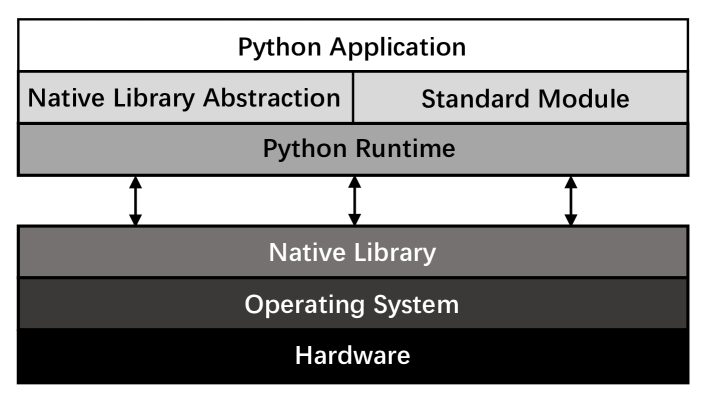
Interaction with native libraries. When heavy-lifting computation is needed, Python applications usually integrate native libraries written in C/C++/Fortran for computation kernels, as shown in Figure 1. Such libraries include Numpy (Van Der Walt et al., 2011; Harris et al., 2020), Scikit-learn (Pedregosa et al., 2011), Tensorflow (Abadi et al., 2015), and PyTorch (Paszke et al., 2017). Therefore, modern software packages enjoy the benefit from the simplicity and flexibility of Python and native library performance. When the Python runtime calls a native function, it passes the PyObject222PyObject is the super class of all objects in Python. or its subclass objects to the native function. The Python runtime treats the native functions as blackboxes — the Python code is blocked from execution until the native function returns.
Figure 1 shows an abstraction across the boundary of Python runtime and native library, which logically splits the entire software stack. On the upper level, Python applications are disjoint from their execution behaviors because Python runtime (e.g., interpreter and GC) hides most of the execution details. On the lower level, the native libraries lose most program semantic information. This knowledge gap leads to interaction inefficiencies.
2.2. Existing Tools vs. PieProf
This section compares existing tools that analyze inefficiencies in Python and native codes to distinguish PieProf.
Python performance analysis tools. PyExZ3 (Irlbeck et al., 2015), PySym (Github, 2018), flake8 (Cordasco, 2010), and Frosted (timothycrosley, 2014) analyze Python source code and employ multiple heuristics to identify code issues statically (Gulabovska and Porkoláb, 2019). XLA (Team et al., 2017) and TVM (Chen et al., 2018) apply compiler techniques to optimize deep learning applications. Harp (Zhou et al., 2020) detects inefficiencies in Tensorflow and PyTorch applications based on computation graphs. All of these approaches, however, ignore Python dynamic behavior, omitting optimization opportunities.
Dynamic profilers are a complementary approach. cProfile (Foundation, 2006) measures Python code execution, which provides the frequency/time executions of specific code regions. Guppy (Zhou, 2019b) employs object-centric profiling, which associates metrics such as allocation frequency, allocation size, and cumulative memory consumption with each Python object. PyInstrument (Rickerby, 2014) and Austin (Tornetta, 2018) capture Python call stack frames periodically to identify executing/memory hotspots in Python code. PySpy (Frederickson, 2018) is able to attach to a Python process and pinpoint function hotspots in real time. Unlike PieProf, these profilers mainly focus on Python codes, with no insights into the native libraries.
Closely related to PieProf, Scalene (Berger, 2020) separately attributes Python/native executing time and memory consumption. However, it does not distinguish useful/wasteful resources usage as PieProf does.
Native performance analysis tools. While there are many native profiling tools (Reinders, 2005; De Melo, 2010; Adhianto et al., 2010), from which the most related to Python that can identify performance inefficiencies are Toddler (Nistor et al., 2013) that identifies redundant memory loads across loop iterations, and LDoctor (Song and Lu, 2017) that reduces Toddler’s overhead by applying dynamic sampling and static analysis. DeadSpy (Chabbi and Mellor-Crummey, 2012), RedSpy (Wen et al., 2017), and LoadSpy (Su et al., 2019b) analyze dynamic instructions in the entire program execution to detect useless computations or data movements. Unfortunately, all of them use heavyweight binary instrumentation, which results in high measurement overhead, and they do not work directly on Python programs.
2.3. Performance Monitoring Units and Hardware Debug Registers
Hardware performance monitoring units (PMUs) are widely equipped on the modern x86 CPU architectures. Software can use PMUs to count various hardware events like CPU cycles, cache misses, et cetera. Beside the counting mode that counts the total number of events, PMUs can be configured in sampling, which periodically sample a hardware event and record event’s detailed information. PMUs trigger an overflow interrupt when the sample number reaches a threshold. The profiler runtime captures interrupts as signals and collects samples with their executing contexts.
For memory-related hardware events such as memory load and store, Precise Event-Based Sampling (PEBS) (Corp, 2010) in Intel processors provides the effective address and the precise instruction pointer for each sample. Instruction-Based Sampling (IBS) (Drongowski, 2007) in the AMD processors and Marked Events (MRK) (Srinivas et al., 2011) in PowerPC support similar functionalities.
Hardware debug registers (Johnson, 1982; McLear et al., 1982) trap the CPU execution when the program counter (PC) reaches an address (breakpoint) or an instruction accesses a designated address (watchpoint). One can configure the trap conditions with different accessing addresses, widths and types. The number of hardware debug registers is limited (e.g., the modern x86 processor has four debug registers).
3. Interaction Inefficiency Characterization
This section provides a high-level preview of the key findings from applying PieProf to an extensive collection of high-profile Python libraries at Github. We specifically categorize the interaction inefficiencies according to the root causes and summarize the common patterns, which serve three purposes: (i) this is the first characterization of interaction inefficiencies based on large scale studies, thus rendering a more complete landscape of potential code quality issues that exist in Python codebase for ML and beyond, (ii) we see a diverse set of inefficiencies hiding deep in Python-native library interaction, which justifies using heavy machineries/profiling tools to automatically identify them, and (iii) these concrete examples explain the common patterns we use to drive the PieProf ’s design.
3.1. Interaction Inefficiency Categorization
We categorize interaction inefficiencies into five groups. For each category, we give a real example, analyze the root causes, and provide a fix.
Slice underutilization. Listing 1 is an example code from IrisData (Stott, 2017), a back-propagation algorithm implementation on Iris Dataset (Fisher, 1936). A loop iterates two multidimensional arrays ihGrads and ihWeights with indices i and j for computation. Because Python arrays are supported by native libraries such as Numpy and PyTorch/TensorFlow, indexing operations (i.e., []) in a loop trigger native function calls that repeat boundary and type checks (Numpy, 2009).
The so-called vectorization/slicing eliminates repeated “housework” and (usually) enables the underlying BLAS (Blackford et al., 2002) library to perform multi-core computation. Listing 2 shows a simple fix in a 2 speedup for the entire program execution.
Repeated native function calls with the same arguments. Functions from native libraries typically have no side effects, so applying the same arguments to a native function results in the same return value, which introduces redundant computations. Listing 3 shows a code from Matplotlib (Hunter, 2007), a comprehensive library for visualization and image manipulation. This code rotates an image and is often invoked in training neural nets for images.
The argument theta for the rotate function (rotate angle) is usually the same across consecutive invocations from deep learning training algorithms because they rotate images in the same batch in the same way. Here, Pyobjects returned from native functions np.cos(), np.sin() and np.array() in lines 2-4 have the same values across images that share the same input theta.
This can be fixed by either a simple caching trick (Della Toffola et al., 2015; Nguyen and Xu, 2013), or refactoring the rotate funcion so that it can take a batch of images. We gain a 2.8 speedup after the fix.
Inefficient algorithms. Listing 4 is an example of algorithmic inefficiencies from Scikit-learn, a widely used machine learning package. The code works on X, a two-dimensional Numpy array. It calls the native function swap from the BLAS library to exchange two adjacent vectors. In each iteration, swap returns two PyObjects and Python runtime assigns these two PyObjects to X.T[i] and X.T[i+1], respectively. The loop uses swap to move the first element in the range to the end position. Inefficiencies occur because it requires multiple iterations to move X.T[i] to the final location.
Instead of using swap, we directly move each element to the target location. We apply a similar optimization to the indices array as well. Our improvement yields a 6.1 speedup to the lars_path function.
API misuse in native libraries. Listing 5 is an example of API misuse from Metaheuristic (Nguyen et al., 2019, 2018), which implements the-state-of-the-art meta-heuristic algorithms. The code accumulates the computation results to res. Since the computation is based on Numpy arrays, the accumulation operation triggers one native function call in each iteration, resulting in many inefficiencies.
In Listing 6 shows our fix (i.e., use the efficient sum API from Numpy) which avoids most of the native function invocations by directly operating on the Numpy arrays. This optimization removes most of interaction inefficiencies, and yields a 1.9 speedup to the entire program.
Loop-invariant computation. Listing 7 is a code snippet from Deep Dictionary Learning (Mahdizadehaghdam et al., 2019), which seeks multiple dictionaries at different image scales to capture complementary coherent characteristics implemented with TensorFlow. Lines 1-3 indicate the computation inputs A, D, and X. Lines 4-5 define the main computation. Lines 6-7 execute the computation with the actual parameters D_ and X_. The following pseudo-code shows the implementation:
for i 1 to Iter do
where D and X are loop invariants. If we expand the computation, and can be computed outside the loop and reused among iterations, shown as pseudo-code:
for i 1 to Iter do
This optimization yields a 3 speedup to the entire program (Zhou et al., 2020).
| Inefficiency Pattern | Inefficiency Category |
|---|---|
| Redundant Loads | Slice underutilization |
| Inefficient algorithms | |
| API misuse in native libraries | |
| Redundant Stores | Loop-invariant computation |
| Repeated native function calls with same arguments | |
| Inefficient algorithms | |
| API misuse in native libraries |
3.2. Common Patterns in Interaction Inefficiencies
We are now ready to explain the common patterns in code that exhibits interaction efficiencies, which we use to drive the design of PieProf. Specifically, we find that almost all interaction inefficiencies involve (i) repeatedly reading the same PyObjects of the same values, and (ii) repeatedly returning PyObjects of the same values.
Both observations require developing a tool to identify redundant PyObjects, which is difficult and costly because it requires heavyweight Python instrumentation and modification to Python runtime. Further analysis, however, finds that PyObject redundancies reveal the following two low-level patterns during the execution from the hardware perspective.
-
•
Redundant loads: If two adjacent native function calls read the same value from the same memory location, the second native function call triggers a redundant (memory) load. Repeatedly reading PyObject of the same value result in redundant loads.
-
•
Redundant stores: If two adjacent native function calls write the same value to the same memory location, the second native function call triggers a redundant (memory) store. Repeatedly returning PyObject of the same value result in redundant stores.
We use the redundant loads and stores to serve as indicators of interaction inefficiencies. Table 1 shows different categories of interaction inefficiencies, which show up as redundant loads or stores. Section 4 describes how we use the indicators.
4. Design and Implementation
4.1. Overview
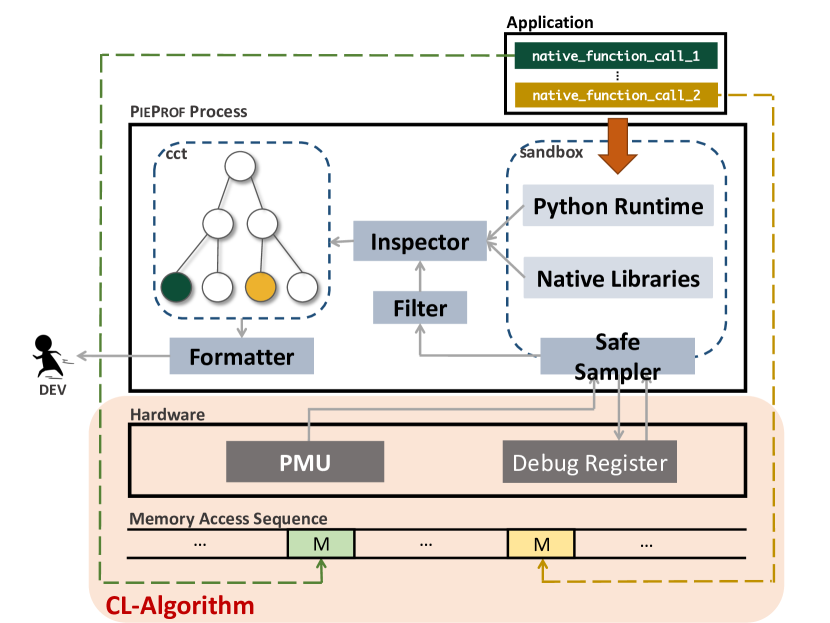
See Figure 2. Recall that the CL-algorithm controls PMUs and debug registers to report redundant member accesses of a process. PieProf interact with Python runtime, native libraries, and the CL-algorithm through three major components: (i) Safeguard and sandbox. A thin sandbox is built around Python interpreter and native libraries, and a safeguard is implemented inside the sandbox to moderate communication between Python runtime and the CL-algorithm. (ii) Measurement. Upon receiving an event from the CL-algorithm, the measurement component determines whether to notify CCT (calling context tree) builder to update the CCT, and (iii) CCT Builder. Upon receiving an update from the measurement component, CCT builder examines Python runtime and native call stacks to update CCT.
When an interaction inefficiency is detected, it will report to the end user (developer).
The measurement component helps to suppress false positive and avoid tracking irrelevant variables (e.g., reference counters), the CCT builder continuously update the lock-free CCT, and Safeguard/sandbox ensures that the Python application can be executed without unexpected errors.
We next discuss each component in details.
4.2. Measurement
CL-algorithm. CL-algorithm uses PMUs and debug registers to identify redundant loads and stores in an instruction stream. It implements a conceptually simple and elegant process: a sequence memory access instructions arrive at the CL-algorithm in a streaming fashion. Here, refers to the address of the memory access for the -th instruction. Upon seeing a new memory access instruction (step 1, i.e ❶ in Figure 2), the CL-algorithm uses PMUs to probabilistically determine whether it needs to be tracked (step 2), and if so, store the address in a debug register (step 3). If the debug registers are all used, a random one will be freed up. When a subsequent access to (or any addresses tracked by debug registers) occurs (step 4), the debug register will trigger an interrupt so that the CL-algorithm can determine whether the access is redundant (step 5), by using the rules outlined in Section 3.2. Since the number of debug registers is usually limited, the CL-algorithm uses a reservoir sampling (Vitter, 1985) technique to ensure that each instruction (and its associated memory accesses) has a uniform probability of being sampled.
Improving measurement efficiencies. First, PMUs sample instructions at the hardware level so it cannot distinguish memory accesses from the Python interpreter from those from the Python applications. In practice, a large fraction of memory access sequences are related to updating reference counters for Python objects. Therefore, most debug registers will be used to track reference counters if we bluntly use the CL-algorithm, and substantially reduces the chances of identifying memory access redundancies. Second, it needs to ignore redundant memory accesses occurring within the same native function call, or within a code region of PieProf because they are not related to interaction inefficiencies. Note that tracking redundant memory accesses within the same native function call is worse than merely producing false positives because it can bury true instances. For example, two write instructions and of the same value are performed on the same memory from function , and later function performs a third write instruction of the same value on the same location. If we track redundant accesses within the same function, the CL-algorithm says it has found a redundant pair , evicts from the debug register. and never detects the redundant pair caused by the real interaction inefficiencies.
PieProf performs instruction-based filter to drop a sample if (i) its instruction pointer falls in the code region unrelated to native function calls (e.g., that of PieProf), (ii) its memory access address belongs to “junky” range, such as the head of PyObject that contains the reference number. In addition, when the CL-algorithm delivers a redundant memory access pair to PieProf, it checks the Python runtime states and drops the sample when these two memory accesses occur inside a same state (corresponding to within the same native function call).
4.3. Calling Context Trees Builder
This section first explains the construction of call paths, and then explains how they can be used to construct signal-free calling context trees (CCTs).
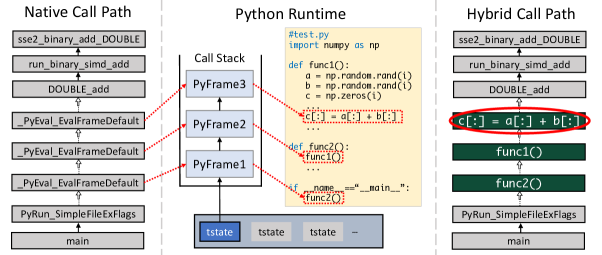
Hybrid call path. PieProf uses libunwind (Savannah/kernel.org, 2005) to unwind the native call path of a Python process to obtain a chain of procedure frames on the call stack. See the chain of “Native Call Path” on the left in Figure 3. Here, call stack unwinding is not directly applicable to Python code because of the abstraction introduced by PVM. The frames on the stack are from PVM, not Python codes. For example, the bottom _PyEval_EvalFrameDefault333_PyEval_EvalFrameDefault is a frame (i.e., a function pointer) in the native call stack in runtime that corresponds to invocation of a function or a line of code in Python. shows up in “Native Call Path”, but we need the call to correspond to func2() in Python code (connected through PyFrame1). Thus, PieProf needs to inspect the dynamic runtime to map native calls with Python calls on the fly.
1. Mapping PyFrame to Python calls. First, we observe that each Python thread maintains its call stacks in a thread local object PyThreadState (i.e., tstates in Figure 3). To obtain Python’s calling context, PieProf first calls GetThisThreadState()444GetThisThreadState() is a PVM API to retrieve an object that contains the state of current thread. to get the PyThreadState object of the current thread. Second PieProf obtains the bottom PyFrame object (corresponding to the most recently called function) in the PVM call stack from the PyThreadState object. All PyFrame objects in the PVM call stack are organized as a singly linked list so we may obtain the entire call stack by traversing from the bottom PyFrame. Each PyFrame object contains rich information about the current Python frame, such as source code files and line numbers that PieProf can use to correlate a PyFrame to a Python method. In Figure 3, PyFrame1, PyFrame2, and PyFrame3 are for Python methods main, func2, and func1, respectively.
2. Extracting PyFrame’s from Native Call Path. Each Python function call leaves a footprint of _PyEval_EvalFrameDefault in the native call stack so we need only examine _PyEval_EvalFrameDefault. Each _PyEval_EvalFrameDefault maps to a unique PyFrame in the call stack of the active thread in Python Runtime. In addition, the ordering preserves, e.g., the third _PyEval_EvalFrameDefault in “Native Call Path” corresponds to the third PyFrame in Python’s call stack. Therefor use standard Python interpreter APIs to obtain the PyFrame’s and map them back to nodes in the native call path.
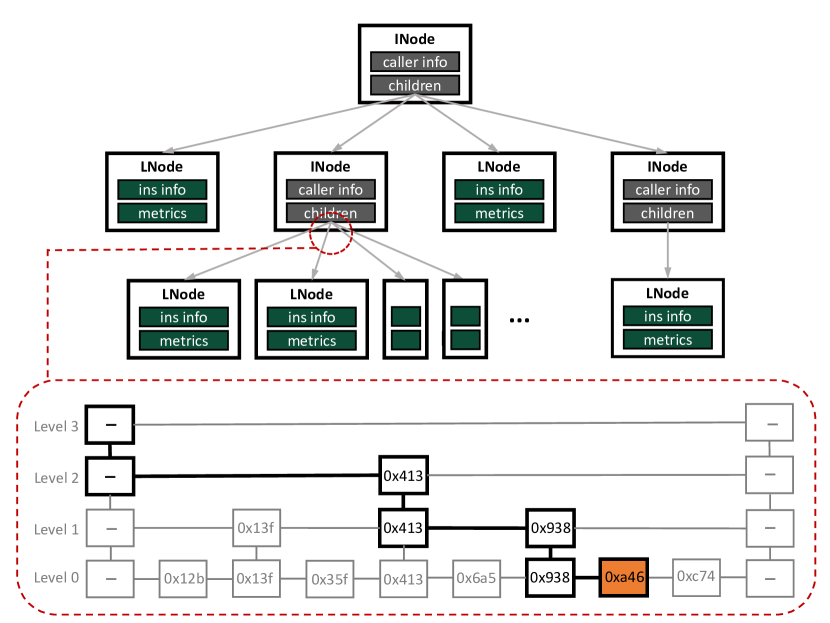
CCT from call paths. PieProf applies a compact CCT (Arnold and Sweeney, 2000; Ammons et al., 1997) to represent the profile. Figure 4 shows the structure of a CCT produced by PieProf. The internal nodes represent native or Python function calls, and the leaf nodes represents the sampled memory loads or stores. Logically, each path from a leaf node to the root represents a unique call path.
As mentioned, Python is a dynamic typing language, and uses meta-data to represent calling context (e.g., the function and file names in string form); therefore, its call stacks are usually substantially larger (in space) than those in static languages. One solution is to build a dictionary to map strings to integer ids but the solution must be signal-free because it needs to interact with the CL-algorithm and PMUs, which is prohibitively complex.
Our crucial observation is that function calls in different threads near the root of a tree usually repeat so unlike solutions appeared in (Chabbi and Mellor-Crummey, 2012; Wen et al., 2017; Su et al., 2019b; Chabbi et al., 2014; Su et al., 2019a), which produce a CCT for each thread/process, PieProf constructs a single CCT for the entire program execution. In this way, the same function call appearing in different threads is compressed into one node and space complexity is reduced. PieProf also implements a lock-free/signal-safe skip-list (Pugh, 1990) to maintain CCT’s edges for fast and thread-safe operations. In theory, Skip-list’s lookup, insert, and delete operations have time complexity. In practice, Skip-list with more layers has higher performance but higher memory overhead. In a CCT, the nodes closer to the root are accessed more frequently. PieProf, however,proportionally adjusts the number of layers in the skip-lists at different levels in a CCT to optimize the performance and overhead tradeoffs. It uses more layers to represent the adjacency lists of nodes that are close to the root, and fewer layers to represent those that are close to the leaves.
4.4. Safeguard
PieProf uses two mechanisms to avoid unexpected errors in Python runtime. It will hibernate if it enters a block of code, interrupting which will cause state corruption in PVM, and will block certain activities from GC if the activities can cause memory issues.
| Program Information | Inefficiency | Optimization | ||||
| Applications | Library | Problem Code | Category | Pattern | AS | FS |
| Ta (Padial, 2018) | Ta | volatily.py(45)/trend.py(536, | Slice underutilization | 1.1 | 16.6 | |
| 549, 557, 571, 579) | ||||||
| NumPyCNN (Gad, 2018) | Numpy (Harris et al., 2020; Van Der Walt et al., 2011) | numpycnn.py(161) | Loop-invariant computation | 1.8 | 2.04 | |
| Census_main | NumpyWDL (Stasi, 2018) | ftrl.py(60) | Loop-invariant computation | 1.03 | 1.1 | |
| Lasso | Scikit-learn (Pedregosa et al., 2011) | least_angle.py(456, 458) | Inefficient algorithms | 1.2 | 6.1 | |
| IrisData (Stott, 2017) | Numpy | nn_backprop.py(222, 228, | Slice underutilization & | 2 | 2.02 | |
| 247, 256, 263, 271, 278) | API misuse | |||||
| Network | Neural-network- | network.py(103-115) | Repeated NFC | 1.03 | 1.05 | |
| from-scratch | ||||||
| Cnn-from-scratch (Zhou, 2019a) | Numpy | conv.py(62) | Slice underutilization | 2.5 | 3.9 | |
| Metaheuristics (Nguyen et al., 2019, 2018) | Numpy | FunctionUtil.py(374) | API misuse | 1.4 | 1.9 | |
| FunctionUtil.py(270) | Slice underutilization | 6.3 | 27.3 | |||
| FunctionUtil.py(309, 375) | Loop-invariant computation | 1.04 | 1.4 | |||
| FunctionUtil.py(437) | Repeated NFC | 1.02 | 1.1 | |||
| EPO.py(40) | Loop-invariant computation | 1.1 | 1.1 | |||
| LinearRegression (Kulpati, 2018) | LinearRegression | LinearRegression.py(49, 50) | Repeated NFC | 1.4 | 1.5 | |
| Pytorch-examples (Johnson, 2017) | PyTorch (Paszke et al., 2017) | adam.py:loop(66) | Loop-invariant computation | 1.02 | 1.07 | |
| Cholesky (Zhou et al., 2020) | PyTorch | cholesky.py(76) | Slice underutilization | 3.2 | 3.9 | |
| GGNN.pytorch (Chuang, 2018) | PyTorch | model.py(122, 125) | Loop-invariant computation | 1.03 | 1.07 | |
| Network-sliming (Liu et al., 2017) | Torchvision (PyTorch, 2017) | functional.py(164) | Slice underutilization | 1.1 | 1.7 | |
| Pytorch-sliming (Liu et al., 2017) | 1.04 | 1.7 | ||||
| Fourier-Transform (Kapotos, 2018) | Matplotlib (Hunter, 2007) | transforms.py(1973) | Repeated NFC | 1.02 | 2.8 | |
| Jax (Bradbury et al., 2018) | 1.04 | 2.8 | ||||
| Autograd (Group, 2015) | 1.05 | 2.8 | ||||
Hibernation at function-level. Upon seeing an event (e.g., an instruction is sampled or a redundant memory access is detected), the PMUs or debug registers use interrupt signals to interact with PieProf, which will pause Python’s runtime. Error could happen if Python run time is performing certain specific tasks when an interrupt exception is produced. For example, if it is executing memory management APIs, memory error (e.g., segmentation fault) could happen, and if Python is loading native library, deadlock could happen.
PieProf maintains a list of functions, inside which PieProf needs to be temporarily turned off (i.e., in hibernation mode). To do so, PieProf maintains a block list of function, and implements wrappers for each function in the list. Calls to these functions are redirected to the wrapper. The wrapper turns off PieProf, executes the original function, and turns on PieProf again.
Dropping events vs. hibernation. We sometimes drop an event when it is unwanted (Section 4.2). Complex logic can be wired to drop an event at the cost of increased overhead. Here, hibernating PieProf is preferred to reduce overhead because no event needs to be kept for a whole block of code.
Blocking garbage collector. When Python GC attempts to deallocate the memory that debug registers are tracking, errors could occur. Here, we uses a simple trick to defer garbage collection activities: when PieProf monitors memory addresses and it is within a PyObject, it increases the corresponding PyObject’s reference, and decreases the reference once the address is evicted. This ensures that memories being tracked will not be deallocated. Converting addresses to PyObject’s is done through progressively heavier mechanisms. First, PyObject’s exist only in a certain range of the memory so we can easily filter out addresses that do not correspond to PyObject (which will not be deallocated by GC). Second, we can attempt to perform a dynamic casting on the address and will succeed if that corresponds to the start of an PytObject. This handles most of the cases. Finally, we can perform a full search in the allocator if we still cannot determine whether the address is within a PyObject.
5. Evaluation
This section studies the effectiveness of PieProf (e.g., whether it can indeed identify interaction inefficiencies) and its overheads.
We evaluate PieProf on a 14-core Intel Xeon E7-4830 v4 machine clocked at 2GHz running Linux 3.10. The machine is equipped with 256 GB of memory and four debug registers. PieProf is compiled with GCC 6.2.0 -O3, and CPython (version 3.6) is built with --enable-shared flag. PieProf subscribes hardware event MEM_UOPS_RETIRED_ALL_STORES for redundant stores detection and MEM_UOPS_RETIRED_ALL_LOADS for redundant loads detection, respectively.
5.1. Effectiveness
This section assesses the effectiveness of PieProf, and the breadth of the interaction inefficiencies problem among influential Python packages. The lack of a public benchmark creates two inter-related challenges: (i) determining the codebases to examine inevitably involves human intervention, and (ii) most codebases provide a small number of “hello world” examples, which have limited test coverage.
We aim to include all “reasonably important” open-source projects and we use only provided sample code for testing. While using only sample code makes inefficiency detection more difficult, this helps us to treat all libraries as uniformly as possible. For each of Numpy, Scikit-learn, and Pytorch, we find all projects in Github that import the library, and sort them by popularity, which gives us three lists of project candidates. Our stopping rule for each list differs and involves human judgement because we find that the popularity of a project may not always reflect its importance (e.g., specialized libraries could be influential, but generally have smaller user bases, and are less popular in Github’s rating system). For example, Metaheuristics is important and included in our experiment but it received only 91 ratings at the time we performed evaluation. At the end, we evaluated more than 70 read-world applications, among which there are more projects that import Numpy than the other two libraries.
Indentifying a total of 19 inefficiencies is quite surprising because these projects are mostly written by professionals, and the sample codes usually have quite low codebase coverage, and are usually “happy paths” that are highly optimized. The fact that we identify 18 new performance bugs as reported in Table 2, indicates that interaction inefficiencies are quite widespreaded.
Table 2 reports that the optimizations following PieProf’s optimization guidance lead to 1.02 to 6.3 application-level speedup (AS), and 1.05 to 27.3 function-level speedup (FS), respectively. According to Amdahl’s law, AS approaches FS as the function increasingly dominates the overall execution time. For the five inefficiency categories we define in Section 3.1 and which are common in real applications, PieProf’s superior redundant loads/stores detection proves its effectiveness.
5.2. Overhead
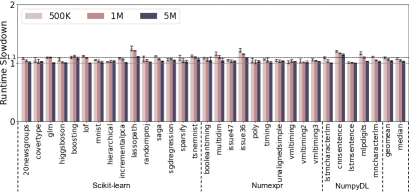
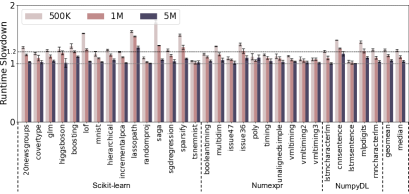
This section reports the runtime slowdown and memory bloating caused by PieProf. We measure runtime slowdown by the ratio of program execution time with PieProf enabled over its vanilla execution time. Memory bloating shares the same measuring method but with the peak memory usage.
Since Python does not have standard benchmarks, we evaluate the overhead of PieProf on three popular Python applications — Scikit-learn, Numexpr (pydata, 2009), and NumpyDL (Wang, 2017) which contain benchmark programs from scientific computing, numerical expression and deep learning domains. We report only the first half of the Scikit-learn benchmark due to space limitations, and exclude varying-expr.py from Numexpr, cnn-minist.py and mlp-minist.py from NumpyDL due to large variations in memory consumption, or the runtime errors of vanilla runs cnn-minist.py and mlp-minist.py.
We run each experiment three times, and report the average overhead. Furthermore, the overhead of PieProf is evaluated with three commonly-used sampling rates, 500K, 1M, and 5M.
Figure 5a shows the runtime slowdown of the redundant stores detection. The geo-means are 1.09, 1.07, and 1.03 under the sampling rates of 500K, 1M, and 5M, and the medians are 1.08, 1.05, and 1.03, respectively. Figure 5b shows the runtime slowdown of the redundant loads detection. The geo-means are 1.22, 1.14, and 1.05, under the sampling rates of 500K, 1M, and 5M, and the medians are 1.22, 1.11, and 1.04, respectively. The runtime slowdown drops as sampling rate decreases, because more PMUs samples incur more frequent profiling events, such as inspecting Python runtime, querying the CCT, and arming/disarming watchpoints to/from the debug registers. Redundant loads detection incurs more runtime slowdown compared to redundant stores detection, because programs usually have more loads than stores. Another reason is that PieProf sets RW_TRAP for the debug register to monitor memory loads (x86 does not provide trap on read-only facility) which traps on both memory stores and loads. Even though PieProf ignores the traps triggered by memory stores, monitoring memory loads still incurs extra overhead.
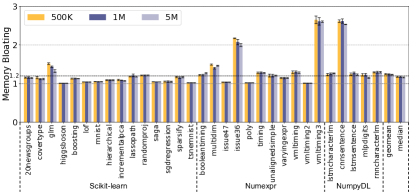
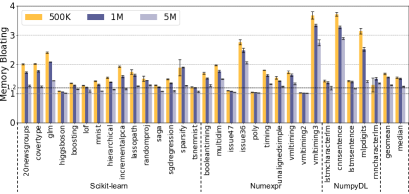
Figure 6a shows memory bloating of the redundant stores detection. The geo-means are 1.25, 1.24, and 1.23 under the sampling rates of 500K, 1M, and 5M, and the medians are 1.18, 1.18, and 1.16, respectively. Figure 6b reports memory bloating of the redundant loads detection. The geo-means are 1.67, 1.56, and 1.29 under the same sampling rates, and the medians are 1.52, 1.51, and 1.24, respectively. Memory bloating shows a similar trend to runtime slowdown with varied sampling rates and between two kinds of inefficiency detection. The extra memory consumption is caused by the larger CCT required for the larger number of unique call paths. issue36, vmltiming2, and cnnsentence suffer the most severe memory bloating due to the small memory required by their vanilla runs. PieProf consumes a fixed amount of memory because some static structures are irrelevant to the testing program. Thus, a program has a higher memory bloating ratio if it requires less memory for a vanilla run. mlpdigits consumes more memory for redundant loads detection, because mlpdigits (a deep learning program) contains a two-level multilayer perceptron (MLP) that has more memory loads than stores.
Although lower sampling rates reduce overhead, the probability of missing some subtle inefficiencies increases. To achieve a better trade-off between overhead and detecting ability, we empirically select 1M as our sampling rate.
6. Case Studies
This section discusses our three heuristic case studies. Our primary aim is to demonstrate the superior guidance provided by PieProf for inefficiency detection and optimization.
6.1. CNN-from-Scratch
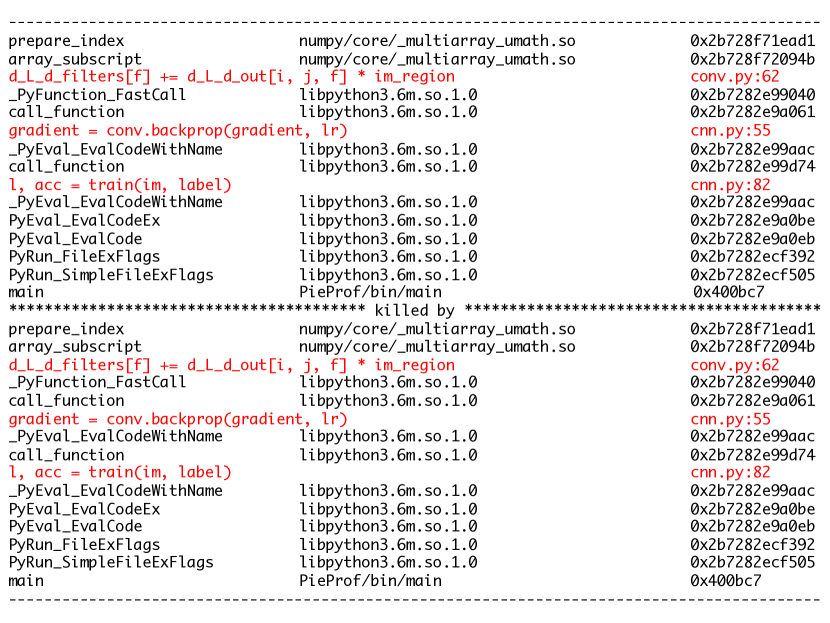
CNN-from-Scratch is an educational project that implements a Convolutional Neural Network. The code in Listing 8 performs tensor computation within a two-level nested loop. d_L_d_filters is a 833 tensor, d_L_d_out is a 26268 tensor and im_region is a 33 tensor. The inner loop iterates d_L_d_filters by its first dimension, iterates d_L_d_out by its third dimension. In each iteration of inner loop, d_L_d_filters[f] performs as a 33 tensor, and d_L_d_out[i, j, f] is a number. The computation in line 5 is summarized as a 33 vector cumulatively adding the multiplication of a number and a 33 vector.
Figure 7 shows a redundant loads pair reported by PieProf. The redundant pair is represented as hybrid call path, and the upper call path is killed by the lower call path. For each native call path, PieProf reports the native function name, shared library directory, and the instruction pointer. For each Python call path, it reports the problematic code piece and its location in the source file. In this case, the call path pair reveals that the interaction inefficiency is introduced by line 62 of conv.py (line 5 in Listing 8). The call path also shows that the inefficiency caused by native function call prepare_index(array_subscript), denotes the redundant [] operations. This inefficiency belongs to the category of slice under-utilization.
For optimization, we match the dimension of d_L_d_filters, d_L_d_out, and im_region by expanding the dimension of im_region, and use slice notation to replace the inner loop, as shown in Listing 9. The optimization yields a 3.9 function-level speedup and 2.5 application-level speedup.
6.2. Metaheuristics
Listing 10 is a code snippet from Metaheuristics. It performs complex numerical computation in a two-level nested loop, where x is a Numpy array. PieProf reports a redundant loads on line 6, where the code triggers the redundant native function call array_multiply and LONG_power. Guided by this, we observe that np.abs(np.power(2,j+1)*x[i] is calculated twice within every iteration, because the code aims to get the computation result’s fraction part. To eliminate the redundant computation, we use math.modf function to calculate the fraction directly.
This inefficiency belongs to the category of API misuse in native libraries. PieProf also reports redundant stores in line 7 with native function LONG_power. Upon further investigation, we find the result of np.power(dim, 1.2) does not change among iterations, which belong to loop-invariant computation. For optimization, we use a local variable to store the result outside the loop and reuse it among iterations. The appropriate usage of API yields 1.4 application-level speedup and 1.9 function-level speedup, and eliminating loop invariant computation yields 1.04 application-level speedup and 1.4 function-level speedup, respectively.
6.3. Technical Analysis
Technical Analysis (Ta) (Padial, 2018) is a technical analysis Python library. Listing 12 is a problematic code region of Ta, where adx and dx are two multi-dimension Numpy arrays, and a loop iterates them and performs numerical calculations.
PieProf reports redundant loads in line 6 with native function array_subscript, which denotes the code that suffers from the inefficiency of slice underutilization. Unfortunately, we cannot eliminate the loop because adx has computing dependency among the iterations. Therefor, we optimize the access to dx with slice notation shown in Listing 13. Eliminating all similar patterns in Ta yields 1.1 application-level speedup and 16.6 function-level speedup.
7. Threats to Validity
The threats mainly exist in applying PieProf for code optimization. The same optimization for one Python application may show different speedups on different computer architectures. Some optimizations are input-sensitive, and a different profile may demand a different optimization. We use either typical inputs or production inputs of Python applications to ensure that our optimization improves the real execution. As PieProf pinpoints inefficiencies and provides optimization guidance, programmers will need to devise a safe optimization for any execution.
8. Conclusions
This paper is the first to study the interaction inefficiencies in complex Python applications. Initial investigation finds that the interaction inefficiencies occur due to the use of native libraries in Python code, which disjoins the high-level code semantics with low-level execution behaviors. By studying a large amount of applications, we are able to assign the interaction inefficiencies to five categories based on their root causes. We extract two common patterns, redundant loads and redundant stores in the execution behaviors across the categories, and design PieProf to pinpoint interaction efficiencies by leveraging PMUs and debug registers. PieProf cooperates with Python runtime to associate the inefficiencies with Python contexts. With the guidance of PieProf, we optimize 17 Python applications, fix 19 interaction inefficiencies, and gain numerous nontrivial speedups.
Acknowledgements.
We thank the anonymous reviewers for their valuable comments. We thank Denys Poshyvanyk for his feedback to the paper. This work is supported in part by NSF grants CNS-2050007, CRII-1755769, OAC-1835821, IIS-2008557, CCF-1703487, CCF-2028850 and CCF-2047516, a Department of Energy (DOE) grant DE-SC0013700.References
- (1)
- Abadi et al. (2015) Martín Abadi, Ashish Agarwal, Paul Barham, Eugene Brevdo, Zhifeng Chen, Craig Citro, Greg S. Corrado, Andy Davis, Jeffrey Dean, Matthieu Devin, Sanjay Ghemawat, Ian Goodfellow, Andrew Harp, Geoffrey Irving, Michael Isard, Yangqing Jia, Rafal Jozefowicz, Lukasz Kaiser, Manjunath Kudlur, Josh Levenberg, Dandelion Mané, Rajat Monga, Sherry Moore, Derek Murray, Chris Olah, Mike Schuster, Jonathon Shlens, Benoit Steiner, Ilya Sutskever, Kunal Talwar, Paul Tucker, Vincent Vanhoucke, Vijay Vasudevan, Fernanda Viégas, Oriol Vinyals, Pete Warden, Martin Wattenberg, Martin Wicke, Yuan Yu, and Xiaoqiang Zheng. 2015. TensorFlow: Large-Scale Machine Learning on Heterogeneous Systems. https://www.tensorflow.org/ Software available from tensorflow.org.
- Adhianto et al. (2010) Laksono Adhianto, Sinchan Banerjee, Mike Fagan, Mark Krentel, Gabriel Marin, John Mellor-Crummey, and Nathan R Tallent. 2010. HPCToolkit: Tools for performance analysis of optimized parallel programs. Concurrency and Computation: Practice and Experience 22, 6 (2010), 685–701.
- Ammons et al. (1997) Glenn Ammons, Thomas Ball, and James R Larus. 1997. Exploiting hardware performance counters with flow and context sensitive profiling. ACM Sigplan Notices 32, 5 (1997), 85–96.
- Arnold and Sweeney (2000) Matthew Arnold and Peter F Sweeney. 2000. Approximating the calling context tree via sampling. IBM TJ Watson Research Center Yorktown Heights, New York, US.
- Berger (2020) Emery D Berger. 2020. Scalene: Scripting-Language Aware Profiling for Python. arXiv preprint arXiv:2006.03879 (2020).
- Blackford et al. (2002) L Susan Blackford, Antoine Petitet, Roldan Pozo, Karin Remington, R Clint Whaley, James Demmel, Jack Dongarra, Iain Duff, Sven Hammarling, Greg Henry, et al. 2002. An updated set of basic linear algebra subprograms (BLAS). ACM Trans. Math. Software 28, 2 (2002), 135–151.
- Bradbury et al. (2018) James Bradbury, Roy Frostig, Peter Hawkins, Matthew James Johnson, Chris Leary, Dougal Maclaurin, and Skye Wanderman-Milne. 2018. JAX: composable transformations of Python+NumPy programs. http://github.com/google/jax
- Chabbi et al. (2014) Milind Chabbi, Xu Liu, and John Mellor-Crummey. 2014. Call paths for pin tools. In Proceedings of Annual IEEE/ACM International Symposium on Code Generation and Optimization. 76–86.
- Chabbi and Mellor-Crummey (2012) Milind Chabbi and John Mellor-Crummey. 2012. DeadSpy: A Tool to Pinpoint Program Inefficiencies. In Proceedings of the Tenth International Symposium on Code Generation and Optimization (CGO ’12). ACM, New York, NY, USA, 124–134.
- Chen et al. (2018) Tianqi Chen, Thierry Moreau, Ziheng Jiang, Haichen Shen, Eddie Q Yan, Leyuan Wang, Yuwei Hu, Luis Ceze, Carlos Guestrin, and Arvind Krishnamurthy. 2018. TVM: end-to-end optimization stack for deep learning. arXiv preprint arXiv:1802.04799 11 (2018), 20.
- Chuang (2018) Ching-Yao Chuang. 2018. GGNN: A PyTorch Implementation of Gated Graph Sequence Neural Networks. https://github.com/chingyaoc/ggnn.pytorch.
- Community (2007) CPython Community. 2007. C-Extensions for Python. https://cython.org/#documentation.
- Cordasco (2010) Ian Stapleton Cordasco. 2010. Flake8: Your Tool For Style Guide Enforcement. https://flake8.pycqa.org/en/latest/.
- Corp (2010) Intel Corp. 2010. Nehalem Performance Monitoring Unit Programming Guide. https://software.intel.com/content/dam/develop/external/us/en/documents/30320-nehalem-pmu-programming-guide-core.pdf.
- De Melo (2010) Arnaldo Carvalho De Melo. 2010. The new linux perf tools. In Slides from Linux Kongress, Vol. 18.
- Della Toffola et al. (2015) Luca Della Toffola, Michael Pradel, and Thomas R Gross. 2015. Performance problems you can fix: A dynamic analysis of memoization opportunities. ACM SIGPLAN Notices 50, 10 (2015), 607–622.
- Drongowski (2007) Paul J. Drongowski. 2007. Instruction-Based Sampling: A New Performance Analysis Technique for AMD Family 10h Processors. https://developer.amd.com/wordpress/media/2012/10/AMD_IBS_paper_EN.pdf.
- Fisher (1936) Ronald A Fisher. 1936. The use of multiple measurements in taxonomic problems. Annals of eugenics 7, 2 (1936), 179–188.
- Foundation (2006) Python Software Foundation. 2006. cProfile. https://github.com/python/cpython/blob/master/Lib/cProfile.py.
- Foundation (2010) Python Software Foundation. 2010. Python Document: Thread State and the Global Interpreter Lock. https://docs.python.org/3/c-api/init.html#thread-state-and-the-global-interpreter-lock.
- Foundation (2014) Python Software Foundation. 2014. Python Implementations. https://wiki.python.org/moin/PythonImplementations.
- Frederickson (2018) Ben Frederickson. 2018. py-spy: Sampling profiler for Python programs. https://github.com/benfred/py-spy.
- Gad (2018) Ahmed Gad. 2018. NumPyCNN: Implementing Convolutional Neural Networks From Scratch. https://github.com/ahmedfgad/NumPyCNN.
- gak (2013) gak. 2013. pycallgraph: Python Call Graph. https://github.com/gak/pycallgraph/.
- Github (2018) Github. 2018. bannsec. https://github.com/bannsec/pySym.
- Group (2015) Harvard Intelligent Probabilistic Systems Group. 2015. Autograd: Efficiently computes derivatives of numpy code. https://github.com/HIPS/autograd.
- Gulabovska and Porkoláb (2019) Hristina Gulabovska and Zoltán Porkoláb. 2019. Survey on Static Analysis Tools of Python Programs.. In SQAMIA.
- Harris et al. (2020) Charles R Harris, K Jarrod Millman, Stéfan J van der Walt, Ralf Gommers, Pauli Virtanen, David Cournapeau, Eric Wieser, Julian Taylor, Sebastian Berg, Nathaniel J Smith, et al. 2020. Array programming with NumPy. Nature 585, 7825 (2020), 357–362.
- Hunter (2007) J. D. Hunter. 2007. Matplotlib: A 2D graphics environment. Computing in Science & Engineering 9, 3 (2007), 90–95. https://doi.org/10.1109/MCSE.2007.55
- Intel (2017) Intel. 2017. Intel® Distribution for Python. https://software.intel.com/content/www/us/en/develop/tools/oneapi/components/distribution-for-python.html.
- Irlbeck et al. (2015) M Irlbeck et al. 2015. Deconstructing dynamic symbolic execution. Dependable Software Systems Engineering 40 (2015), 26.
- Johnson (2017) Justin Johnson. 2017. PyTorch-example: the fundamental concepts of PyTorch through self-contained examples. https://github.com/jcjohnson/pytorch-examples.
- Johnson (1982) Mark Scott Johnson. 1982. Some requirements for architectural support of software debugging. ACM SIGARCH Computer Architecture News 10, 2 (1982), 140–148.
- Jyphon (1999) Jyphon. 1999. JPython homepage. https://www.jython.org/.
- Kapotos (2018) Fotis Kapotos. 2018. Fourier-Transform. https://github.com/fotisk07/Fourier-Transform.
- Kulpati (2018) Sarvasv Kulpati. 2018. An implementation of Linear Regression from scratch in Python. https://github.com/sarvasvkulpati/LinearRegression.
- Liu et al. (2017) Zhuang Liu, Jianguo Li, Zhiqiang Shen, Gao Huang, Shoumeng Yan, and Changshui Zhang. 2017. Learning Efficient Convolutional Networks Through Network Slimming. In The IEEE International Conference on Computer Vision (ICCV).
- Mahdizadehaghdam et al. (2019) Shahin Mahdizadehaghdam, Ashkan Panahi, Hamid Krim, and Liyi Dai. 2019. Deep dictionary learning: A parametric network approach. IEEE Transactions on Image Processing 28, 10 (2019), 4790–4802.
- McLear et al. (1982) Robert E McLear, DM Scheibelhut, and E Tammaru. 1982. Guidelines for creating a debuggable processor. ACM SIGARCH Computer Architecture News 10, 2 (1982), 100–106.
- Nguyen and Xu (2013) Khanh Nguyen and Guoqing Xu. 2013. Cachetor: Detecting cacheable data to remove bloat. In Proceedings of the 2013 9th Joint Meeting on Foundations of Software Engineering. 268–278.
- Nguyen (2019) Thieu Nguyen. 2019. Implement the-state-of-the-art meta-heuristic algorithms using python (numpy). https://github.com/thieunguyen5991/metaheuristics.
- Nguyen et al. (2019) Thieu Nguyen, Binh Minh Nguyen, and Giang Nguyen. 2019. Building resource auto-scaler with functional-link neural network and adaptive bacterial foraging optimization. In International Conference on Theory and Applications of Models of Computation. Springer, 501–517.
- Nguyen et al. (2018) Thieu Nguyen, Nhuan Tran, Binh Minh Nguyen, and Giang Nguyen. 2018. A resource usage prediction system using functional-link and genetic algorithm neural network for multivariate cloud metrics. In 2018 IEEE 11th conference on service-oriented computing and applications (SOCA). IEEE, 49–56.
- Nistor et al. (2013) Adrian Nistor, Linhai Song, Darko Marinov, and Shan Lu. 2013. Toddler: Detecting performance problems via similar memory-access patterns. In 2013 35th International Conference on Software Engineering (ICSE). IEEE, 562–571.
- Numpy (2009) Numpy. 2009. Source code of array_subscript function. https://github.com/numpy/numpy/blob/5de64de6dbdf89b1bd8828c59393c4239364755a/numpy/core/src/multiarray/mapping.c#L1508.
- Padial (2018) Darío López Padial. 2018. Technical Analysis Library in Python. https://github.com/bukosabino/ta.
- Paszke et al. (2017) Adam Paszke, Sam Gross, Soumith Chintala, Gregory Chanan, Edward Yang, Zachary DeVito, Zeming Lin, Alban Desmaison, Luca Antiga, and Adam Lerer. 2017. Automatic differentiation in PyTorch. (2017).
- Pedregosa et al. (2011) F. Pedregosa, G. Varoquaux, A. Gramfort, V. Michel, B. Thirion, O. Grisel, M. Blondel, P. Prettenhofer, R. Weiss, V. Dubourg, J. Vanderplas, A. Passos, D. Cournapeau, M. Brucher, M. Perrot, and E. Duchesnay. 2011. Scikit-learn: Machine Learning in Python. Journal of Machine Learning Research 12 (2011), 2825–2830.
- Pelletier (2013) Vincent Pelletier. 2013. Pprofile: Line-granularity, thread-aware deterministic and statistic pure-python profiler. https://github.com/vpelletier/pprofile.
- Pugh (1990) William Pugh. 1990. Skip lists: a probabilistic alternative to balanced trees. Commun. ACM 33, 6 (1990), 668–676.
- pydata (2009) pydata. 2009. NumExpr: Fast numerical expression evaluator for NumPy. https://github.com/pydata/numexpr.
- pythonprofilers (2012) pythonprofilers. 2012. Memory Profiler. https://github.com/pythonprofilers/memory_profiler/.
- PyTorch (2017) PyTorch. 2017. Datasets, Transforms and Models specific to Computer Vision. https://github.com/pytorch/vision.
- Reinders (2005) James Reinders. 2005. VTune performance analyzer essentials. Intel Press (2005).
- Rickerby (2014) Joe Rickerby. 2014. pyinstrument. https://github.com/joerick/pyinstrument.
- Savannah/kernel.org (2005) Savannah/kernel.org. 2005. The libunwind project homepage. https://www.nongnu.org/libunwind/.
- Song and Lu (2017) Linhai Song and Shan Lu. 2017. Performance diagnosis for inefficient loops. In 2017 IEEE/ACM 39th International Conference on Software Engineering (ICSE). IEEE, 370–380.
- Srinivas et al. (2011) M Srinivas, B Sinharoy, RJ Eickemeyer, R Raghavan, S Kunkel, T Chen, W Maron, D Flemming, A Blanchard, P Seshadri, et al. 2011. IBM POWER7 performance modeling, verification, and evaluation. IBM Journal of Research and Development 55, 3 (2011), 4–1.
- Stasi (2018) Stasi. 2018. NumpyWDL: Implement Wide & Deep algorithm by using NumPy. https://github.com/stasi009/NumpyWDL.
- Stott (2017) Lee Stott. 2017. IrisData: Iris Data Example Python Numpy. https://github.com/leestott/IrisData.
- Su et al. (2019a) Pengfei Su, Qingsen Wang, Milind Chabbi, and Xu Liu. 2019a. Pinpointing performance inefficiencies in Java. In Proceedings of the 2019 27th ACM Joint Meeting on European Software Engineering Conference and Symposium on the Foundations of Software Engineering. 818–829.
- Su et al. (2019b) Pengfei Su, Shasha Wen, Hailong Yang, Milind Chabbi, and Xu Liu. 2019b. Redundant Loads: A Software Inefficiency Indicator. In Proceedings of the 41st International Conference on Software Engineering (Montreal, Quebec, Canada) (ICSE ’19). IEEE Press, 982–993. https://doi.org/10.1109/ICSE.2019.00103
- Team (2011) The PyPy Team. 2011. Pypy homepage. https://www.pypy.org/index.html.
- Team et al. (2017) XLA Team et al. 2017. XLA-TensorFlow compiled.
- timothycrosley (2014) timothycrosley. 2014. Frosted documentation. https://pypi.org/project/frosted/.
- Tornetta (2018) Gabriele N. Tornetta. 2018. Austin: A Frame Stack Sampler for CPython. https://github.com/P403n1x87/austin.
- Uber (2016) Uber. 2016. Pyflame: A Ptracing Profiler For Python. https://github.com/uber-archive/pyflame.
- Van Der Walt et al. (2011) Stefan Van Der Walt, S Chris Colbert, and Gael Varoquaux. 2011. The NumPy array: a structure for efficient numerical computation. Computing in Science & Engineering 13, 2 (2011), 22.
- Vitter (1985) Jeffrey S Vitter. 1985. Random sampling with a reservoir. ACM Transactions on Mathematical Software (TOMS) 11, 1 (1985), 37–57.
- Wang (2017) Chao-Ming Wang. 2017. NumpyDL: Numpy Deep Learning Library. https://github.com/oujago/NumpyDL.
- Wen et al. (2017) Shasha Wen, Milind Chabbi, and Xu Liu. 2017. Redspy: Exploring value locality in software. In Proceedings of the Twenty-Second International Conference on Architectural Support for Programming Languages and Operating Systems. 47–61.
- Wen et al. (2018) Shasha Wen, Xu Liu, John Byrne, and Milind Chabbi. 2018. Watching for software inefficiencies with witch. In Proceedings of the Twenty-Third International Conference on Architectural Support for Programming Languages and Operating Systems. 332–347.
- Zhou (2019a) Victor Zhou. 2019a. A Convolution Neural Network (CNN) From Scratch. https://github.com/vzhou842/cnn-from-scratch.
- Zhou et al. (2020) Weijie Zhou, Yue Zhao, Guoqiang Zhang, and Xipeng Shen. 2020. HARP: Holistic Analysis for Refactoring Python-Based Analytics Programs. In 42nd International Conference on Software Engineering.
- Zhou (2019b) YiFei Zhou. 2019b. Guppy 3: A Python programming environment and heap analysis toolset. https://github.com/zhuyifei1999/guppy3/.