22email: bmm@cab.inta.csic.es 33institutetext: Space Telescope Science Institute, 3700 San Martin Drive, Baltimore, MD 21218, USA 44institutetext: Max-Planck-Institut für Astronomie (MPIA), Königstuhl 17, D-69117 Heidelberg, Germany 55institutetext: INAF, Osservatorio Astronomico di Palermo, Piazza del Parlamento 1, 90134 Palermo, Italy 66institutetext: Departamento de Física Teórica, Universidad Autónoma de Madrid, 28049 Madrid, Spain 77institutetext: Aurora Technology B.V. for ESA, ESA-ESAC, 28692 Villanueva de la Cañada, Madrid, Spain 88institutetext: Observatorio Astronómico Nacional (OAN,IGN), Calle Alfonso XII 3, 28014 Madrid, Spain
The A-shell star Leo revisited: its photospheric and circumstellar spectra††thanks: Table C.1, and the spectra used in this paper are only available in electronic form at the CDS via anonymous ftp to cdsarc.u-strasbg.fr (130.79.128.5) or via http://cdsweb.u-strasbg.fr/cgi-bin/qcat?J/A+A/
Abstract
Context. Variable red- and blue-shifted absorption features observed in the Ca ii K line towards the A-type shell star Leo have been suggested by us in a previous work to be likely due to solid, comet-like bodies in the circumstellar (CS) environment.
Aims. Our aim is to expand our observational study of this object to other characteristic spectral lines of A-type photospheres as well as to lines arising in their CS shells.
Methods. We have obtained more than 500 high-resolution optical spectra collected at different telescopes during 37 nights in several observing runs from December 2015 to January 2019. Time series consecutive spectra were taken, covering intervals of up to 9 hours in some nights. We have analysed some photospheric lines, in particular Ca i 4226 Å and Mg ii 4481 Å, as well as the circumstellar shell lines Ca ii H&K, Ca ii IR triplet, Fe ii 4924, 5018 and 5169 Å, Ti ii 3685, 3759 and 3761 Å, and the Balmer lines H and H.
Results. Our observational study reveals that Leo is a variable Scuti star whose spectra show remarkable dumps and bumps superimposed on the photospheric line profiles, which vary their strength and sharpness, propagate from blue- to more red-shifted radial velocities and persisting during a few hours. Similarly to other Scuti stars, these features are likely produced by non-radial pulsations. At the same time, all shell lines present an emission at 3 km/s centered at the core of the CS features, and two variable absorption minima at both sides of the emission; those absorption minima occur at practically the same velocity for each line, i.e., no apparent dynamical evolution is observed. The variations observed in the Ca ii H&K, Fe ii and Ti ii lines occur at any time scale from minutes to days and observing run, but without any clear correlation or recognizable temporal pattern among the different lines. In the case of H the CS contribution is also variable in just one of the observing runs.
Conclusions. Summarizing, we suggest that Leo is a rapidly rotating Scuti star surrounded by a variable, (nearly) edge-on CS disk possibly re-supplied by the Scuti pulsations. The behaviour of the CS shell lines is reminiscent of the one observed in rapidly rotating Be shell stars with an edge-on CS disk, and clearly points out that the variations observed in the CS features of Leo are highly unlikely to be produced by exocomets. In addition, the observational results presented in this work, together with some recent results concerning the shell star HR 10, suggest the need of a critical revision of the Ca ii K features which have been attributed to exocomets in other shell stars.
Key Words.:
stars: individual: Leo – Stars: early-type – stars: variables: Scuti – stars: Be – circumstellar matter – comets: general1 Introduction
Transient red- and blue-shifted, absorption features mainly detected in the Ca ii K line towards 30 A-type stars have been interpreted as the signatures of the evaporation of large solid, comet-like bodies transiting or grazing onto de central stars (e.g. Ferlet et al., 1987; Kiefer et al., 2014b; Welsh & Montgomery, 2018). The interpretation about the presence of such bodies is reinforced by the detection in the surroundings of a few of those stars of sporadic events and stable absorptions in some UV metallic lines, as well as emission lines at far-IR and (sub)-mm wavelengths indicating the presence of secondary cold gas in some debris disk stars. Additionally, photometric observations have revealed the presence of exocomets around later type stars (Boyajian et al., 2016; Kiefer et al., 2017; Rappaport et al., 2018); further, photometric and spectroscopic evidences of such bodies are found around white dwarf stars (see e.g. Manser et al., 2019; Strøm et al., 2020, and references therein).
Several of the exocomet host A-type stars are known to be shell stars. Those objects -whose CS envelope is most likely a CS disk due to their high rotational velocities () - have variable, narrow absorption features in many lines of e.g. Ti ii, Fe ii, and also the Ca ii H&K and infrared (IR) triplet lines, with the shell lines even appearing or disappearing in some stars (e.g. Jaschek et al., 1988; Abt et al., 1997). However, the similar variability behaviour of the Ca ii K line between the shell stars and the bona-fide cometary-like events detected towards other A-type stars like Pic or HD 172555 (see e.g. Kiefer et al., 2014a, b) can lead to some misidentification of the shell variability (or star binarity) with events from exocomets. A paradigmatic case of this confusion is provided by the shell star HR 10 where the variability of the narrow absorption components superimposed on the photospheric Ca ii K line, as well as on Ti ii absorption lines at 3759/61 Å were interpreted as comet-like events caused by infalling, comet-like material onto the star (Lagrange-Henri et al., 1990; Welsh et al., 1998; Redfield, 2007; Abt, 2008). However, Montesinos et al. (2019), based on the analysis of a large set of optical spectra spanning several decades, together with interferometric PIONIER/VLTI data, showed that the spectroscopic variations observed in HR 10 are actually caused by its binary nature with CS envelopes around both stellar components.
In this work we revisit the shell star Leo. In a previous paper (Eiroa et al., 2016) we analysed the Ca ii H&K non-photospheric CS absorptions and attributed the observed, striking variability to comet-like events as the most plausible explanation –although we note that a question mark was included in the title of that paper. However, the analysis of other lines and numerous time series spectra taken in 2017 and 2019, presented here, brings new perspectives about the star’s variability, and we deem now our previous analysis as inappropriate.
This paper is organized as follows: Sect. 2 summarises the properties of the star, Sect. 3 describes the observations, instruments and observing periods, Sect. 4 describes the results concerning some photospheric and non-photospheric CS lines, with specific examples of spectra obtained in some periods, in Sect. 5 we present a discussion of these results, and Sect. 6 is a brief summary of our conclusions.
2 Leo: properties
Leo (HD 98058, HR 4368) is an A5V-A7 IVn shell star (e.g. Jaschek et al., 1991) located at a distance of 56.5 pc. The best stellar parameters found by Eiroa et al. (2016) fitting Kurucz photospheric models to high resolution spectra are = 7500 K, = 3.75, = 230 km/s, in reasonable agreement with other estimates (e.g. Lagrange-Henri et al., 1990; Royer et al., 2007; Zorec & Royer, 2012; Adamczak & Lambert, 2014; David & Hillenbrand, 2015; Soubiran et al., 2016). Its bolometric luminosity is 45–50 L⊙ (Zorec & Royer, 2012; Adamczak & Lambert, 2014; Balona & Ozuyar, 2020); the estimated mass is 2.3 M⊙ (Zorec & Royer, 2012; Adamczak & Lambert, 2014; De Rosa et al., 2014), while age estimates are in the range 500-900 Myr (De Rosa et al., 2014; David & Hillenbrand, 2015), and the stellar radius has been estimated to be 3.2 with a significant oblateness (van Belle, 2012; Arcos et al., 2018). Leo is located in the Scuti instability strip of the HR diagram, and has been classified by Balona & Ozuyar (2020) as a Scuti variable with several peaks in its TESS periodogram, the strongest one with an amplitude of 5.25 ppt and frequency of 6.4739 d-1.
Shell Ca ii H&K and Ti ii 3759, 3761 Å absorption lines have been detected in the spectrum of Leo (e.g. Abt & Moyd, 1973; Jaschek et al., 1988). The shell lines likely arise in a gaseous, close to edge-on CS disk given the high rotational velocity of the star (Abt, 2008); thus, the triangular shape of the Ca ii K profile is probably due to the combination of the photospheric and disk absorptions (Lagrange-Henri et al., 1990). Long term variations of the Ti ii CS lines were reported by Abt (2008), while we found remarkable short term variations of the Ca ii H&K lines (Eiroa et al., 2016). Finally, we note that the star does not possess a detectable warm or cold dusty debris disk (Rieke et al., 2005; Cataldi et al., 2019).
| Observing Run | Instrument | Range(nm) | Resolution | Dates† | Spectra per night |
|---|---|---|---|---|---|
| 2015 December | HERMES | 370-900 | 85000 | 20, 22, 23 | 1, 4, 1 |
| 2016 January | FIES | 370-830 | 67000 | 26 | 2 |
| 2016 January | HERMES | 27, 28, 30 | 1, 3, 3 | ||
| 2016 March | HERMES | 3, 4, 5, 6 | 4, 4 ,2 ,3 | ||
| 2016 March | FEROS | 350-930 | 48000 | 25, 26, 27, 28 | 4, 4, 3, 3 |
| 2016 May | HERMES | 11 | 20 | ||
| 2016 May | CARMENES | 520-960/960-1710 | 94600/80400 | 19 | 1 |
| 2017 March | HERMES | 6, 7, 8, 9, | 14, 20, 22, 26, | ||
| 10, 11, 12, 13 | 26, 13, 24, 24 | ||||
| 2017 March/April | HERMES | 28, 29, 30, 31, | 24, 24, 26, 33, | ||
| 1, 2, 3 | 21, 22, 23 | ||||
| 2017 March/April | FEROS | 31, 1, 2, 3, | 8, 28, 26, 11, | ||
| 4, 5, 6, 7, 8 | 16, 16, 13, 16, 15 | ||||
| 2019 January | HARPS-N | 392-683 | 115000 | 29 | 13 |
| Dates refer to the beginning of the night, this convention is used throughout the paper. | |||||
3 Observations
A total of 555 high-resolution spectra of Leo were collected during 10 observing campaigns from December 2015 to April 2017: 389 spectra were obtained with HERMES (Raskin et al., 2011) attached to the Mercator Telescope (La Palma, Spain); 163 spectra with FEROS (Kaufer et al., 1999) at the MPG/ESO 2.2-m telescope (La Silla, Chile); two spectra were obtained with the FIES spectrograph (Telting et al., 2014) at NOT (La Palma, Spain), and one more with CARMENES (Quirrenbach et al., 2016), the high-resolution optical/near-IR spectrograph attached at the 3.5-m telescope at Calar Alto observatory (Almería, Spain). Additionally, 13 spectra were taken in January 2019 with HARPS-N (Cosentino et al., 2012) at TNG (La Palma).
Observing dates, instruments - with their corresponding spectral range and resolution - and number of spectra per night are given in Table 1; a detailed log with the specific dates and time (UT) is given in Table C.1 of Appendix C111For the sake of compactness, the dates and times in the table are codified as yyyymmddThhmm where yyyy, mm and dd are year, month and day, respectively, and hh mm are the UT hour and minute of the beginning of the observation. The table is ordered from left to right and top to bottom.. During the 2017 observing runs Leo was extensively observed when its airmass was ; in particular, from March 31 to April 3 the star was continuously followed from La Palma and La Silla along 9.5 hours.
The spectra were reduced using the available pipelines of the corresponding instruments; they include the usual steps for échelle spectra, as bias subtraction, flat-field correction, cosmic ray removal, and order extraction. Wavelength calibration is carried out by means of Th-Ar lamp spectra taken at the beginning and end of each night. Barycentric corrections have been applied to the HERMES, FIES, and CARMENES spectra since the pipelines do not include such correction. Finally, telluric lines have been removed by means of MOLECFIT, a tool that generates a model atmosphere accounting for the most common absorbing molecules (Smette et al., 2015). Typical S/N ratios of the spectra achieved at a continuum around 4000 Å , i.e., close to the Ca ii H&K lines, are in the range 70–150, mostly depending on weather conditions. S/N ratios of the median spectra of each night are in the range 200-500, again depending on weather conditions and the number of spectra per night, and the one of the median spectrum of all spectra is 1000.
4 Results: The spectrum of Leo
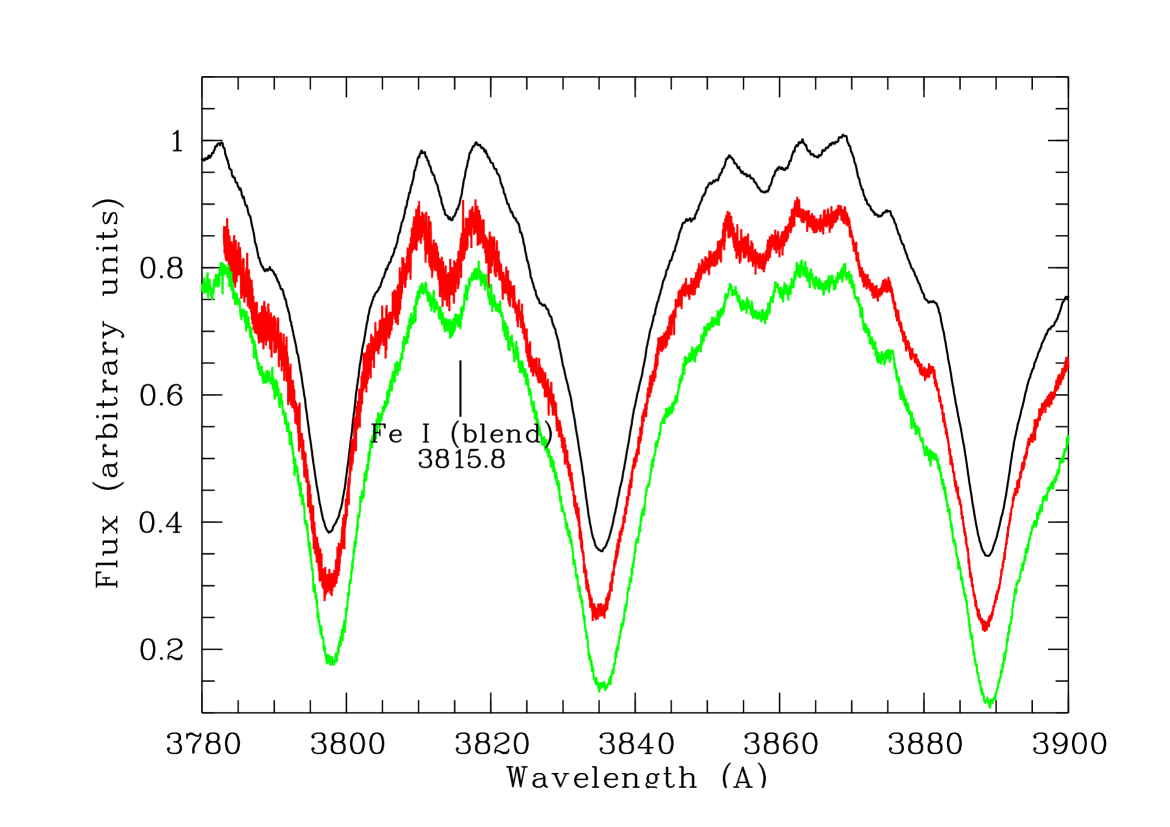
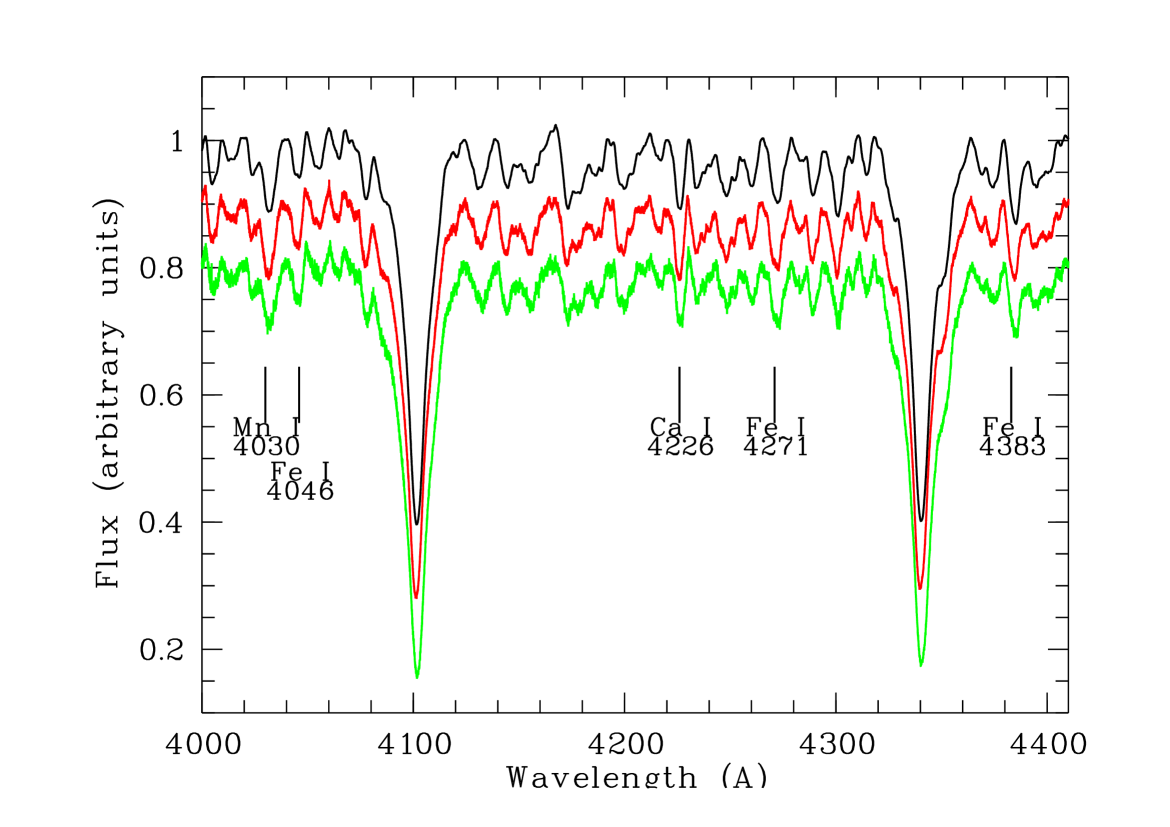
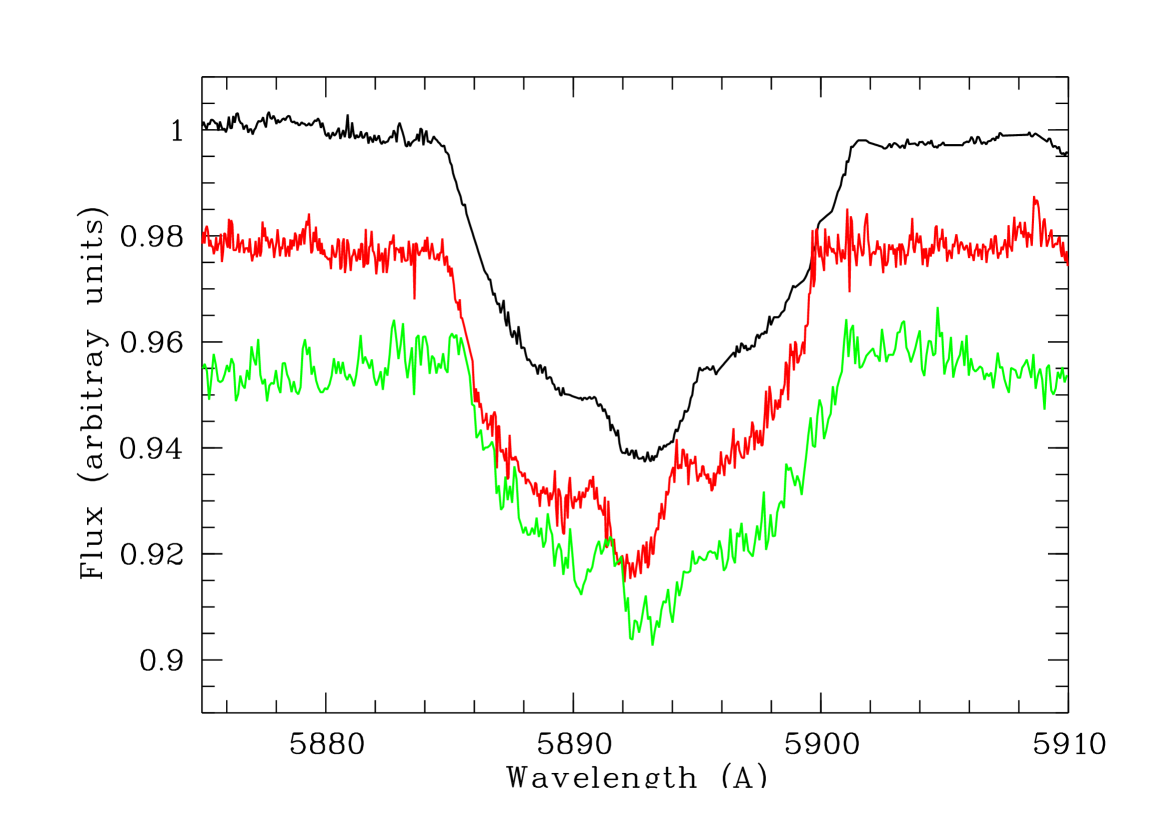
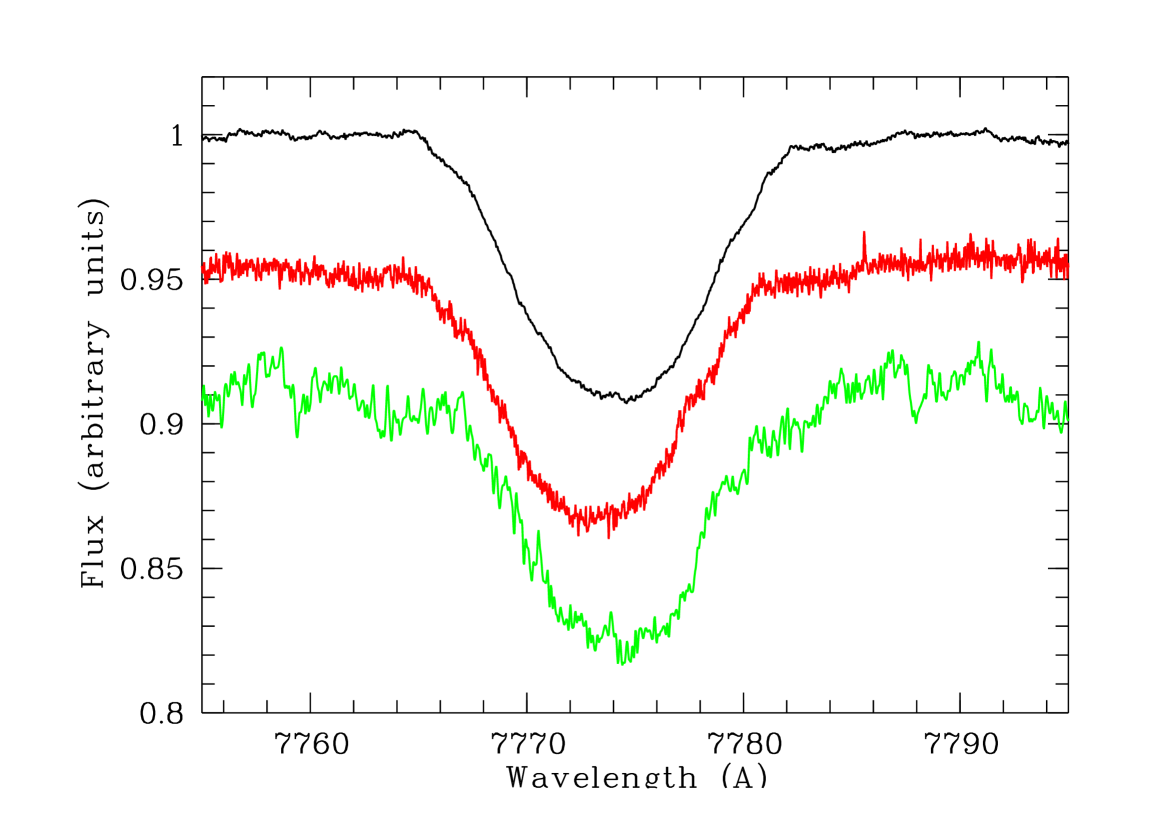
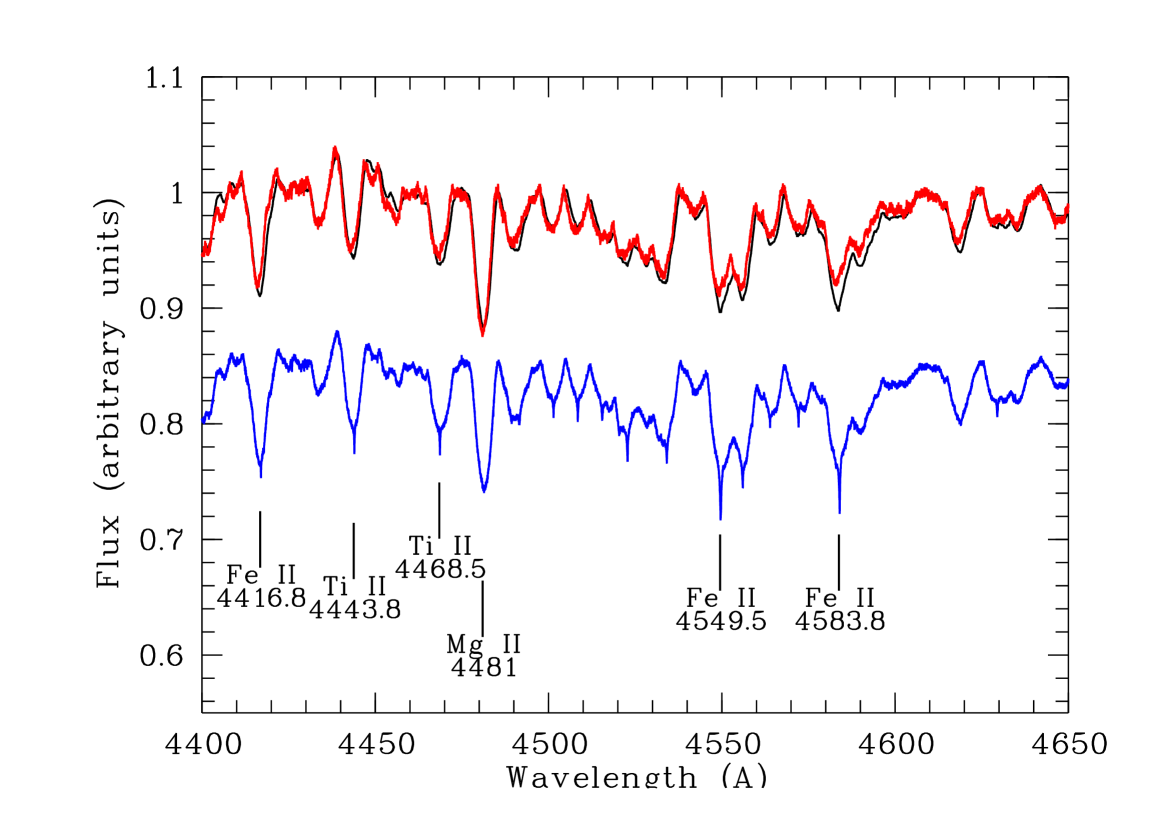
The spectrum of Leo consists of a broadened A-type photospheric spectrum together with some CS contribution. Fig. 1 shows the median spectrum of Leo in some wavelength ranges with characteristic photospheric Balmer and neutral metallic lines (Fe i, Mn i, Ca i, Na i, O i) of late-type A stars (e.g. Gray & Corbally, 2009). This median spectrum has been estimated by using all FEROS and HERMES spectra -the latter have been rebinned to the FEROS spectral resolution (0.03 Å/pixel). The spectra of Aql and Phe, two stars with values of Teff and comparable to those of Leo (Rebollido et al., 2020), are also shown with the aim of comparison. The strength and width of the photospheric lines are similar in all three stars .
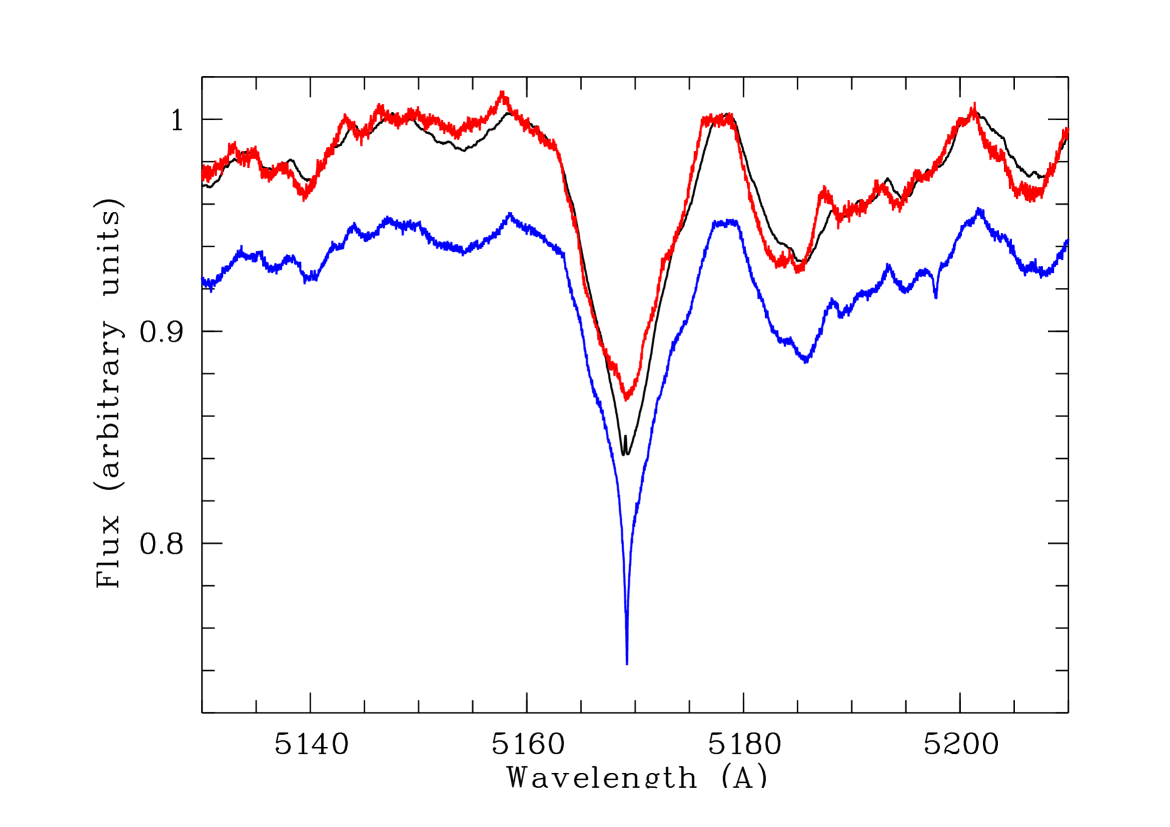
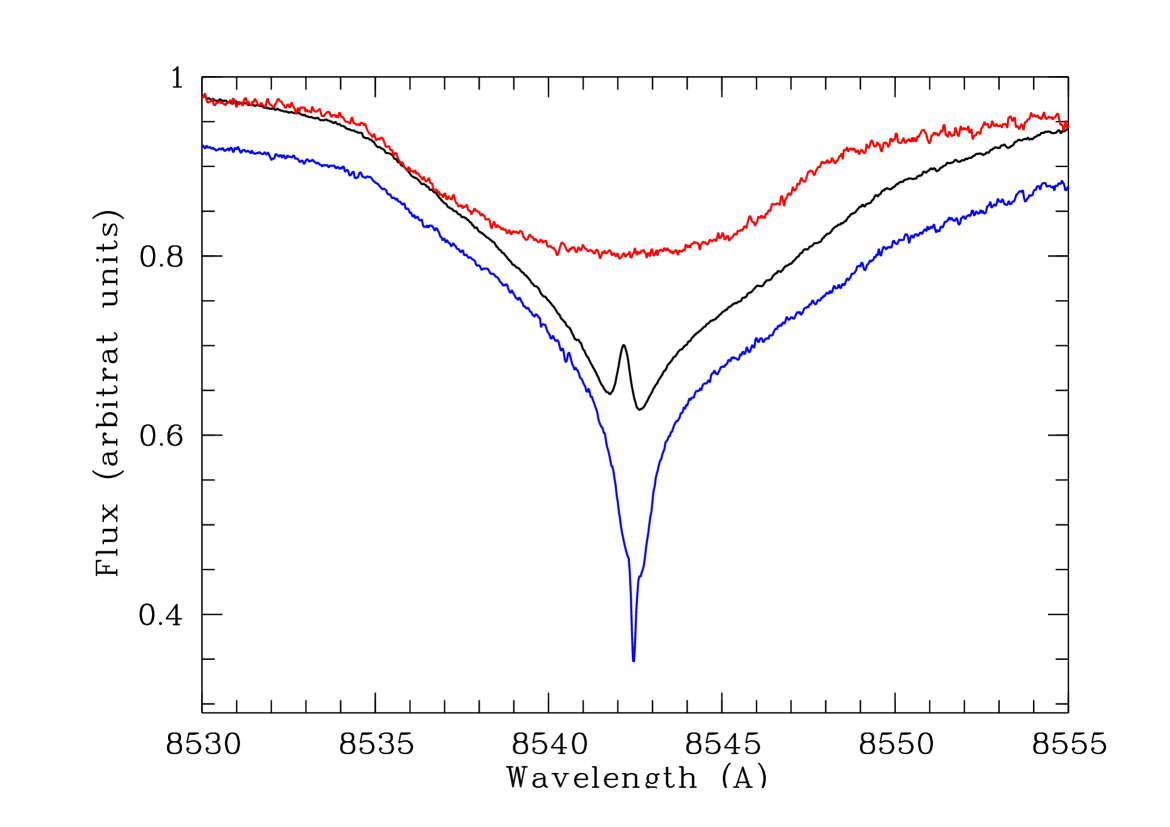
In addition, Leo exhibits a number of absorption lines with a clear non-photospheric contribution. Fig. 2 shows examples of such lines; in particular the Ca ii H&K lines, some Fe ii and Ti ii lines around the 4481 Å Mg ii photospheric one, the Fe ii 5169 Å, and the 8542 Å line of the Ca ii IR triplet. In this figure the spectrum of Aql is plotted directly superimposed on the Leo spectrum. Fig. 2 additionally displays the spectrum of the shell star HR 7731 which has also similar photospheric parameters (Rebollido et al., 2020) . We note that the strength of some shell lines in Leo might be a bit stronger than in Aql, e.g. the Fe ii 4549.5, 4583.8 Å lines, but not comparable with the very strong shell absorptions observed in HR 7731.
Leo exhibits conspicuous photospheric and circumstellar variability as evidenced by the behaviour of distinctive lines of A-type shell stars. The photospheric line variability becomes discernible as dumps and bumps in the line profiles with similar but not identical characteristics in different lines; a careful inspection of several regions close to the photospheric lines, shows that such bumps and dumps are not seen in the continuum. The temporal presence of such features is irregular and, when they appear, they usually move from blue to red in short time scales, lasting seemingly for up to a few hours. On the other hand, the CS lines show a common emission at their core, and absorption changes within very short time scales at both the blue and red sides of the core, yet without any apparent correlation among the different lines. In the next two subsections we give further details of the photospheric and CS line variability separatedly.
4.1 Photospheric lines
| UT (hh:mm) | Ca i | Mg ii |
|---|---|---|
| 02:18 | 534 | 528 |
| 03:40 | 511 | 501 |
| 05:22 | 550 | 554 |
| median | 530 | 528 |
| Estimated uncertainty % | ||
As already mentioned, the median spectrum of Leo shows photospheric lines typical of a late A-type spectrum (Fig. 1), but individual spectra distinctly exhibit that at least some of those lines (e.g. Ca i 4226.7 Å, Ti ii 4468.5 and 4501.3 Å, Mg ii 4481 Å, Fe ii 4508.3 Å) vary, with the aforementioned dumps and bumps appearing superimposed on the line profiles. Fig. 3 displays the absorption profiles of the Ca i 4226 Å and Mg ii 4481 Å lines, as observed in the three spectra taken with FEROS during the night 2016-03-28/29. Very clear extra absorptions close to the core are observed in comparison to the median spectrum of the whole March 2016 period; the amplitude of variations in the equivalent widths of both lines being small, in the range of 2-3 times the estimated uncertainties (Table 2).
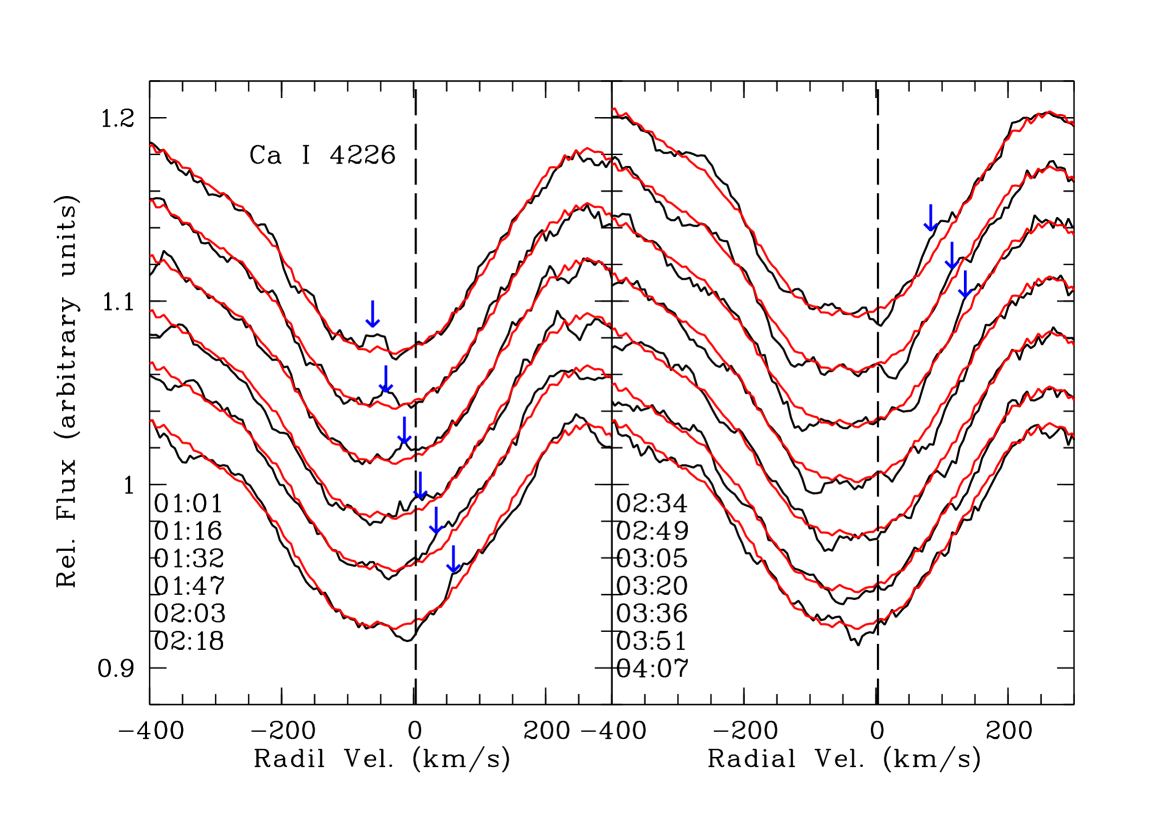
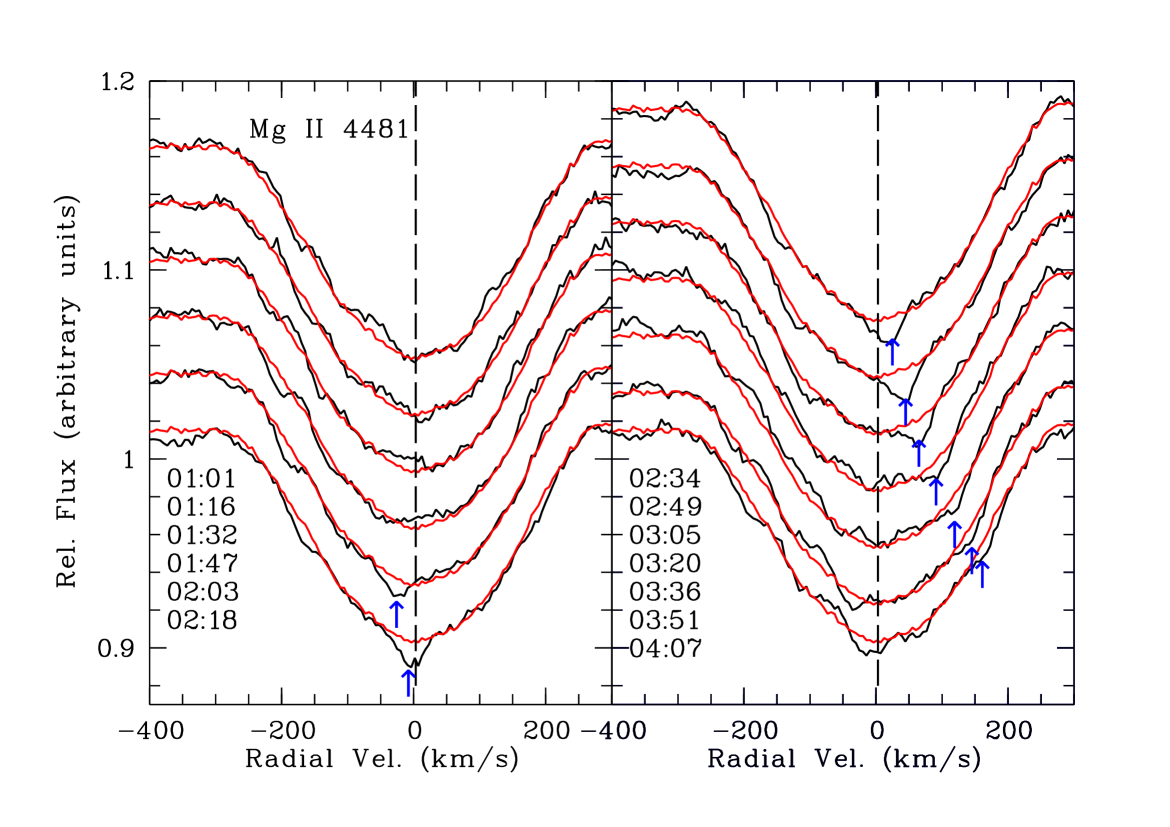
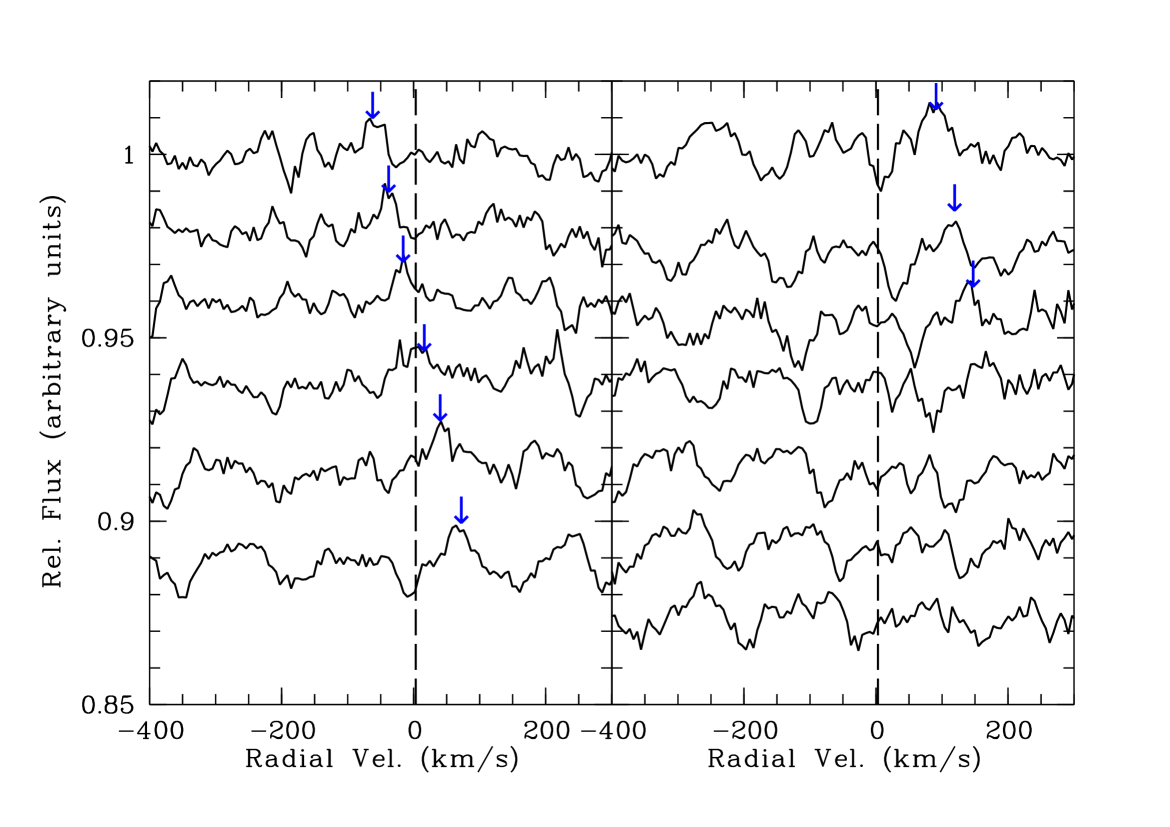
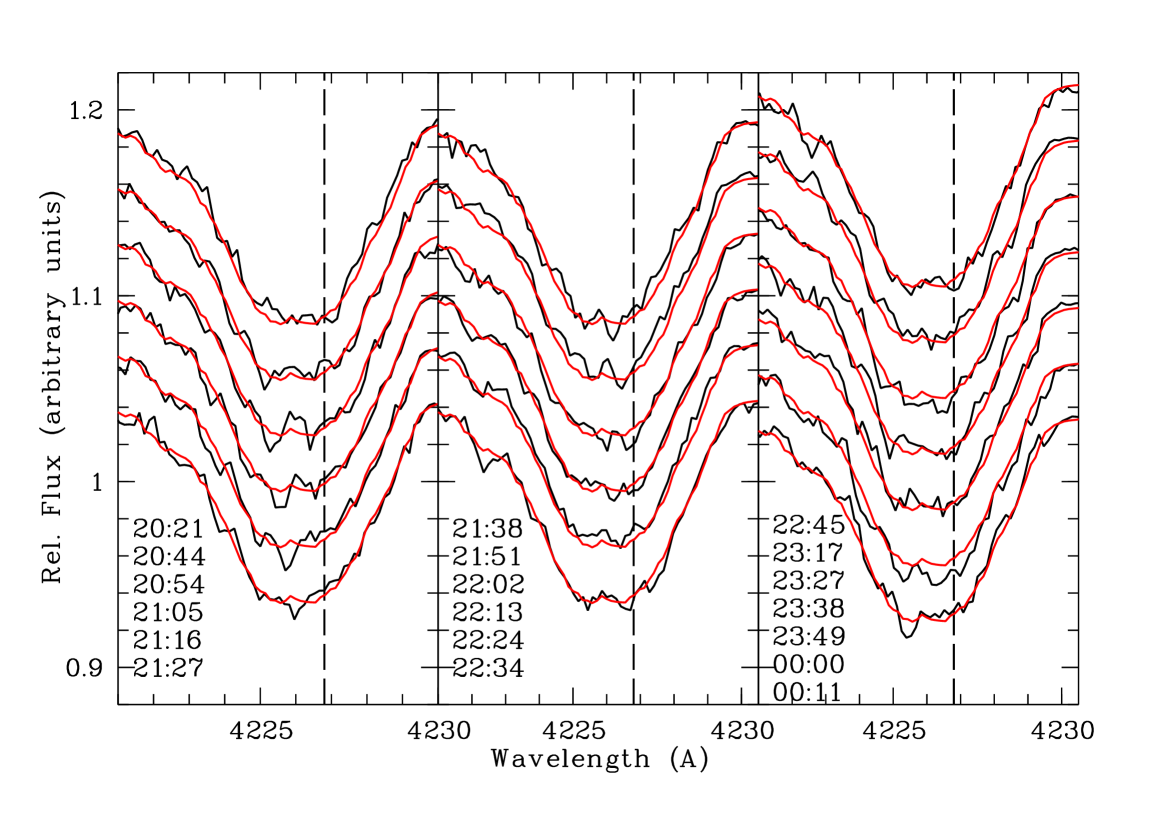
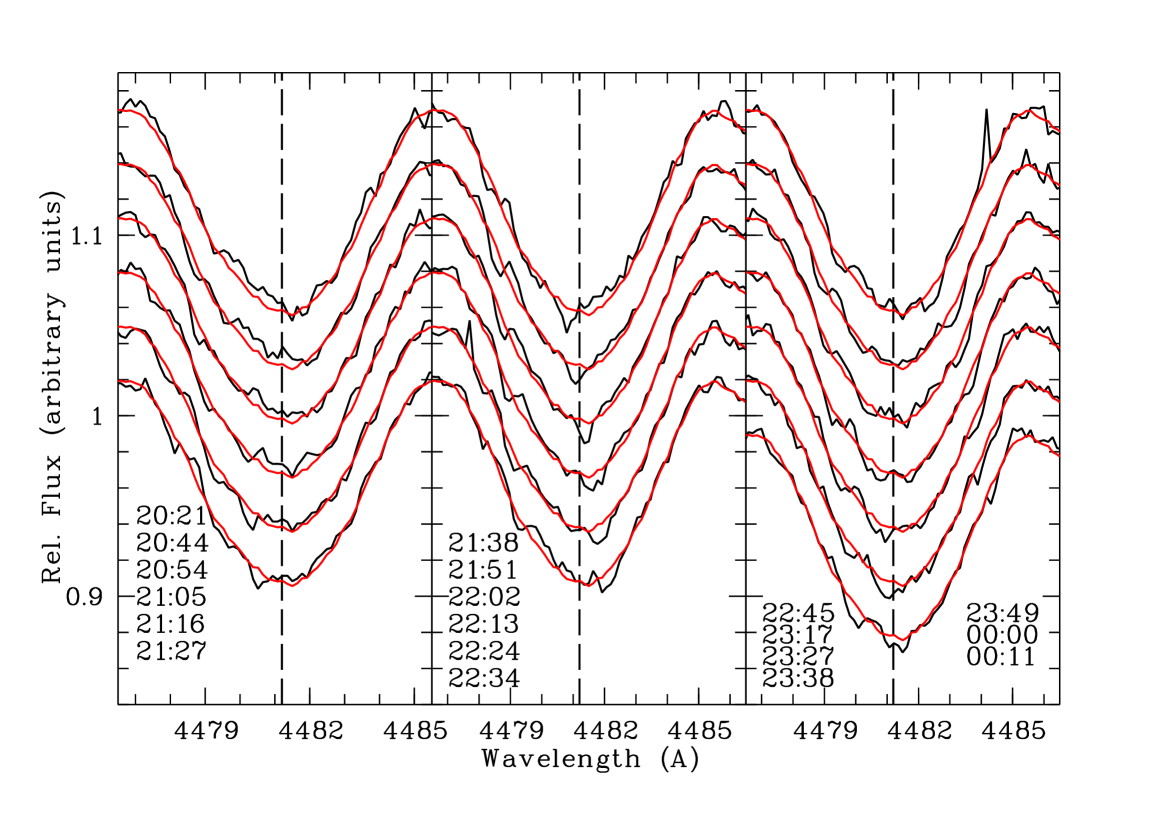
Time series spectra taken during the May 2016, 2017, and 2019 observing runs allow us to better characterise the changes in the absorption lines, and to trace their temporal evolution with a time resolution between 4 and 15 minutes during a time interval from 3 up to 9 hours (during some nights of March-April 2017 HERMES and FEROS spectra were consecutively collected for a time interval of 9.5 hours, even some spectra were taken simultaneously from both telescopes). Fig. 4 shows the profile of the Ca i 4226 Å and Mg ii 4481 Å lines corresponding to the 13 consecutive spectra obtained with HARPS-N in January 2019 during 3 hours of observations -integration time of each spectrum was 15 minutes. Several dumps and bumps propagating across the profile at different radial velocities can be distinguished; in both lines the features vary their radial velocity at a rate of 100 km/s per hour (to guide the eye some of them are marked with arrows in the figure). Fig. 4 shows the median of the HARPS-N spectra superimposed on each observed individual spectrum as well as the residuals once the median spectrum has been removed. The features (dumps/bumps) propagate towards redder velocities first increasing their strength, achieving a maximum at a velocity of 3 km/s, i.e., close to the apparent emission detected in CS features (see details in Subsection 4.2 and Fig. 5), and then decreasing their strength, seemingly lasting from 1 hour to 3 hours; their persistence from profile to profile suggesting that they are real and not artifacts or noise. Similar features, varying their strength and sharpness, and moving from blue-shifted to more red-shifted velocities superimposed on the median line profiles are seen in other nights. We note that the time span, velocity interval and maximum strength are irregular, and that the behaviour of the Ca i and Mg ii lines is not quite coincident, or in other words, the variations do not seem to be in phase. The fact that they do not correlate might occur if the lines originate at different layers in the stellar photosphere. We also note that dumps/bumps are not always clearly present in many spectra. Appendix A presents some further spectra of the Ca i 4266 Å and Mg ii 4481 Å photospheric lines.
4.2 Circumstellar absorptions
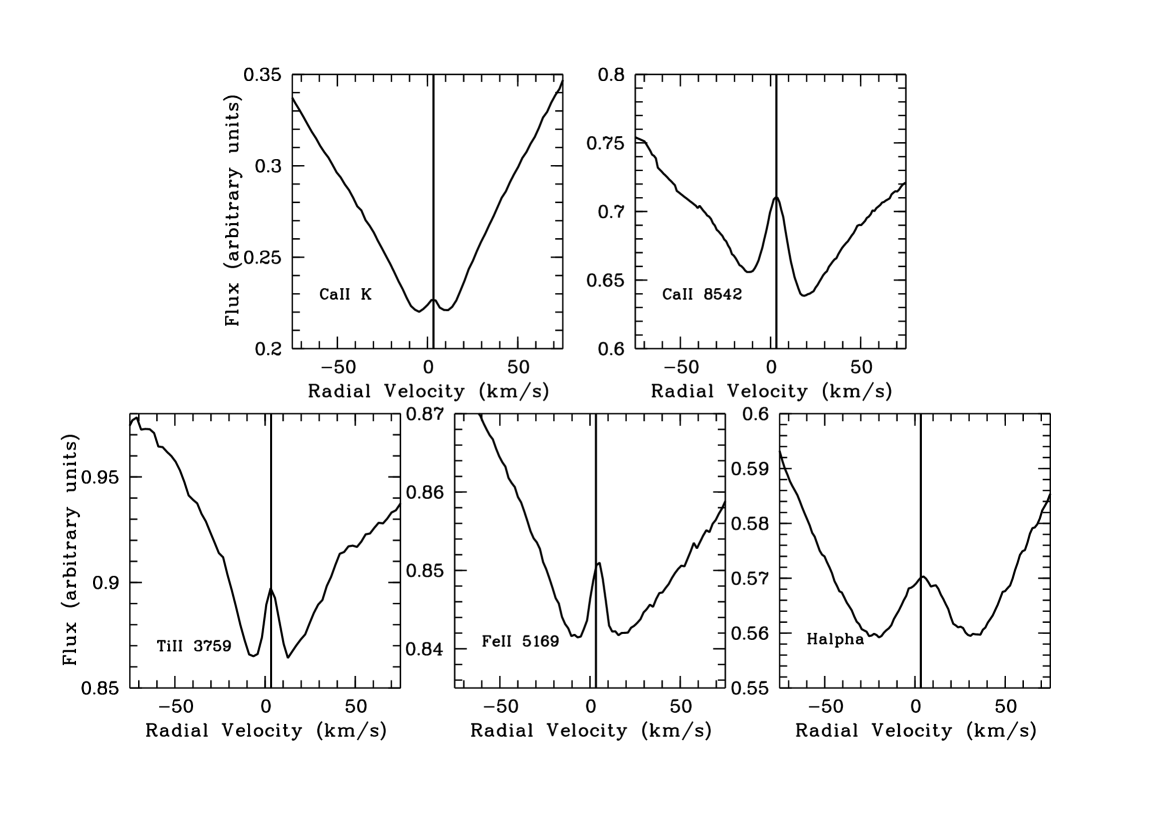
Prominent non-photospheric shell-like features are seen in the Ca ii H&K lines, the Ca ii triplet at 8498, 8542 and 8662 Å, the Ti ii lines at 3685, 3759 and 3761 Å, the Fe ii triplet at 4923.9, 5018.4 and 5169 Å, and the Balmer lines H and H. Other shell lines as those observed in other shell stars, see e.g. the spectrum of HR 7731 shown in Fig. 2, are either hardly distinguishable or undetected. Fig. 5 shows the median HERMES and FEROS spectrum in velocity space of some of those lines - in the case of the triplet lines the most representative one is shown. These lines show common and distinct behaviours as explained in the following:
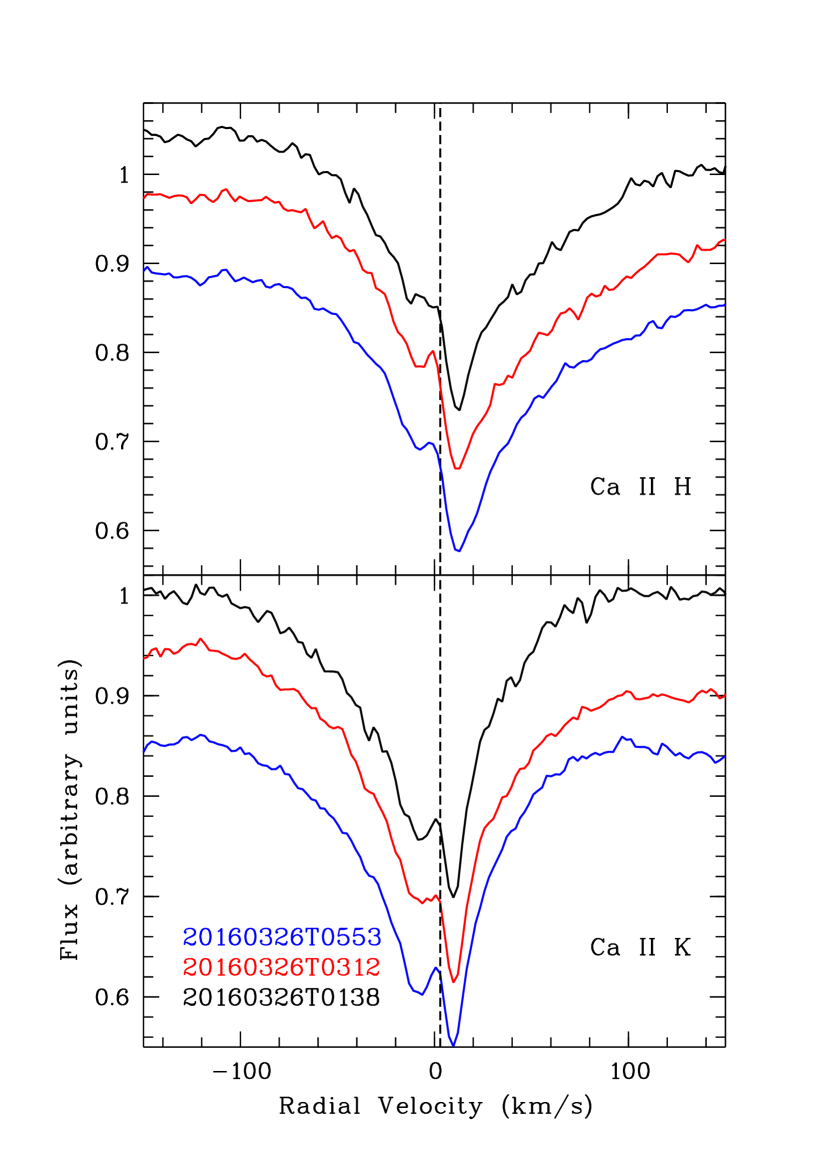
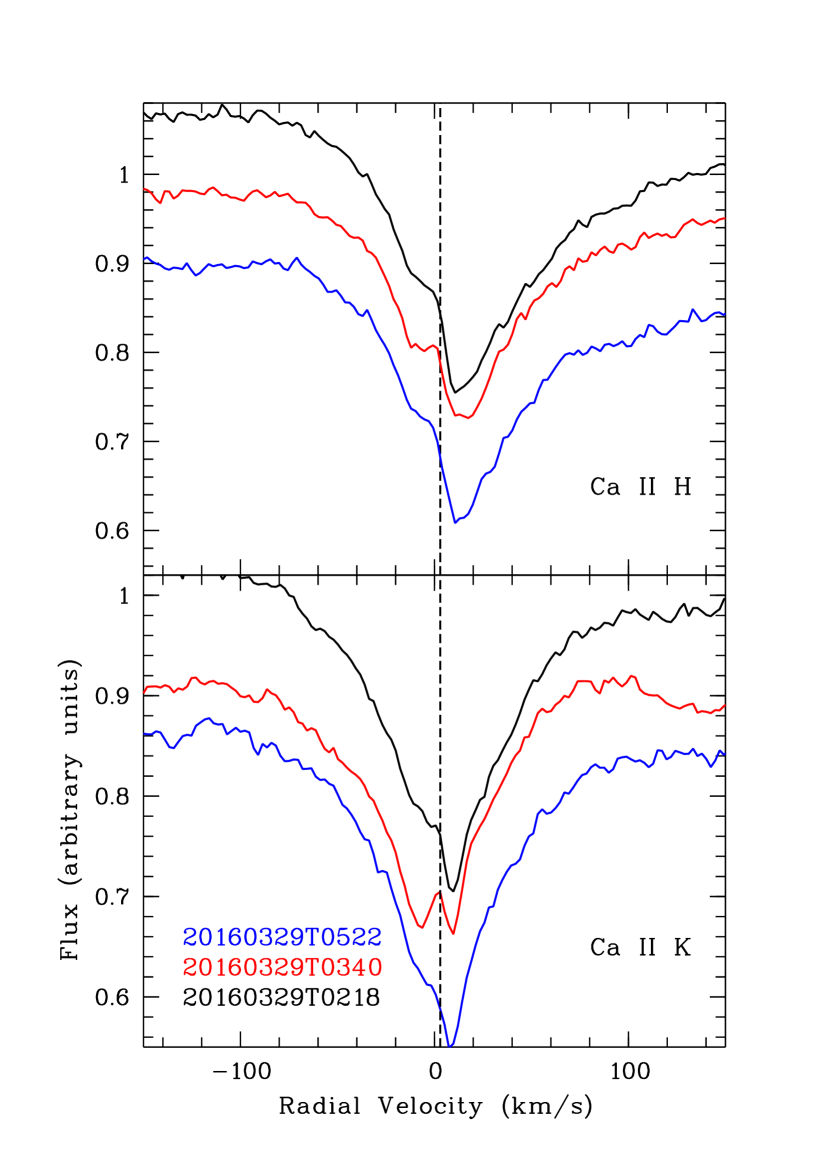
i) The median spectrum of the non-photospheric metallic features shows a prominent emission at the line centre (Fig. 5). The emission peak is located at a velocity of 3 km/s. The emission at the core is also present in the H line and very weak in H. We note that the emission in the Ca ii H&K lines is not apparent in the 2015 spectra (see Fig. 7) but it clearly appeared in the 2017 and 2019 spectra, as well as in the 2016 spectra (see Fig. 8). In both Fig. 7 and 8 the photospheric line contribution has been removed - the procedure we have followed to visualize the Ca ii H&K CS features is described below after item v).
ii) Manifest variability is observed in the Ca ii H&K and Fe ii triplet lines, as well as a less pronounced variation in the Ti ii lines. Changes are observed on any time scale ranging from minutes to days or observing runs, as perceived when comparing spectra taken during the same night, or the median spectra of the different nights or observing periods. The variations do not show a discernible temporal pattern, and there is no correlation between the observed variability of the different metallic ions.
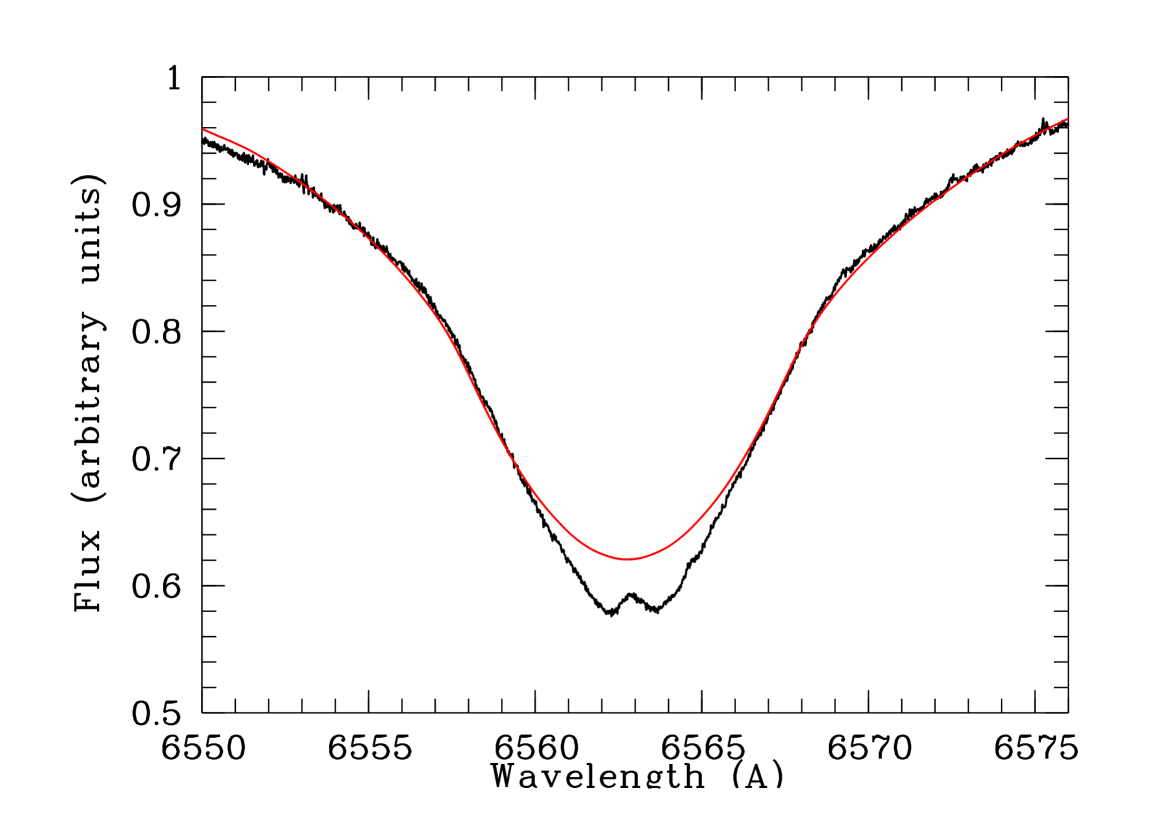
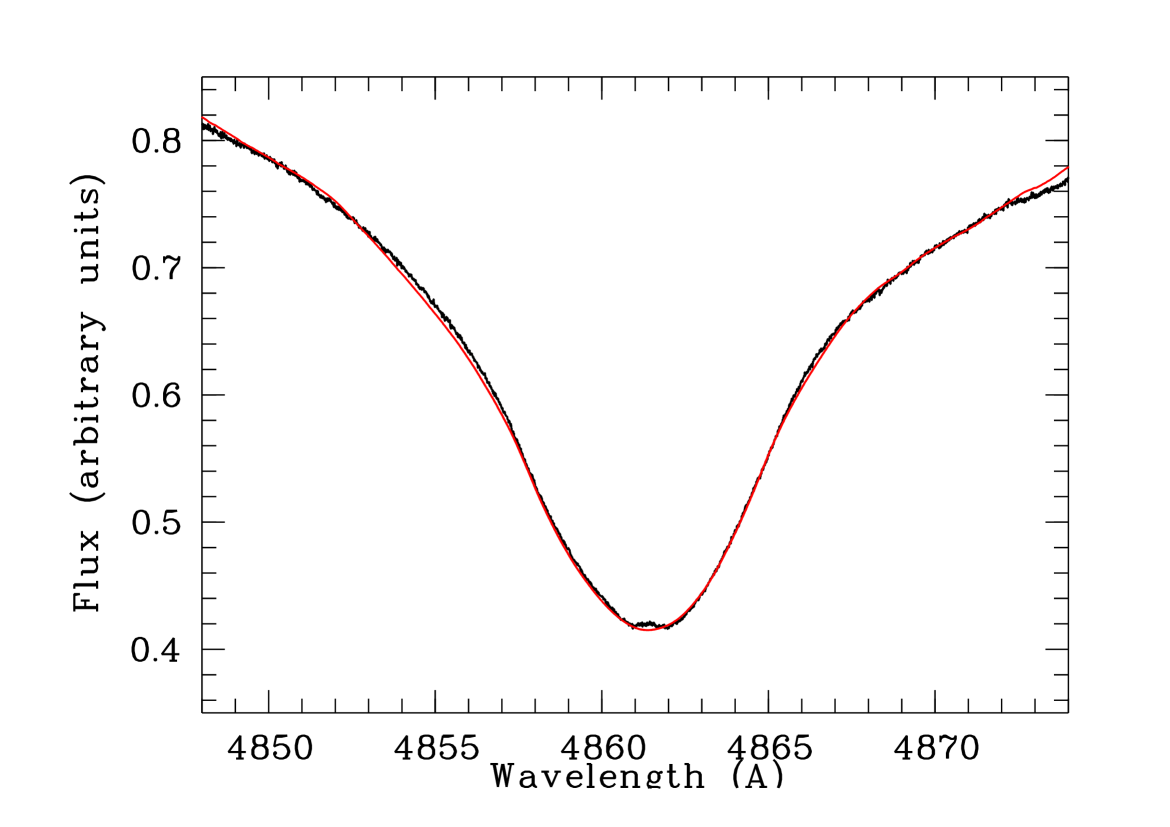
iii) As in the metallic lines, an absorption excess is clearly visible at the core of H (Fig. 6). H and H remained without any noticeable changes in the spectra taken with HERMES and FEROS from 2015 December to 2017 April, but H displayed a clear variability in the spectra of 2019-01-29 taken with HARPS-N. These variations do not exactly correlate with those simultaneously observed in the Ca ii and Fe ii lines.
iv) The Ca ii triplet lines do not show any apparent change when spectra are compared in any time scale. We note, however, that the HARPS-N spectra do not cover these lines; thus, we do not know if these lines varied in 2019-01-29 as H did.
v) In all CS lines, including H, the variability shows up as changes in the relative absorption strength at both blue and red minima of the central emission, but the strength of those minima in the median spectrum is practically indistinguishable (Fig. 5). In the case of the constant Ca ii triplet lines, the blue side is always weaker than the red side. Further, for each line the minima appear at nearly the same radial velocities,
Spectra of some observing runs illustrating the mentioned points above are shown in the next subsections. Beforehand, we point out that in the case of the Ca ii H&K lines the plots show the CS features once the photospheric contribution has been removed. This is carried out by dividing the observed profiles by synthetic ones estimated using the Kurucz synthetic spectrum computed with the Teff, and values of Section 2 as it provides a very reasonable fit -see Fig. 1 in Eiroa et al. (2016). We are aware that due to the high rotational velocity, the oblateness of Leo, as mentioned in Section 2, could be significant, and therefore due to gravity darkening a gradient from equator to poles in at least Teff, must be present. Nonetheless, we are confident that our estimates provide reasonable mean values since our Kurucz model for Aql gives a very good fit (see Fig. 1 of Eiroa et al., 2016), this star also being affected by gravity darkening due to its relevant oblateness (e.g. Bouchaud et al., 2020).
4.2.1 HERMES December 2015
The Ca ii H&K lines of December 20 and 23 are similar showing a broad non-photospheric absorption in addition to the photospheric line - see e.g. Fig. 1 by Eiroa et al. (2016); at the same time, the four spectra of December 22 remained constant, and the absorption at the core was deeper than in the other two nights. Based on this result, and on the behaviour of other spectra obtained in 2016, Eiroa et al. (2016) assumed that the spectra of December 20 and 23 represented a stable absorption formed by the contribution of the stellar photosphere and a CS gas disk, which was taken as a template to analyze other contributions/variations to the CS gas. However, the detection of the central 3 km/s emission in the spectra of 2017 and 2019, which at least was not clearly present in 2015, provides a new perspective, indicating that the assumption in our previous work (Eiroa et al., 2016) was not appropriate. We now note that the December 22 spectra are among the deepest absorption of all spectra taken in different observing runs, and that the December 20 and 23 spectra have depths similar to many other spectra. Also, the profile of the CS Ca ii H&K absorption in December 2015 suggests that the 3 km/s emission at the core was hidden or not present. Thus, our analysis is now carried out considering the whole absorption in excess of the photospheric line given by our Kurucz model.
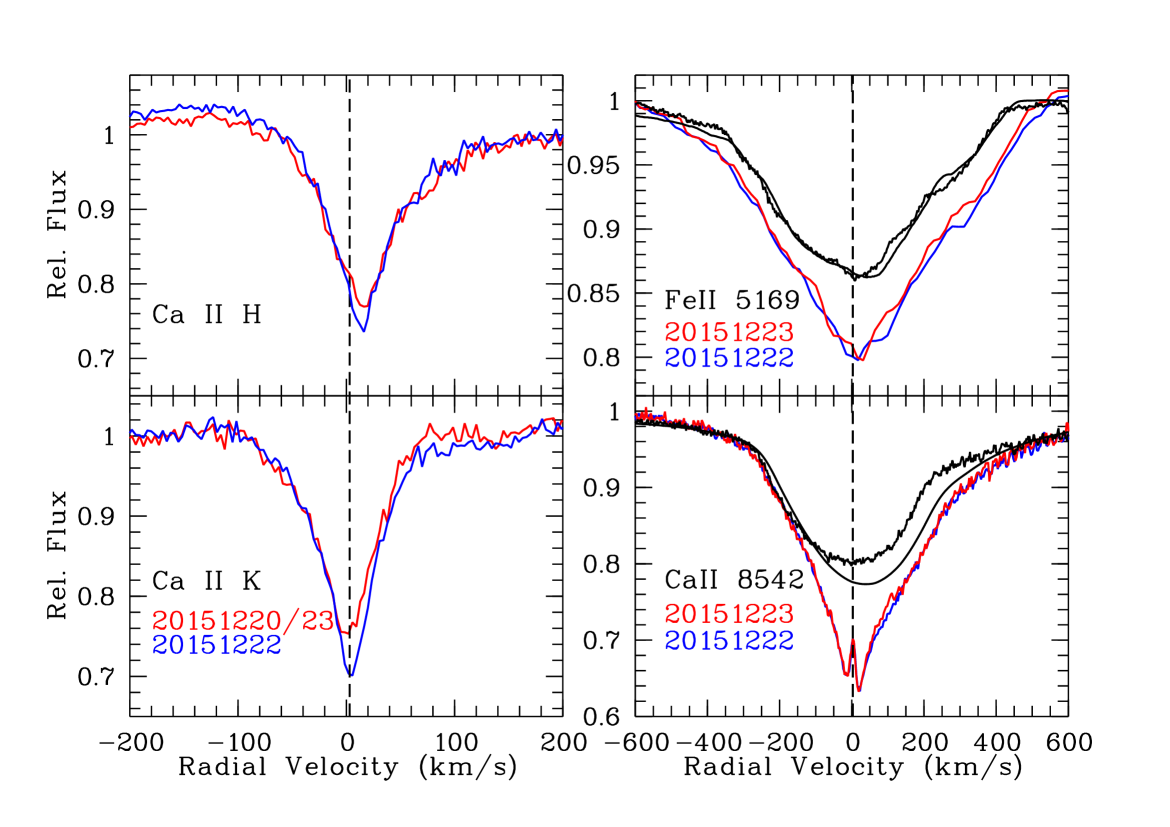
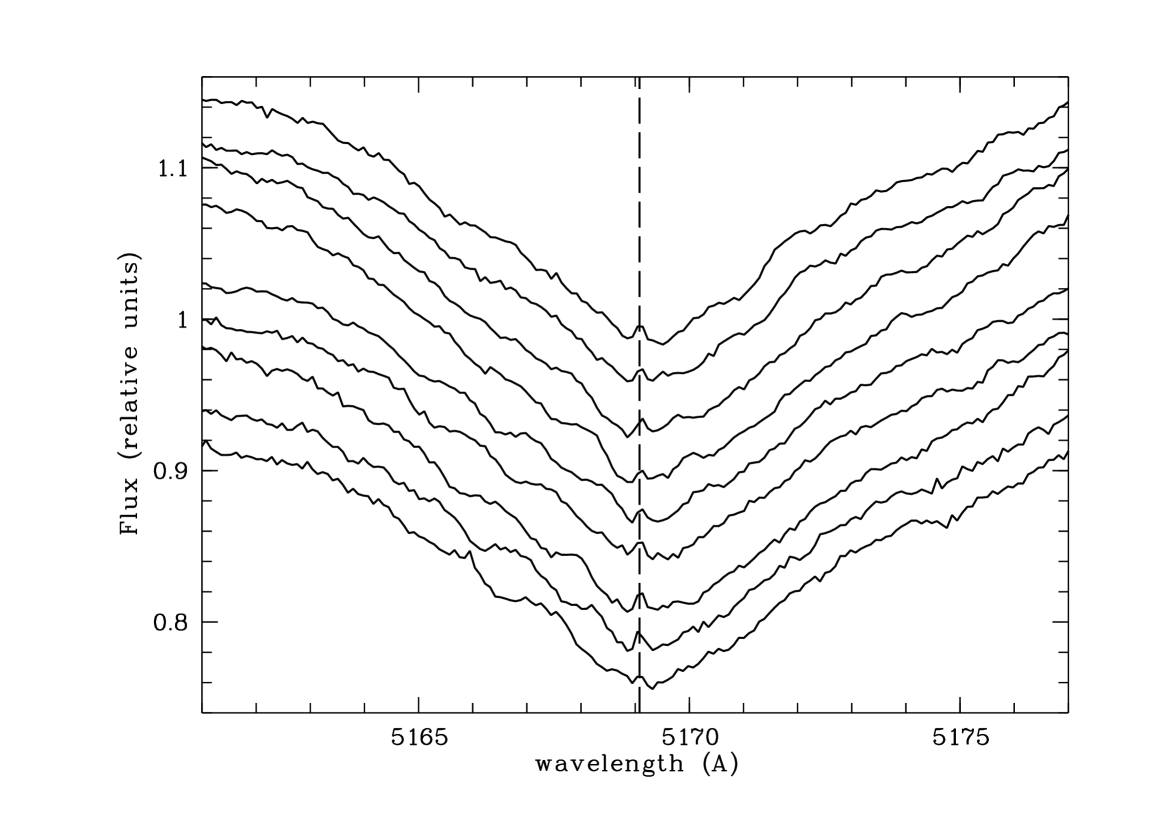
Fig. 7 (left) shows the nightly average of the non-photospheric Ca ii H&K features once the photospheric line has been removed. It can be observed that both Ca ii H&K features are deeper in December 22 than in December 20 and 23. The estimated equivalent widths of the K/H features are 227 mÅ/234 mÅ, and 249 mÅ/245 mÅ, for the spectra December 20/23 and December22, respectively; these figures suggest that the Ca ii features are saturated. The peak of the K absorption is centered at the velocity of the 3 km/s central emission, although as pointed out above such emission is not present in these spectra, and the H line appears at a velocity of 15 km/s. Such a shift to more redshifted velocities is observed in other shell stars (Rebollido et al., 2020), and is likely due to the inference of the H line. Fig. 7 (right) also shows the Fe ii 5169 Å and the Ca ii 8542 Å lines, where one can appreciate that Ca ii 8542 Å does not vary and clearly shows the central 3 km/s emission, while the Fe ii line neither appreciably varies (i.e. it differs in behaviour from the Ca ii H&K lines) nor the central emission is present. The Balmer H and H lines -not shown- are constant and present the 3.0 km/s central emission.
4.2.2 FEROS March 2016
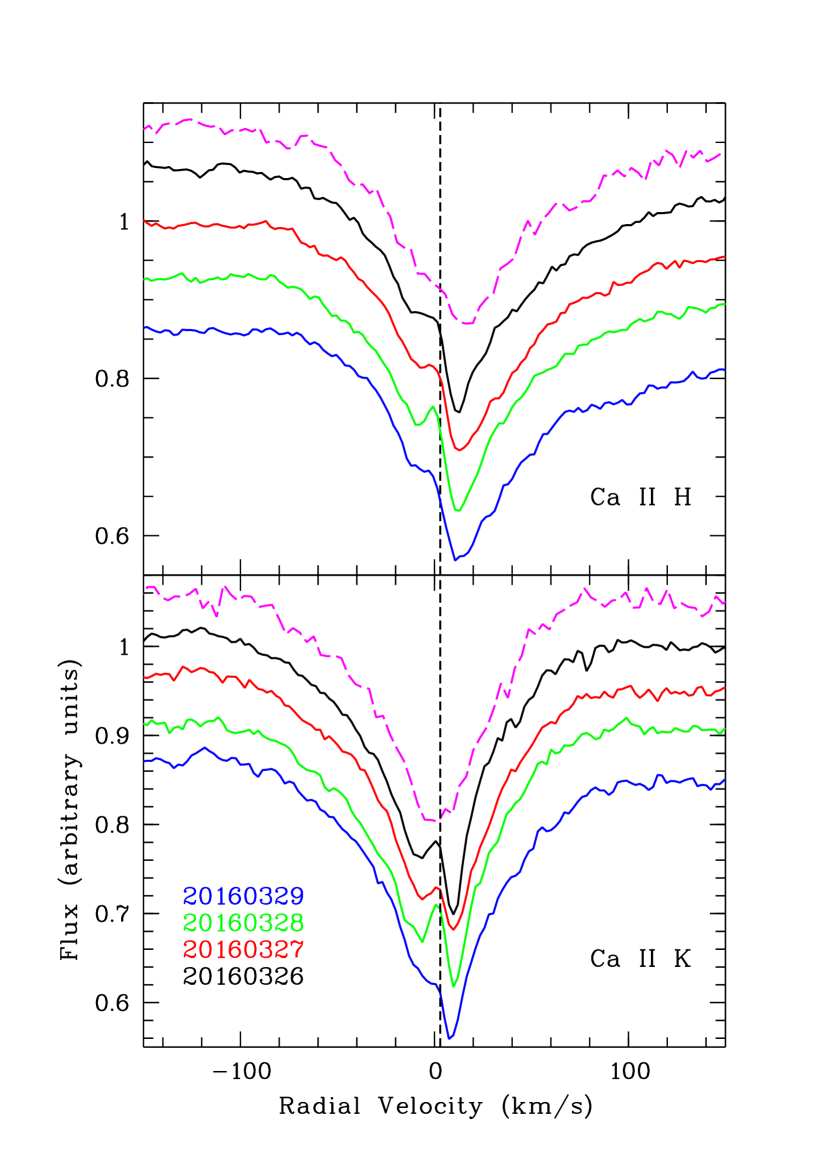
Fig. 8 shows the Ca ii H&K CS features as observed in this period once the photospheric contribution has been removed. Variability can be observed on a nightly basis as well as in the median of each of the four observed nights; we see that, unlike the procedure followed by Eiroa et al. (2016), the 3 km/s emission feature is distinctly distinguishable in many of both individual and median spectra. With the aim of comparison, the feature as observed in 2015-12-20/23 is also plotted in the figure. In this way it can easily be noticed that the variable absorption at both blue- and red-shitfted sides of the central emission can be misled with FEBs events similar to those of Pic, if as assumed by Eiroa et al. (2016) the 2015-12-20/23 feature is taken as a stable template. Besides this, we point out that the variations in the strength of the CS absorption at both blue and red sides of the central emission is recursive in other observing runs, that the changes do not follow an identifiable temporal pattern, and that the velocity of the blue and red deepest absorptions is always similar, km/s and km/s, respectively.
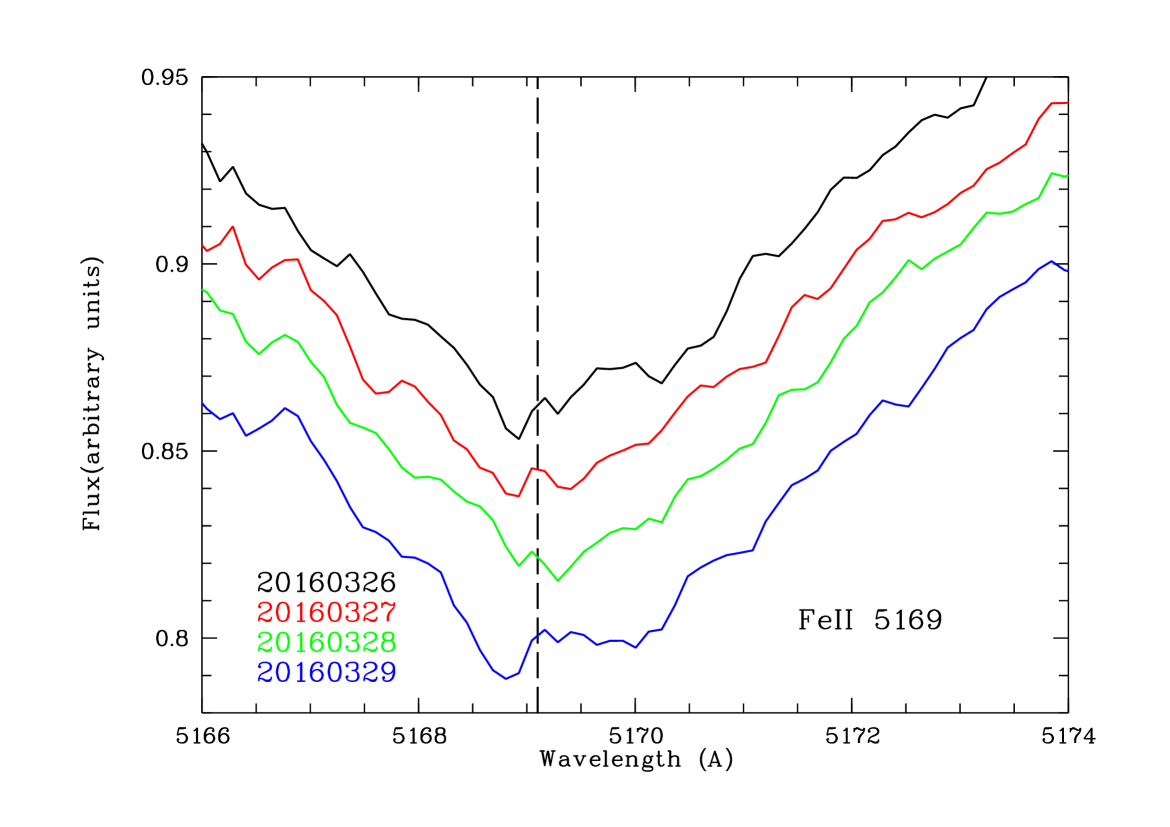
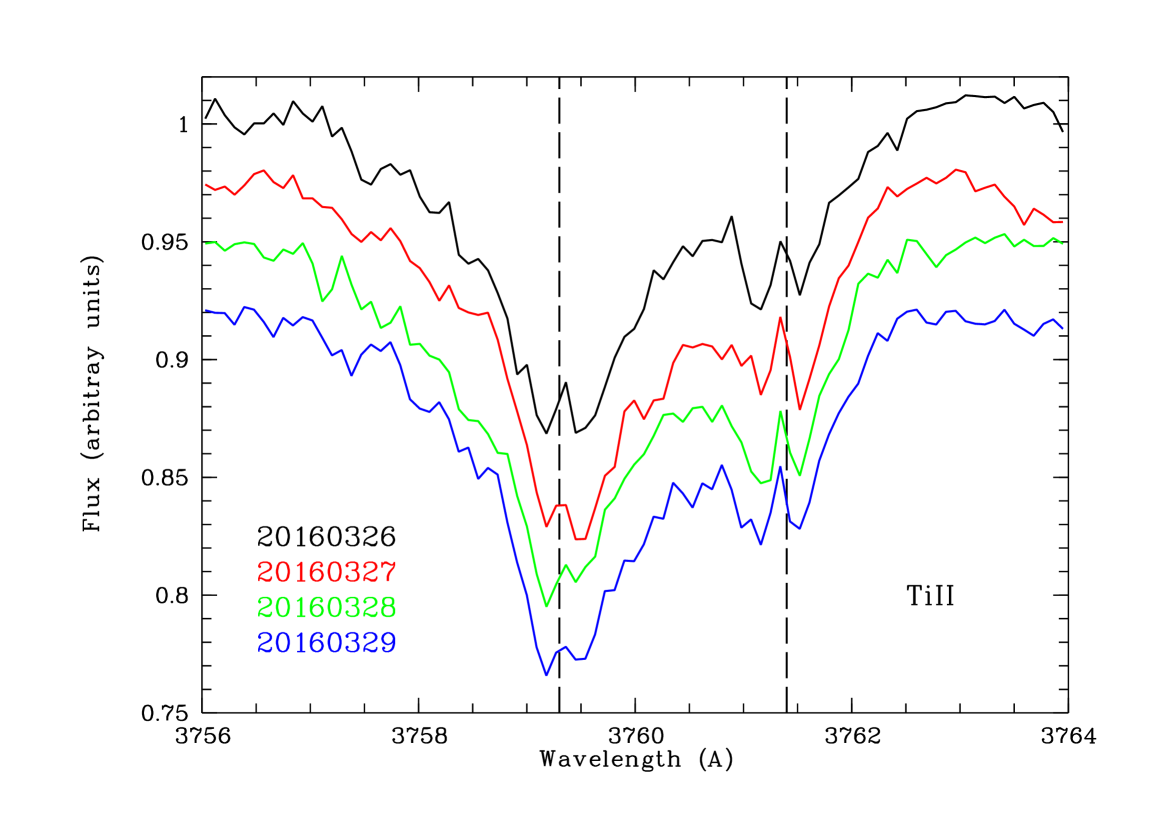
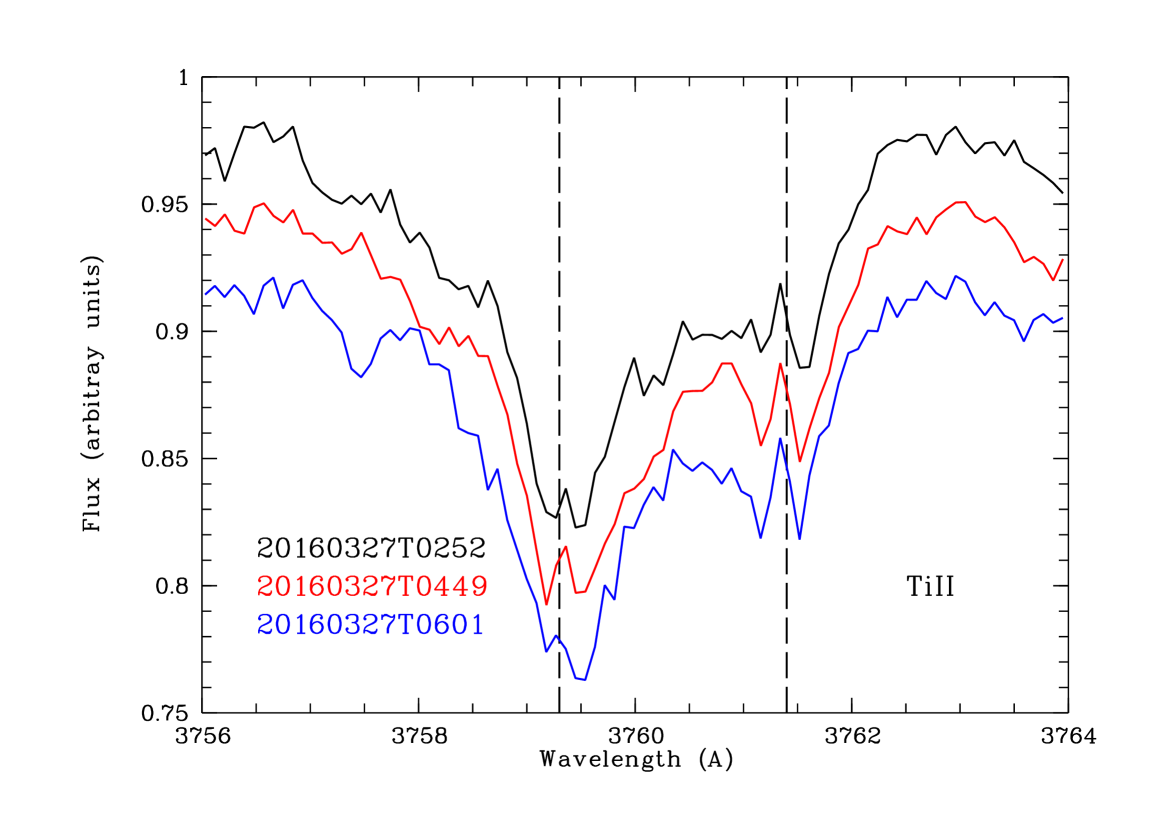
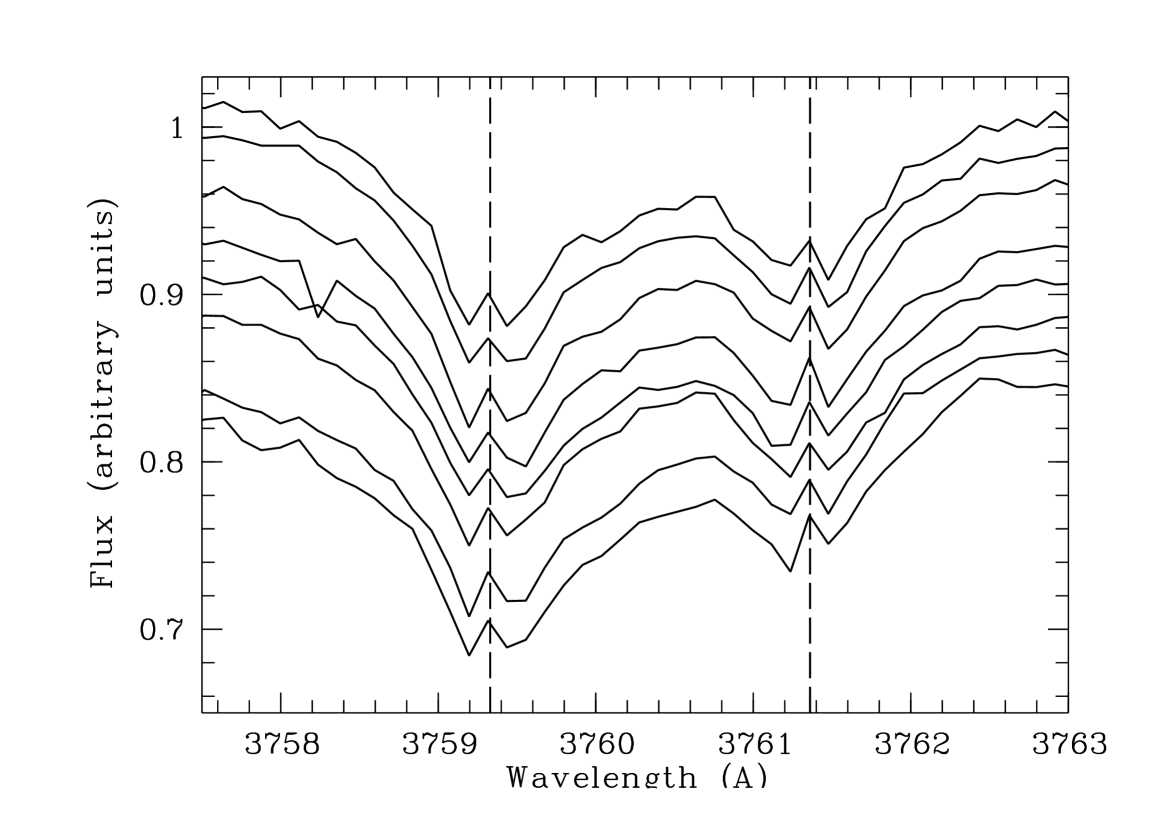
Fig.9 plots the Fe ii 5169 Å and the Ti ii 3759 and 3761 Å lines. In the case of the Fe ii line we have chosen to show the median spectra of each night, while in the case of the Ti ii lines the median spectra as well as the individual spectra of the night 26/27 March are plotted. The 3 km/s emission is seen in all cases, being particularly conspicuous in all spectra of both Ti ii lines. As in the case of the Ca ii K line changes in the strength of the lines at both sides of the central emission are observed, but without any clear correlation among the variations in the different lines. Just to mention, there are no identifiable changes in the Balmer and the Ca ii triplet lines.
4.2.3 HARPS-N January 2019
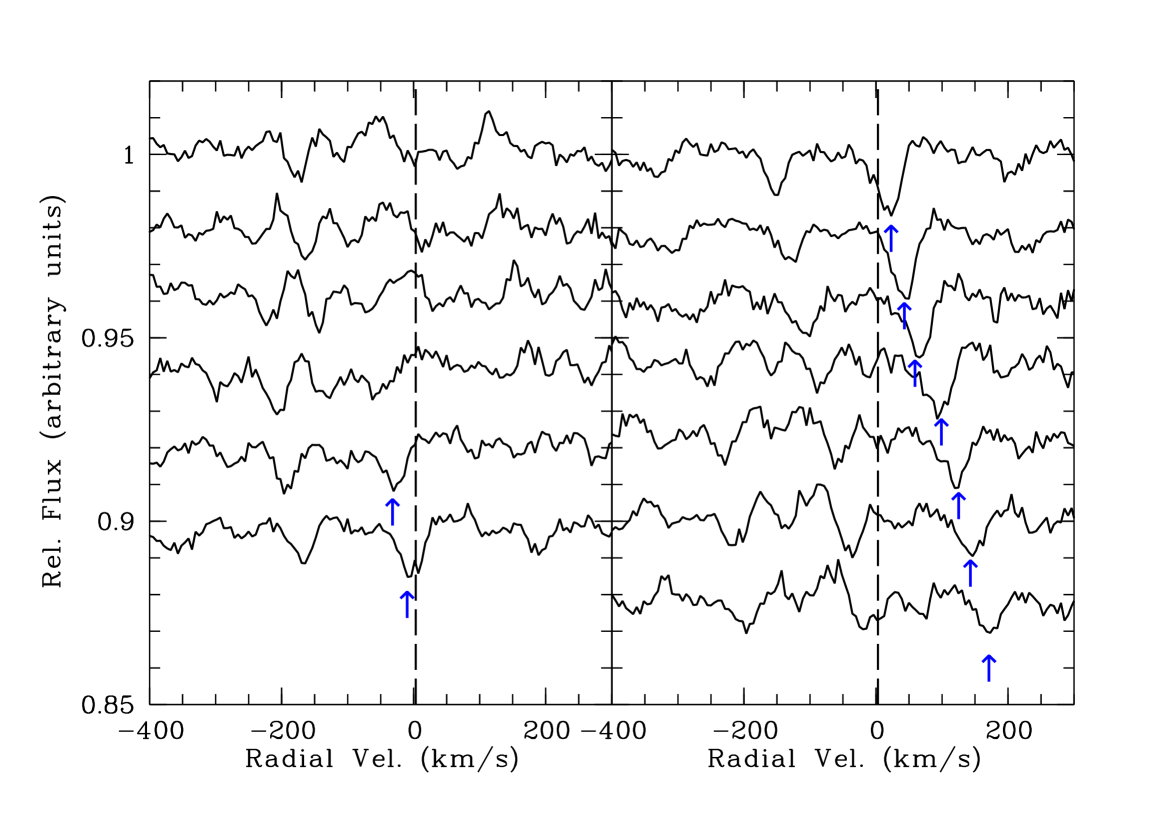
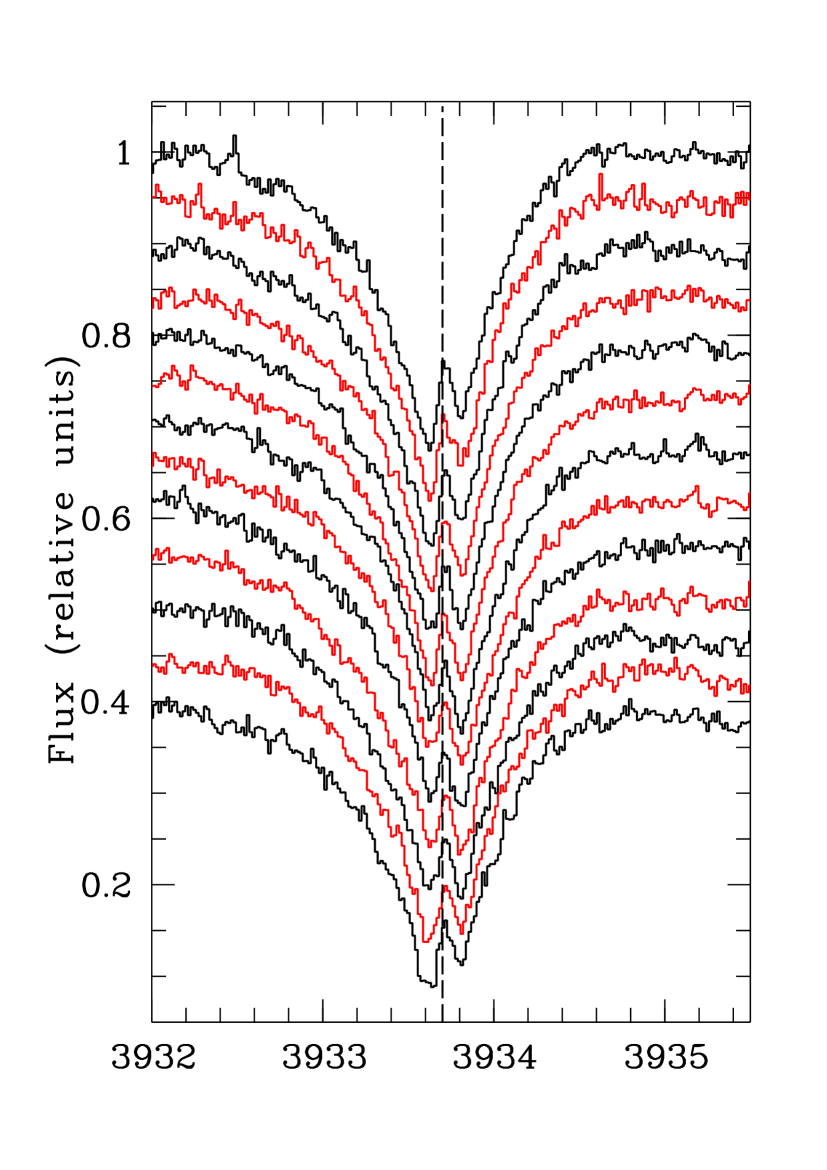
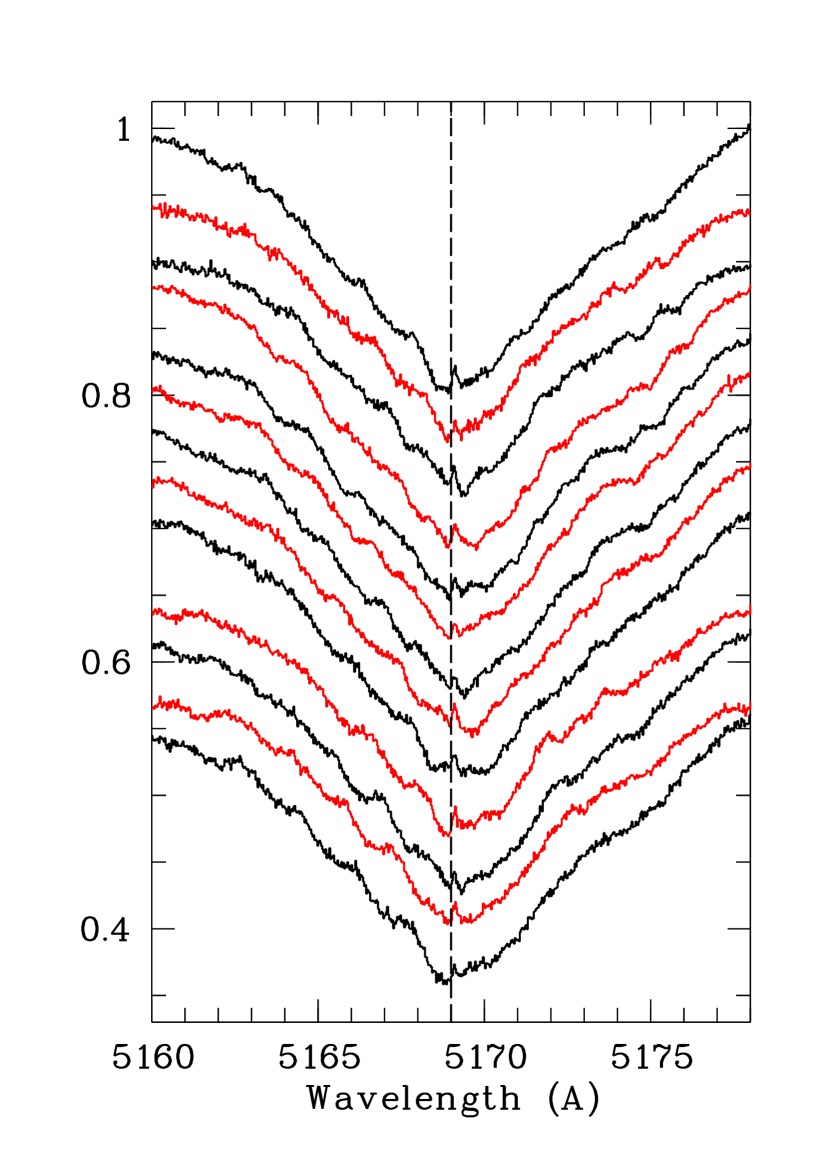
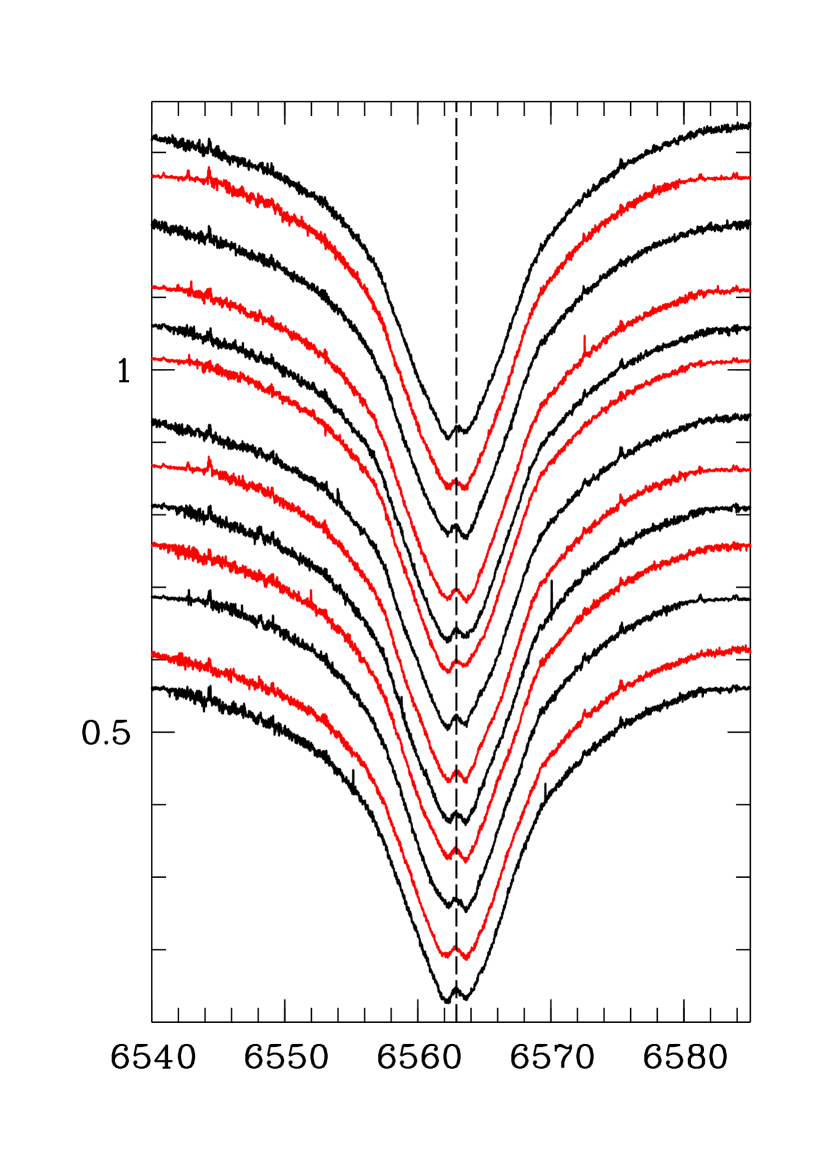
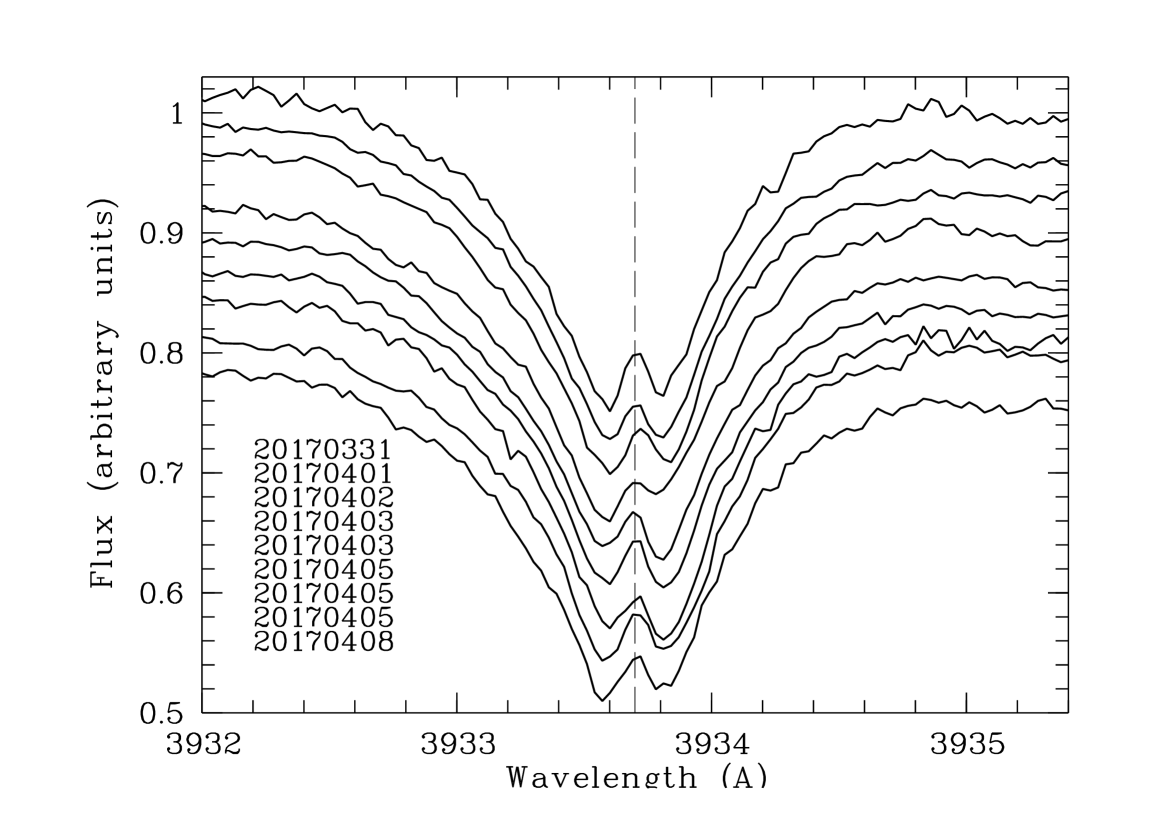
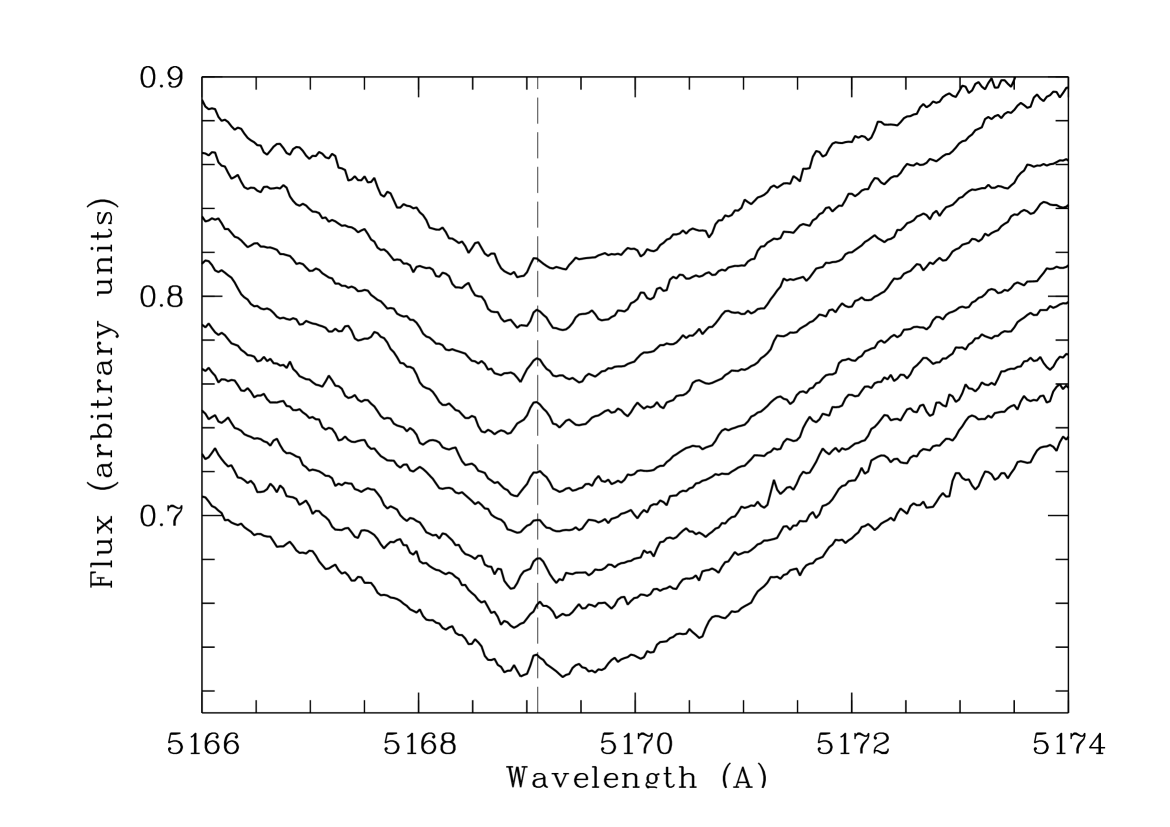
Fig. 10 shows the Ca ii K, Fe ii 5169 Å, and H as observed in the 13 consecutive spectra taken with HARPS during the night of 2019-01-29/30, with an exposure time of 15 minutes each, the first at the top starting at 2019-01-30 01h01m UT. The photospheric contribution has been removed in the case of the Ca ii lines. The central emission is clearly visible in all Ca ii and H spectra, but it is not as obvious in the case of some Fe ii line profiles. Variability is seen at both sides of the central emission among the individual consecutive spectra in all three lines; again that variability does not follow a regular temporal pattern, neither there is a correspondence in the variability of the different lines. We note, as in previous spectra of other observing runs, that the blue and red absorption peaks occurs at practically the same velocity without any evolution in velocity.
5 Discussion
5.1 The Scuti photosphere
The temporal variation of the photospheric lines and the Scuti TESS photometric variability (Balona & Ozuyar, 2020) are alike. As stated in Sect. 2, Leo is most likely seen edge-on; thus, assuming a stellar radius of 3.2 and 230 km/s as the equatorial velocity, the rotation period would be 17 hours, i.e., seemingly larger than the apparent temporal duration of the features crossing the photospheric lines. While the uncertainty of the assumed stellar parameters is high since this estimate does not take into account the oblateness of the star - and consequently the expected gravity darkening - and assumes an edge-on inclination, it does suggest that the observed bumps and dumps in the line profiles are not modulated by rotation, which also argues against the existence of spots on the surface of the star. Similar temporal behaviour of bumps and dumps crossing the profiles of photosperic lines from blue to red on time scales of hours are well known since several decades in other Scuti stars (Walker et al., 1987; Kennelly et al., 1992, 1998; Balona, 2000; Mantegazza, 2000), as well as in Be stars (e.g. Vogt & Penrod, 1983; Baade, 1984; Kambe et al., 1993a, b; Leister et al., 1994), and early-type supergiants (e.g. Baade & Ferlet, 1984). The common interpretation is that non-radial (longitudinal) pulsations are caused by motions along longitudinal strips; those non-radial pulsations divide the stellar surface in regions with different velocity fields, which, in the presence of rotation, redistribute the flux over the absorption line profile to create moving patterns of peaks and troughs (e.g. Walker et al., 1987; Telting & Schrijvers, 1997; Schrijvers & Telting, 1999; Mantegazza, 2000; Telting, 2003, and references therein). The non-radial pulsations can even be related to stellar rotation in the sense that rapid rotation facilitates the detection of this kind of pulsations (Baade & Ferlet, 1984). A deeper analysis of the spectroscopic photospheric variability in conjunction with the TESS photometric data is deferred to another work.
5.2 The circumstellar disk
The common feature shared by the detected CS absorptions mentioned in Section 4.2 is the 3 km/s emission at the core of the lines. We have checked the spectra of all shell stars - 18 objects - included in the sample of Rebollido et al. (2020) and no comparable spectral characteristic is present, with the exception of a similar stable Ca ii triplet profile with an emission at the center and the blue side weaker than the red side in the stars HD 21688, HD 39182, and HD 42111. In the case of HD 21688 an emission is also observed in the center of the H line, while HD 39182 and HD 42111 display complex Fe ii 5169 Å profiles. At the same time, the shape of the Ca ii triplet in HD 85905 is similar to the shape in these stars, but its radial velocity changes remarkably as it happens in other shell features, while the photospheric lines remain constant. Further, we note that all the previous mentioned stars but HD 21688 have variable Ca ii H&K CS features, as well as that other shell stars with variability in these Ca ii lines in Rebollido et al. (2020) - HD 256 (HR 10), HD 37306, HD 50241, HD 138629, HD 148283, and HD 217782 - do have single narrow shell absorptions. Thus, the emerging picture of the A-type stars with CS shells is the one of a heterogeneous class of stars, which merely reflects previously known results (e.g. Jaschek et al., 1988; Jaschek & Andrillat, 1998).
Interestingly, alike the CS shell line profiles in Leo, central emissions at the core of shell lines with two absorption minima at both sides are also observed in the rapidly rotating Be shell stars (e.g. Rivinius et al., 1999). Such emissions, so-called ”central quasi emission” peaks, CQE’s, are non-photospheric since they are only observed in shell lines (Koubsky et al., 1993, 1997), and are favoured by the presence of an edge-on CS disk, which should be optically thin in the continuum, have a small spatial extent, and show little line broadening (Hanuschik, 1995; Rivinius et al., 1999). We note here that Leo also is a rapidly rotating star with a - plausible - edge-on CS disk. CQE’s result from the local minimum at zero radial velocity in the fraction of the stellar disk occulted by CS gas in Keplerian orbital motion, i.e., gas moving perpendicular to the line of sight, as predicted in Hanuschik’s Keplerian model for CS disks around Be shell stars; thus, CQE’s are pure absorption phenomena occuring at few stellar radii not related to any emission process (Hanuschik, 1995; Rivinius et al., 1999). Following the model by Hanuschik (1995) we can estimate the radius of the Leo CS disk () where the shell absorption lines form; thus, using Equation 1 in Rivinius et al. (1999) - , where is the velocity separation of the two minima around the CQE, and is the critical velocity of the star ( km/s, assuming the values of given in Sect. 2 for Leo and considering only the centrifugal and gravitational forces) - we obtain equal to 13.5 for the Ca ii K line, 10.7 for Ti ii 3759 Å, 9.8 for Fe ii 5169 Å, 8.5 for Ca ii 8542 Å, and 5.7 for H. We note that these values of are similar to those estimated by Abt et al. (1997) for the Ti ii lines assuming a Keplerian scenario. Variability in the strength of the absorption minima at both sides of the CQE’s, similar to the changes observed in Leo, are also known to be exhibited by some Be shell stars - e.g. Cap (see Fig. 3 in Rivinius et al., 1999); such changes might be due to the re-supply of matter from the star to the disk. Mechanisms for sufficient angular momentum transfer from the star to the disk in Be stars are a matter of debate (e.g. see Rivinius et al., 2013); among them, the more firmly established are those relating the disk and stellar non-radial pulsations (e.g. Cranmer, 2009, and references therein). Given the plausible evidence for the presence of this kind of pulsations in Leo, provided by the spectroscopic variations of its photospheric lines, it is suggestive to suppose that such mechanism could also be at work in this star.
We also note that the absorption minima at both sides of the central emission always show up at similar radial velocities for each line, but different for each one, without any apparent dynamical evolution; thus differing from the bona-fide exocometary events observed in Pic. This fact, together with the variability and changes observed from practically one spectrum to another, at any time scale, in the lines of Ca ii, Fe ii, and Ti ii, suggests that such line variations in Leo are highly unlikely to be produced by comet-like bodies.
5.3 A brief note on the exocomet-host shell stars
As indicated in the Introduction, around 30 stars have been suggested to host exocomets in their immediate surroundings (Welsh & Montgomery, 2018; Rebollido et al., 2020; Strøm et al., 2020, and references therein); this fact mainly based on the variable events observed in the Ca ii K line. Among those 30 stars, 10 are A-type shell stars, including Leo and HR 10 - see Table 7 in Rebollido et al. (2020). However, the HR 10 results presented by Montesinos et al. (2019) and those of Leo presented here, in both cases based on a very large amount of observational data, clearly demonstrate the need, at least in the shell stars, of a deeper analysis of the stellar spectra, extending to large periods of time as well as to the behaviour of other shell lines, and not just restricting such analysis to the Ca ii K line. For instance, we note that Rebollido et al. (2020) pointed out in the case of the shell star HD 85905 that the observed spectral variations could be due to variability of the CS shell as suggested by the observed changes of several shell lines, and not just the Ca ii K line; further, we have noted in the first paragraph of the previous section the similar or dissimilar behaviour of different lines among shell stars independently of the variability of the Ca ii K line.
6 Conclusions
Our spectroscopic observations reveal that Leo is a highly variable Scuti type A-shell star with remarkable changes in its photospheric and CS lines. The photospheric variability manifests as dumps and bumps superimposed on the lines profiles, varying their strength and sharpness and propagating from blue- to more red-shifted radial velocities; those features persist along few hours with a time scale of the order of the Scuti photometric variations observed with TESS (Balona & Ozuyar, 2020). Thus, similarly to other Scuti stars, the Leo spectroscopic photospheric variability is likely produced by non-radial pulsations caused by motions along longitudinal strips on the stellar surface.
With respect to the non-photospheric CS lines, our data suggest that Leo is a late A-type star, whose shell is a disk seen nearly edge-on, and with characteristics reminiscent of the ones observed in Be shell stars. Thus, we would be facing a case of a relatively late spectral type star, and consequently relatively low mass star, exhibiting a Be shell-like phenomenon. Summarizing, Leo plausibly is a rapidly rotating Scuti star surrounded by a variable CS disk, possibly re-supplied by the Scuti pulsations. To our knowledge, theoretical efforts focusing on such scenario have been limited to B stars but not to late-type A stars (e.g. Rivinius et al., 2013, and references therein); in this respect, Leo is an incentive to extend such studies to less massive stars. Finally, we find that this CS scenario for Leo is more plausible than the exocomet one first suggested by Eiroa et al. (2016); in fact, the central emission together with the variable absorption minima at both sides changing their strength, but not their velocity, in the lines of Ca ii, Fe ii, and Ti ii from practically one spectrum to another, and in some periods also in H, are highly unlikely to be produced by comets.
Finally, the observational results presented in this work, together with those presented by Montesinos et al. (2019) concerning the shell star HR 10, suggest the need of a critical revision regarding the origin of the Ca ii K line variable features observed in other shell stars, which have been attributed to exocomets.
Acknowledgements.
The authors thank the referee for the comments and suggestions to the original manuscript. This work is based on observations made at the Spanish Observatorio del Roque de los Muchachos (La Palma, Spain) of the Instituto de Astrofísica de Canarias with the Mercator Telescope, operated by the Flemmish Community, the Nordic Optical Telescope, operated by the Nordic Optical Telescope Scientific Association, and the Italian Telescopio Nazionale Galileo (TNG) operated by the Fundación Galileo Galilei of the INAF. Based on observations made with the ESO/MPG 2.2 m telescope at the La Silla Observatory under programmes 099.A-9029(A) and 094.A-9012. CE, BM, IR, GM and EV were supported by Spanish grant AYA 2014-55840-P; BM, IR, GM and EV are also supported by Spanish grant PGC2018-101950-B-100. We thank Ana Guijarro of the Calar Alto Observatory for obtaining the CARMENES spectrum.References
- Abt (2008) Abt, H. A. 2008, ApJS, 174, 499
- Abt & Moyd (1973) Abt, H. A. & Moyd, K. I. 1973, ApJ, 182, 809
- Abt et al. (1997) Abt, H. A., Tan, H., & Zhou, H. 1997, ApJ, 487, 365
- Adamczak & Lambert (2014) Adamczak, J. & Lambert, D. L. 2014, ApJ, 791, 58
- Arcos et al. (2018) Arcos, C., Kanaan, S., Chávez, J., et al. 2018, MNRAS, 474, 5287
- Baade (1984) Baade, D. 1984, A&A, 135, 101
- Baade & Ferlet (1984) Baade, D. & Ferlet, R. 1984, A&A, 140, 72
- Balona (2000) Balona, L. A. 2000, MNRAS, 318, 289
- Balona & Ozuyar (2020) Balona, L. A. & Ozuyar, D. 2020, MNRAS, 493, 2528
- Bouchaud et al. (2020) Bouchaud, K., Domiciano de Souza, A., Rieutord, M., Reese, D. R., & Kervella, P. 2020, A&A, 633, A78
- Boyajian et al. (2016) Boyajian, T. S., LaCourse, D. M., Rappaport, S. A., et al. 2016, MNRAS, 457, 3988
- Cataldi et al. (2019) Cataldi, G., Moór, A., Ohashi, N., et al. 2019, Research Notes of the AAS, 3, 39
- Cosentino et al. (2012) Cosentino, R., Lovis, C., Pepe, F., et al. 2012, in Society of Photo-Optical Instrumentation Engineers (SPIE) Conference Series, Vol. 8446, Proc. SPIE, 84461V
- Cranmer (2009) Cranmer, S. R. 2009, ApJ, 701, 396
- David & Hillenbrand (2015) David, T. J. & Hillenbrand, L. A. 2015, ApJ, 804, 146
- De Rosa et al. (2014) De Rosa, R. J., Patience, J., Wilson, P. A., et al. 2014, MNRAS, 437, 1216
- Eiroa et al. (2016) Eiroa, C., Rebollido, I., Montesinos, B., et al. 2016, A&A, 594, L1
- Ferlet et al. (1987) Ferlet, R., Vidal-Madjar, A., & Hobbs, L. M. 1987, A&A, 185, 267
- Gray & Corbally (2009) Gray, R. O. & Corbally, J., C. 2009, Stellar Spectral Classification
- Hanuschik (1995) Hanuschik, R. W. 1995, A&A, 295, 423
- Jaschek & Andrillat (1998) Jaschek, C. & Andrillat, Y. 1998, A&AS, 130, 507
- Jaschek et al. (1988) Jaschek, M., Jaschek, C., & Andrillat, Y. 1988, A&AS, 72, 505
- Jaschek et al. (1991) Jaschek, M., Jaschek, C., & Andrillat, Y. 1991, A&A, 250, 127
- Kambe et al. (1993a) Kambe, E., Ando, H., & Hirata, R. 1993a, A&A, 273, 435
- Kambe et al. (1993b) Kambe, E., Ando, H., Hirata, R., et al. 1993b, PASP, 105, 1222
- Kaufer et al. (1999) Kaufer, A., Stahl, O., Tubbesing, S., et al. 1999, The Messenger, 95, 8
- Kennelly et al. (1998) Kennelly, E. J., Brown, T. M., Kotak, R., et al. 1998, ApJ, 495, 440
- Kennelly et al. (1992) Kennelly, E. J., Walker, G. A. H., & Merryfield, W. J. 1992, ApJ, 400, L71
- Kiefer et al. (2014a) Kiefer, F., Lecavelier des Etangs, A., Augereau, J.-C., et al. 2014a, A&A, 561, L10
- Kiefer et al. (2014b) Kiefer, F., Lecavelier des Etangs, A., Boissier, J., et al. 2014b, Nature, 514, 462
- Kiefer et al. (2017) Kiefer, F., Lecavelier des Étangs, A., Vidal-Madjar, A., et al. 2017, A&A, 608, A132
- Koubsky et al. (1997) Koubsky, P., Harmanec, P., Kubat, J., et al. 1997, A&A, 328, 551
- Koubsky et al. (1993) Koubsky, P., Horn, J., Harmanec, P., et al. 1993, A&A, 277, 521
- Lagrange-Henri et al. (1990) Lagrange-Henri, A. M., Ferlet, R., Vidal-Madjar, A., et al. 1990, A&AS, 85, 1089
- Leister et al. (1994) Leister, N. V., Janot-Pacheco, E., Hubert, A. M., et al. 1994, A&A, 287, 789
- Manser et al. (2019) Manser, C. J., Gänsicke, B. T., Eggl, S., et al. 2019, Science, 364, 66
- Mantegazza (2000) Mantegazza, L. 2000, in Astronomical Society of the Pacific Conference Series, Vol. 210, Delta Scuti and Related Stars, ed. M. Breger & M. Montgomery, 138
- Montesinos et al. (2019) Montesinos, B., Eiroa, C., Lillo-Box, J., et al. 2019, A&A, 629, A19
- Quirrenbach et al. (2016) Quirrenbach, A., Amado, P. J., Caballero, J. A., et al. 2016, in Proc. SPIE, Vol. 9908, Ground-based and Airborne Instrumentation for Astronomy VI, 990812
- Rappaport et al. (2018) Rappaport, S., Vanderburg, A., Jacobs, T., et al. 2018, MNRAS, 474, 1453
- Raskin et al. (2011) Raskin, G., van Winckel, H., Hensberge, H., et al. 2011, A&A, 526, A69
- Rebollido et al. (2020) Rebollido, I., Eiroa, C., Montesinos, B., et al. 2020, arXiv e-prints, arXiv:2003.11084
- Redfield (2007) Redfield, S. 2007, ApJ, 656, L97
- Rieke et al. (2005) Rieke, G. H., Su, K. Y. L., Stansberry, J. A., et al. 2005, ApJ, 620, 1010
- Rivinius et al. (2013) Rivinius, T., Carciofi, A. C., & Martayan, C. 2013, A&A Rev., 21, 69
- Rivinius et al. (1999) Rivinius, T., Štefl, S., & Baade, D. 1999, A&A, 348, 831
- Royer et al. (2007) Royer, F., Zorec, J., & Gómez, A. E. 2007, A&A, 463, 671
- Schrijvers & Telting (1999) Schrijvers, C. & Telting, J. H. 1999, A&A, 342, 453
- Smette et al. (2015) Smette, A., Sana, H., Noll, S., et al. 2015, A&A, 576, A77
- Soubiran et al. (2016) Soubiran, C., Le Campion, J.-F., Brouillet, N., & Chemin, L. 2016, A&A, 591, A118
- Strøm et al. (2020) Strøm, P. A., Bodewits, D., Knight, M. M., et al. 2020, arXiv e-prints, arXiv:2007.09155
- Telting (2003) Telting, J. 2003, Ap&SS, 284, 85
- Telting et al. (2014) Telting, J. H., Avila, G., Buchhave, L., et al. 2014, Astronomische Nachrichten, 335, 41
- Telting & Schrijvers (1997) Telting, J. H. & Schrijvers, C. 1997, A&A, 317, 723
- van Belle (2012) van Belle, G. T. 2012, A&A Rev., 20, 51
- Vogt & Penrod (1983) Vogt, S. S. & Penrod, G. D. 1983, ApJ, 275, 661
- Walker et al. (1987) Walker, G. A. H., Yang, S., & Fahlman, G. G. 1987, ApJ, 320, L139
- Welsh et al. (1998) Welsh, B. Y., Craig, N., Crawford, I. A., & Price, R. J. 1998, A&A, 338, 674
- Welsh & Montgomery (2018) Welsh, B. Y. & Montgomery, S. L. 2018, MNRAS, 474, 1515
- Zorec & Royer (2012) Zorec, J. & Royer, F. 2012, A&A, 537, A120
Appendix A Results: Photospheric lines
A.1 HERMES May 2016
During the night 2016-05-11, 20 consecutive spectra were obtained along 4 hours of observations. The night was not optimal and one of the spectra was not useful. Fig. 11 shows the profiles of Ca i 4226 Å and the Mg ii lines obtained during this night. Several dumps/bumps lasting up to several hours are observed in both lines but seemingly not coincident. In particular, e.g., there is a depression in the Mg ii line going from 4480 Å to 4483 Å from 2016-05-11 21h05m UT to at least 2016-05-11 23h27m UT, i.e., it lasts at least 150 minutes
A.2 HERMES/FEROS March/April 2017
During these observing runs series spectra were taken during 12 consecutive nights as long as the air mass of the star was 2.0. In some nights HERMES and FEROS spectra were obtained simultaneously and their appearance was quite similar in spite of the different spectral resolution, which provides high confidence about the reliability on the weak features seen superimposed on the line profiles. As representative results we show below the spectra of the Mg ii 4481 Å line in two of the nights, in one case with HERMES spectra, and one night with both HERMES and FEROS spectra.
-
•
2017-03-28: During this night 24 spectra were obtained with HERMES (2 of them were not useful). Fig 12 plots the Mg ii 4481 Å line with the labels indicating the observing UT of each spectra. No obvious dumps/bumps in the line profiles that could be attributed to pulsations are clearly detected in several spectra, although very weak features might be present in some of them.
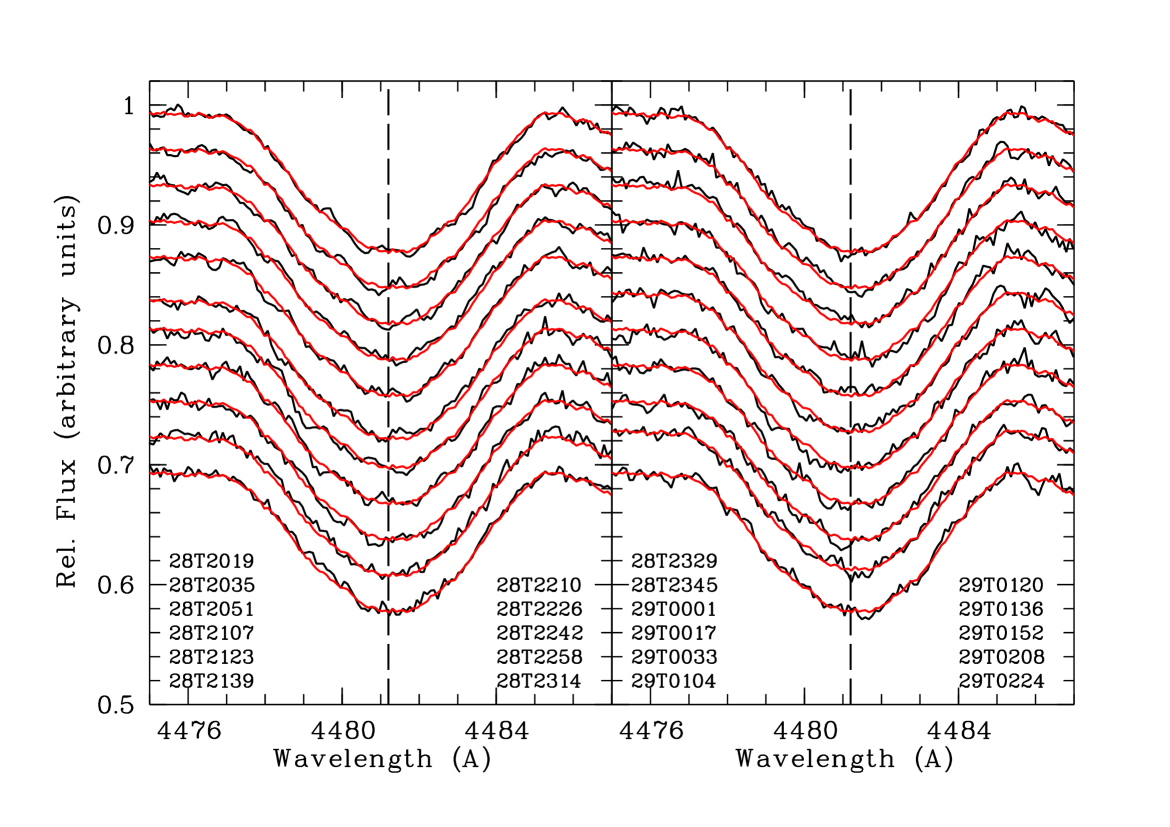
Figure 12: Profiles of the Mg ii 4481 Å line as observed with HERMES during the night 2017-03-28/29. The spectra have been rebinned to 0.09 Å/pixel; the median of the night is plotted in red superimposed on each spectrum. In both panels UTs from top to bottom and from left to right correspond to spectra ordered from top to bottom. -
•
2017-04-01/02: This night 21 HERMES and 28 FEROS spectra were taken along a time interval of 9:30 hours. Fig. 13 plots the Mg ii 4481 Å line of these spectra. Several features, mostly dumps, are distinctly present in the spectra, although no obvious features are discernible in some of them (e.g. the spectra taken at 2017-04-02 04h23m UT or 2017-04-02 04h28m UT). Note that some features appear in the blue side of the line profile but not always apparently propagate to the red wing. It is noticeable that the HERMES and FEROS spectra agree very well, see e.g the spectra taken at 2017-04-02 01h44m UT and 2017-04-02 01h45m UT with HERMES and FEROS respectively, or the ones taken at 2017-04-02 02h32m UT with both HERMES and FEROS simultaneously.
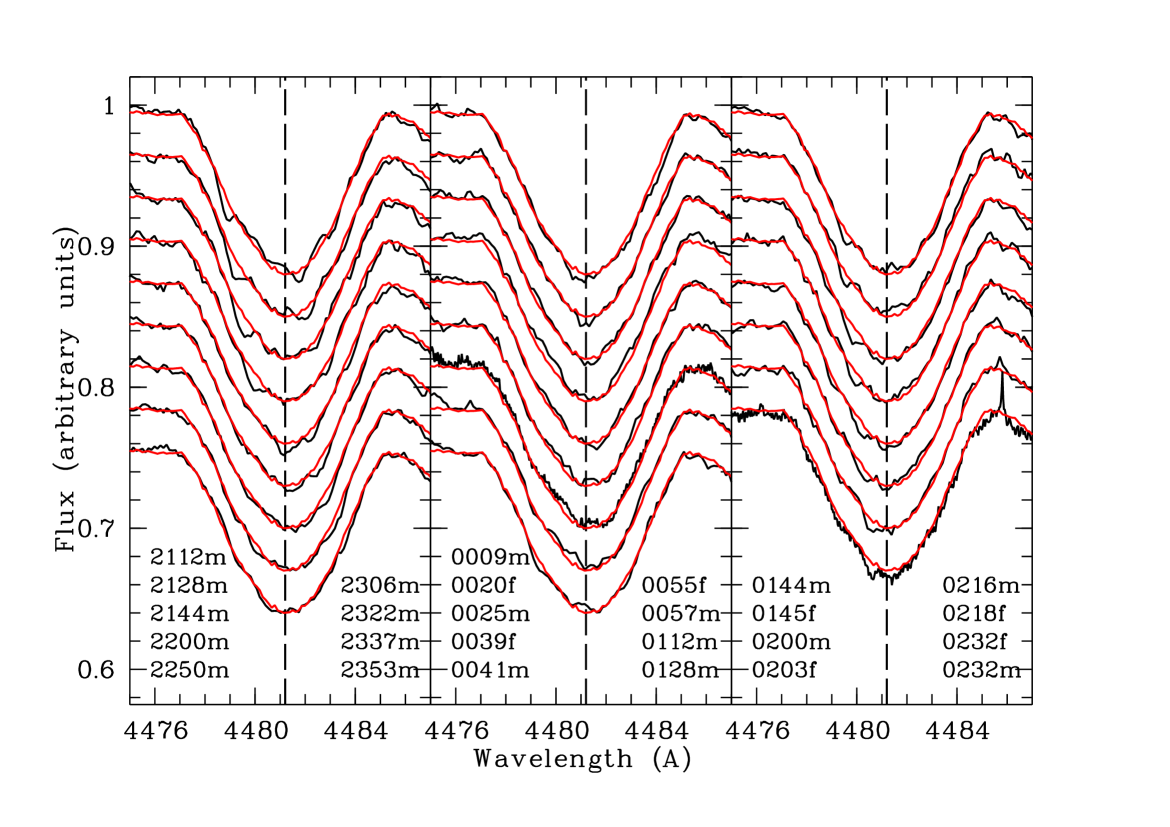
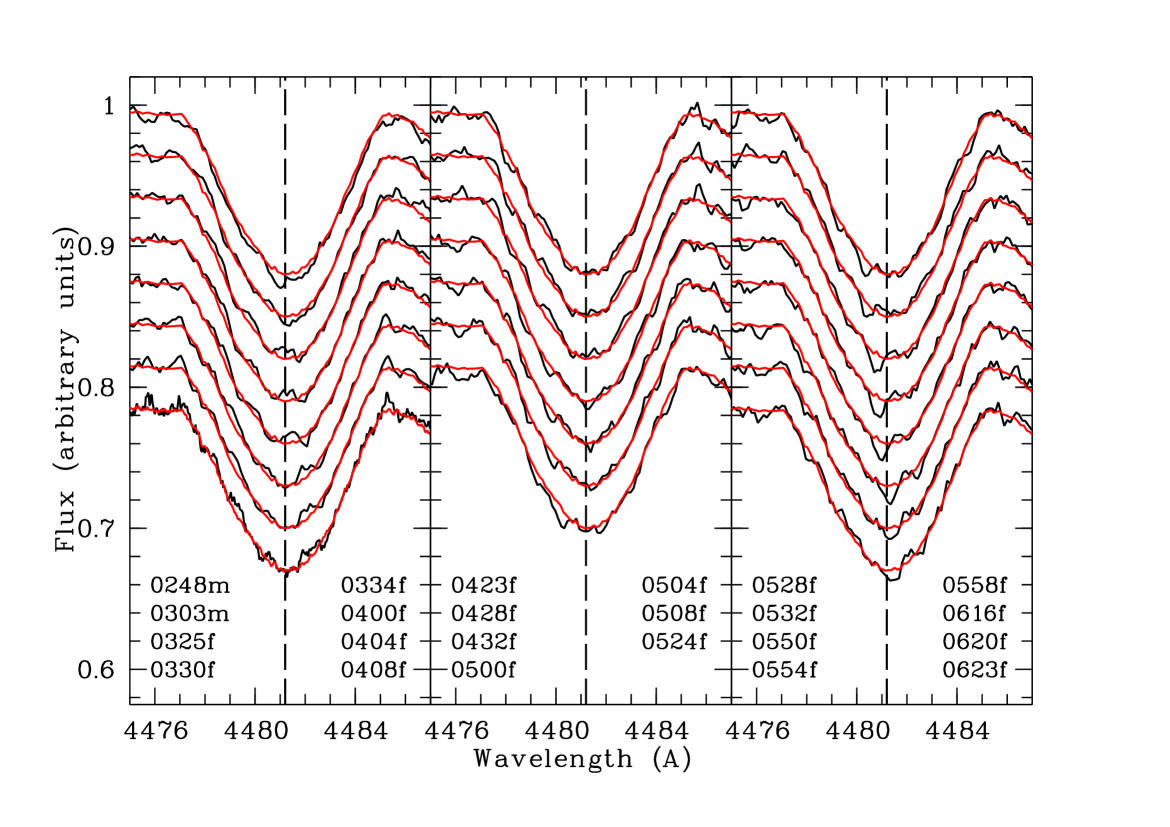
Figure 13: Profiles of the Mg ii 4481 Å line as observed with HERMES and FEROS during the night of 2017-04-01/02 along 9:30 hours. All spectra have been rebinned to 0.12 Å/pixel, and the median of the night is plotted in red superimposed on each spectrum. Spectra with “m” in the labels refer to those obtained with HERMES and those with “f” to FEROS. Labels correspond to spectra from top to bottom and then the two columns from left to right.
Appendix B Results: Non-photospheric lines
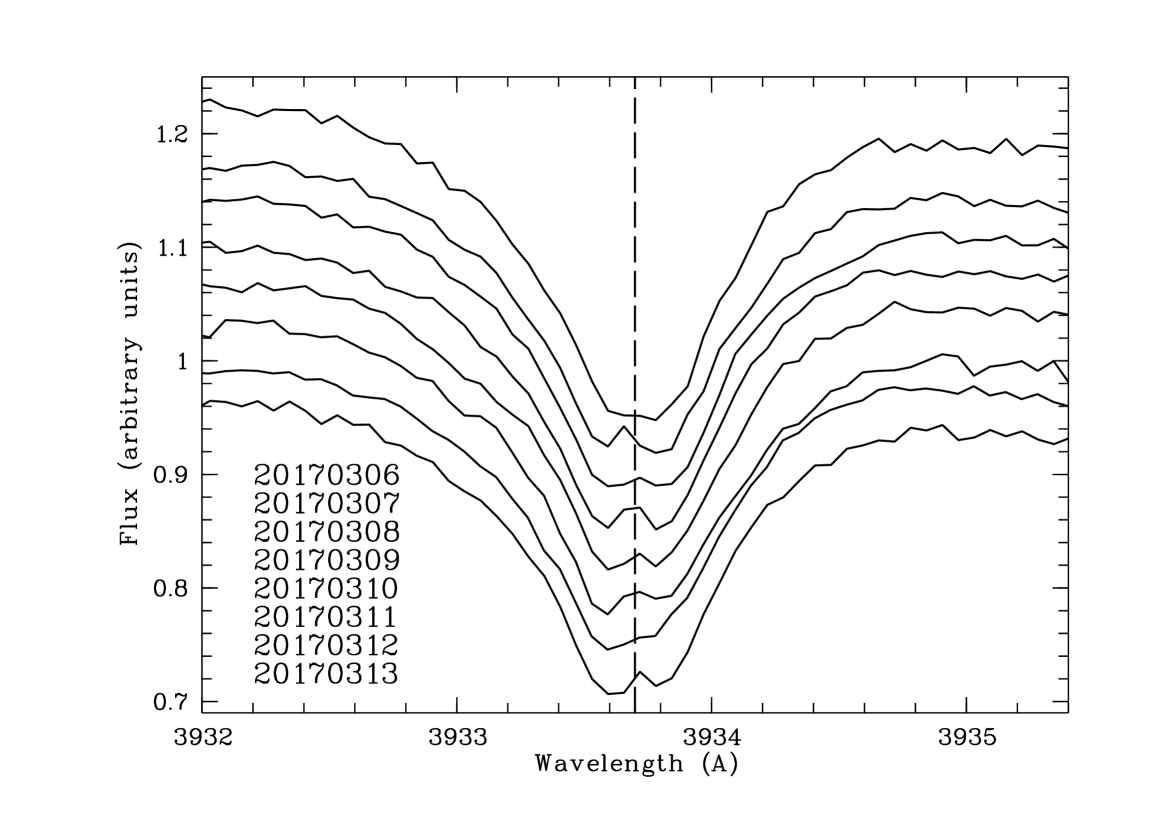
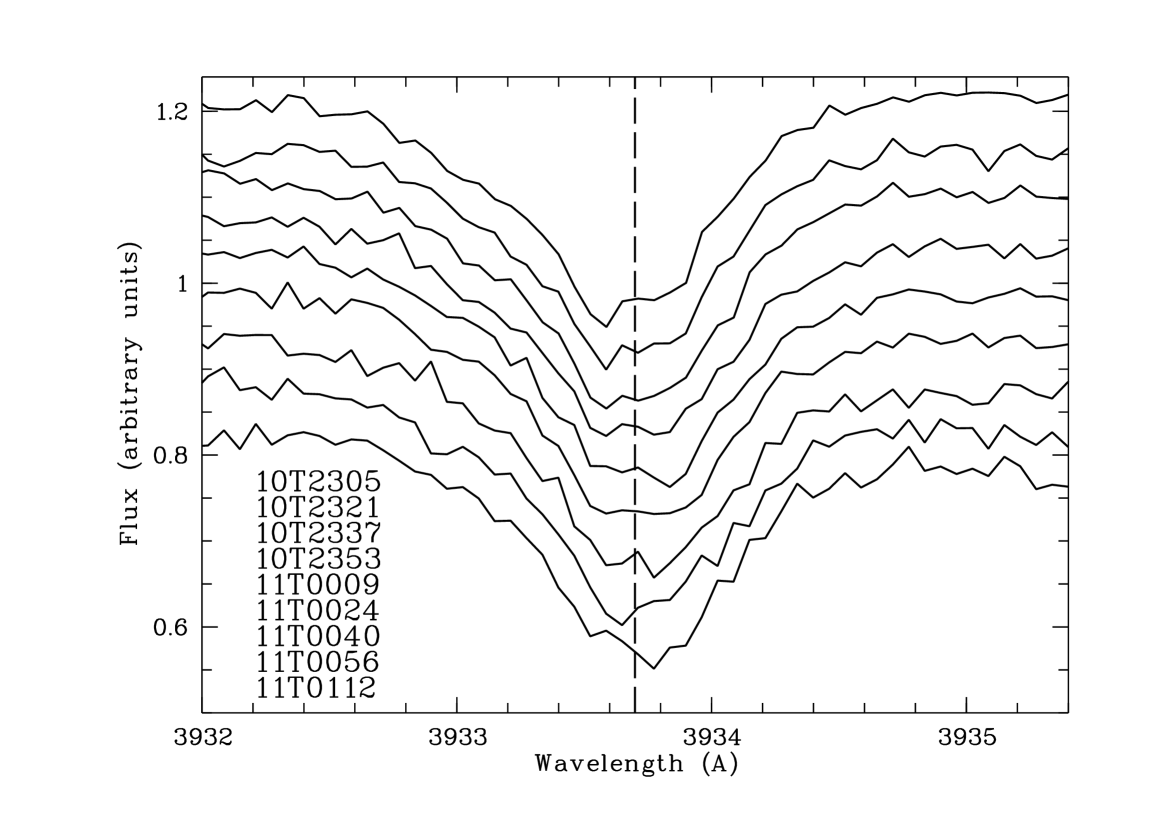
B.1 HERMES March 2017
During this period with HERMES spectra were taken along 8 consecutive nights. Fig. 14 shows the median spectra corresponding to each night of Ca ii K and Fe ii 5169 Å, as well as the spectra obtained during the night 2017-03-10. Variability is observed in a daily basis and in consecutive spectra of a single night. Note that the changes of Ca ii and Fe ii are different, and that the 3 km/s emission is not distinguishable in some spectra.
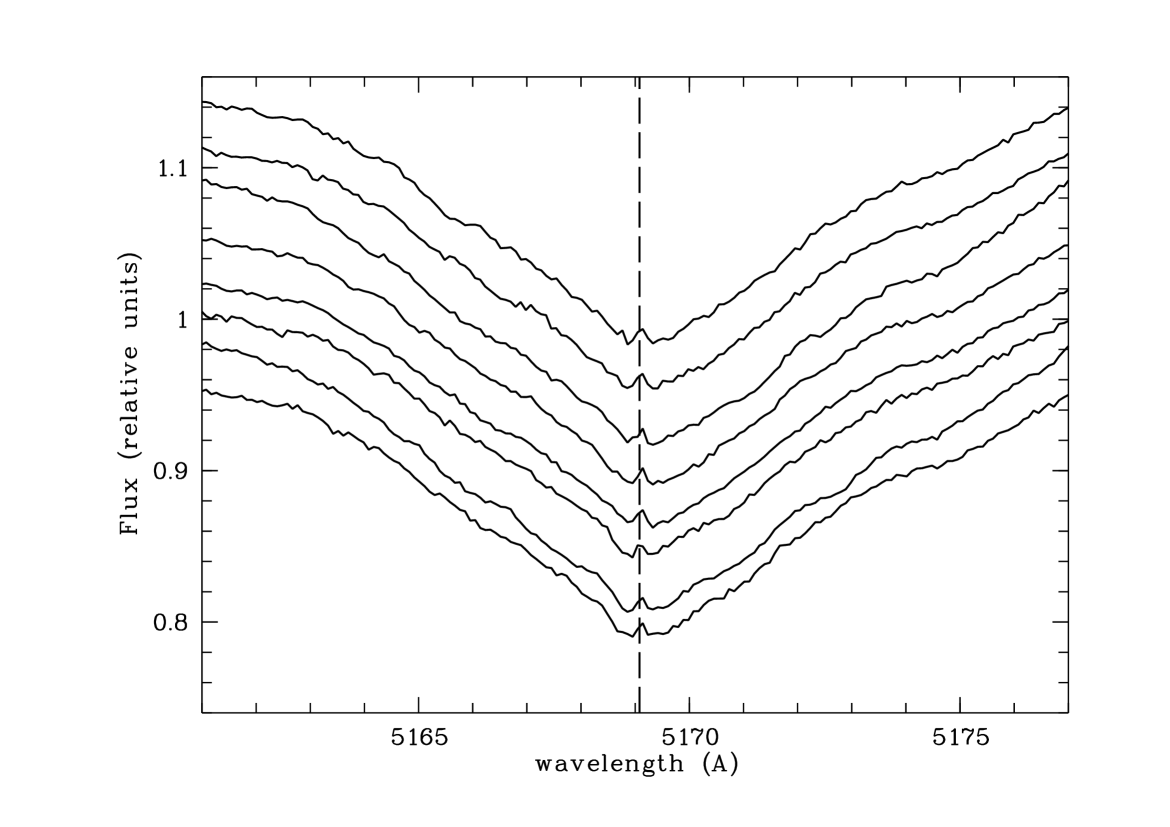
B.2 FEROS 2017 April
During this period spectra were taken along 9 consecutive nights with FEROS. Fig. 15 shows the median spectra of all nigths corresponding to Ti ii 3759 and 3761 Å, Ca ii K, and Fe ii 5169 Å. We note that the 3 km/s emission is observed in all nights and that the variations are different from line to line.
Appendix C Observing Log
Table C.1 is published is only available in electronic form at the CDS via anonymous ftp to cdsarc.u-strasbg.fr (130.79.128.5) or via http://cdsweb.u-strasbg.fr/cgi-bin/qcat?J/A+A/