Cooling Models for the Most Massive White Dwarfs
Abstract
We present a set of ultramassive white dwarf models, focused on masses above . Given the uncertainties about the formation and compositions of such objects, we construct parameterized model sequences, guided by evolutionary calculations including both single star and double white dwarf merger formation channels. We demonstrate that the cooling of objects with central densities in excess of is dominated by neutrino cooling via the Urca process in the first Myr after formation. Our models indicate that the recently discovered ultramassive white dwarf ZTF J190132.9+145808.7 is likely to have experienced this Urca-dominated cooling regime. We also show that the high densities imply that diffusion is unlikely to significantly alter the core compositions of these objects before they crystallize.
1 Overview
The most massive white dwarfs (WDs) represent extremes of stellar evolution. If created directly though the formation of a massive degenerate core (whether in a single star or in a binary), they represent the final fate of stars just below the mass where supernova explosions occur (e.g., Miyaji et al., 1980; Tauris et al., 2015; Doherty et al., 2017). Alternatively, such a massive WD may be created through the coalescence of two lower mass WDs and so its properties reflect the merger process and its aftermath (e.g., Schwab, 2021).
As our sample of nearby WDs becomes increasing complete, thanks in large part to Gaia (Gaia Collaboration et al., 2018; Gentile Fusillo et al., 2019), a significant number of white dwarfs with masses are being revealed and better described. These include long-studied objects like GD 50 (Bergeron et al., 1991; Gagné et al., 2018) and RE J0317-853 (Barstow et al., 1995; Ferrario et al., 1997; Külebi et al., 2010) as well more recently characterized objects like WD J183202.83+085636.24 (Pshirkov et al., 2020) and ZTF J190132.9+145808.7 (Caiazzo et al., 2021). In their analysis of the 100 pc sample from the Montreal White Dwarf Database, Kilic et al. (2021) identify 25 WDs with masses (assuming H atmospheres and C/O cores).
The core composition of ultramassive WDs is usually assumed to be O/Ne, as is found in typical single star stellar evolution calculations. However, this has begun to be questioned as the observed WD population on the Q-branch appears to align with the location of C/O crystallization well out into the ultramassive WD regime (Cheng et al., 2019; Tremblay et al., 2019; Bauer et al., 2020; Camisassa et al., 2021). There are also theoretical suggestions that carbon burning can fail to reach the center (e.g., Denissenkov et al., 2013) or that effects of rotation and mass loss can lead models to avoid carbon ignition entirely (Althaus et al., 2021).
Given their uncertain formation pathways and limitations on the input physics (e.g., equation of state, atmosphere tables), detailed WD cooling studies often do not consider masses (e.g., Camisassa et al., 2019; Bauer et al., 2020; Bédard et al., 2020). Evolving the highest mass models also requires including additional physical effects. In WDs with masses and correspondingly densities , neutrino cooling through the Urca process (Gamow & Schoenberg, 1941) can outpace plasmon decay to become the dominant neutrino cooling process (Tsuruta & Cameron, 1970).
2 Methods
We use the stellar evolution code Modules for Experiments in Stellar Astrophysics (MESA; Paxton et al., 2011, 2013, 2015, 2018, 2019) to generate and evolve our WD models. Our input and output files are publicly accessible at https://doi.org/10.5281/zenodo.5047378.
MESA solves the stellar structure equations under the assumption of Newtonian gravity. For these massive WDs, general relativistic (GR) corrections begin to enter (i.e., ). This will lead to a small differences between the models presented here and ones that solve the Tolman-Oppenheimer-Volkoff equation. The cold WD models from F.X. Timmes111http://cococubed.asu.edu/code_pages/coldwd.shtml provide a rough guide to the magnitude of these differences. At a fixed central density of () models with GR are () less massive than those without GR. In both cases, the radii are the same to within 3 km. Therefore, masses effectively inferred from the radii of our models may be systematically high by .
2.1 Parameterized white dwarf models
Generating a large set of ultramassive WD models of varying core compositions through self-consistent evolutionary calculations is beset with difficulties. This requires following models through the challenging thermally-pulsing asymptotic giant branch and affords only indirect control of the WD mass and core composition. Given the uncertainties in the formation pathways, we want to create models with both C/O and O/Ne core compositions.
Therefore, we generate a set of parameterized WD models with masses 1.29-1.36 (with a spacing of 0.01 ) using the MESA wd_builder capability.222Available in mesa-contrib: https://github.com/MESAHub/mesa-contrib/ This feature provides an alternate initial model builder that creates a WD of a given mass and chemical composition. Our models assume initially homogeneous chemical compositions in the core. The initial thermal structure is approximated as a degenerate isothermal core with a temperature K and a radiative envelope. The initial model is not in thermal equilibrium and so there is an initial transient phase lasting for roughly the conduction timescale of the core ( yr) that should be disregarded.
We pick our detailed initial core compositions by running representative single star calculations at solar composition (; Grevesse & Sauval, 1998) in MESA r15140. Our C/O core composition is based on the averaged core composition of an C/O WD evolved from a single star using the test suite case make_co_wd and the nuclear network mesa_49.net. Our O/Ne core composition is based on the averaged core composition of the degenerate core of an single star halted at its first thermal pulse. This calculation used the nuclear network sagb_NeNa_MgAl.net.
| Isotope | C/O models | O/Ne models | Merger model | |
|---|---|---|---|---|
| 0\@alignment@align.37 | 0.0067 | 0\@alignment@align.0018 | ||
| 0\@alignment@align.61 | 0.57 | 0\@alignment@align.44 | ||
| 0\@alignment@align.0022 | 0.32 | 0\@alignment@align.45 | ||
| 0\@alignment@align.016 | 0.014 | 0\@alignment@align.0022 | ||
| 0\@alignment@align.00025 | 0.060 | 0\@alignment@align.030 | ||
| 0\@alignment@align.00052 | 0.026 | 0\@alignment@align.050 | ||
| 0\@alignment@align.00030 | 0.0012 | 0\@alignment@align.015 | ||
| 0\@alignment@align | 0.0028 | 0\@alignment@align.0068 | ||
The nuclear networks used in the single star models were chosen to cover the main hydrogen, helium, and carbon burning phases. However, we need not retain all of these isotopes during the WD cooling calculations. For simplicity, our WD models will only consider the most abundant isotopes // and the key neutron rich isotopes that sediment and/or participate in the Urca process. Table 1 shows the isotopes and abundances that define the composition of our C/O and O/Ne WD cooling models. On top of a homogeneous core, all our models have an added He layer of and no H layer.
2.2 Evolutionary merger model
As a point of comparison for the compositions used in cooling models, we generate a double WD merger model following Schwab (2021). Reflecting the simplified compositions and nuclear networks adopted in hydrodynamical merger calculations, that work considered merger models with uniform initial compositions of 40 per cent and 60 per cent by mass and followed the evolution using an -chain nuclear network. Here, we improve upon that by beginning with a more detailed composition and using a larger nuclear network.
We first generate a model of an typical C/O WD evolved from a single star with a solar composition (; Grevesse & Sauval, 1998) using the test suite case make_co_wd in MESA r15140 and the nuclear network mesa_49.net.
We continue to follow the assumption of a uniform initial condition, neglecting possible variation in composition between the primary and secondary WD. The fate of the WD surface H/He layers is uncertain during the initial mass transfer and merger process. Because we are eliding the merger itself, we have no information about how much H/He survives and where it is located. Therefore, we make the simplifying choice to average core composition (excluding the H and He rich outer layers) of the C/O WD and use this as the uniform initial composition for the merger model.
To follow the nuclear burning (primarily carbon burning) that occurs in the merger, we adopt the nuclear network mesa_49.net, which covers carbon burning and includes the neutron-rich isotopes and . As our example, we generate and evolve a merger model. For masses the occurrence of Ne-burning means that our merger models no longer produce O/Ne WDs. Therefore, this represents approximately the most massive WD that we can make within this framework. We include a small amount of mass loss, which is necessary to allow MESA to evolve the model onto the cooling track, and this means the resulting WD model is .
The rightmost column of Table 1 shows its composition. Relative to the single star O/Ne composition, the O/Ne ratio in the merger is more rich. The total amount of neutron-rich isotopes is similar, though the distribution is different, with less and more in the merger model. Given its overall similarity to the O/Ne composition from Section 2.1, we do not generate and cool a separate set of parameterized models to represent mergers.
2.3 White Dwarf Cooling
We cool our WD models using the MESA development version (commit 5e701e79). This allows us to take advantage of the Skye equation of state (EOS) (Jermyn et al., 2021). This free-energy-based EOS self-consistently determines the location of the liquid/solid phase transition and the accompanying latent heat release in multicomponent plasmas. MESA and Skye do not currently include phase separation, so the solid and liquid compositions are assumed to be the same. All isotopes listed in Table 1 have sufficiently large mass fractions that they are included in the Skye EOS calculation. Regions with partial ionization are covered by the FreeEOS (Irwin, 2004) and SCVH (Saumon et al., 1995) EOSes.
We include the effects of diffusion via the approach described in Paxton et al. (2018) and using the diffusion coefficients of Stanton & Murillo (2016). All isotopes included in the nuclear network diffuse and, following the approach in Bauer et al. (2020), all isotopes contribute to the sedimentation heating.
During the cooling phase, the nuclear network includes only the electron captures and beta decays linking the -, -, and - Urca pairs. Doing so ignores the possibility of pyconuclear fusion of (e.g., Yakovlev et al., 2006), which could occur in the highest mass models that reach . We use the on-the-fly weak reaction framework described in Schwab et al. (2015) and Paxton et al. (2015) as this approach continues to provide accurate rates at temperatures below K where interpolation in published tables can lead to undercooling artifacts (see Appendix D in Schwab et al., 2017). Thermal neutrino loss rates are from Itoh et al. (1996), except for plasmon neutrinos where we use the more accurate rates from Kantor & Gusakov (2007).
We use the conductive opacities of Cassisi et al. (2007), supplemented by the Blouin et al. (2020) revisions for H and He. Radiative opacities are from OPAL (Iglesias & Rogers, 1993, 1996). However, conditions are often off these tables, and in that circumstance the radiative opacity values are extrapolated from the table boundaries at constant temperature.333 The OPAL tables used in MESA are tabulated as functions of and . The relevant (high-) edge of the tables occurs at = 1. For conditions corresponding to , MESA uses the radiative opacity from the OPAL table at the input value of and . This radiative opacity is then combined with the conductive opacity in the usual way. See Section 4.3 and Figures 2 & 3 in Paxton et al. (2011). When the conductive opacity dominates (i.e., is smaller than the radiative opacity), this does not significantly affect the total opacity. But as helium becomes neutral and the radiative opacity falls, the lack of appropriate opacity tables becomes more problematic. Therefore, we stop our models when they reach K.
We use the MESA ML2 (Bohm & Cassinelli, 1971) version of mixing length theory (MLT), with a mixing length . We completely deactivate MLT in solid material. We also suppress chemical mixing due to convection while continuing to allow convection to transport energy (change the temperature gradient). The Urca-process cooling leads to a superadiabatic temperature gradient between the Urca shell444The neutrino emissivity associated with the Urca process peaks over a narrow range in density (e.g., Paczyński, 1973) and hence the region of significant cooling is typically a spherical shell. This is centered at the threshold density of the Urca pair, where the electron chemical potential is equal to the difference between the chemical potentials of the mother and daughter ions, and its width depends on the temperature. In this region, the equilibrium composition has significant abundances of both species, thereby allowing for repeated electron capture and beta decay and the corresponding neutrino production. and the uncooled material at higher densities (and hence produces a convective region). If convective mixing is allowed to transport material across the Urca shell, MESA experiences both physical and numerical difficulties. These have their origins in an MLT treatment that allows convection to instantaneously switch on/off and which does not account for the interactions of convection with the Urca shell (e.g., Bisnovatyi-Kogan, 2001). Our inability to accurately model this process introduces some uncertainties in our cooling rates, but when mixing is allowed to drive the composition further from its weak equilibrium, even more rapid neutrino cooling will result. Therefore, our choice to suppress this mixing should not lead us to overestimate the importance of the Urca cooling effect.
The suppressed mixing also includes the surface layers, so even as the convection zone deepens, the surface remains pure He. While unrealistic, this has two advantages. First, the outer layers of our models are not self-consistently generated, so their detailed structure (e.g., thickness of He envelope, composition of layers that would be created during the elided thermal pulses) seems unlikely to be reliable. Second, not allowing the surface to become polluted by mixed up material (primarily ) simplifies the application of the outer boundary condition by not requiring radiative opacities for metal-rich mixtures. Because our most massive WD models have and so are are off the DB WD atmosphere tables included in MESA, we use an Eddington grey atmosphere. Again, we halt our models when they reach K, reflecting our lack of appropriate radiative opacities for cool He and that appropriate atmosphere tables would become increasingly important at lower effective temperature.
To demonstrate that our WD cooling models are reasonable, we compare to some of the most massive models in the literature. We do not attempt to match WD properties or input physics assumptions, so these comparisons are not expected to yield precise agreement.
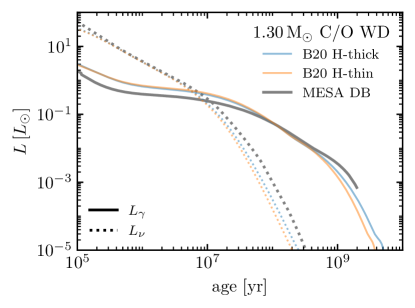
Figure 1 compares to the most massive C/O core model of Bédard et al. (2020) which has a mass of . The He layer in this model has a fractional mass and there is both a thin H layer model () and a thick H-layer model . The interior composition of the Bédard et al. (2020) is 50/50 C/O, resulting in a higher specific heat then our roughly 40/60 C/O models. Agreement is qualitatively good, always within a factor of in luminosity at constant age.
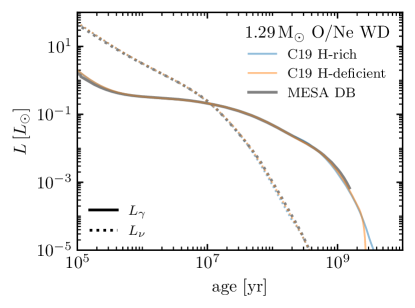
Figure 2 compares to the most massive O/Ne core model of Camisassa et al. (2019) which has a mass of 1.29 . The mass of the He layer in this model is and there is both a H-deficient model and (no H layer) and a H-rich model ( H layer). The core chemical composition of our models are in rough agreement. We do not include energy from phase separation upon crystallization. Agreement is quantitatively good with agreement to within the line width ( %) persisting out until ages of about 1 Gyr.
The agreement between the cooling tracks from Bédard et al. (2020) and Camisassa et al. (2019) with varied envelope properties shown in Figures 1 and 2 also serve to illustrate that surface composition (and use of atmosphere tables for the outer boundary condition) has a relatively minor effect until later times ( Gyr), beyond the time of primary interest in our study.
3 Results
Tsuruta & Cameron (1970) used a WD model to show that Urca-process cooling is the dominant neutrino cooling mechanism for . For the - Urca pair to operate, the central density of the WD must be above the threshold density . At these densities and temperatures the dominant non-nuclear neutrino cooling processes is plasmon decay, followed by electron-ion bremsstrahlung (e.g., Winget et al., 2004). The dominance of plasmon neutrinos motivated our choice to override the MESA default rates from Itoh et al. (1996) with the more accurate rates from Kantor & Gusakov (2007). The rate of Urca-process neutrino cooling scales linearly with the mass fraction of the Urca pair and so the Urca process will be more important in O/Ne WDs than C/O WDs because of their greater - and - abundances.
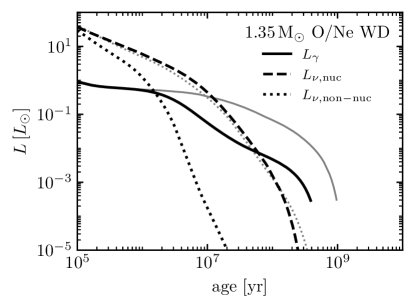
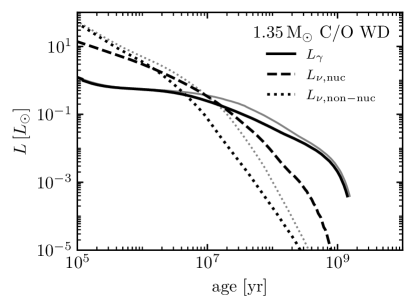
Figure 3 compares the luminosity evolution of a O/Ne WD with and without the inclusion of Urca-process neutrino cooling. The model with Urca-process cooling experiences a significant drop in luminosity around 10 Myr and beyond that point is roughly a factor of ten less luminous at constant age, reaching our K stopping condition in about half the total time ( Myr less). The dashed black line shows the Urca neutrino cooling rate, which is always greater than the non-nuclear neutrino cooling rate shown by the black dotted line. Because this additional cooling leads to a lower temperature, it reduces the loss rates through the other non-nuclear mechanisms, and as such becomes the new dominant source rather than acting as an additional source in an additive manner. Thus comparing to the calculation without Urca-process cooling—its non-nuclear neutrino loss rate is shown by the dotted grey line—we see that the total neutrino cooling rate is less dramatically different between the calculations, though still altered enough to yield a significant change in the cooling.
Figure 4 compares the luminosity evolution of a C/O WD. The lower Urca pair abundances lead to a less dramatic effect, with the luminosity lower by a factor of at constant age between 10 and 100 Myr. The overall difference in the cooling time to reach the K stopping condition is Myr.
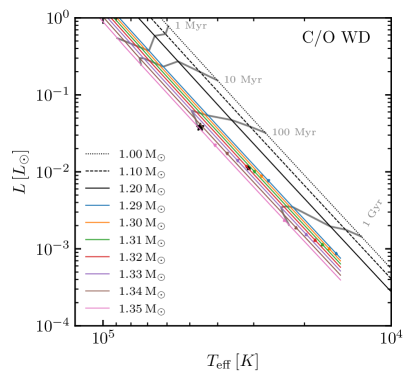
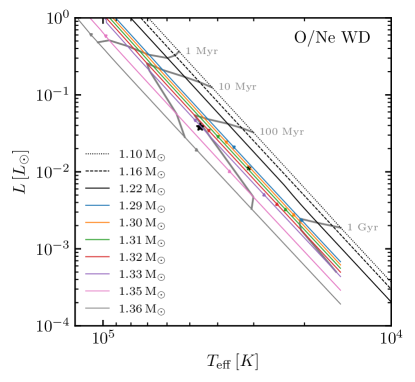
Figure 5 shows HR diagrams for our C/O WD (left panel) and O/Ne WD (right panel) cooling sequences. The triangles on the cooling tracks mark the interval when the core is crystallizing (starting when 10 % of the mass is solid and ending when 90 % of the mass is solid). Driven by the higher interior densities, higher mass WDs crystallize at younger ages and higher luminosities than lower mass WDs. As an example, the C/O WD begins crystallizing at cooling age Myr and finishes around Gyr. Reflecting their higher charge, the O/Ne WD begins crystallizing at cooling age Myr and finishes around Gyr.
At the masses where Urca cooling becomes active (), the acceleration in the cooling is apparent in the downward bend of the isochrones. In the case of the C/O WDs, the luminosities at which crystallization occurs smoothly continues its trend, but for the O/Ne WDs, crystallization begins to occur at cooling ages below 1 Myr. This happens because of the strong cooling at the location of the Urca shell and the continued outward transport of heat from regions interior to the shell. This results in the rapid cooling and crystallization of the material interior to the Urca shell.
The timing and physical extent of crystallization has important implications for the cooling of WD models. In addition to controlling when the latent heat of the phase transition is released, once material becomes solid, the gravitational potential energy stored in neutron-rich isotopes can no longer be released through their preferential transport towards the center. Realizing a scenario where a massive WD is meta-stable and will exceed its effective Chandrasekhar mass due to sedimentation, such as is speculated by Caiazzo et al. (2021) for ZTF J190132.9+145808.7, requires rapid and near-complete sedimentation.
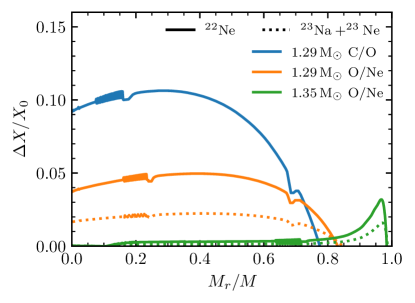
Figure 6 shows the relative change in the neutron rich abundances realized in the WD interiors due to gravitational sedimentation. This is the difference between the chemically homogeneous initial condition and the chemical profile when the model reaches the termination condition. At that time the models are nearly completely crystallized, with the 1.29 C/O WD, 1.29 O/Ne WD, and 1.35 O/Ne WD models respectively having only , , and of non-solid material. At 1.29 the C/O WD shows a larger change than the O/Ne WD, primarily reflecting its longer time to crystallization. The 1.35 O/Ne shows almost no sedimentation in the interior, reflecting its rapid crystallization due to Urca-process cooling.
Cheng et al. (2019) report a population of ultramassive WDs on the Q-branch that experience multi-Gyr cooling delays (relative to both current models and other observed WDs). If explained by energy release from sedimentation of neutron-rich isotopes, this requires that effective diffusion coefficients for these species are significantly increased over the single-particle results. As discussed in Bauer et al. (2020), the Stanton & Murillo (2016) diffusion coefficients are in agreement at the factor of level with the molecular dynamics results of Hughto et al. (2010), and so this can not be easily explained as a theoretical uncertainty in the single-particle diffusion coefficients. This led Bauer et al. (2020) to suggest that the formation of clusters might accelerate sedimentation. However, Caplan et al. (2020) suggest such clusters are not stable. The enhancements invoked by Bauer et al. (2020) would still be far below those necessary to achieve near-complete sedimentation.
Very recently, Blouin et al. (2021) calculated detailed phase curves for C/O/Ne mixtures and suggested that a phase-separation-driven “distillation” process can occur. Because this process occurs though buoyant rising of -deficient solid crystals, the net inward transport of neutron-rich material is not limited by the rate of single-particle diffusion. The transport will eventually halt once the core composition reaches a point where there is no more phase separation and then the core solidifies.555This threshold will depend on the detailed phase diagram but for C/O/Ne, Blouin et al. (2021) find this is a number fraction of 20%. Future work should investigate the role of phase separation in the most massive WDs.
4 Conclusions
We present models of WDs with masses and with C/O or O/Ne cores. Our models are in good agreement with existing models from Bédard et al. (2020) and Camisassa et al. (2019) at masses . We include the results of Urca-process neutrino cooling and demonstrate the significant acceleration of cooling that occurs at masses above , especially for O/Ne cores.
As an example, we apply our models to ZTF J190132.9+145808.7 (Caiazzo et al., 2021). This WD is measured to have and radius . Those parameters are closely matched by our O/Ne WD model, which has and a radius of at a cooling age of 70 Myr. (For a C/O core composition, our models approximately match the best fit parameters at mass of and a cooling age of 110 Myr.) As can be seen in the isochrones shown in Figure 5, the best fit parameters place ZTF J190132.9+145808.7 in a region where neutrinos produced through the Urca process have accelerated the cooling of the WD.
References
- Althaus et al. (2021) Althaus, L. G., Pons, P. G., Córsico, A. H., et al. 2021, A&A, 646, A30, doi: 10.1051/0004-6361/202038930
- Barstow et al. (1995) Barstow, M. A., Jordan, S., O’Donoghue, D., et al. 1995, MNRAS, 277, 971, doi: 10.1093/mnras/277.3.971
- Bauer et al. (2020) Bauer, E. B., Schwab, J., Bildsten, L., & Cheng, S. 2020, ApJ, 902, 93, doi: 10.3847/1538-4357/abb5a5
- Bédard et al. (2020) Bédard, A., Bergeron, P., Brassard, P., & Fontaine, G. 2020, ApJ, 901, 93, doi: 10.3847/1538-4357/abafbe
- Bergeron et al. (1991) Bergeron, P., Kidder, K. M., Holberg, J. B., et al. 1991, ApJ, 372, 267, doi: 10.1086/169972
- Bisnovatyi-Kogan (2001) Bisnovatyi-Kogan, G. S. 2001, MNRAS, 321, 315, doi: 10.1046/j.1365-8711.2001.04013.x
- Blouin et al. (2021) Blouin, S., Daligault, J., & Saumon, D. 2021, ApJ, 911, L5, doi: 10.3847/2041-8213/abf14b
- Blouin et al. (2020) Blouin, S., Shaffer, N. R., Saumon, D., & Starrett, C. E. 2020, ApJ, 899, 46, doi: 10.3847/1538-4357/ab9e75
- Bohm & Cassinelli (1971) Bohm, K. H., & Cassinelli, J. 1971, A&A, 12, 21
- Caiazzo et al. (2021) Caiazzo, I., Burdge, K. B., Fuller, J., et al. 2021, Nature, 595, 39, doi: 10.1038/s41586-021-03615-y
- Camisassa et al. (2021) Camisassa, M. E., Althaus, L. G., Torres, S., et al. 2021, A&A, 649, L7, doi: 10.1051/0004-6361/202140720
- Camisassa et al. (2019) Camisassa, M. E., Althaus, L. G., Córsico, A. H., et al. 2019, A&A, 625, A87, doi: 10.1051/0004-6361/201833822
- Caplan et al. (2020) Caplan, M. E., Horowitz, C. J., & Cumming, A. 2020, ApJ, 902, L44, doi: 10.3847/2041-8213/abbda0
- Cassisi et al. (2007) Cassisi, S., Potekhin, A. Y., Pietrinferni, A., Catelan, M., & Salaris, M. 2007, ApJ, 661, 1094, doi: 10.1086/516819
- Cheng et al. (2019) Cheng, S., Cummings, J. D., & Ménard, B. 2019, ApJ, 886, 100, doi: 10.3847/1538-4357/ab4989
- Denissenkov et al. (2013) Denissenkov, P. A., Herwig, F., Truran, J. W., & Paxton, B. 2013, ApJ, 772, 37, doi: 10.1088/0004-637X/772/1/37
- Doherty et al. (2017) Doherty, C. L., Gil-Pons, P., Siess, L., & Lattanzio, J. C. 2017, PASA, 34, e056, doi: 10.1017/pasa.2017.52
- Ferrario et al. (1997) Ferrario, L., Vennes, S., Wickramasinghe, D. T., Bailey, J. A., & Christian, D. J. 1997, MNRAS, 292, 205, doi: 10.1093/mnras/292.2.205
- Gagné et al. (2018) Gagné, J., Fontaine, G., Simon, A., & Faherty, J. K. 2018, ApJ, 861, L13, doi: 10.3847/2041-8213/aacdff
- Gaia Collaboration et al. (2018) Gaia Collaboration, Brown, A. G. A., Vallenari, A., et al. 2018, A&A, 616, A1, doi: 10.1051/0004-6361/201833051
- Gamow & Schoenberg (1941) Gamow, G., & Schoenberg, M. 1941, Physical Review, 59, 539, doi: 10.1103/PhysRev.59.539
- Gentile Fusillo et al. (2019) Gentile Fusillo, N. P., Tremblay, P.-E., Gänsicke, B. T., et al. 2019, MNRAS, 482, 4570, doi: 10.1093/mnras/sty3016
- Grevesse & Sauval (1998) Grevesse, N., & Sauval, A. J. 1998, Space Sci. Rev., 85, 161, doi: 10.1023/A:1005161325181
- Hughto et al. (2010) Hughto, J., Schneider, A. S., Horowitz, C. J., & Berry, D. K. 2010, Phys. Rev. E, 82, 066401, doi: 10.1103/PhysRevE.82.066401
- Iglesias & Rogers (1993) Iglesias, C. A., & Rogers, F. J. 1993, ApJ, 412, 752, doi: 10.1086/172958
- Iglesias & Rogers (1996) —. 1996, ApJ, 464, 943, doi: 10.1086/177381
- Irwin (2004) Irwin, A. W. 2004, The FreeEOS Code for Calculating the Equation of State for Stellar Interiors. http://freeeos.sourceforge.net/
- Itoh et al. (1996) Itoh, N., Hayashi, H., Nishikawa, A., & Kohyama, Y. 1996, ApJS, 102, 411, doi: 10.1086/192264
- Jermyn et al. (2021) Jermyn, A. S., Schwab, J., Bauer, E., Timmes, F. X., & Potekhin, A. Y. 2021, ApJ, 913, 72, doi: 10.3847/1538-4357/abf48e
- Kantor & Gusakov (2007) Kantor, E. M., & Gusakov, M. E. 2007, MNRAS, 381, 1702, doi: 10.1111/j.1365-2966.2007.12342.x
- Kilic et al. (2021) Kilic, M., Bergeron, P., Blouin, S., & Bédard, A. 2021, MNRAS, 503, 5397, doi: 10.1093/mnras/stab767
- Külebi et al. (2010) Külebi, B., Jordan, S., Nelan, E., Bastian, U., & Altmann, M. 2010, A&A, 524, A36, doi: 10.1051/0004-6361/201015237
- Miyaji et al. (1980) Miyaji, S., Nomoto, K., Yokoi, K., & Sugimoto, D. 1980, PASJ, 32, 303
- Paczyński (1973) Paczyński, B. 1973, Acta Astron., 23, 1
- Paxton et al. (2011) Paxton, B., Bildsten, L., Dotter, A., et al. 2011, ApJS, 192, 3, doi: 10.1088/0067-0049/192/1/3
- Paxton et al. (2013) Paxton, B., Cantiello, M., Arras, P., et al. 2013, ApJS, 208, 4, doi: 10.1088/0067-0049/208/1/4
- Paxton et al. (2015) Paxton, B., Marchant, P., Schwab, J., et al. 2015, ApJS, 220, 15, doi: 10.1088/0067-0049/220/1/15
- Paxton et al. (2018) Paxton, B., Schwab, J., Bauer, E. B., et al. 2018, ApJS, 234, 34, doi: 10.3847/1538-4365/aaa5a8
- Paxton et al. (2019) Paxton, B., Smolec, R., Schwab, J., et al. 2019, ApJS, 243, 10, doi: 10.3847/1538-4365/ab2241
- Pshirkov et al. (2020) Pshirkov, M. S., Dodin, A. V., Belinski, A. A., et al. 2020, MNRAS, 499, L21, doi: 10.1093/mnrasl/slaa149
- Saumon et al. (1995) Saumon, D., Chabrier, G., & van Horn, H. M. 1995, ApJS, 99, 713, doi: 10.1086/192204
- Schwab (2021) Schwab, J. 2021, ApJ, 906, 53, doi: 10.3847/1538-4357/abc87e
- Schwab et al. (2017) Schwab, J., Bildsten, L., & Quataert, E. 2017, MNRAS, 472, 3390, doi: 10.1093/mnras/stx2169
- Schwab et al. (2015) Schwab, J., Quataert, E., & Bildsten, L. 2015, MNRAS, 453, 1910, doi: 10.1093/mnras/stv1804
- Stanton & Murillo (2016) Stanton, L. G., & Murillo, M. S. 2016, Phys. Rev. E, 93, 043203, doi: 10.1103/PhysRevE.93.043203
- Tauris et al. (2015) Tauris, T. M., Langer, N., & Podsiadlowski, P. 2015, MNRAS, 451, 2123, doi: 10.1093/mnras/stv990
- Tremblay et al. (2019) Tremblay, P.-E., Fontaine, G., Fusillo, N. P. G., et al. 2019, Nature, 565, 202, doi: 10.1038/s41586-018-0791-x
- Tsuruta & Cameron (1970) Tsuruta, S., & Cameron, A. G. W. 1970, Ap&SS, 7, 374, doi: 10.1007/BF00653278
- Winget et al. (2004) Winget, D. E., Sullivan, D. J., Metcalfe, T. S., Kawaler, S. D., & Montgomery, M. H. 2004, ApJ, 602, L109, doi: 10.1086/382591
- Yakovlev et al. (2006) Yakovlev, D. G., Gasques, L. R., Afanasjev, A. V., Beard, M., & Wiescher, M. 2006, Phys. Rev. C, 74, 035803, doi: 10.1103/PhysRevC.74.035803