The Power of Word-Frequency Based Alignment-Free Functions: a Comprehensive Large-scale Experimental Analysis - Version 3
Abstract
Motivation: Alignment-free (AF) distance/similarity functions are a key tool for sequence analysis. Experimental studies on real datasets abound and, to some extent, there are also studies regarding their control of false positive rate (Type I error). However, assessment of their power, i.e., their ability to identify true similarity, has been limited to some members of the family by experimental studies on short sequences, not adequate for current applications, where sequence lengths may vary considerably. Such a State of the Art is methodologically problematic, since information regarding a key feature such as power is either missing or limited.
Results: By concentrating on a representative set of word-frequency based AF functions, we perform the first coherent and uniform evaluation of the power, involving also Type I error for completeness. Two Alternative models of important genomic features (CIS Regulatory Modules and Horizontal Gene Transfer), a wide range of sequence lengths from a few thousand to millions, and different values of have been used. As a result, we provide a characterization of those AF functions that is novel and informative. Indeed, we identify weak and strong points of each function considered, which may be used as a guide to choose one for analysis tasks. Remarkably, of the fifteen functions that we have considered, only four stand out, with small differences between small and short sequence length scenarios. Finally, in order to encourage the use of our methodology for validation of future AF functions, the Big Data platform supporting it is public.
1 Introduction
Alignment-free distance/similarity functions (AF functions, for short) provide an alternative approach to traditional sequence alignment methods, e.g., [1, 16], for determining how distant/close two sequences are. Their advantages/disadvantages with respect to alignment methods are well presented in [22].
Although AF functions have a long and established history [20] and their use has been widely investigated for sequence analysis in genomics [19, 22], metagenomics [2], and epigenomics [5, 6], only recently a comprehensive experimental study on benchmark and real datasets has appeared in the Literature [22]. It has been followed by another study (as an application of the Big Data platform FADE [4]), in which Type I error control i.e, the ability to control the number of false positives, has been evaluated for some prominent AF functions on the same real datasets.
However, for a full assessment of the “value” of an AF function, its power, i.e, its ability to identify true positives, must also be estimated. Unfortunately, those studies are scarce and confined to the family or its variants. This is an important pitfall of the methodology regarding AF functions as when the AF measure is not able to recognize a true similarity (because of poor statistical power), it will inevitably lead to a biased result in applications, with the user not even being aware of where the problem may lie. Therefore, although our study follows in terms of time more “application oriented benchmarkings”, methodologically it is a much needed prerequisite to them.
We recall that Power estimation has been investigated theoretically in [21] and experimentally, exclusively [8, 15] or mostly [11], on synthetic datasets. Indeed, as opposed to Type I error control studies, power studies are less amenable to being performed on real datasets, where they may provide inaccurate results, as reported in [11]. Therefore, in agreement with the indications of that study, we resort to use simulated datasets. It is to be highlighted that there is also a subtle connection between power and Type I error control. Indeed, a high power may be determined by a poor Type I error control. As a consequence, although Type I error control studies for AF functions are now available on benchmark real datasets [4], here we repeat them on synthetic datasets for completeness. We also adhere to the ground-breaking methodology proposed in [15]. In particular, we use two models of “biologically relevant ” similarity, one resulting from the process of horizontal gene transfer and the other resulting from the process of acquiring common CIS regulatory elements [8, 11, 15]. The first is referred to as Alternative model Pattern Transfer and the second as Motif Replace.
We consider two scenarios: short sequences (length up to the thousands, recalling the similarity of gene sequencing) and long sequences (length up to the millions, recalling the similarity of genome contigs). This gives rise to a range of experiments much broader than those of [11, 15]. The corresponding analysis provides the first extensive study of the power of AF functions, by concentrating on word-frequency based ones [13]. They use -mer statistics, and our choice is due to their simplicity, effectiveness and widespread use, as documented by a recent benchmarking study [22]. We have chosen the best performing word-frequency based AF functions according to the mentioned benchmarking, representatives of all types of AF functions described in [13]. We exclude from our study those AF functions that are based only on the presence/absence of words, e.g. Jaccard and its approximation Mash [14], (see Supplementary File in [12] for definitions) since the experimental plan by Reinert et al., and used here, turns out not to be fully adequate to study these functions as for the values of recommended in the mentioned study, their dictionary includes all possible k-mers. Our results are as follows.
-
•
Word-frequency based AF functions assure a good Type I error control. That is, in a “neutral environment” where we compare randomly generated pairs of sequences, the functions are difficult to fool, i.e. they found significant similarity pairs close to the expected proportion given by the intrinsic uncertainty of the statistical test As shown by [4], when using real datasets, Type I error control is more heterogeneous across AF functions.
-
•
Our power studies provide a novel classification of word-frequency based AF functions much more informative than the standard taxonomic one, i.e, the one provided in [13] (see also [3]). Briefly, we identify a handful of functions that stand out in terms of performance and we advance the knowledge regarding the power of the prominent and much studied family in relation to the two Alternative models.
-
•
Our results indicate that the heuristic law commonly used for the selection of , i.e., as the logarithm of sequence lengths, is generally not appropriate. In fact, for Type I error control, the choice of seems to be marginal for a good performance, while it has a complex relation with Alternative model, sequence length and function. Differently from other studies, our work provides a guideline regarding the most appropriate choice of which is very much dependent on the function and its parameters.
-
•
In order to encourage the use of our methodology for future benchmarking, we provide a new computational framework based on a succinct data structures Big data Platform, namely FADE [4], which guarantees the reproducibility of the entire methodology and can be further extended with user-provided functions.
2 Methods
2.1 Distance Functions
The word-frequency based AF functions chosen for this study are summarized in Section 1 of the Supplementary Material, together with their definitions. They all depend on the choice of , i.e,. the -mer length used for the statistics. The heuristic for the selection of is to choose as the logarithm of the sequence length (see formula 56 in [13]). Here we select as a set of values upper bounded by the logarithm of the maximum sequence length. Then, for the evaluation of AF function performance, we proceed combinatorially, i.e. the assessment is made for each combination of the chosen values of and .
2.2 The Methodology for the Experimental Study of Control of Type I Error and Power
A consolidated approach for the evaluation of the performance of a statistic, in our case an AF function, concerns the efficacy in discriminating random from real effects. If we define a positive test the identification of significant similarity, the corresponding quantification is generally obtained by evaluating the control of Type I error (i.e. the control of the number of false positives) and the power of the test statistic (i.e. the identification of the true positives). This hinges on two main ingredients: Generative Models to produce pairs of sequences with a given level of similarity and statistical test. The work by Reinert et al. [15] regarding the statistics is a clear instance of such a methodology that we closely follow, with the addition of providing public software and benchmark datasets.
Traditionally, the AF functions included in this study are grouped by mathematical families (see supplementary Material and [3, 13]). We anticipate that, in what follows, functions of the same family are listed contiguously in Tables and Figures, with no separation among families.
2.2.1 Generative Models for Sequences
Null Model.
It is intended to formalize the generation of pairs of sequences “similar by chance”. Given the alphabet with uniform probability distribution and two integers and , pairs of sequences, each of length , are generated using random samplings from a multinomial distribution . In what follows, we refer to this model simply as . Moreover, for the convenience of the reader, we recall that a multinomial is a generalization of the binomial distribution when the number of events is greater than two.
Alternative Model: Pattern Transfer.
This model, introduced in [15] and with variants proposed in [8, 17], is intended to capture the process of acquiring similarity between two biological sequences via horizontal gene transfer. Our model is essentially the same as the original one. Informally, we choose at random a number of positions in one of the two sequences. For each position, we copy the subsequence starting at that index (simply referred to as motif) in the chosen sequence, in the same position of the other sequence. The random position selection process is governed by a parameter . Higher the value of , more positions are selected. Formal details are available in Section 2.1 of the Supplementary Material.
Alternative Model: Motif Replace.
This model has been also introduced in [15]. Although no motivation was given, it intuitively represents the notion of similarity between sequences that share many Transcription Factor binding sites, and as pointed out in [8], it models the acquisition of common CIS Regulatory Modules. Technically, It is similar to , except for the selection and replacement of the motif. This latter is selected uniformly and at random from a set of motifs. As for replacement, rather than a pattern transfer, both sequences acquire a copy of the selected motif starting at the same position. The random position selection process is governed by a parameter , as in the previous model. Formal details are available in Section 2.2 of the Supplementary Material.
2.2.2 Alternative vs Null Models: the Ability to Capture Similarity Trends
To fix ideas, we present the case of similarity functions, since the case of distances is analogous. Independently of whether or not a similarity function is based on alignments, ideally, it has to be able to separate, in terms of its value, “truly” similar sequences from those that are not.
The “comparison” of Alternative models, that generate truly similar sequence pairs, with respect to Null ones, that generate random sequence pairs, allows for the quantification of how well a function captures these separations. Briefly and informally, for each AF measure, and we calculate the differences between the average AF value distribution of the NM and AMs. Higher the difference, higher the separation.
The formal methodology we propose for such a quantification is reported in Section 3 of the Supplementary Material.
2.2.3 How to Estimate Type I Error Control and Statistical Power
Given an AF function, all the statistical tests we perform in this study, and detailed next, are based on the same inferential hypotheses: , the two sequences are similar by chance (Null hypothesis) and, , the two sequences are more similar than they would be by chance (Alternative hypothesis). The statistical test allows us to decide which hypothesis is more likely to be true, according to our data. Hereafter, we define as positive a test for which the null hypothesis is likely to be false. Two different errors are associated with this decision, the Type I error, i.e. the probability of identifying a positive event when it is actually false, and the Type II error, i.e. the probability of not identifying a positive event when it is actually true.
There is an inevitable trade-off between the two errors, if Type I error increases, Type II decreases, and viceversa. The general approach is to fix Type I to a defined small value (called nominal value, usually ) and minimize Type II accordingly. Thus, in the case of absence of true positives, it is expected that a statistical test would identify 5% of positives by chance, any deviation from 5% results in a too conservative (lower than 5%) or too liberal (higher than 5%) test.
One minus the Type II error is formally the statistical power of a test, i.e. the probability to identify true positive events. Higher the power, better the test.
The quantification of both Type I error (in case of absence of true positives) and the statistical power (in case of presence of true positives) is used to measure the performance of a statistical test.
Given our generative models, is used to define the null distribution (random sequences), while and are used to generate pairs of truly similar sequences (the true positive pairs). Given a set of sequences generated by and , for each AF function we calculate the number of significantly similar sequence pairs, that is the false positives and the true positives respectively. In Section 4 of the Supplementary Material, the test procedure is highlighted.
2.3 Benchmarking Software and Datasets
The following tools, used for this research, have been made publicly available.
-
•
Datasets Generation. We provide a Spark-based distributed tool for the automatic generation of collection of genomic sequences according to the types of Generative Models described in Section 2.2.1. The tool accepts as parameters the same ones as the models. Output sequences are encoded as standard FASTA files.
-
•
AF Function Evaluation. An AF function between pair of sequences is evaluated using the FADE software (see [4]). It is a Spark-based distributed framework for AF analysis over large collections of genomic sequences, coming with the implementation of several popular AF functions. It rests on a multi-criteria succinct representation of -mer dictionaries, well suited for effective storage and load balancing in a distributed setting.
-
•
AF Functions Analysis. We provide a Java-based tool for estimating the Type I error rate and the power of the test statistic over a set of input AF functions, according to the methodology described in Section 2.2.3. This is done by comparatively analyzing the AF functions, evaluated over sequences generated according to the Null model, against the corresponding sequences generated according to the PT and MR Alternative models. Once available, these results are summarized and visualized using a proper graphical representation, by means of a collection of R scripts.
3 Results
3.1 Type I Error Control
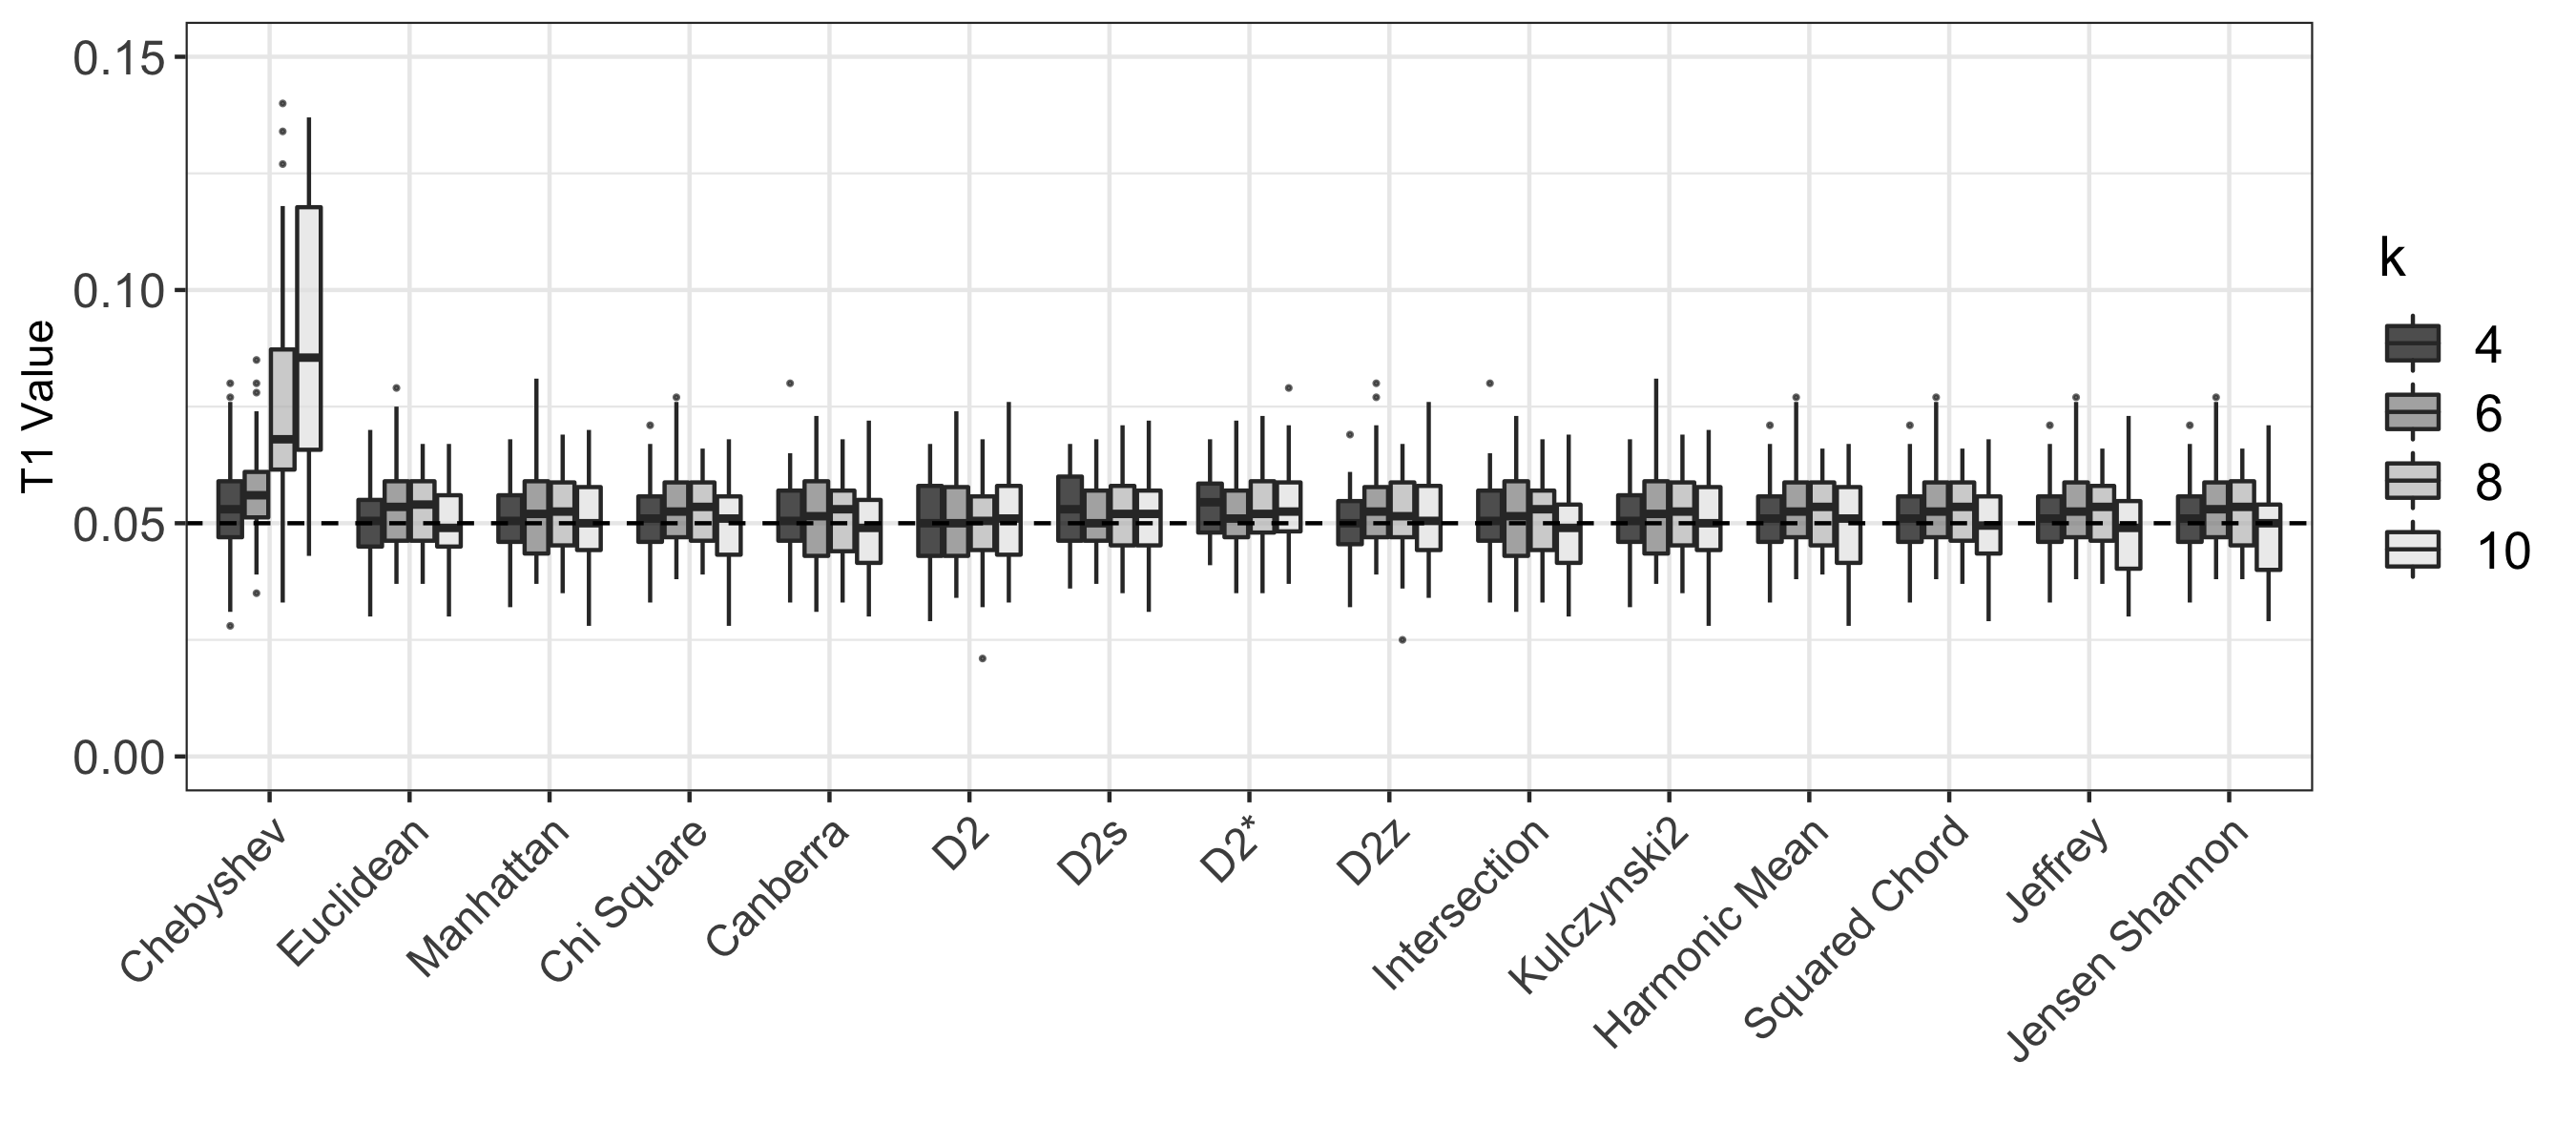
For each AF function, we have estimated the Type I error rate, as outlined in Section 2.2.3. The relevant parameters that specify the set of experiments carried out are as follows. For both scenarios (long and short sequences), we use different lengths and pairs of sequences. For long sequences, ranges from two hundred thousands to ten millions, with a step of two hundred thousands, while for short sequences ranges from one thousand to fifty thousands with a step of one thousand. The false positive rate has been estimated for . For and long sequences, the percentage of false positives are reported cumulatively by length with boxplots in Figure 1. For , the results are reported in Figure 1 of the Supplementary Material. The results for short sequences are reported in Figure 2 of the Supplementary Material. For each scenario, we can draw the following conclusions. With the exception of Chebyshev, each AF function performs fairly well, since the values of the percentage of false positives is close to the nominal level .
3.2 Ability to Capture Similarity Trends
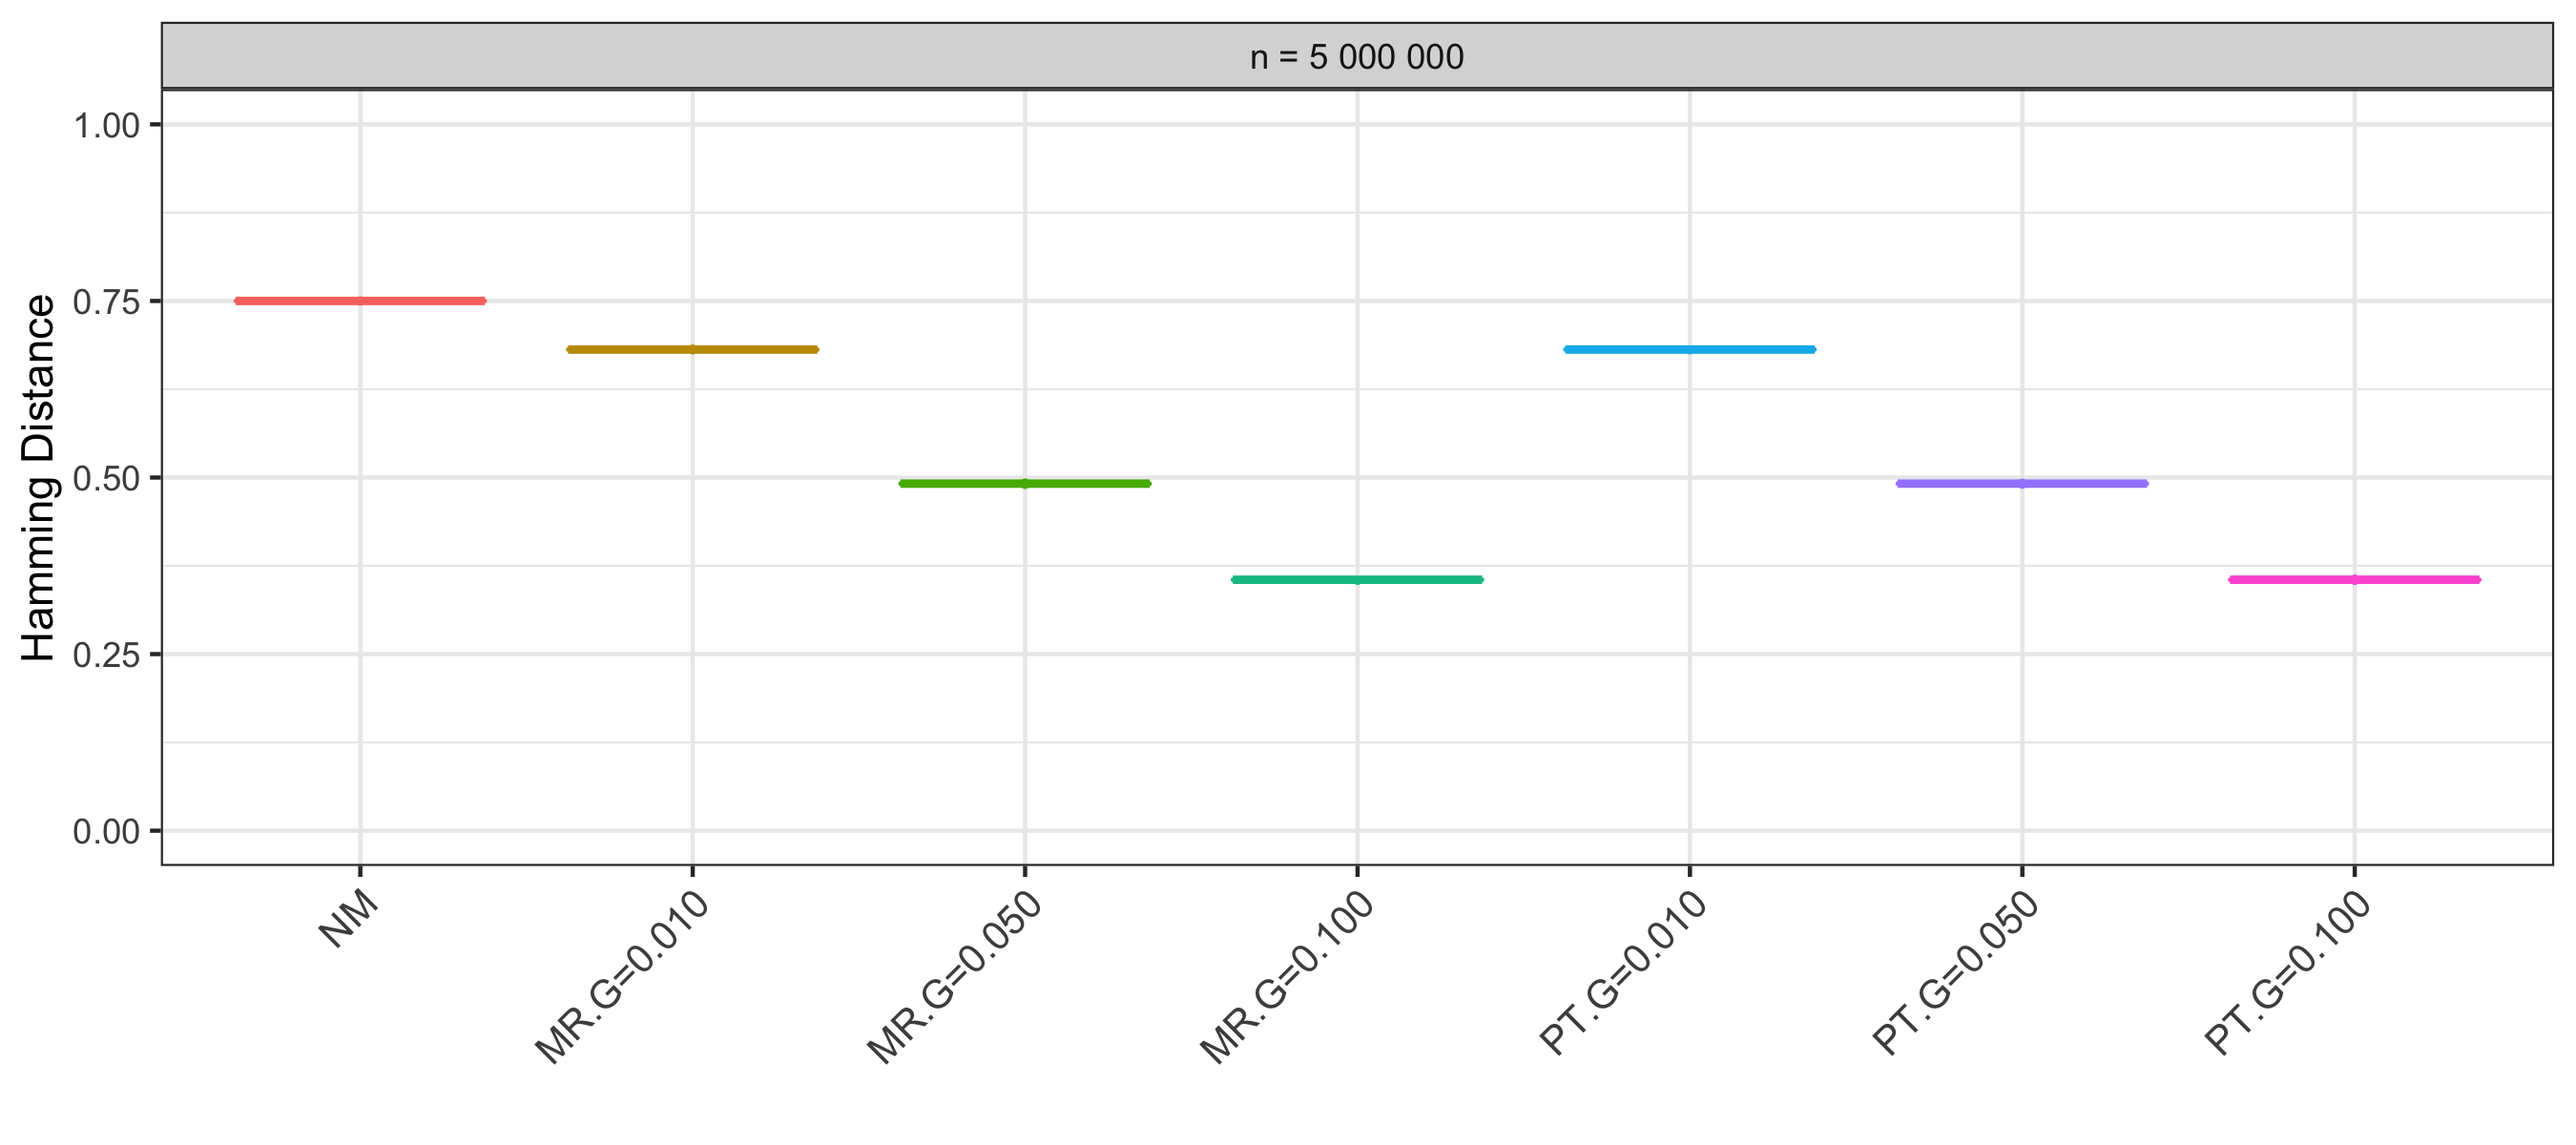
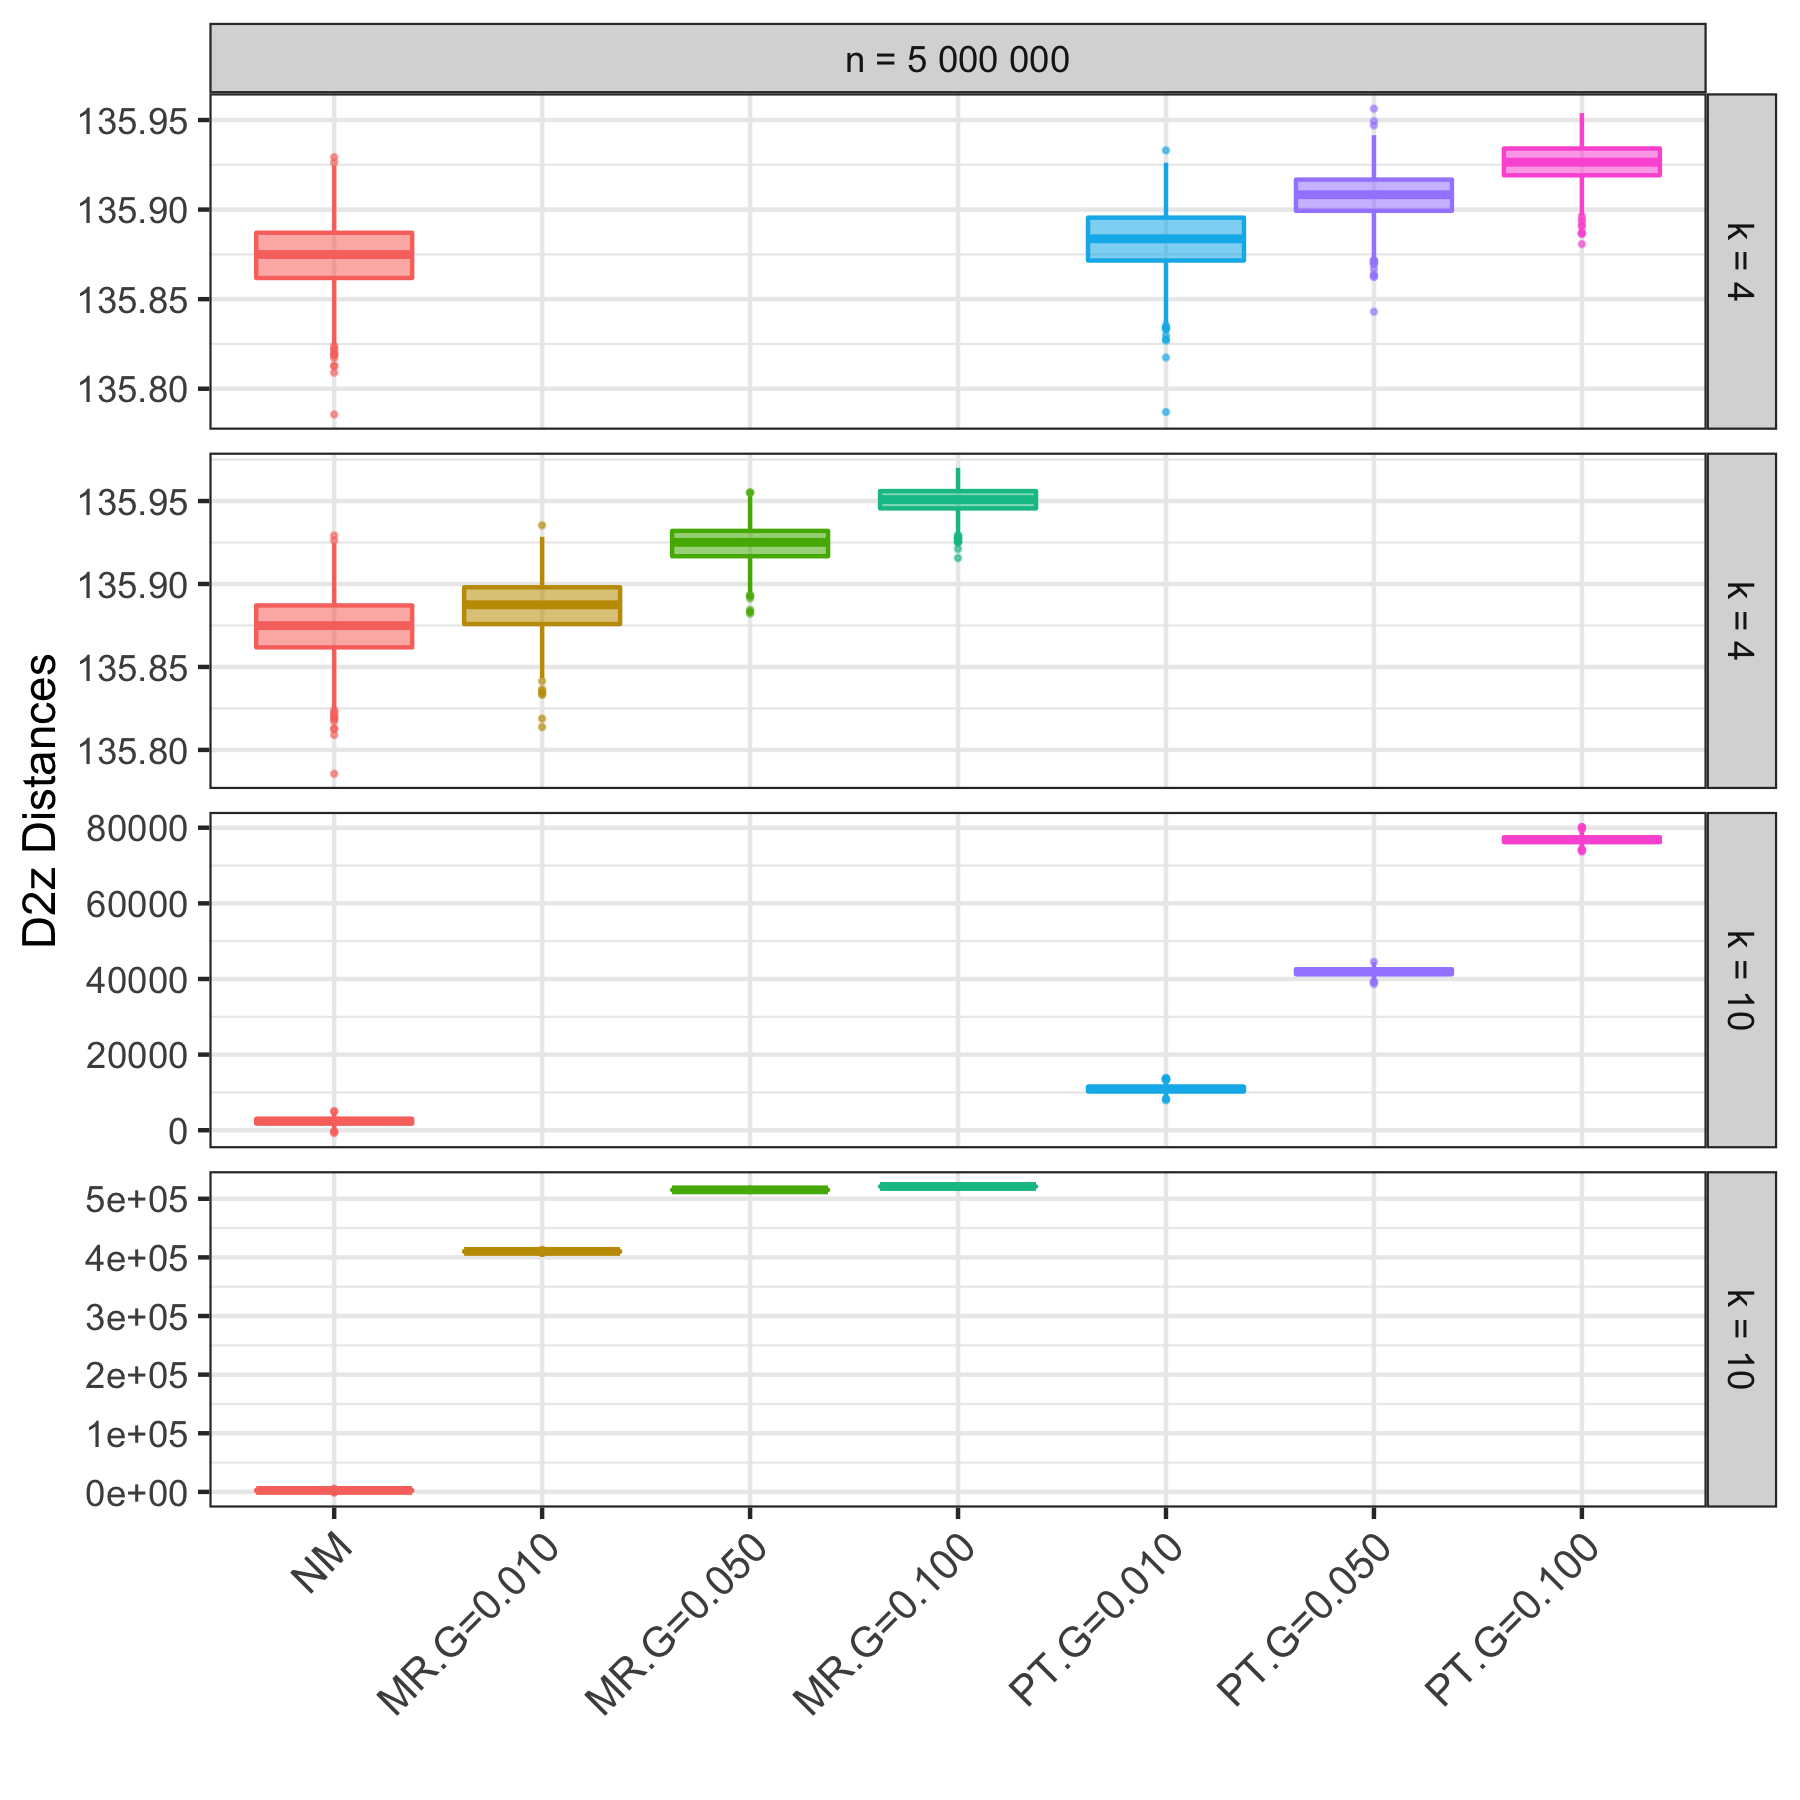
Given a length , and a similarity/distance function, we generate 1000 sequence pairs and process them as reported in Section 2.2.2 for , , and with , respectively.
In order to have an edit-based similarity/distance function as a reference point, we use the mentioned procedure with the Hamming distance ( for short), being the most natural one to capture similarity as induced by our generative models. Results are reported in Figure 2 in terms of boxplots of values. We observe that, as expected, both and models generate sequence pairs with an increasing trend of similarity as values increase, with a very small level of variability. This is due to the fact that the two models produce highly similar sequences that have the same, perfectly aligned, number of common sub-sequences. It is also to be noted that the Hamming distance confirms that generates random sequences with base probabilities equal to 1/4. The delta values of clearly evident from Figure 2 guarantees that such a function is able to capture the increasing level of similarity between pairs of sequences produced by both and . Moreover, the perfect separation of the value distributions between the and the s indicates that the Hamming distance is characterised by an excellent Type I error control and power.
It is natural to ask what would happen, had we chosen an alignment-based function such as Levenshtein Distance, also known as a special case of the Needlman-Wunsch algorithm (see [7] for technical definitions as well as an interesting historical recollection). As shown in Figure 3 of the Supplementary Material, we can draw exactly the same conclusions for the Levenshtein Distance as for HD. The advantage of the latter over the former is that the algorithm computing it takes linear time and space.
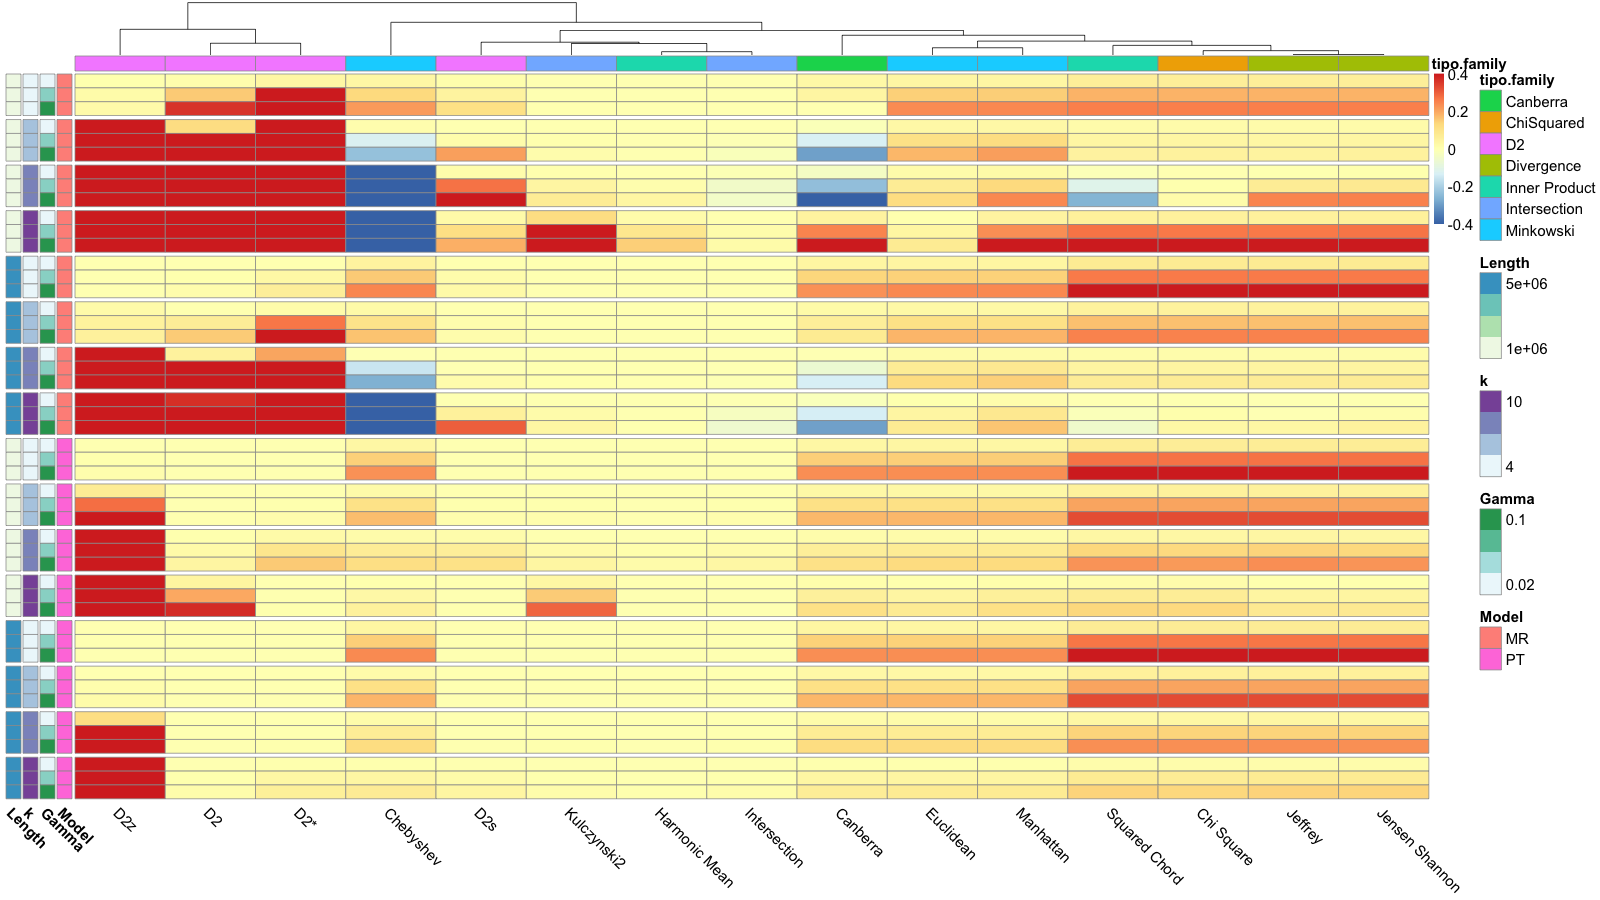
Moving from edit-based distances to word-frequency based AF functions, we perform the same experiments with the same and values, but with the addition of . The results are reported in Figure 3 as heatmap of delta values (see Section 2.2.2). The dendrogram on the top of the figure is the result of a hierarchical clustering of AF function delta vectors using Euclidean distance and Complete Linkage clustering method [9].
In order to explain the clustering, we mention that colors in the heatmap encode the following situation, on a scale from red to blue: i) positive delta values (red colors) indicate that the AF function is able to capture the similarity with respect to the case of random sequences, i.e. higher the delta, the better the measure; ii) negative delta values (blue colors) indicate a complementary situation, i.e., the measure is not able to capture the similarity.
Therefore, the clustering groups functions according to their ability to capture similarity.
Based on all the above, Figure 3 shows a global positive behaviour with the exception of Chebyshev and Canberra for the model. Apart from those two, the dendrogram groups AF functions into three clusters that we describe from right to left.
-
•
The right side group (Euclidean, Manhattan, SquaredChord, , Jeffrey, Jensen-Shannon) behaves homogeneously well, independently of the Alternative models, but with some dependence of and . That is, for this group captures similarity better than , as increases. It is to be noted that Manhattan and Euclidean are the weakest in this group: smaller delta values (lighter red)
-
•
The central group (, Harmonic Mean, Intersection, Kulczynski2) is characterised by lower levels of delta, independently of the Alternative models, and values.
-
•
The leftmost group (, , ) shows the highest potential to capture similarities (highest delta values), especially for . While and seem to “prefer” , performs well in both Alternative models.
The previous analysis highlights AF average trends with an increasing similarity, but no quantitative information is provided regarding the ability of an AF function to identify truly similar sequences, i.e., true positives. Therefore, we resort to more rigorous power tests in the next section.
3.3 Power Estimation
3.3.1 Overall Classification
In order to evaluate statistical power of an AF measure, sequences are generated with or models and tested on the null distribution (obtained with the model). The estimation has been performed for the same , and as reported previously (see Section 3.1), for both the and the Alternative models with the addition of .
Supplementary Figures 6 and 7 report the distribution of the proportion of true positives, cumulatively by length, for respectively the long and short sequences scenario. In agreement with the trends depicted in Figure 3 for only one value of , we find that AF power is and Alternative models dependent. In addition, it has dependence on . That is, i) as expected with the increasing similarity between sequences (from to ), we observe a general increase of the power; ii) for short and long ranges is generally characterised by a poor performance; iii) with some exceptions, show high power values for long sequences scenario, while worsen their performance in the case of short sequence scenario and Alternative model; iv) in the model, Canberra, Intersection, Jeffrey, Jensen-Shannon, Squared Chord and show a highly variable behaviour in terms of and for ; v) differently form the long sequence scenario, the short one shows highly variable power trends not only for the but also for the Alternative model. Finally, the Chebyshev function is confirmed to be characterised by the worst performance in both models and scenarios.
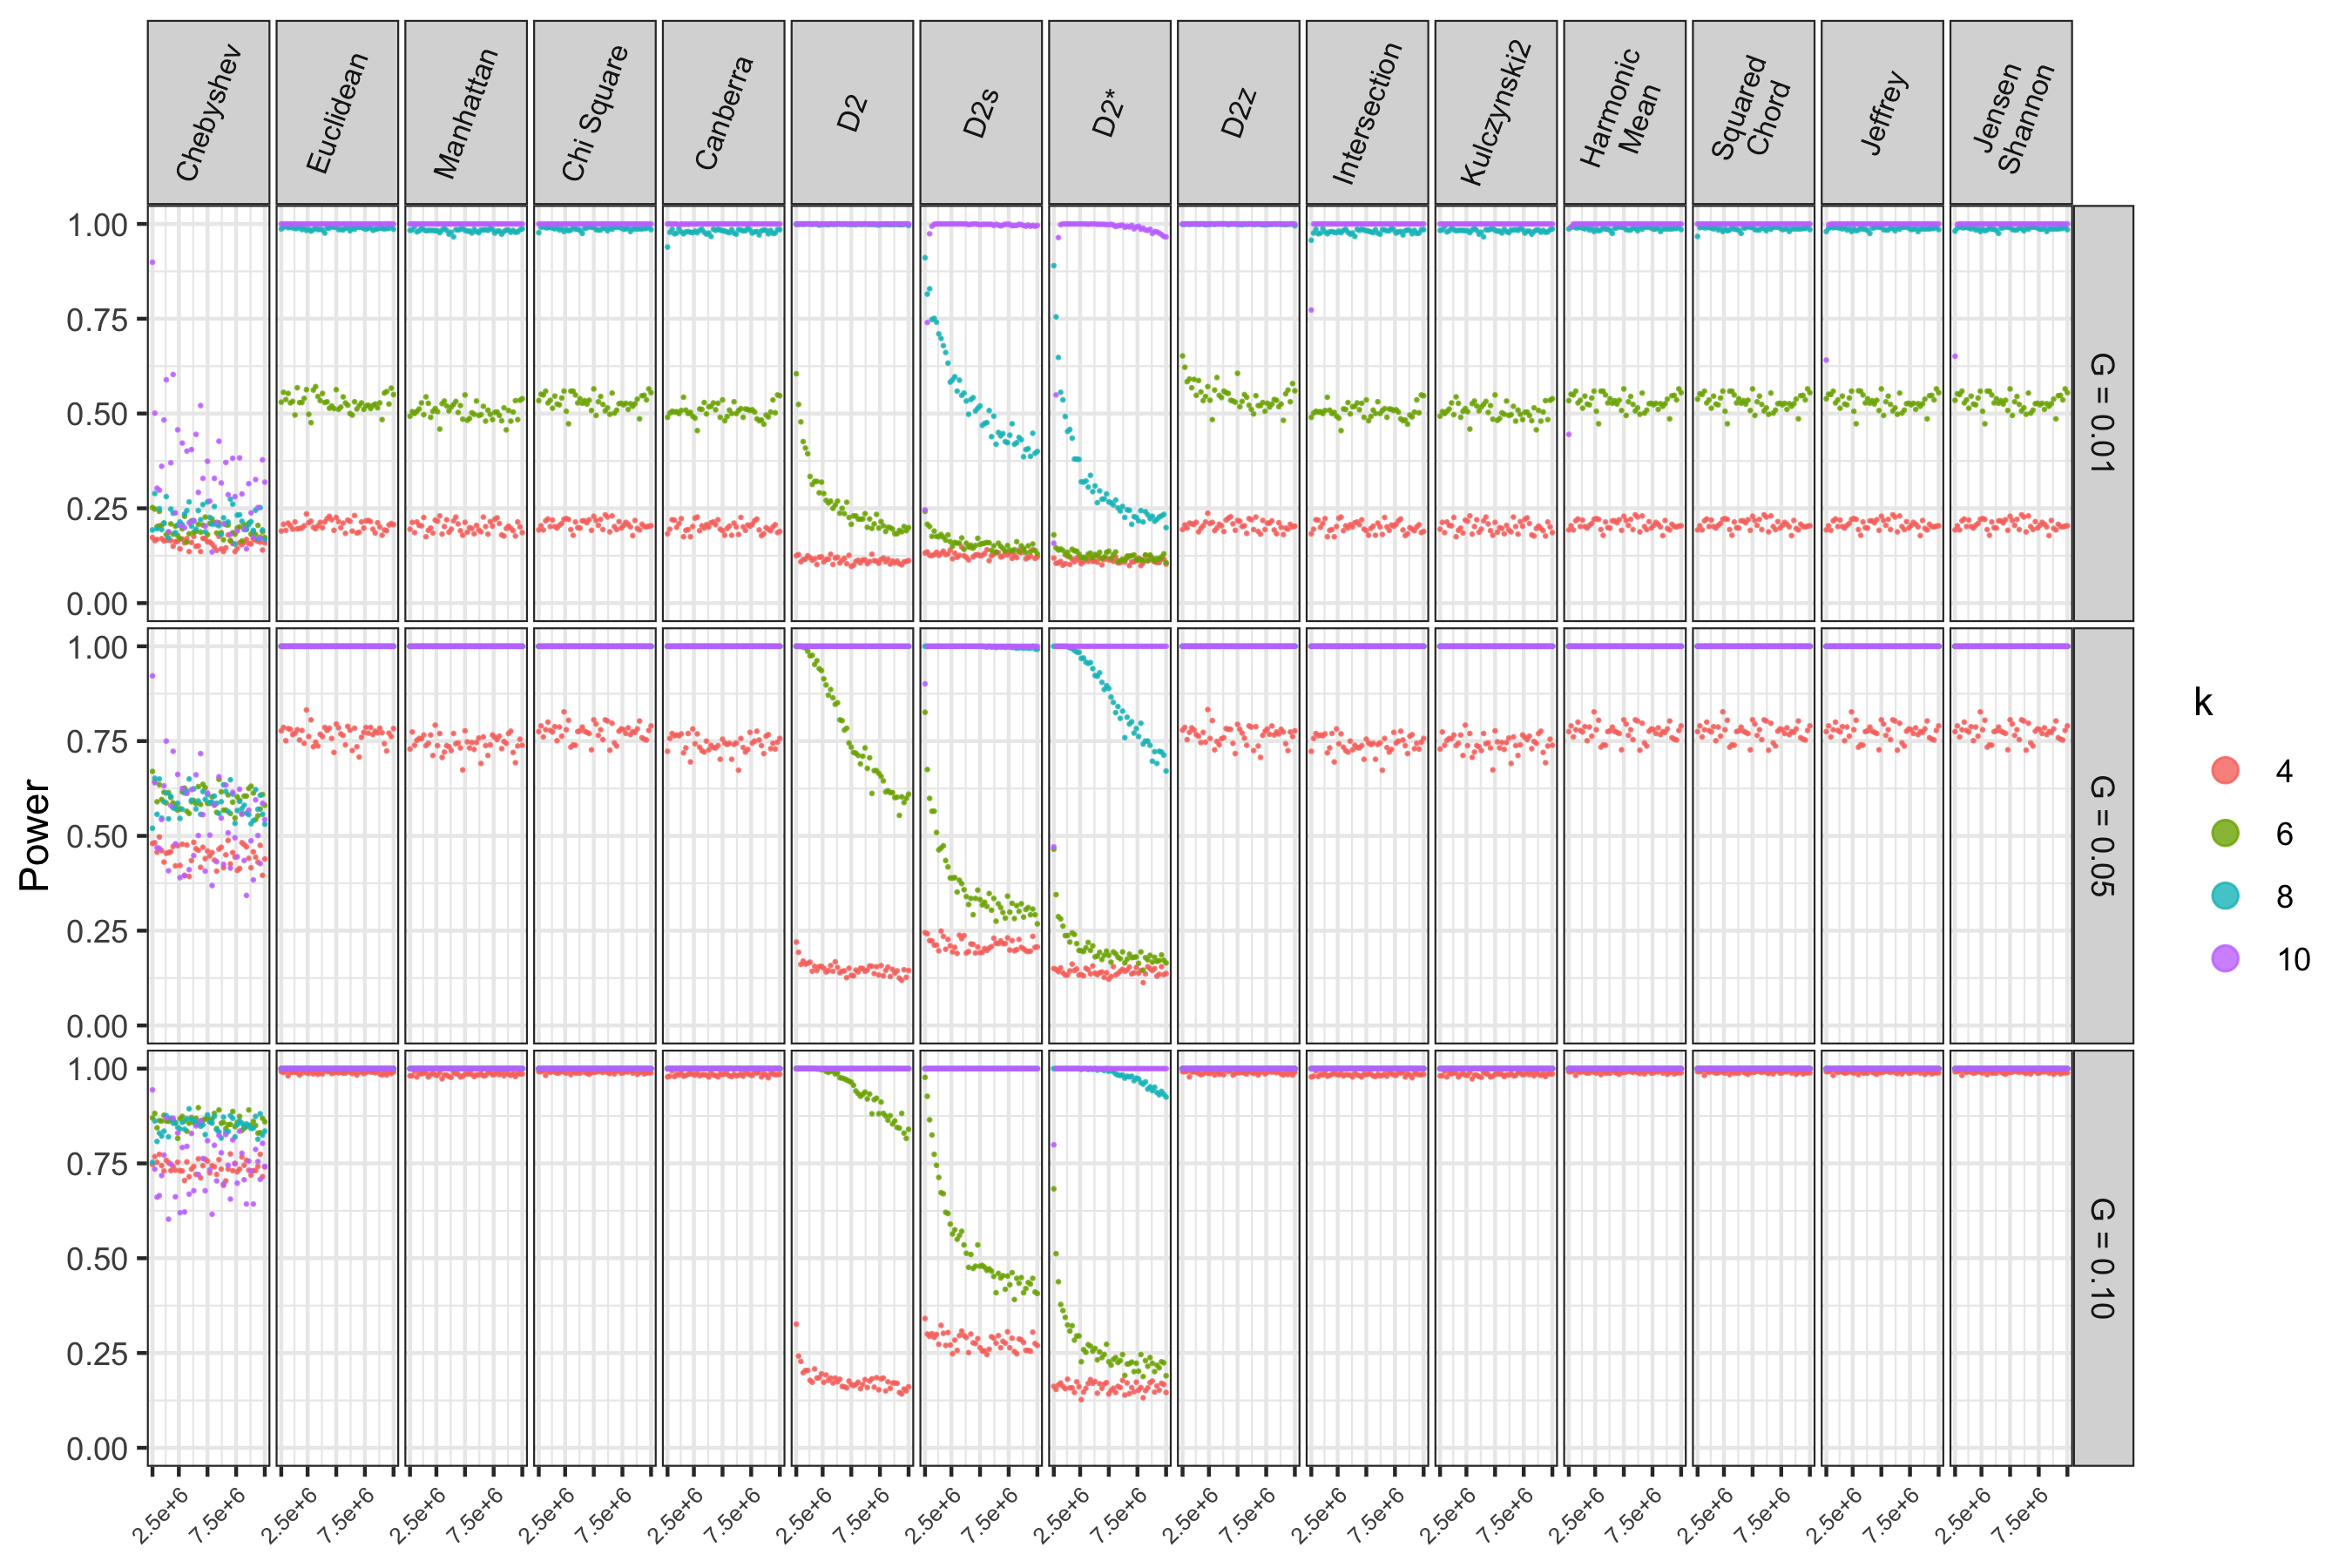
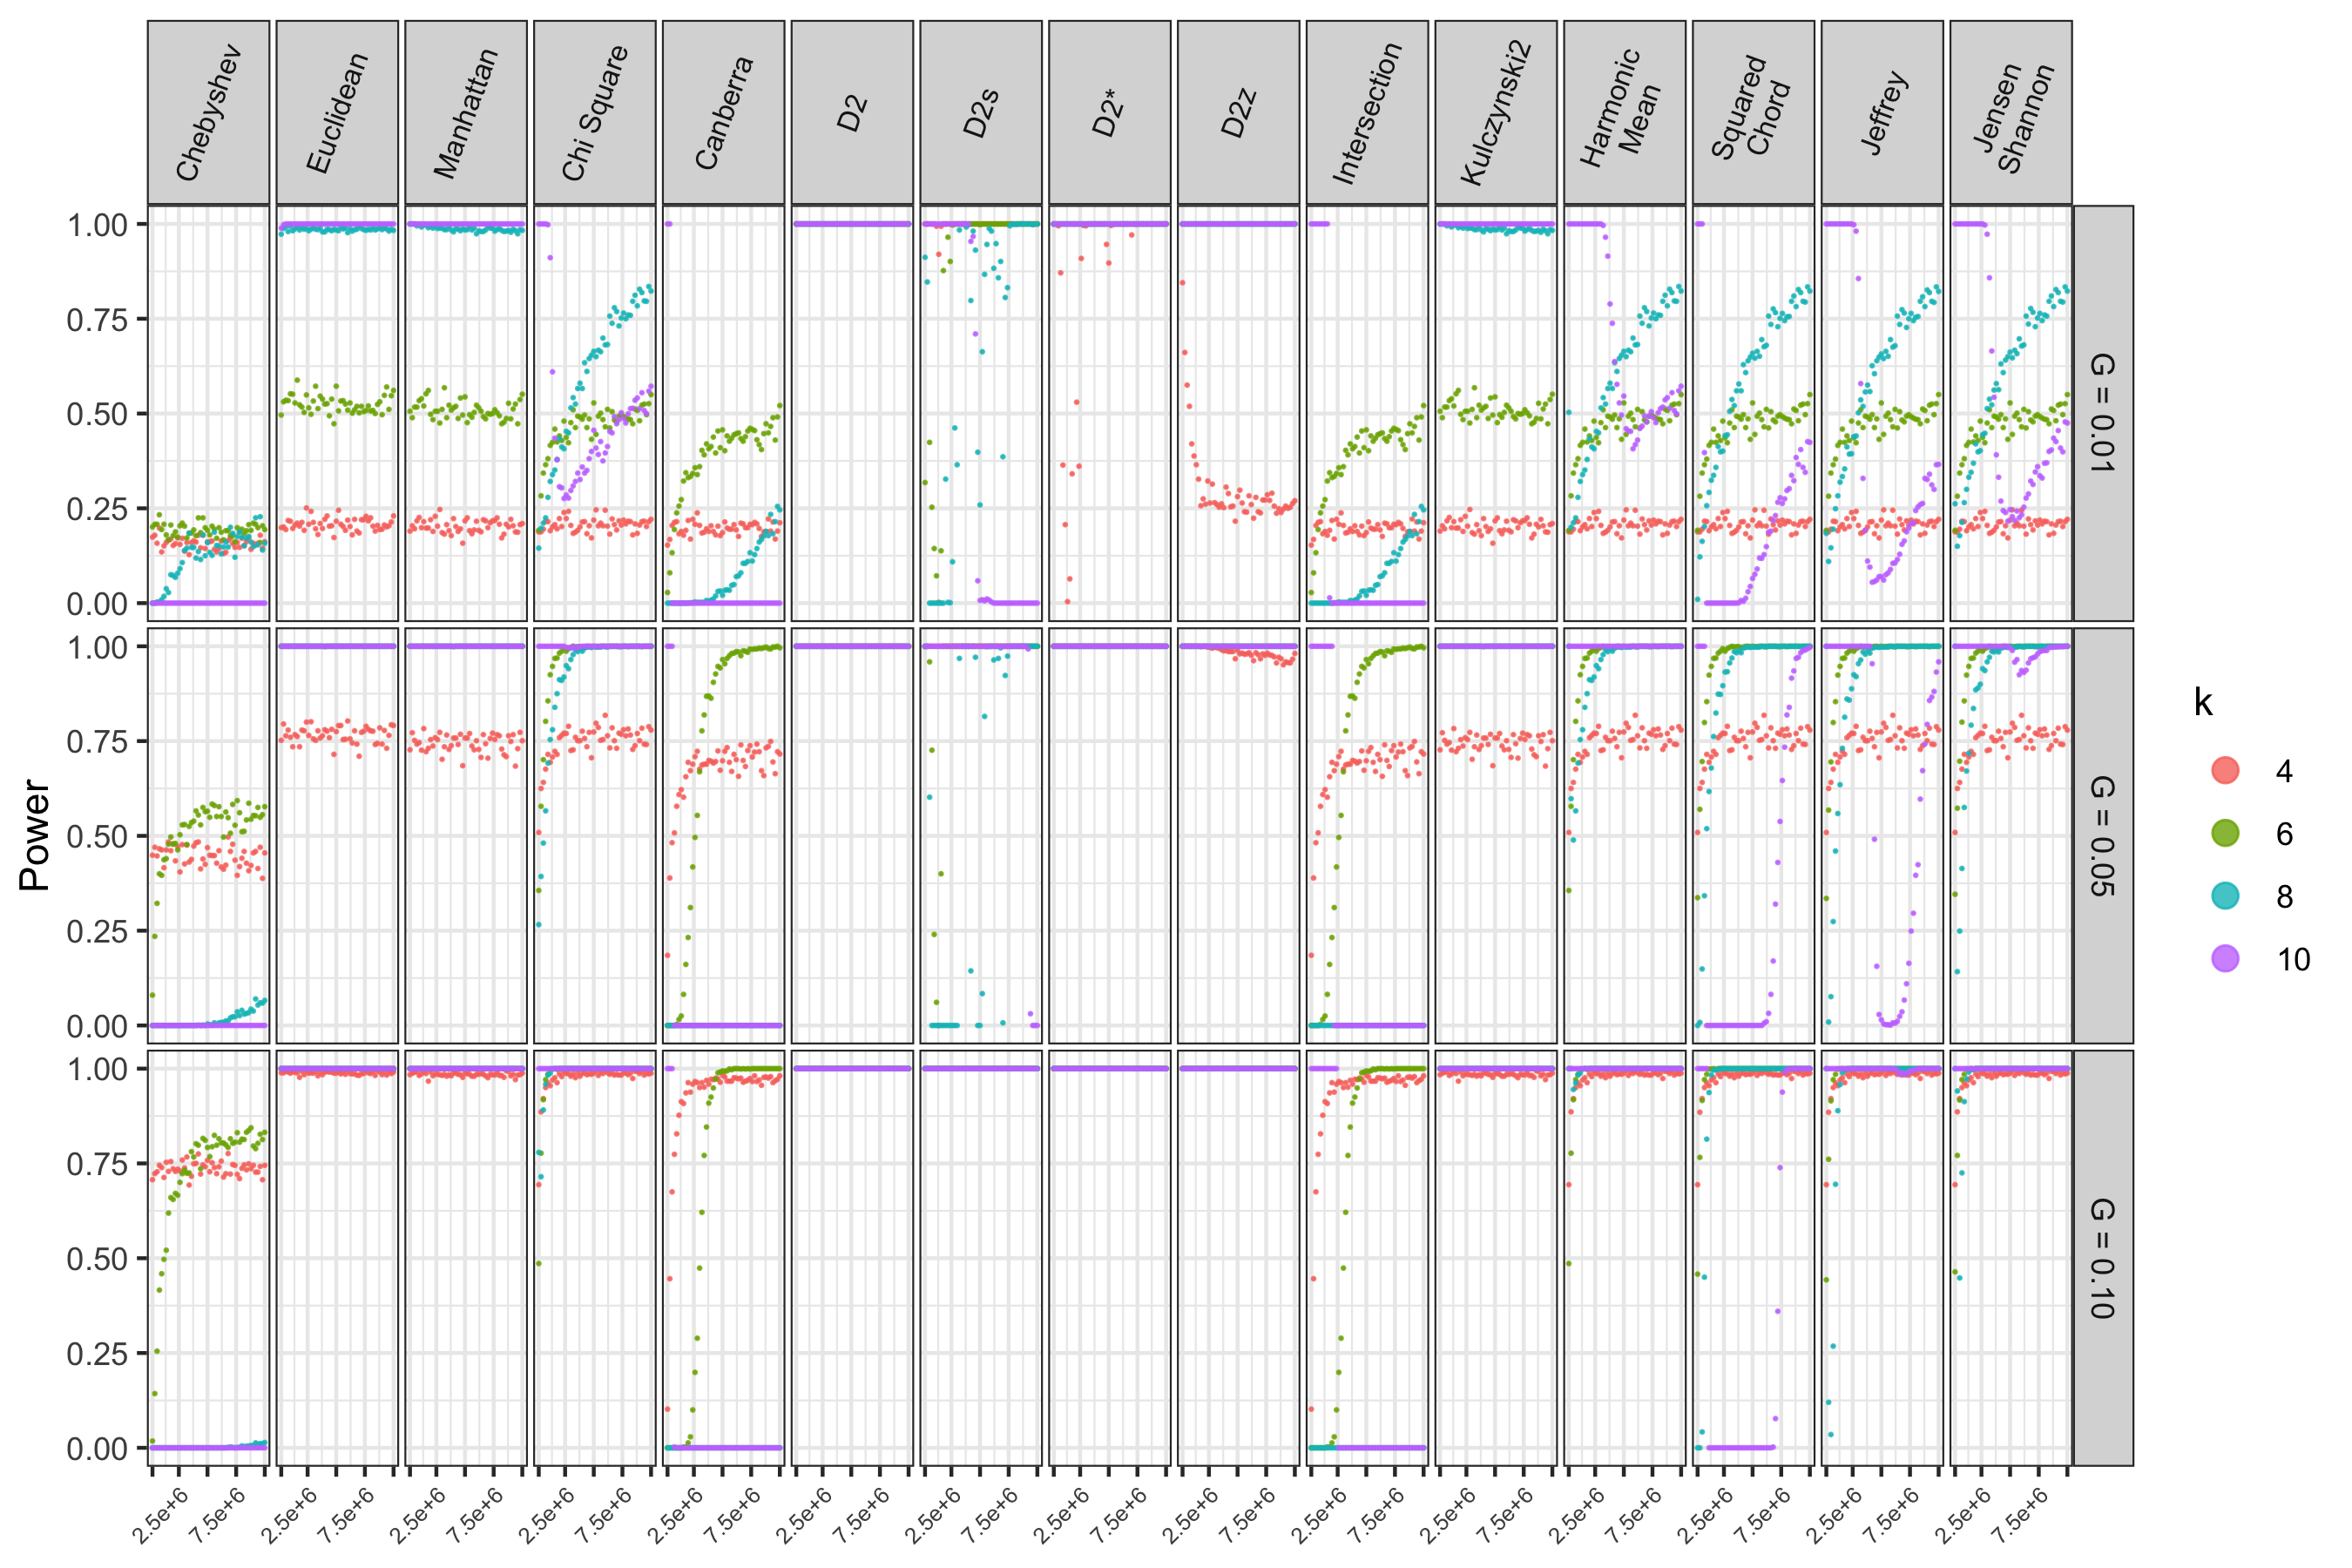
Figures 4 and 8 (this latter reported in the Supplementary Material) give an even more accurate picture of the relationship between power, , and . We evidence some peculiar and unexpected power trends that allow us to classify AF function into two different groups: stable (when there is no functional relationship between power and ) and unstable (when, on the contrary, a clear increasing or decreasing trend can be observed between power and ). In particular, it allows us to partition AF functions into four different classes, that we now define.
Class 1 has a stable power behaviour in both and ; class 2 has a stable power behaviour in the but an unstable power behaviour in the ; class 3 has a stable power behaviour in the but an unstable power behaviour in the and class 4 has an unstable power behaviour in both and . Those findings are reported in Table 1 for both the considered scenarios.
Unexpectedly, as reported in Figure 4, while in model most of the functional relationships between power and show an increasing trend, in the model most of them are characterised by a decreasing trend (for ). Moreover, we observe that in the short sequences scenario, the power for is poor. This suggests that these values are unsuitable for short (see again Figure 8 of the Supplementary Material).
| Short | Long | ||||||
|---|---|---|---|---|---|---|---|
| Family | Method | PT | MR | Class | PT | MR | Class |
| Minkowski | Chebyshev | U | U | 4 | U | U | 4 |
| Minkowski | Euclidean | S | S | 1 | S | S | 1 |
| Minkowski | Manhattan | S | S | 1 | S | S | 1 |
| S | S | 1 | S | U | 2 | ||
| Canberra | Canberra | S | S | 1 | S | U | 2 |
| U | S | 3 | U | S | 3 | ||
| U | U | 4 | U | U | 4 | ||
| U | S | 3 | U | S | 3 | ||
| S | S | 1 | S | S | 1 | ||
| Intersection | Intersection | U | S | 3 | S | U | 2 |
| Intersection | Kulczynski2 | S | S | 1 | S | S | 1 |
| Inner Product | Harmonic Mean | S | S | 1 | S | S | 1 |
| Inner Product | Squared Chord | S | U | 2 | S | U | 2 |
| Divergence | Jeffrey | U | U | 4 | S | U | 2 |
| Divergence | Jensen-Shannon | U | U | 4 | S | U | 2 |
3.3.2 Insights into the overall classification.
Looking at the AF classes reported in Table 1, it is clearly evident that affects AF classification at least for some methods. In particular , Canberra, Intersection, Harmonic Mean, Jeffrey and Jensen-Shannon methods show different power trends for different ranges: while and Canberra seem to become more stable moving from long to short sequences, Intersection, Harmonic Mean, Jeffrey and Jensen-Shannon seem to become more unstable. Minkowski and families seem to behave consistently across long and short sequence scenarios.
Apart from AF functions belonging to class 4, the previous classification evidences that some AF functions previously characterized by a reasonable good ability to capture similarity trend (see Section 3.2), to a closer and more rigorous scrutiny show poor power in, at least, one model. In order to provide a reason for such a behaviour, we provide an additional and more detailed analysis of four functions, representative of differing behaviours in terms of power. They are: for class 1, and Intersection for class 2 in the long sequence scenario), and for class 3. We take as reference the power results in Figure 4.
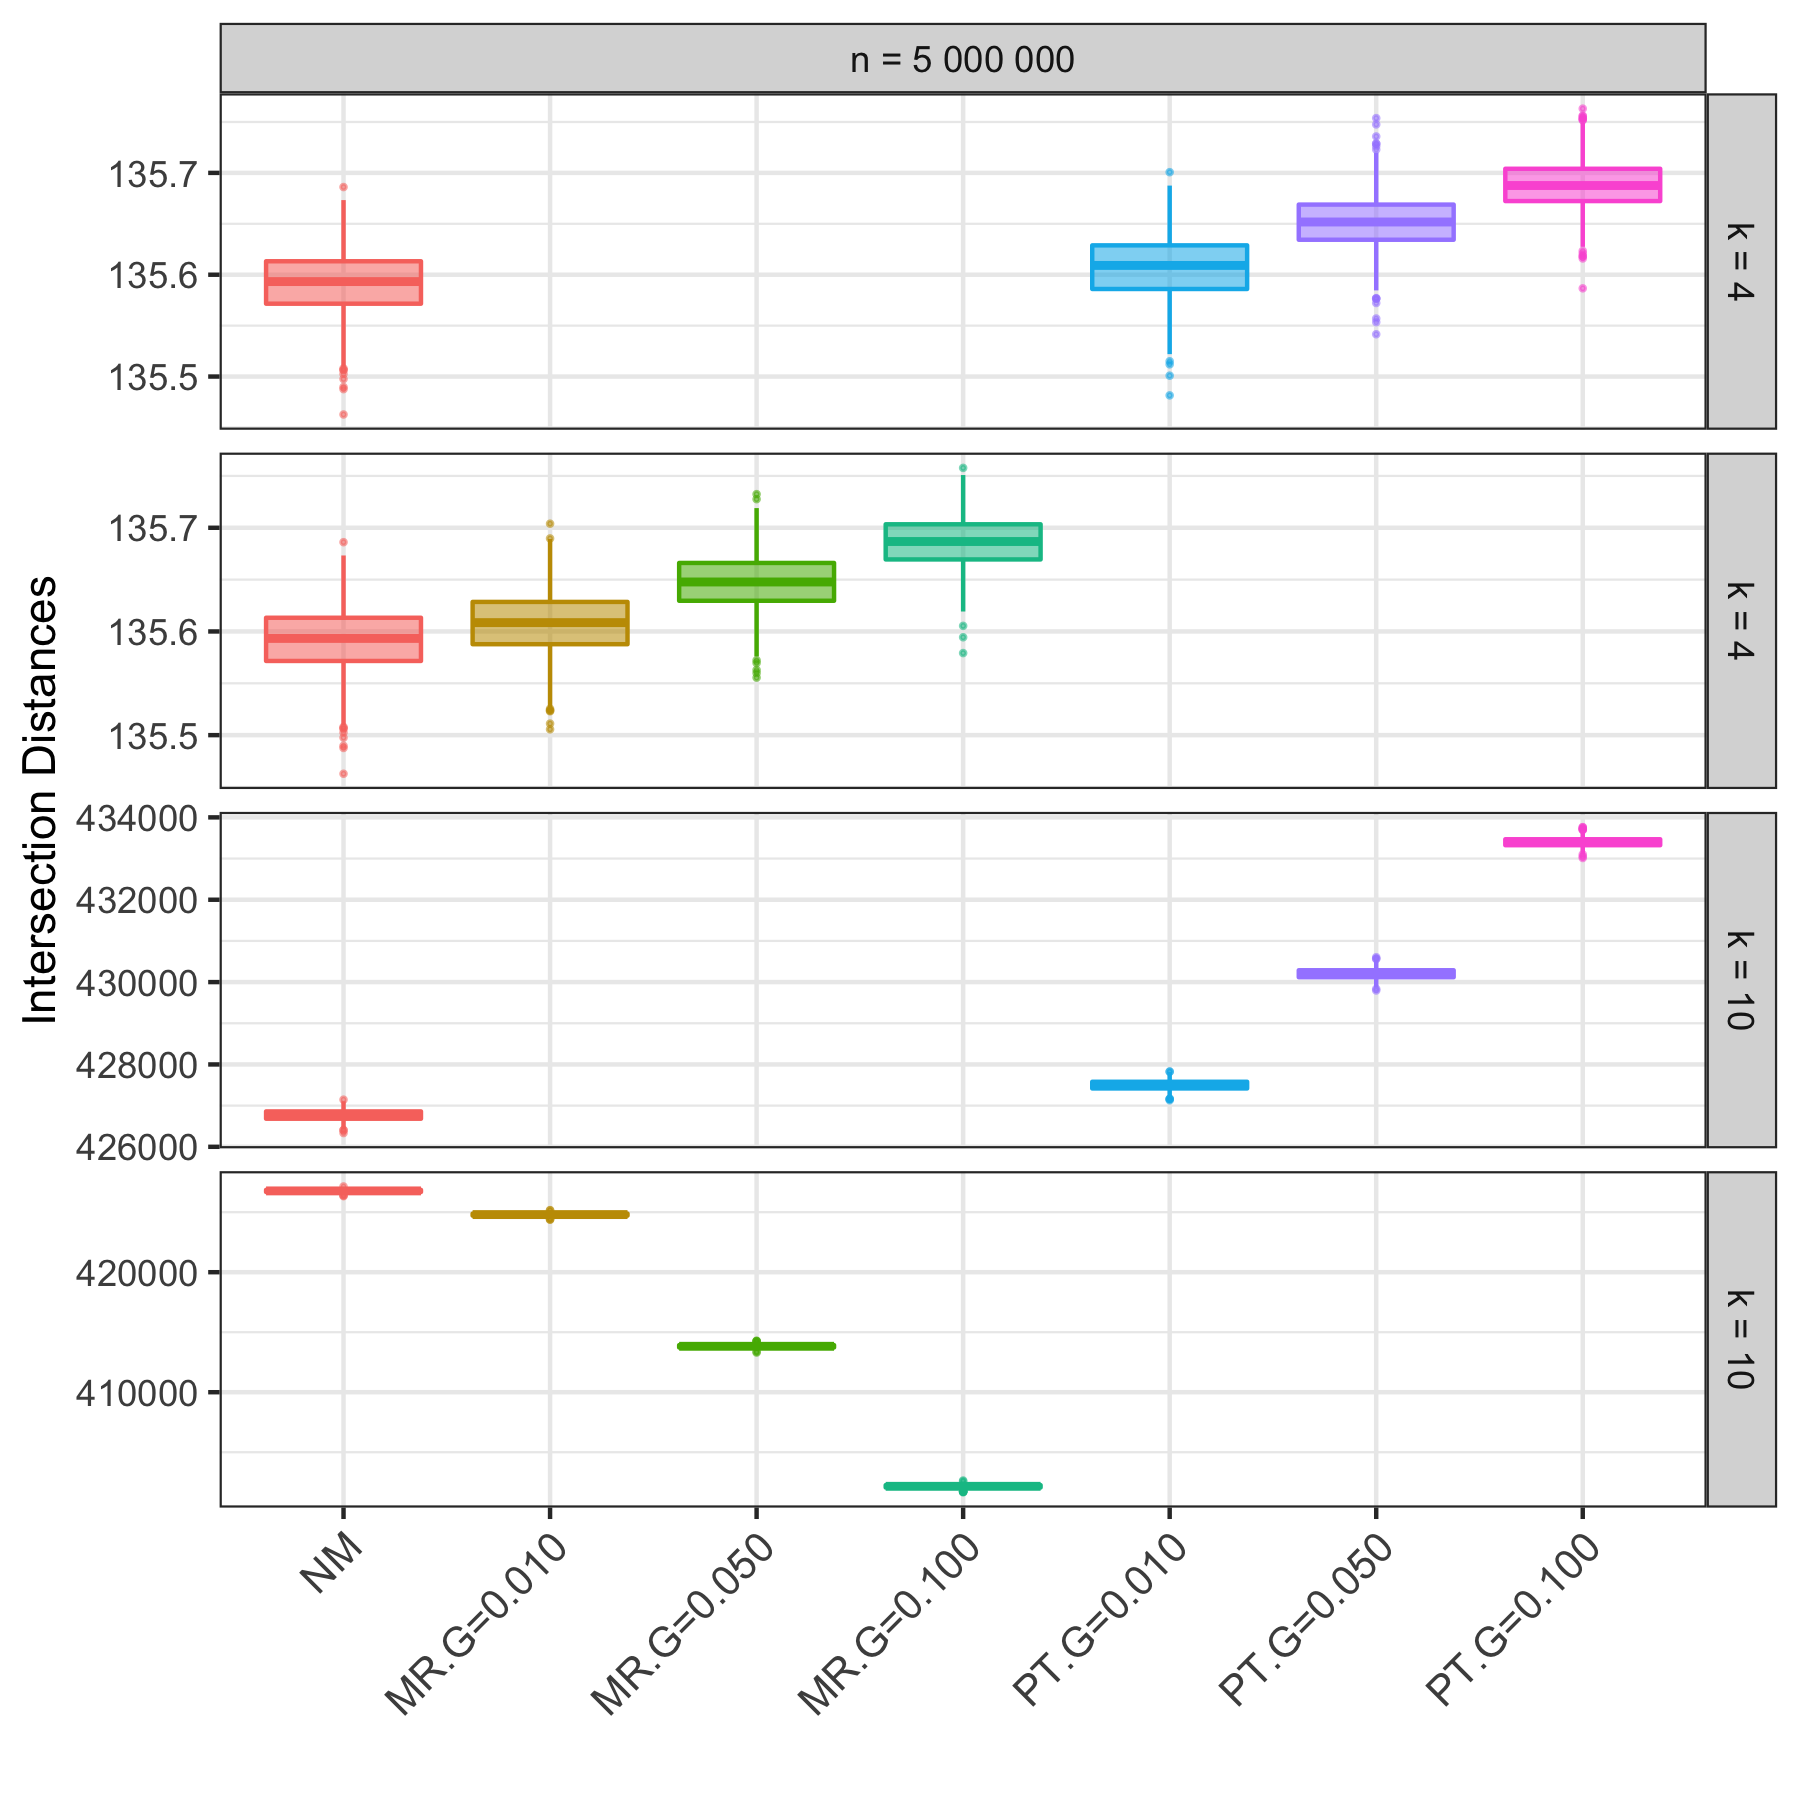
In the model, Intersection shows an opposite behaviour than the expected one for : it has an optimal power for small values of but it collapses to zero for greater than . This drop is very well explained and exemplified by the counter-intuitive decreasing trend of the function values for , as it is clearly visible in the boxplots of Figure 5(b). Keeping in mind that Intersection is a similarity measure while is a distance, for the , it is evident the difference in value distributions of the former with respect to the latter. Indeed, in Figure 5(b) (MR), the boxplots of the former have tendency opposite to the one that a similarity measure should have, while in Figure 2, the boxplots have the correct tendency and are very well separated.
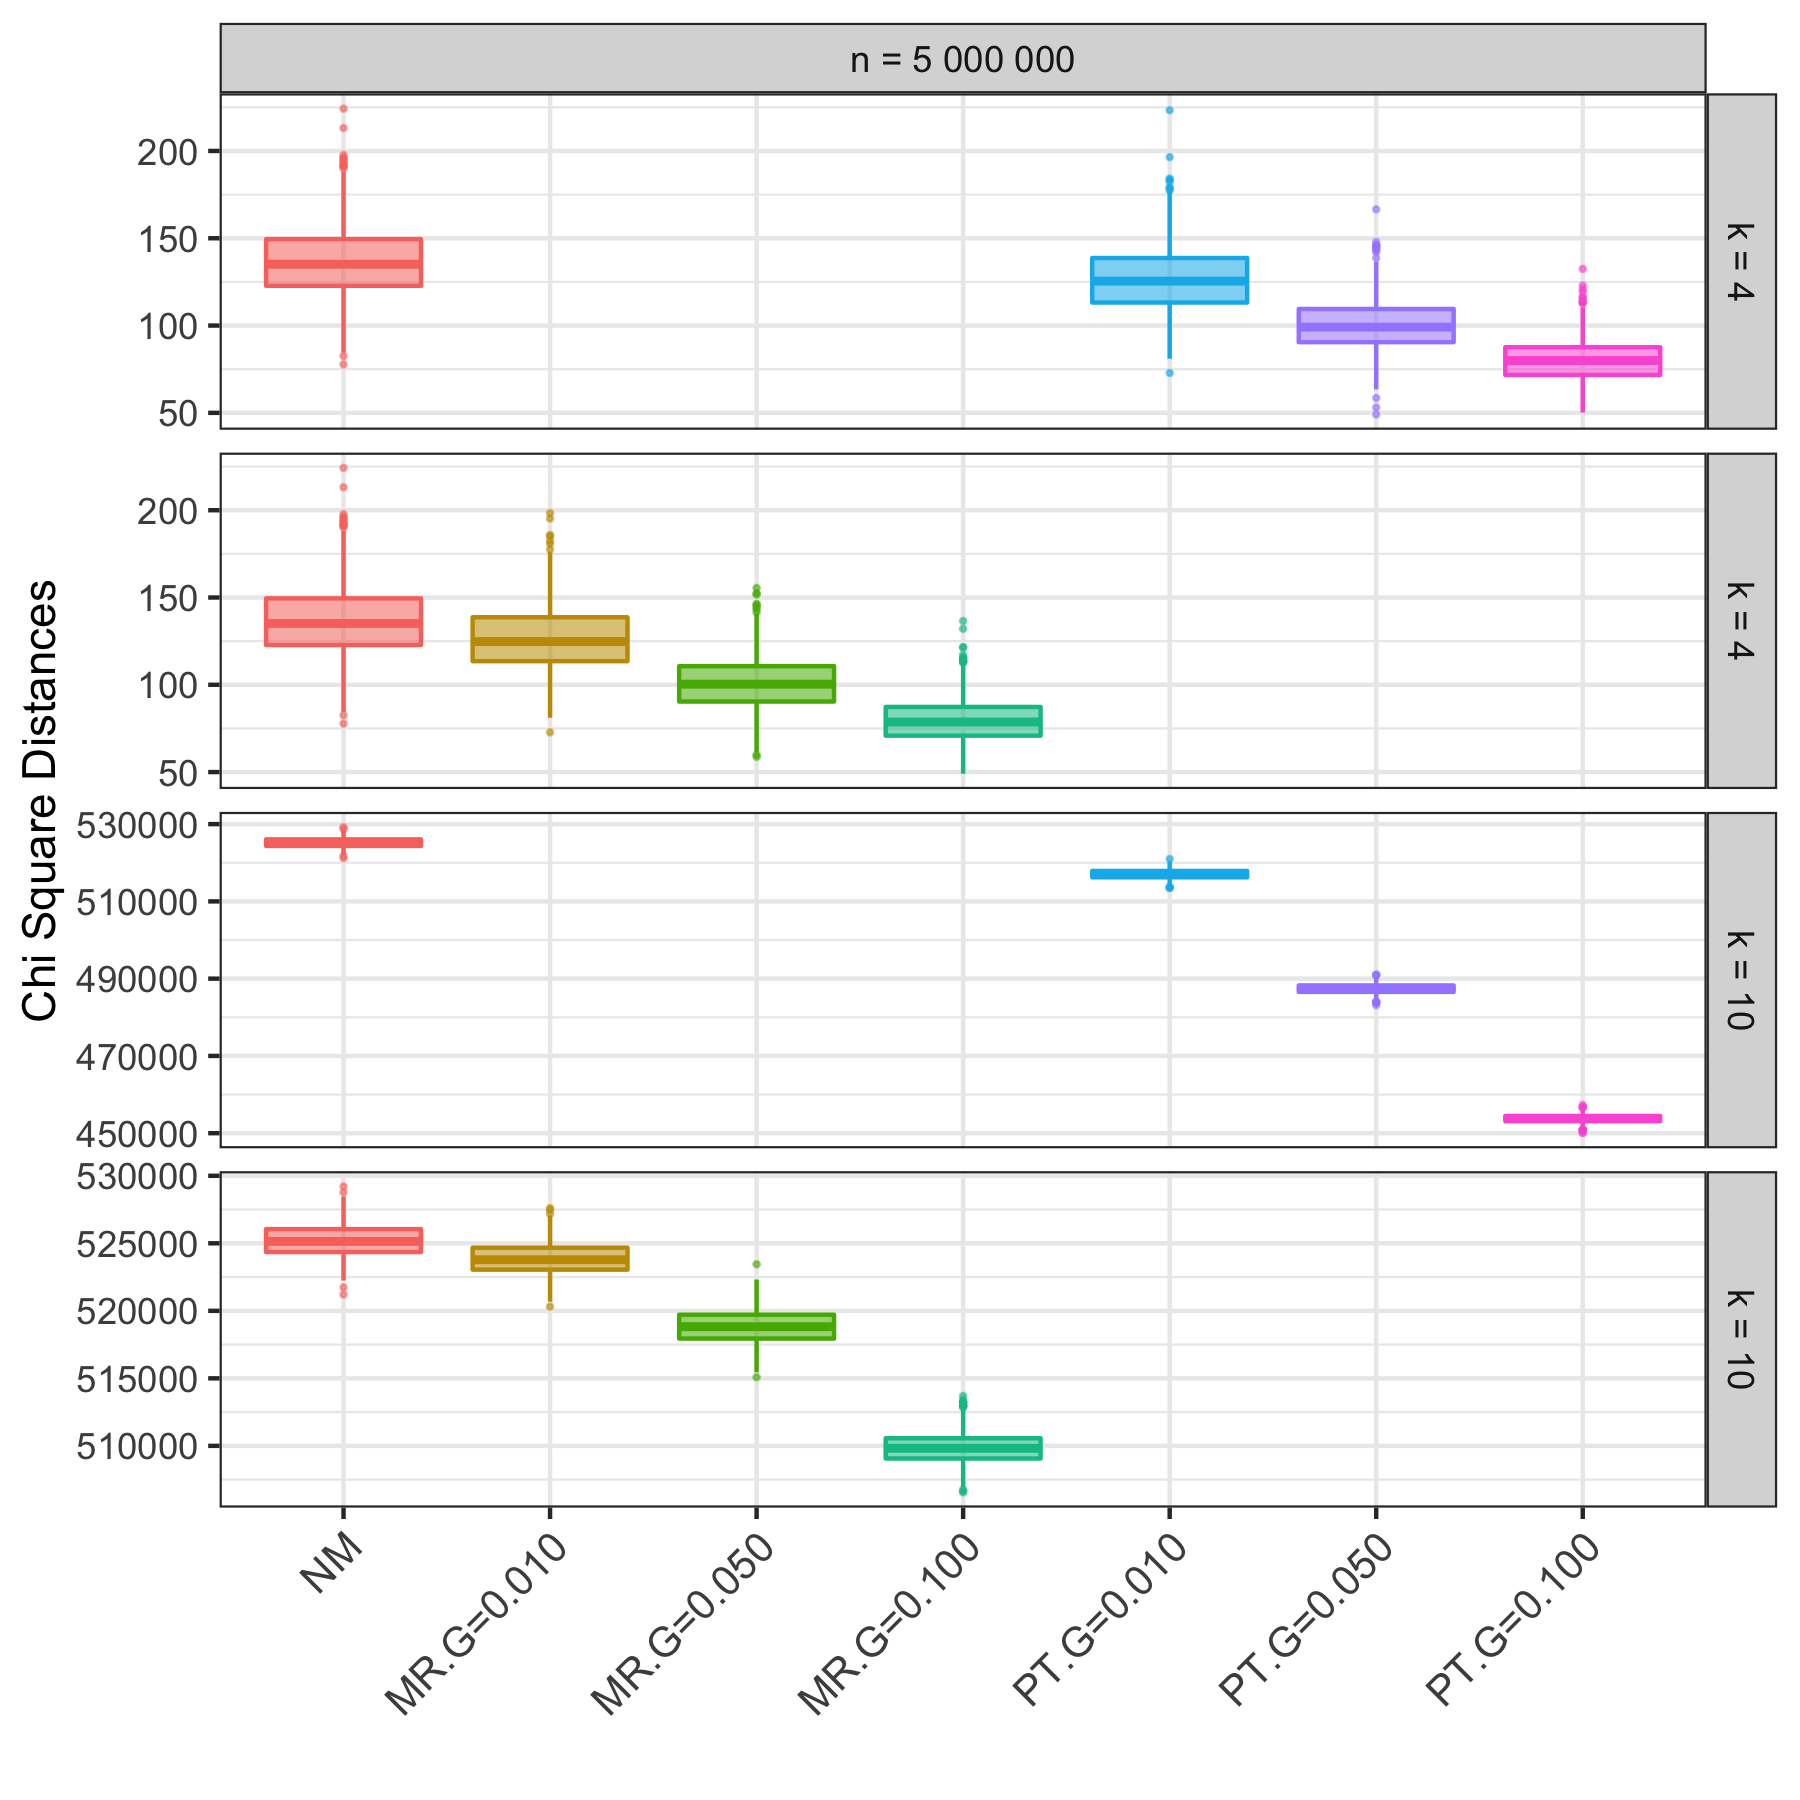
In the model, shows a poor power for independently from while, for higher s, a better trend is evident. This is confirmed in Figure 5(a) by the overlapping boxplots shown for . As in the case of Intersection, it is useful to compare those boxplot trends with the ones of in Figure 2.
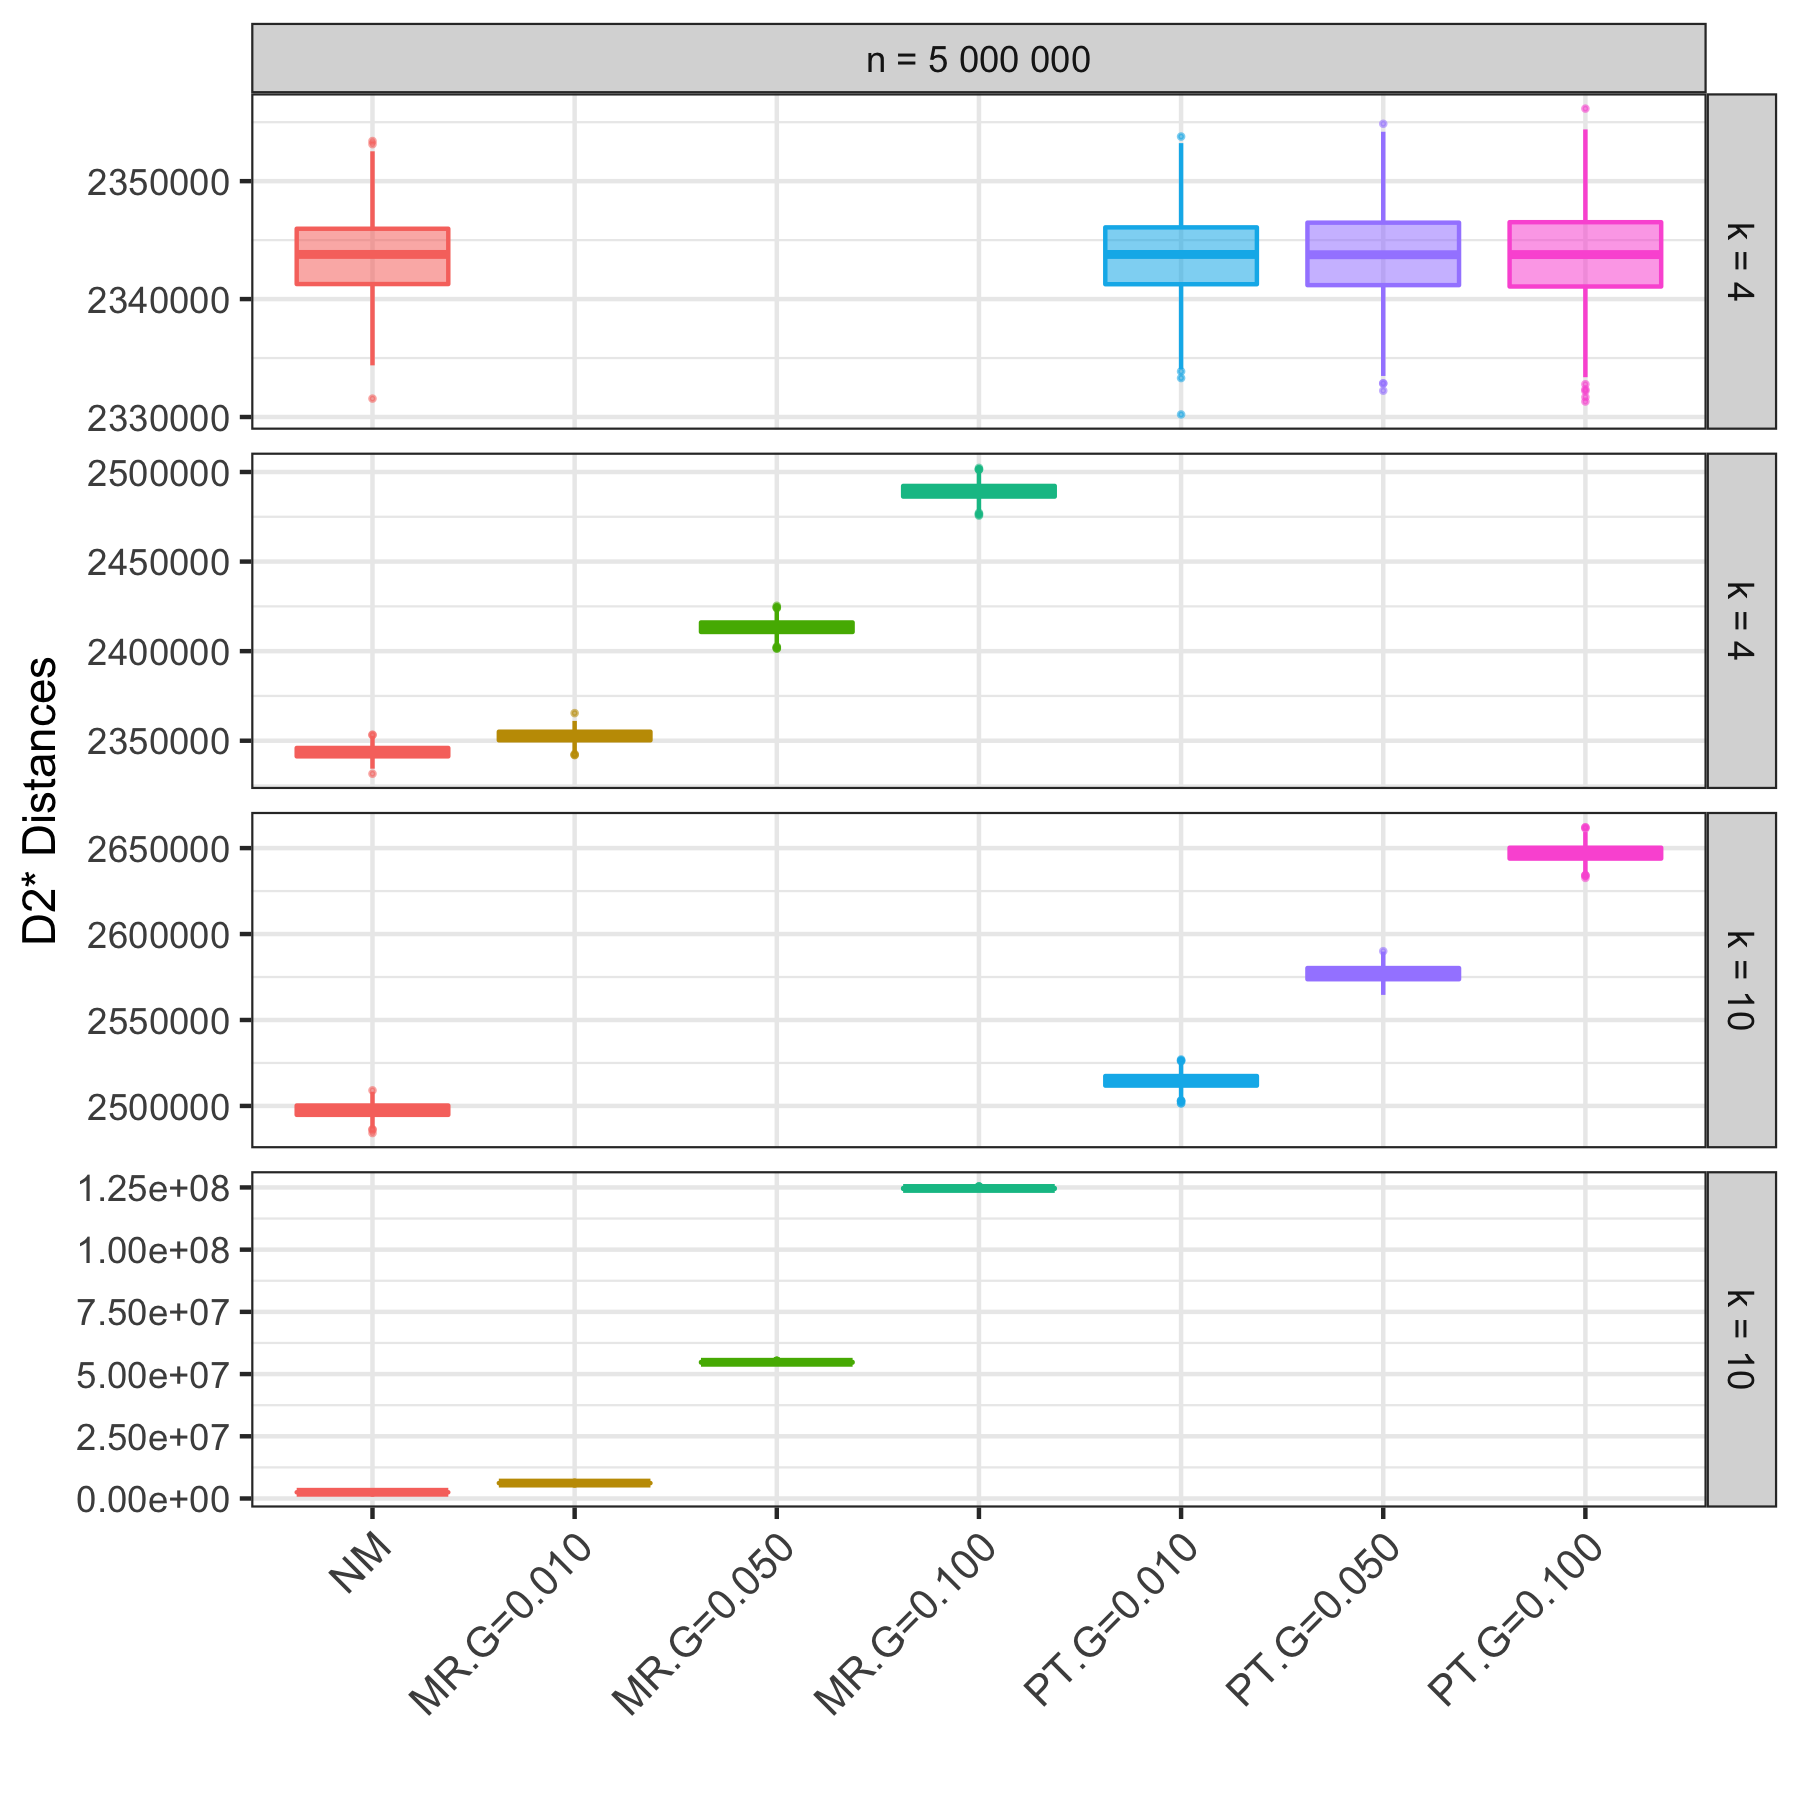
exhibits an opposite behaviour with respect to the other functions: it reaches a perfect power in the model independently from and , while it has poor power in the model for . This is explainable by the completely overlapping boxplots for in Figure 5(c). Again, it is useful to compare those boxplot trends with the ones of in Figure 2.
is the only function that exhibits a 100% of power for , independently from and from the Alternative models, as confirmed in Figure 5(d). Indeed, those boxplots behave in complete analogy with the ones of displayed in Figure 2.
In conclusion, poor power or a sudden drop in power can be explained as a loss of the ability of an AF function to produce values in sequence pairs generated with the Alternative models clearly disjointed from the ones produced in the case of Null model, with an increasing or decreasing trend in the case of a similarity or distance function, respectively.
4 Discussion
Our experiments, together with the analysis of the results, provide a comprehensive study of the word-frequency based AF function performance in terms of Type I error control and power using synthetic datasets. Although empirical evaluations on gold standard real datasets are certainly appropriate for Type I error control evaluation, they are challenging in the case of power analyses as true positives (real sequence similarity) are hard to be defined.
Our results demonstrate that, although most of the tested AF functions perform well in controlling false positives, much more compelling are the results obtained in the power studies, showing different and unexpected performances.
One of the reasons for the scarce use of comparative power studies is the absence of effective computational tools. Therefore, as an additional contribution to the advancement of the State of the Art, we also provide an entire software system, based on Big Data Technologies, to rapidly carry out Power experiments.
Moreover, we get the following additional more detailed insights.
-
(1)
Type I Error Control and the Choice of . The good performance of the selected AF functions in this setting is somewhat expected. However, using a rigorous, coherent and quantitative evaluation of the proportion of false positives, we show that this proportion is not much affected by the chosen value of , a novel and somewhat unexpected result.
-
(2)
Beyond a Syntactic Grouping of AF Functions by “Family”. Our experiments show the presence of four main AF function groups that substantially differ from the syntactic grouping provided by [13] (Figure 1, but see also [3]). We further observe that there is enough “information” regarding similarity in the -mer statistics used by AF functions. Indeed, an alignment method such as and a word-frequency based one such as have essentially the same performance. Rather, the poor performance of some measures seems to critically depend, in a non-obvious way, from the formula characterizing the function. Indeed, AF functions that are mathematically closely related, e.g., Manhattan and Canberra, may exhibit quite different power.
-
(3)
The Complex and Function Specific Dependency of Power on Key AF Functions Parameters. Based on our experiments, the ability to detect true positive similarities is deeply dependent on the value of , the length of the sequences and the biological reality that the generative models are meant to encode. In particular, we note a poor power for some AF functions, even when is selected using the already mentioned time-honored heuristic to choose as the log of sequence length (i.e. for short sequences). In details, for Type I Error, the relationship between and seems to be irrelevant (see (1) above), while here it is AF function specific. Those findings indicate that the identification of a rule for the selection of , even heuristic, general to all AF functions can be a very evanescent task. In this respect, our data analysis is useful to empirically guide the selection of according to the sequence length .
-
(4)
The Family: Its Power in Relation to Alternative Models. This is a very prominent family in Alignment-Free Computational Biology [18]. Relevant for this research is the fact that it is known that and do not perform adequately on the model [15, 21]. Variants as a remedy to this have been proposed [11], but due to their computational cost, they are mainly of theoretic interest. We add some new facts regarding this important family. First, all of the family performs well on both models, across sequence length, but for “large” s. Moreover, is the best performer on both and , for all values of we have tested.
5 Conclusions and Open Problems
In this study, we have provided a statistically sound and comprehensive study of word-frequency based AF functions in terms of Type I error control and power. Our findings indicate the need to validate new AF functions via Power rather than Type I error control ones, as done so far. In this respect, we also offer software based on Big Data Technologies that makes rather easy the study of new word-frequency based AF functions in terms of Power. We also provide guidelines on the choice of , a key parameter, that turns out to be function-dependent rather than “universal”. Finally, we also identify an AF function, i.e. the , that performs very well, across values of , sequence lengths, and Alternative models. Despite the family, one of the most prominent AF families, has been the object of many investigations, the excellence of in terms of power has not been reported in previous studies.
Furthermore, this research points out the need for further studies in this area. The first asks for “power studies”, with models in which the motifs have gaps and mismatch rather than being exact copies. The second is related to the identification of proper theoretic and experimental settings in which to study the power of absent/present word based AF functions. Indeed, important functions such as Jaccard and its fast approximation Mash are part of this family, but even a quite established methodology, such as the one by Reinert et. al, is inadequate to characterize their power. Finally, it is very important to extend this type of study to additional families of AF functions, in particular the ones based on micro-alignments (see [10] and references therein).
Acknowledgements
All authors would like to thank the GARR Consortium for having made available a cutting edge OpenStack Virtual Datacenter for this research.
Funding
G.C., R.G. and U.F.P. are partially supported by GNCS Project 2019 “Innovative methods for the solution of medical and biological big data”. R.G. is also supported by MIUR-PRIN project “Multicriteria Data Structures and Algorithms: from compressed to learned indexes, and beyond” n. 2017WR7SHH. U.F.P. and F.P. are partially supported by Università di Roma - La Sapienza Research Project 2020 “Algoritmi su grafi, limitazioni nel sequenziale e opportunità nel distribuito”. C.R. is supported by the Italian Association of Cancer Research (AIRC) (n. IG21837).
References
- [1] S. F. Altschul, W. Gish, W. Miller, E. W. Myers, and D. J. Lipman. Basic local alignment search tool. Journal of molecular biology, 215(3):403–410, 1990.
- [2] G. Benoit, P. Peterlongo, M. Mariadassou, E. Drezen, S. Schbath, D. Lavenier, and C. Lemaitre. Multiple comparative metagenomics using multiset k-mer counting. PeerJ Computer Science, 2:1, 2016.
- [3] G. Bernard, C. X. Chan, and M. A. Ragan. Alignment-free microbial phylogenomics under scenarios of sequence divergence, genome rearrangement and lateral genetic transfer. Scientific reports, 6:28970, 2016.
- [4] U. Ferraro Petrillo, F. Palini, G. Cattaneo, and R. Giancarlo. Alignment-free Genomic Analysis via a Big Data Spark Platform. Bioinformatics, 01 2021. btab014.
- [5] R. Giancarlo, S. E. Rombo, and F. Utro. Epigenomic k-mer dictionaries: Shedding light on how sequence composition influences nucleosome positioning in vivo. Bioinformatics, 31:2939–2946, 2015.
- [6] R. Giancarlo, S. E. Rombo, and F. Utro. In vitro versus in vivo compositional landscapes of histone sequence preferences in eucaryotic genomes. Bioinformatics, 34:3454–3460, 2018.
- [7] D. Gusfield. Algorithms on strings, trees, and sequences: computer science and computational biology. Cambridge University Press, New York, NY, USA, 1997.
- [8] G.-D. Huang, X.-M. Liu, T.-L. Huang, and L.-C. Xia. The statistical power of k-mer based aggregative statistics for alignment-free detection of horizontal gene transfer. Synthetic and Systems Biotechnology, 4:150–156, 2019.
- [9] A. Jain and R. Dubes. Algorithms for Clustering Data. Prentice-Hall, Engelwood Cliffs, 1988.
- [10] C.-A. Leimeister, S. Sohrabi-Jahromi, and B. Morgenstern. Fast and accurate phylogeny reconstruction using filtered spaced-word matches. Bioinformatics, 33:971–979, 2017.
- [11] X. Liu, L. Wan, J. Li, G. Reinert, M. S. Waterman, and F. Sun. New powerful statistics for alignment-free sequence comparison under a pattern transfer model. Journal of theoretical biology, 284:106–116, 2011.
- [12] Y. Y. Lu, K. Tang, J. Ren, J. A. Fuhrman, M. S. Waterman, and F. Sun. CAFE: aCcelerated Alignment-FrEe sequence analysis. Nucleic Acids Research, 45(W1):W554–W559, 05 2017.
- [13] B. B. Luczak, B. T. James, and H. Z. Girgis. A survey and evaluations of histogram-based statistics in alignment-free sequence comparison. Briefings in Bioinformatics, 20(4):1222–1237, 12 2017.
- [14] B. D. Ondov, T. J. Treangen, P. Melsted, A. B. Mallonee, N. H. Bergman, S. Koren, and A. M. Phillippy. Mash: fast genome and metagenome distance estimation using minhash. Genome Biology, 17:132, 2016.
- [15] G. Reinert, D. Chew, F. Sun, and M. S. Waterman. Alignment-free sequence comparison (I): statistics and power. Journal of Computational Biology, 16(12):1615–1634, 2009.
- [16] T. F. Smith and M. S. Waterman. Identification of common molecular subsequences. Journal of molecular biology, 147(1):195–197, 1981.
- [17] K. Song, J. Ren, G. Reinert, M. Deng, M. S. Waterman, and F. Sun. New developments of alignment-free sequence comparison: measures, statistics and next-generation sequencing. Briefings in Bioinformatics, 15(3):343–353, 09 2013.
- [18] K. Song, J. Ren, G. Reinert, M. Deng, M. S. Waterman, and F. Sun. New developments of alignment-free sequence comparison: measures, statistics and next-generation sequencing. Briefings in Bioinformatics, 15:343–353, 2013.
- [19] F. Utro, D. E. Platt, and L. Parida. A quantitative and qualitative characterization of k-mer based alignment-free phylogeny construction. In M. Bartoletti, A. Barla, A. Bracciali, G. W. Klau, L. Peterson, A. Policriti, and R. Tagliaferri, editors, Computational Intelligence Methods for Bioinformatics and Biostatistics, pages 19–31, Cham, 2019. Springer International Publishing.
- [20] S. Vinga and J. Almeida. Alignment-free sequence comparison - a review. Bioinformatics, 19:513–523, 2003.
- [21] L. Wan, G. Reinert, F. Sun, and M. S. Waterman. Alignment-free sequence comparison (II): theoretical power of comparison statistics. Journal of Computational Biology, 17:1467–1490, 2010.
- [22] A. Zielezinski, H. Z. Girgis, G. Bernard, C.-A. Leimeister, K. Tang, T. Dencker, A. K. Lau, S. Röhling, J. J. Choi, M. S. Waterman, M. Comin, S.-H. Kim, S. Vinga, J. S. Almeida, C. X. Chan, B. T. James, F. Sun, B. Morgenstern, and W. M. Karlowski. Benchmarking of alignment-free sequence comparison methods. Genome Biology, 20(1):144, 2019.
See pages - of sm.pdf