Bubble lifetimes in DNA gene promoters and their mutations affecting transcription
Abstract
Relative lifetimes of inherent double stranded DNA openings with lengths up to ten base pairs are presented for different gene promoters and corresponding mutants that either increase or decrease transcriptional activity, in the framework of the Peyrard-Bishop-Dauxois model. Extensive microcanonical simulations are used, with energies corresponding to physiological temperature. The bubble lifetime profiles along the DNA sequences demonstrate a significant reduction of the average lifetime at the mutation sites when the mutated promoter decreases transcription, while a corresponding enhancement of the bubble lifetime is observed in the case of mutations leading to increased transcription. The relative difference of bubble lifetimes between the mutated and the wild type promoters at the position of mutation varies from 20% to more than 30% as the bubble length is decreasing.
I Introduction
As more and more research is carried out on DNA functional activity, there is increased evidence that local base pair fluctuational openings may be one important factor in the process of transcription sobel ; Choi2004 ; Alexandrov2010 . Hydrogen bond vibrations and local disruptions, leading to transient separations of complementary strands, have been experimentally studied in different time scales imino87 ; Krichevsky2003 ; HippelMarcus2013 ; Jimenez2016 . Furthermore, various theoretical models have addressed dynamical and statistical properties of base pair stretchings in the double helix Yakushevich ; Peyrard1989 ; PBD ; DPB93 ; DP95 ; Barbi99 ; Cocco00 ; Metzler03 ; bubble07 ; falo10 ; Manghi2016 ; zoli18 ; zoli21 .
An apparent correlation between thermally induced large local openings (“bubbles”) and functional sites along the DNA sequence that are relevant for transcription initiation has been noted in a number of investigations Choi2004 ; Kalosakas2004 ; Alexandrov2009 ; Alexandrov2010 ; Apostolaki2011 ; faloPRE12 ; huangJBE ; Nowak13 ; faloPLOS , where it has been found that bubbles form with a greater probability at transcriptionally active sites than elsewhere along the promoter sequence. These works have considered thermal equilibrium or out-of-equilibrium dynamical properties of various gene promoter segments, using the Peyrard-Bishop-Dauxois (PBD) coarse-grained model PBD of DNA or extensions of this model.
Examining the dynamics of DNA promoters through Langevin molecular dynamics simulations, the lifetimes of these bubble openings have been probed as potential indicators for the initiation of transcription Alexandrov2006 ; Alexandrov2009 ; Alexandrov2010 . In particular, the adeno-associated viral (AAV) P5 promoter was shown to exhibit relatively long-lived bubbles with characteristic lengths near the transcription start site (TSS) Alexandrov2006 . A broader study of an array of mammalian gene promoters showed the same dynamical signatures; bubbles form with greater frequency and longer lifetimes at active sites in the promoter and particularly at the TSS Alexandrov2009 . The importance of the lifetime as an indicator of transcriptional activity was underlined by the findings that long-lived bubbles formed in functional regions, even when the occurrence probability at those regions was not exceptional. This motif of dynamics-driven transcription was further established by the detailed analysis of the SCP1 so-called “superpromoter”, which revealed that not only are long-lived bubbles at the TSS correlated with transcriptional activity, but mutations which significantly reduce the transcription also decrease the occurrence and the lifetimes of bubbles at the TSS Alexandrov2010 . Consequently there is a strong interest in further investigating this relationship between bubble lifetimes and transcription, using extensive numerical simulations under various conditions of the examined system in order to deepen our understanding of dynamical features with a possible biological role.
In this work we present a detailed analysis of inherent bubble lifetimes (i.e. without any environmental factors or effects from the surroundings, depending only on constant-energy fluctuations in the framework of a microcanonical evolution) across the sequence of different promoters – a viral, a bacterial, and a very strong artificial promoter – as well as comparisons with a corresponding mutant in each case that is known to either reduce or enhance transcriptional activity. Following a recent study of bubble lifetime distributions Hillebrand2020 , we use the PBD model PBD of DNA with sequence-dependent stacking parameters Alexandrov2009ePBD , to perform constant-energy simulations (complementing earlier works implementing Langevin dynamics Alexandrov2006 ; Alexandrov2009 ; Alexandrov2010 ), in order to more closely probe the internal characteristic times of double strand openings without having to impose artificial time scales through arbitrary friction coefficients.
We examine three promoters, the viral AAV P5 promoter, the bacterial Lac operon promoter, and the artificial SCP1 superpromoter (see Section II for their sequences), as well as one particular mutant of each case exhibiting altered transcriptional activity. The P5 promoter is critical to the genetic activity of AAV DNA, by directing relevant expression patterns Tratschin1984 . We also consider a double mutation of this promoter, resulting in loss of transcription activity Choi2004 . The Lac operon promoter is a thoroughly studied regulatory region in the E. coli K-12 bacterium. We investigate the wild type as well as the mutant Lac UV5, which exhibits increased transcription with no need of activator action Gilbert1976 . The final promoter is the artificially constructed SCP1 superpromoter, designed to have exceptional transcriptive behavior Juven2006 . The mutant studied here is the m1SCP1 sequence, resulting in reduced transcription Alexandrov2009 .
The next Section II introduces the PBD model, presents the studied promoter sequences, and outlines the methods used in the analysis of the simulation data. Section III lays out the results of our investigation, including a discussion of the relative lifetime changes in the mutated promoters. Finally, Section IV summarises and concludes our work.
II Modelling and Numerical Methods
In the PBD framework considered here, a coarse-grained model is used for the base pair stretchings and the force fields of the system are approximated through appropriate analytical potentials. The PBD model provides a Hamiltonian for the dynamics, with the on-site intra-base-pair interaction accounted for by a Morse potential ,
| (1) |
where represents the relative displacement from equilibrium of the bases within the base pair of a DNA sequence. The site-dependent parameters and distinguish adenine-thymine (A-T) and guanine-cytosine (G-C) base pairs along the sequence.
An anharmonic coupling models the stacking energy,
| (2) |
The total Hamiltonian of a DNA sequence having base pairs reads
| (3) |
where are the conjugate momenta to the canonical displacements . Periodic boundary conditions have been considered here.
Apart from the sequence-dependent spring constants of the stacking energy that have been obtained from Ref. Alexandrov2009ePBD , all other parameter values we use are from Ref. Campa1998 : amu for the base pair reduced mass, eV, Å-1 and eV, Å-1 for G-C and A-T base pairs respectively in the Morse potential, and , Å-1. These values have been fitted to successfully reproduce specific melting curves in short oligonucleotides. They have been extensively used in a number of prior works (for example in Refs. Choi2004 ; Kalosakas2004 ; Voulgarakis2004 ; Ares2005 ; Alexandrov2006 ; Kalosakas2006 ; nvoul ; RaptiEPL ; Ares2007 ; Choi2008 ; Alexandrov2009 ; Kalosakas2009 ; Apostolaki2011 ; Traverso2015 ; Hillebrand2019 ; Alexandrov2010 ; Nowak13 ). The parameters of Eq. (2) are taking on sequence specific values (see Alexandrov2009ePBD ; Hillebrand2020 ) and they have been shown to accurately reproduce peculiar denaturation transition temperatures exhibited by homogeneous and periodic DNA oligonucleotides Alexandrov2009ePBD .
The DNA promoters considered here are presented below. For clarity, only one strand of each sequence is shown, while the complementary strand is implied. The TSS is explicitly indicated as it is preceded by (+1).
-
•
A 69 base pair segment of the viral AAV P5 promoter:
5’-GTGGCC ATTTAGGGTA TATATGGCCG AGTGAGCGAG CAGGATCTCC (+1)ATTTTGACCG CGAAATTTGA ACG-3’ -
•
A 129 base pair segment of the bacterial Lac operon promoter:
5’-GAAAGCGGG CAGTGAGCGC AACGCAATTA ATGTGAGTTA GCTCACTCAT TAGGCACCCC AGGCTTTACA CTTTATGCTT CCGGCTCGTA TGTTGTGTGG (+1)AATTGTGAGC GGATAACAAT TTCACACAGG-3’ -
•
A 81 base pair segment of the artificial superpromoter SCP1:
5’-GTACTT ATATAAGGGG GTGGGGGCGC GTTCGTCCTC (+1)AGTCGCGATC GAACACTCGA GCCGAGCAGA CGTGCCTACG GACCG-3’
Additionally to these promoters, one mutant is also examined for each case: The mutated AAV P5 promoter is obtained by changing the base pairs at sites and from A-T and T-A to G-C and C-G, respectively Choi2004 ; Kalosakas2004 . In the Lac UV5 mutant the sites and of Lac operon are changed from G-C and T-A base pairs both to A-T Gilbert1976 . Finally, in the mutant m1SCP1 of the superpromoter SCP1 the base pairs at sites and change from T-A and C-G to C-G and G-C, respectively, and the sites and change both from A-T to G-C Alexandrov2009 .
We have made extensive constant-energy molecular dynamics simulations using the Hamiltonian of Eq. (3) and periodic boundary conditions. Random initial conditions were implemented, having a fixed energy corresponding to a temperature of 310 K, and the equations of motion were evolved using a symplectic integrator, namely the symplectic Runge-Kutta-Nystrøm fourth order integration scheme SRKNb6 Blanes2002 . The threshold values of Å and Å are used in order to consider openings of A-T and G-C base pairs respectively, which are derived through the characteristic lengths of the corresponding Morse potential and are also consistent with the requirement that 50% of the DNA chain is open at the melting transition Hillebrand2020 . The system is evolved for 10 ns to provide thorough thermalisation, and then base pair displacement data are recorded every picosecond for the next nanosecond. We note that the timescales here are for our coarse-grained model.
From this displacement data, the bubble probabilities and lifetime distributions can be calculated (see Ref. Hillebrand2020 for the details of the procedure). Then average bubble lifetimes are computed from the corresponding lifetime distributions. In addition to examining bubbles with a fixed length of base pairs (as in Ref. Hillebrand2020 ), we also take here a more flexible approach of allowing the size of the bubble to fluctuate by considering bubbles of length for some value of , starting at a given site. In order to reduce potential issues arising from statistical inadequacy due to the rarity of bubble occurrence, for the calculation of bubble lifetimes we have used 10,000 simulations with different random initial conditions for each of the considered promoter sequences.
III Average Bubble Lifetimes in the Wild Type and Mutant Promoters
We are interested here in the profiles of the average lifetimes for bubbles with either a fixed length or length , along the promoter sequences, as well as in the changes of these profiles with the respective mutations that affect the transcriptional activity. To quantify the effect of the mutations, which some of them reduce transcription while others enhance transcription, we consider the sequence dependence of the relative difference in average bubble lifetimes between the mutated and the wild type promoter, calculated as
| (4) |
where corresponds to the average lifetime in the mutated promoter and in the wild type. Using the relative difference we can clearly identify regions along the sequence where the mutations increase or decrease the overall bubble lifetimes, as these areas will exhibit positive or negative relative differences respectively.
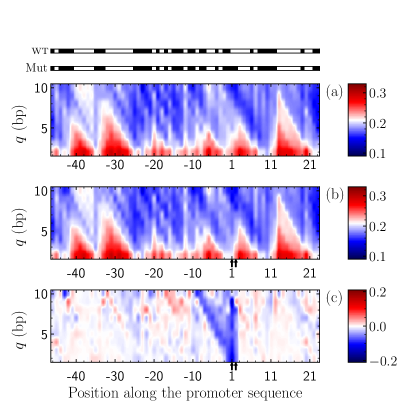
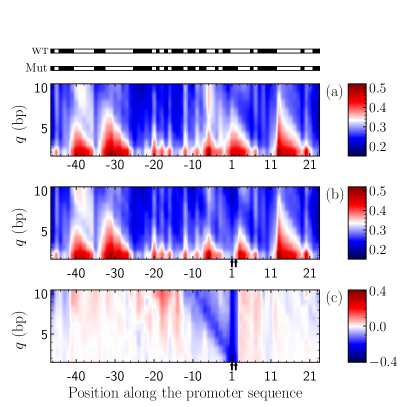
Figure 1 shows the profiles of the average bubble lifetimes in the AAV P5 promoter [Fig. 1(a)] and the mutated P5 promoter [Fig. 1(b)], as well as the relative difference between the two variants [Fig. 1(c)], for different bubble lengths , with ranging from 1 up to 10 base pairs. We see that there are regions of more persistent bubbles both upstream and downstream of the TSS, as well as at the TSS [Fig. 1(a)], correlated with the location of A/T rich bands along the sequence (see the horizontal bars above the plots). The effect of the TSS mutation, changing two A-T and T-A base pairs to G-C and C-G respectively that leads to loss of transcriptional activity, shows a clear reduction of the bubble lifetime in this region [Fig. 1(b)], which is emphasised in the plot of the relative difference in Fig. 1(c). Note that the color scale in Fig. 1(c), and all the relative difference plots shown in the other figures below, is set symmetrically so that white regions correspond to zero relative difference, red regions to a positive relative difference (i.e. longer lifetimes in the mutated promoter) and blue regions to a negative relative difference. Here we see a roughly 10% decrease in bubble lifetimes for bubbles starting or ending near the mutation sites (which coincide to the TSS), significantly reducing the lifetime of bubbles with lengths up to 10 base pairs in this region.
We have also considered bubbles of length for different values of up to 10 base pairs, which allow for fluctuations of the length of the bubble without effectively destroying and recreating new bubbles constantly in the numerical simulations. These results for the P5 promoter and the considered mutation are shown in Fig. 2, in the same way as the results of fixed length bubbles presented in Fig. 1. It is immediately apparent that the overall lifetimes are longer when the strictness of the fixed bubble length criterion is relaxed, with the longest average bubble lifetimes around ps [Fig. 2(a) and (b)] for fluctuation-allowed bubbles as compared to ps in the fixed-length case [Fig. 1(a) and (b)]. The statistics of the bubble lifetime profile is better in this case since all bubbles longer than length now contribute to the data at each length. The same trends as in Fig. 1 are also apparent in Fig. 2. The effect of the mutation is to significantly shorten the lifetimes of bubbles near and immediately upstream of the TSS, without affecting the lifetimes along the rest of the sequence. However, Fig. 2(c) shows an even stronger reduction in the average lifetimes of bubbles at the TSS due to the mutation, at levels larger than 20% reaching up to 30% as decreases from 10 to 2 base pairs, suggesting a correlation between significant changes in bubble lifetimes and altered transcriptional activity.
As the base pair opening thresholds considered here are relatively small as compared to previous works, the multi-peaked bubble’s inherent lifetime profiles shown in Figs. 1 and 2 for the AAV P5 promoter and its mutant are more reminiscent of the equilibrium average bubble probabilities RaptiEPL , than the out-of-equilibrium probability profiles of much larger amplitude bubbles Kalosakas2004 ; Alexandrov2006 , or even the bubble lifetime distributions obtained through Langevin dynamics Alexandrov2006 . However, all these works demonstrate the significant reduction of the bubble probability or relative lifetime at the position of the mutation in the TSS.
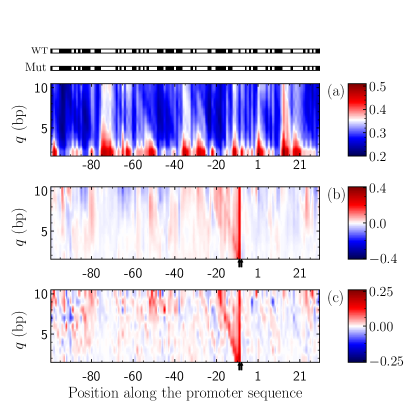
Turning to the bacterial Lac operon promoter, we present the lifetimes for bubbles of length , as well as the relative difference between the wild type and mutant Lac UV5 in Fig. 3. The bands of longer-lived bubbles are once again correlated with A/T-dense regions of the sequence [Fig. 3(a)], including the region around the TSS. While there is no prior study on bubble lifetimes in the Lac operon, as in the previous case the obtained lifetime profile is in accordance with equilibrium base pair opening probabilities in this promoter calculated through Monte Carlo simulations. In particular, the main peaks of the equilibrium bubble opening propensity have been observed Apostolaki2011 in (i) a large upstream region extending from around up to , (ii) near the two binding sites of the polymerase subunit factor at around (a larger peak) and in the region from up to TSS (a smaller one), and finally (iii) downstream in the region from +10 up to +20.
In contrast to the AAV P5 mutation examined above which inhibits transcriptional activity, the Lac UV5 mutation is known to strengthen the promoter Gilbert1976 ; Reznikoff1976 . Figure 3(b) shows the relative difference for bubbles of length , while Fig. 3(c) gives the corresponding profile for fixed bubble length . We see that at the mutations site, which is located within the -10 element of the promoter (the one of the two binding sites of the factor), Lac UV5 exhibits bubbles that tend to last longer, from 20% up to more than 30% in the case of depending on the bubble length. As previously, the relative difference is smaller, up to 25%, for the fixed length bubbles. Similarly to the bubble lifetime enhancement, there is an increase of the equilibrium opening probability at this region in Lac UV5 as compared to the wild type profile Apostolaki2011 . Therefore we see that the transcription-strengthening mutation results in longer-living bubbles at the transcriptionally functional binding site of factor.
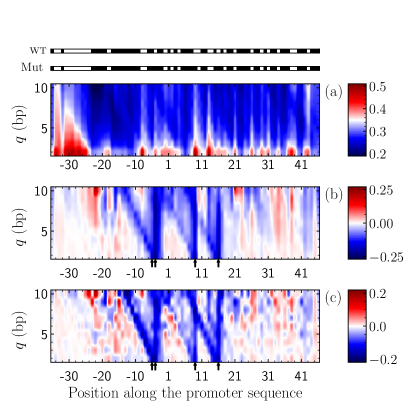
Finally, the profile of the average bubble lifetimes for the SCP1 superpromoter is shown in Fig. 4(a) for bubbles with length , while the relative differences of average bubble lifetimes between this promoter and its mutation m1SCP1 Alexandrov2010 are depicted in Fig. 4(b) for the case of bubbles with variable length and Fig. 4(c) for bubbles with fixed length . The equilibrium probabilities for large amplitude bubbles show a large peak at the region further upstream from the position and another smaller peak around the TSS Alexandrov2010 . In agreement with these observations are the dominant feature around in our average lifetime profiles as well as the peak around TSS [Fig. 4(a)]. However, regarding small amplitude bubbles, as those considered in our case, there are additional peaks further downstream of the TSS, that are not present for bubbles with amplitude larger than 3.5 Å in equilibrium Alexandrov2010 .
A primary finding obtained by Langevin dynamics simulations of SCP1 superpromoter was a region immediately downstream from the TSS (located between +1 and +10) where large long-lived bubbles tended to form, while the introduction of the transcription-inhibiting mutations of m1SCP1 led to the destruction of this dominant peak Alexandrov2010 . Our results also show a substantial decrease in the average bubble lifetimes at this region downstream from the TSS, that becomes more clear for larger bubble lengths especially in the case [Fig. 4(b)]. Once more, the relative differences of the average bubble lifetimes around the mutated sites show a decrease, more than 20% for smaller lengths when bubbles of fluctuating ends are considered ( ), for the m1SCP1 mutant that suppress transcription as compared to the SCP1 superpromoter.
IV Conclusions
Using the Peyrard-Bishop-Dauxois coarse-grained model with sequence dependent stacking interactions for the description of base pair openings in DNA and efficient numerical techniques, we have performed extended microcanonical simulations to investigate average bubble lifetime profiles along the sequence of three different promoters, the viral AAV P5, the bacterial Lac operon, and the artificial SCP1 superpromoter, as well as one mutation for each promoter. The time scales of the inherent DNA double strand transient separations have been probed in the framework of this model, with no artificial time scales imposed through arbitrary friction coefficient, and using a physically motivated base-pair-dependent threshold value for considering base pairs to be open. The inherent bubble lifetimes, for relatively small amplitude bubbles of the order of tenths of Å, in our constant energy simulations are in the subpicosecond time scale, as opposed to Langevin fluctuational dynamics computations revealing bubble lifetimes of the order of picosecond for larger amplitude bubbles of a few Å.
We found that transcription-inhibiting mutations in the case of the AAV P5 and SCP1 promoters resulted in significant reductions of bubble lifetimes around the transcriptionally relevant mutated sites, while transcription-boosting mutations of the Lac operon promoter at a transcription factor binding site showed significant enhancement of the bubble lifetimes. The corresponding negative or positive relative differences of the average bubble lifetimes between the mutated and the wild type promoter at the position of mutations range from 20% for larger bubble lengths up to more than 30% for shorter ones.
Acknowledgments
M. H. acknowledges support by the National Research Foundation (NRF) of South Africa (Grant Numbers: 129630). G. K. and Ch. S. were supported by the Erasmus+/International Credit Mobility KA107 program. We thank the Center for High Performance Computing of South Africa for providing computational resources for this project.
References
- (1) H.M. Sobell, Proc. Natl Acad. Sci. 82, 5328 (1985).
- (2) C.H. Choi, G. Kalosakas, K.Ø. Rasmussen, M. Hiromura, A. Bishop, and A. Usheva, Nucleic Acids Res. 32, 1584 (2004).
- (3) B.S. Alexandrov, V. Gelev, S.W. Yoo, L.B. Alexandrov, Y. Fukuyo, A.R. Bishop, K.Ø. Rasmussen, and A. Usheva, Nucleic Acids Res. 38, 1790 (2010).
- (4) M. Gueron, M. Kochoyan, and J.-L. Leroy, Nature 328, 89 (1987).
- (5) G. Altan-Bonnet, A. Libchaber, and O. Krichevsky, Phys. Rev. Lett. 90, 138101 (2003).
- (6) C. Phelps, W. Lee, D. Jose, P.H. von Hippel, and A.H. Marcus, Proc. Natl. Acad. Sci. 110, 17320 (2013).
- (7) M. González-Jiménez, G. Ramakrishnan, T. Harwood, A.J. Lapthorn, S.M. Kelly, E.M. Ellis, K. Wynne, Nat. Comms. 7, 11799 (2016).
- (8) L.V. Yakushevich, Nonlinear Physics of DNA, 2nd Ed., Wiley-VCH (2004).
- (9) M. Peyrard and A.R. Bishop, Phys. Rev. Lett. 62, 2755 (1989).
- (10) T. Dauxois, M. Peyrard, and A.R. Bishop, Phys. Rev. E 47, R44 (1993).
- (11) T. Dauxois, M. Peyrard, and A.R. Bishop, Phys. Rev. E 47, 684 (1993).
- (12) T. Dauxois and M. Peyrard, Phys. Rev. E 51, 4027 (1995).
- (13) M. Barbi, S. Cocco, and M. Peyrard, Phys. Lett. A 253, 358 (1999).
- (14) S. Cocco and R. Monasson, J. Chem. Phys. 112, 10017 (2000).
- (15) A. Hanke and R. Metzler, J. Phys. A: Math. Gen. 36, L473 (2003).
- (16) D. Chatterjee, S. Chaudhury, and B.J. Cherayila, J. Chem. Phys. 127, 155104 (2007).
- (17) R. Tapia-Rojo, J.J. Mazo, and F. Falo, Phys. Rev. E 82, 031916 (2010).
- (18) M. Manghi and N. Destainville, Phys. Rep. 631, 1 (2016).
- (19) M. Zoli, J. Chem. Phys. 148, 214902 (2018).
- (20) M. Zoli, J. Chem. Phys. 154, 194102 (2021).
- (21) G. Kalosakas, K.Ø. Rasmussen, A.R. Bishop, C.H. Choi, and A. Usheva, Europhys. Lett. 68, 127 (2004).
- (22) B.S. Alexandrov, V. Gelev, S.W. Yoo, A.R. Bishop, K.Ø. Rasmussen, and A. Usheva, PLoS Comput. Biol. 5, e1000313 (2009).
- (23) A. Apostolaki and G. Kalosakas, Phys. Biol. 8, 026006 (2011).
- (24) R. Tapia-Rojo, D. Prada-Gracia, J.J. Mazo, and F. Falo, Phys. Rev. E 86, 021908 (2012).
- (25) H.-H. Huang and P. Lindblad, J. Biol. Eng. 7, 10 (2013).
- (26) K. Nowak-Lovato, L.B. Alexandrov, A. Banisadr, A.L. Bauer, A.R. Bishop, A. Usheva, F. Mu, E. Hong-Geller, K.Ø. Rasmussen, W.S. Hlavacek, B.S. Alexandrov, PLoS Comput. Biol. 9, e1002881 (2013).
- (27) R. Tapia-Rojo, J.J. Mazo, J.A. Hernandez, M.L. Peleato, M.F. Fillat and F. Falo, PLoS Comput. Biol. 10, e1003835 (2014).
- (28) B.S. Alexandrov, L.T. Wille, K.Ø. Rasmussen, A.R. Bishop and K.B. Blagoev, Phys. Rev. E 74, 050901 (2006).
- (29) M. Hillebrand, G. Kalosakas, Ch. Skokos, and A.R. Bishop, Phys. Rev. E 102, 062114 (2020).
- (30) B.S. Alexandrov, V. Gelev, Y. Monisova, L.B. Alexandrov, A.R. Bishop, K.Ø. Rasmussen, and A. Usheva, Nucleic Acids Res. 37, 2405 (2009).
- (31) J.D. Tratschin, I.L. Miller and B.J. Carter, J. Virol., 51, 611 (1984).
- (32) W. Gilbert, RNA Polymerase ed R Losick and M Chamberlin, New York: Cold Spring Harbor Laboratory, 193-205 (1976).
- (33) T. Juven-Gershon, S. Cheng and J.T. Kadonaga, Nat. Methods, 3, 917-922 (2006).
- (34) A. Campa and A. Giansanti, Phys. Rev. E 58, 3585 (1998).
- (35) N.K. Voulgarakis, G. Kalosakas, K.Ø. Rasmussen, and A.R. Bishop, Nano Lett. 4, 629 (2004).
- (36) S. Ares, N.K. Voulgarakis, K.Ø. Rasmussen, and A.R. Bishop, Phys. Rev. Lett. 94, 035504 (2005).
- (37) G. Kalosakas, K.Ø. Rasmussen, and A.R. Bishop, Chem. Phys. Lett. 432, 291 (2006).
- (38) N.K. Voulgarakis, A. Redondo, A.R. Bishop, and K. Ø. Rasmussen, Phys. Rev. Lett. 96, 248101 (2006).
- (39) Z. Rapti, A. Smerzi, K.Ø. Rasmussen, A.R. Bishop, C.H. Choi, and A. Usheva, Europhys. Lett. 74, 540 (2006).
- (40) S. Ares and G. Kalosakas, Nano Lett. 7, 307 (2007).
- (41) C.H. Choi, Z. Rapti, V. Gelev, M.R. Hacker, B. Alexandrov, E.J. Park, J.S. Park, N. Horikoshi, A. Smerzi, K.Ø. Rasmussen, A.R. Bishop, and A. Usheva, Biophys. J. 95, 597 (2008).
- (42) G. Kalosakas and S. Ares, J. Chem. Phys. 130, 235104 (2009).
- (43) J.J. Traverso, V.S. Manoranjan, A.R. Bishop, K.Ø. Rasmussen, and N.K. Voulgarakis, Sci.Rep. 5, 9037 (2015).
- (44) M. Hillebrand, G. Kalosakas, A. Schwellnus, Ch. Skokos, Phys. Rev. E 99, 022213 (2019).
- (45) S. Blanes and P. Moan, Journ. Comp. App. Math., 142, 313 (2002).
- (46) W.S. Reznikoff, Formation of the RNA polymerase-Lac promoter open complex RNA Polymerase, New York: Cold Spring Harbor Laboratory, 441-454 (1976).