The Sejong Open Cluster Survey (SOS). VII. A Photometric Study of the Young Open Cluster IC 1590
Abstract
Young open clusters are ideal laboratories to understand star formation process. We present deep and H photometry for the young open cluster IC 1590 in the center of the H II region NGC 281. Early-type members are selected from photometric diagrams, and low-mass pre-main sequence (PMS) members are identified by using H photometry. In addition, the published X-ray source list and Gaia astrometric data are also used to isolate probable members. A total of 408 stars are selected as members. The mean reddening obtained from early-type members is (s.d.). We confirm the abnormal extinction law for the intracluster medium. The distance modulus to the cluster determined from the zero-age main-sequence fitting method is mag (), which is consistent with the distance kpc from the recent Gaia parallaxes. We also estimate the ages and masses of individual members by means of stellar evolutionary models. The mode of the age of PMS stars is about . The initial mass function of IC 1590 is derived. It appears a steeper shape () than that of the Salpeter/Kroupa initial mass function for the high mass regime (). The signature of mass segregation is detected from the difference in the slopes of the initial mass functions for the inner () and outer region of this cluster. We finally discuss the star formation history in NGC 281.
1 Introduction
Young open clusters are the prime targets to study star formation processes. In particular, they make it possible to obtain distance, age, luminosity and mass function because their members have the same origin. These fundamental parameters are basic information to understand the formation and dynamical evolution of stellar clusters (Lada & Lada, 2003; Sagar et al., 1986). Young open clusters can also be used to verify stellar evolution theory in a wide range of stellar masses (Sung et al., 2013) and trace the spiral structure of the Galaxy as they are the building blocks of the Galactic disk (Carraro et al., 1998; Chen et al., 2003; Piskunov et al., 2006). In addition, young stars in open clusters are now being targeted for probing the formation processes of exoplanets and investigating properties of protoplanetary disks where planets could be formed (e.g., Alcalá et al., 2017; Eisner et al., 2018; Ansdell et al., 2020; Sanchis et al., 2020).
Stellar photometry is a basic tool to study the physical properties of young stellar systems Lim et al., 2015a; Abdelaziz et al., 2020. However, since most young open clusters are distributed in the Galactic plane, it is essential to discriminate cluster members from field interlopers to determine the reliable results. Classical T-Tauri stars (CTTSs) tend to show a prominent UV excess and H emission due to accretion activity, as well as a mid-infrared (MIR) excess from their warm circumstellar disks (Sung et al., 1997, 2009; Megeath et al., 2012; Lada, 1987). On the other hand, weak-line T-Tauri stars (WTTSs) have no or little accretion activity, but are still very bright in X-ray (Feigelson et al., 2003). Therefore, a photometric study complemented by multi-wavelength data is required to select genuine members.
The initial mass function (IMF), originally introduced by Salpeter (1955), is a fundamental tool for understanding star formation processes. If the IMF is universal in all star forming regions (SFRs), one can expect common factors to control the star formation process. Conversely, variety in the IMFs implies that the star formation process may be dependent on the physical properties of the natal cloud. The issue of the universality of the IMF is still an ongoing debate. Young open clusters are ideal targets for the study of the IMF across a wide range of stellar masses because their members are less affected by stellar evolution and dynamical evolution (Sung et al., 1997). The universality of the IMF can therefore be examined through the study of many young clusters.
Star formation can be regulated by massive stars in young stellar clusters. If massive stars (earlier than B3) are formed in a molecular cloud, HII regions can be created by their intense UV radiation. Strong stellar winds during their lifetime and subsequent supernova events could push out the surrounding material and may create a huge void-like structure called a superbubble or a galactic chimney. As the size of the superbubble increases, the accumulated material in the peripheral regions may induce subsequent star formation (Bally, 2008).
In this context, we have dedicated a homogeneous photometric survey of young open clusters in the Galaxy (Lim et al., 2011; Sung et al., 2013; Lim et al., 2014a, b, 2015a, 2015b; Sung et al., 2019). This is the seventh paper as part of this project. The target is IC 1590 in the center of the HII region NGC 281 (Sharpless 184, PacMan Nebula, and ) (Guetter & Turner, 1997). The most prominent feature of IC 1590 is the Trapezium-like system HD 5005 composed of four O-type stars (O4V((fc)), O9.7II-III, O8.5V(n), O9.5V) (Sota et al., 2011). These massive stars are the main ionizing sources of this HII region. The cluster is known to be young ( Myr), and 3 kpc away from the Sun (Guetter & Turner, 1997; Sharma et al., 2012; Sato et al., 2008).
The NGC 281 region has some interesting structures that are related to star formation history. The south-western region of IC 1590 is obscured by the adjoining molecular cloud NGC 281 West. Several X-ray sources and mid-IR sources, as well as an maser source are detected in the region. Lee & Jung (2003) studied NGC 281 West in and and found that the emission peak is very close to the maser source. Some indication of an outflow were also found near the maser source, implying ongoing star formation in NGC 281 West (Snell et al., 1990; Hodapp, 1994; Wu et al., 1996). An age sequence between IC 1590 and NGC 281 West was found. Class II young stellar objects (YSOs) are located close to the cluster, while Class 0/I YSOs and molecular clumps are distributed away from the cluster (Megeath & Wilson, 1997; Sharma et al., 2012). Furthermore, VLA continuum images reveal compact structures and edges at the north of the peak (Megeath & Wilson, 1997). Accordingly, NGC 281 West has been suggested as a SFR triggered by IC 1590. Another SFR, NGC 281 East, was found from observation by Elmegreen & Lada (1978). Three IRAS sources were embedded in this region, and a highly reddened star was found in the clump at the northern edge of NGC 281 East. Megeath & Wilson (1997) suggested that the star formation of NGC 281 East might have been started or strengthened by shocks. However, it is still necessary to probe the physical associations between the SFRs and IC 1590.
The IMF of IC 1590 has been investigated in several studies. Guetter & Turner (1997) obtained a shallow IMF () of IC 1590 from photoelectric and CCD photometry. From photometric and H spectroscopic observations by 105-cm Schmidt telescope, Sharma et al. (2012) also found the slope of IMF to be flatter () than those of the Salpeter/Kroupa IMF (; Salpeter, 1955; Kroupa, 2001). This shallow IMF implies that this SFR is a favorable site of massive star formation. However, these previous studies derived the IMF using bright stars ( by Guetter & Turner 1997; by Sharma et al. 2012). Their selection of low-mass PMS stars may be less complete due to the limited data. With our deep photometry, complemented by several archival datasets, it is possible to derive the IMF down to 1 . In addition, the recent Gaia Early Data Release 3 (EDR3; Gaia Collaboration et al. 2020) allows us to reliably select kinematic members. Therefore, the IMF of this cluster can be studied across a wide mass range.
The main scientific goals of this study are to derive the fundamental parameters of IC 1590 (reddening, distance, age, and the IMF) and to study the star formation process in this SFR. To achieve these aims, we conducted deep and H observations and investigated the properties of IC 1590 using new optical data and additional archival data. In Section 2, we describe our observations, data processing, and archival datasets. The member selection criteria are addressed in Section 3. In Section 4, the reddening and distance of IC 1590 are determined. The IMF is derived in Section 5. Finally, we discuss the triggered star formation in this SFR and the properties of some individual stars in Section 6 and summary in Section 7.
2 Observations and Archival Data
| \topruleFilter | Exposure time (s) | Seeing (′′) | |||
| Maidanak AZT-22 (2005. 8. 9) | |||||
| , | |||||
| , | |||||
| , | - | ||||
| , | - | ||||
| Kuiper (2011. 10. 31) | |||||
| , | |||||
| , | |||||
| , | - | ||||
| , | - | ||||
| H | , | - | |||
2.1 Optical Photometry
2.1.1 Maidanak AZT-22 Observations
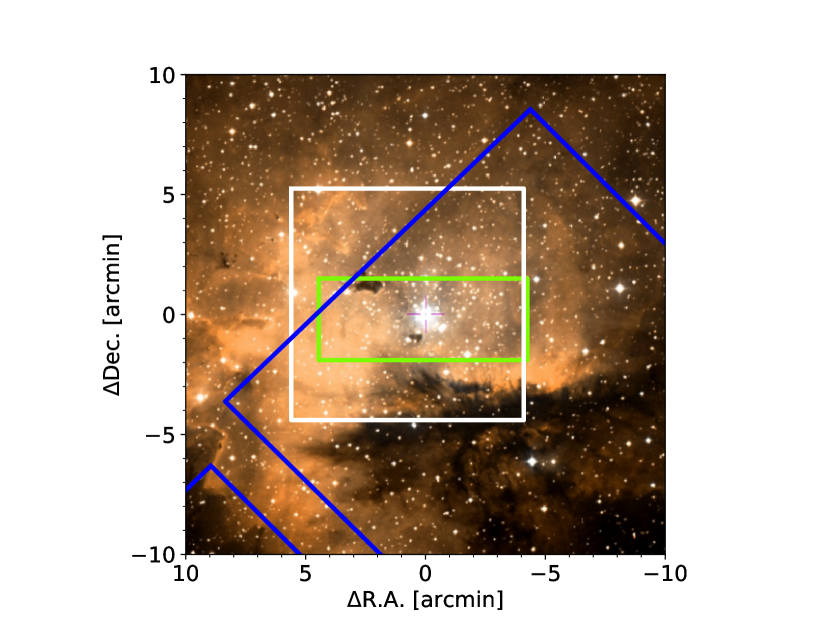
The CCD observations of the young open cluster IC 1590 were conducted on 2005 August 9, using the AZT-22 telescope with the SITe CCD () at the Maidanak Astronomical Observatory in Uzbekistan. The typical seeing was . We used two sets of exposure times for each band to cover both bright and faint stars. To determine the atmospheric extinction coefficients and photometric zero-points, we also observed several SAAO standard stars (Menzies et al., 1991) in the Landolt standard fields and additional standard stars with extremely blue and red colors (Kilkenny et al., 1998). The transformation relation to the standard system is addressed in Lim et al. (2009). The field of view (FoV) of the Maidanak observations is shown in Figure 1 (green rectangle). We summarize our observation in Table 1.
2.1.2 Kuiper 61′′ Telescope of Steward Observatory
We performed additional and H observations with the Kuiper Telescope () and Mont4k CCD of the Steward Observatory at Mt. Bigelow in Arizona on 2011 October 31. The pixel scale is in a binning mode, and the FoV is about . The exposure times and seeing for each filter are summarized in Table 1. A number of standard stars from the same catalogues used in the previous section were observed. Transformation to the standard system is detailed in the Appendix of Lim et al. (2015a).
| ID | R.A. | Dec. | H 11H means H index (H) defined by Sung & Bessell (2000). | H emission 22H emission stars are represented as H and H emission candidates are represented as h. | ||||||||||||
|---|---|---|---|---|---|---|---|---|---|---|---|---|---|---|---|---|
| [] | [] | [mag] | [mag] | [mag] | [mag] | [mag] | [mag] | [mag] | [mag] | [mag] | [mag] | [mag] | [mag] | |||
| 21 | 0 52 20.9 | +56 37 49.6 | 17.28 | 18.46 | 1.18 | 0.87 | 0.21 | -0.12 | 0.01 | 0.01 | 0.01 | 0.01 | 0.02 | 0.05 | 5 4 4 3 2 1 | |
| 22 | 0 52 21.2 | +56 38 17.3 | 18.21 | 20.30 | 2.09 | 1.79 | - | -0.74 | 0.01 | 0.04 | 0.04 | 0.08 | - | 0.09 | 3 2 2 2 0 1 | H |
| 23 | 0 52 21.5 | +56 35 57.3 | 17.20 | 19.45 | 2.25 | 1.63 | - | -1.10 | 0.01 | 0.01 | 0.01 | 0.04 | - | 0.04 | 5 2 2 2 0 1 | H |
| 24 | 0 52 21.7 | +56 39 3.5 | 17.30 | 18.75 | 1.45 | 1.21 | 0.80 | 0.09 | 0.01 | 0.01 | 0.01 | 0.02 | 0.06 | 0.05 | 5 3 3 2 2 1 | |
| 25 | 0 52 21.8 | +56 37 39.5 | 19.04 | 20.45 | 1.41 | 1.17 | - | - | 0.01 | 0.04 | 0.04 | 0.07 | - | - | 3 2 2 2 0 0 | |
| 26 | 0 52 21.9 | +56 39 16.9 | 18.39 | 20.71 | 2.32 | - | - | - | 0.02 | 0.04 | 0.04 | - | - | - | 3 2 2 0 0 0 | |
| 27 | 0 52 22.0 | +56 39 13.2 | 16.83 | 19.23 | 2.40 | 1.70 | - | -0.41 | 0.02 | 0.01 | 0.02 | 0.03 | - | 0.06 | 5 2 2 2 0 1 | |
| 28 | 0 52 22.1 | +56 37 41.6 | 18.74 | 21.28 | 2.54 | - | - | - | 0.04 | 0.06 | 0.07 | - | - | - | 3 2 2 0 0 0 | |
| 29 | 0 52 22.1 | +56 36 52.2 | 15.88 | 16.84 | 0.96 | 0.76 | 0.20 | 0.06 | 0.01 | 0.01 | 0.01 | 0.01 | 0.01 | 0.01 | 5 4 4 4 4 2 | |
| 30 | 0 52 22.3 | +56 35 53.6 | 19.55 | 21.00 | 1.45 | 0.79 | - | - | 0.07 | 0.06 | 0.09 | 0.11 | - | - | 2 2 2 1 0 0 |
Note. — is the primary atmospheric extinction coefficient, is the secondary atmospheric extinction coefficient, is the photometric zero-point from Lim et al. (2009).
2.1.3 Data Reduction and Comparison
Pre-processing was performed using the IRAF111IRAF is developed and distributed by the National Optical Astronomy Observatories, which is operated by the Association of Universities for Research in Astronomy under a cooperative agreement with the National Science Foundation./CCDRED package to remove the instrumental artifacts. The brightness of sources were measured applying a point-spread function (PSF) fitting method to the target images with IRAF/DAOPHOT (Stetson, 1987). A total of 731 stars and 1473 stars were detected from the Maidanak AZT-22 observations and the Kuiper 61′′ telescope observations, respectively. These data were transformed to the SAAO standard system as described in Lim et al. (2009) and Lim et al. (2015a). The photometric data of stars in common between these datasets were obtained from their weighted mean values, where the inverse of squared photometric errors were adopted as the weight. We present the photometric uncertainties in Figure 5.
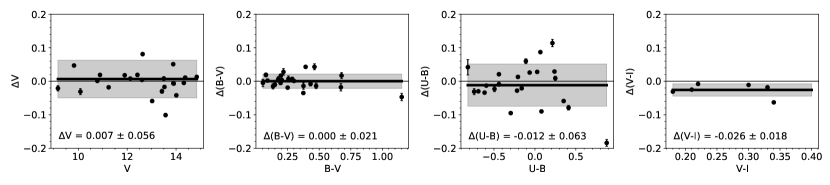
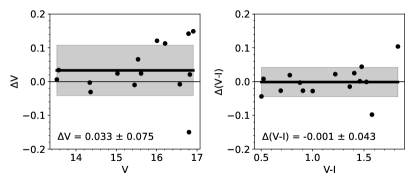
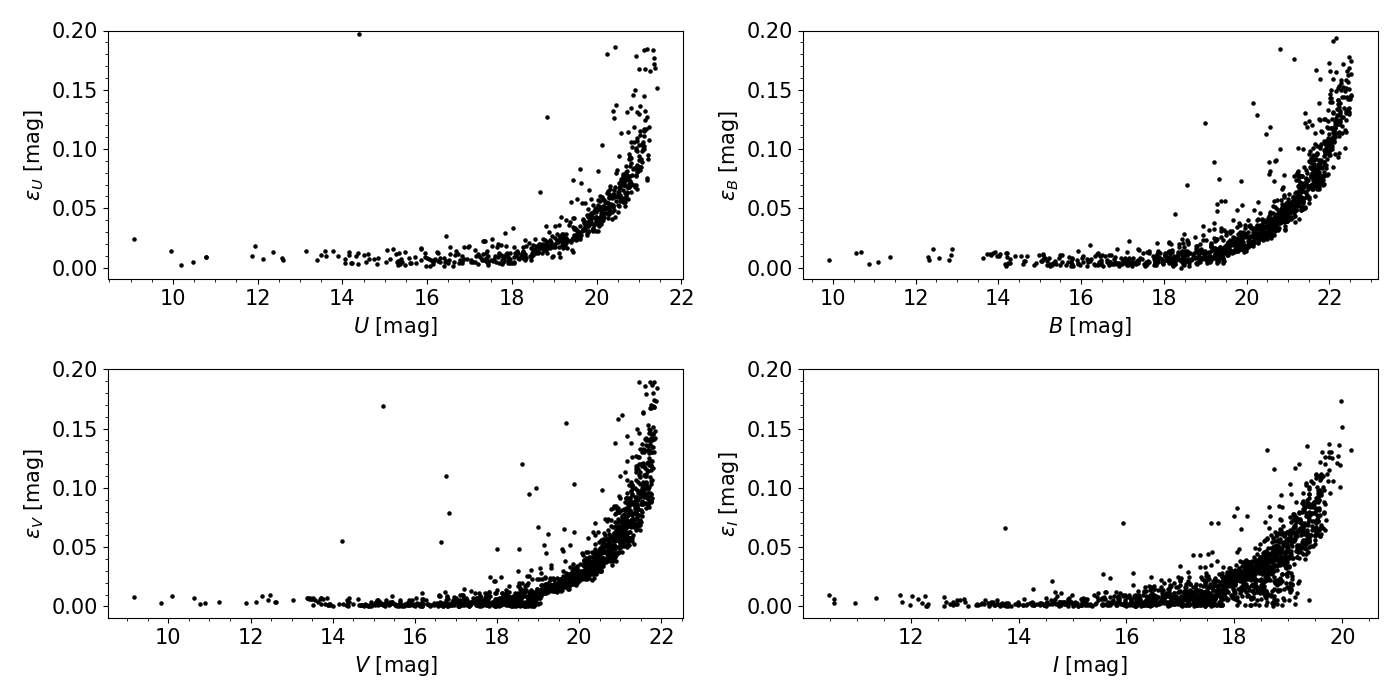
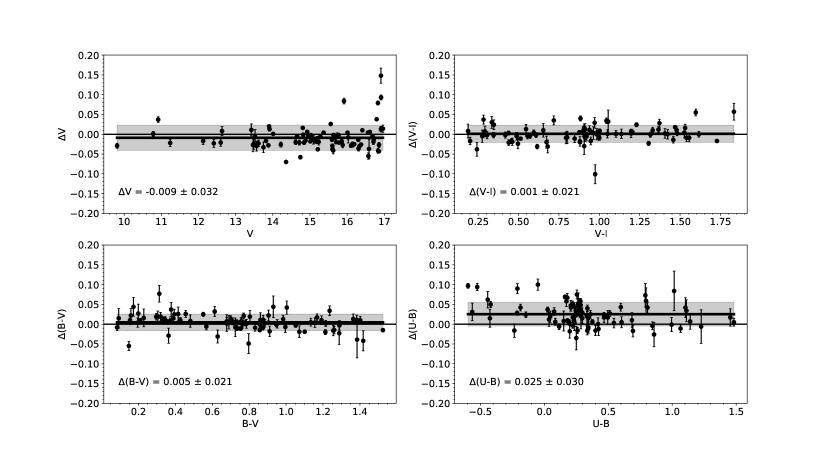
Figure 2 shows the difference between the two datasets. These two photometric datasets show a very good consistency. The mean difference is less than 0.01 mag for , , and , and about 0.025 mag for . Figure 3 shows the difference between our optical data and the photoelectric data of Guetter & Turner (1997). We excluded known variables and emission-line stars in the comparison. The differences are less than 0.01 mag for and about 0.01 mag for . The difference for is about 0.03 mag, which is consistent with the expected error in the photoelectric photometry of Guetter & Turner (1997) which is vulnerable due to short-term variations in the sky conditions. Figure 4 shows the difference between the CCD photometric data of Sharma et al. (2012) and ours. The mean differences are about 0.03 mag in the band and less than 0.01 mag in . Our data are also well consistent with the previous CCD photometric data of Sharma et al. (2012).
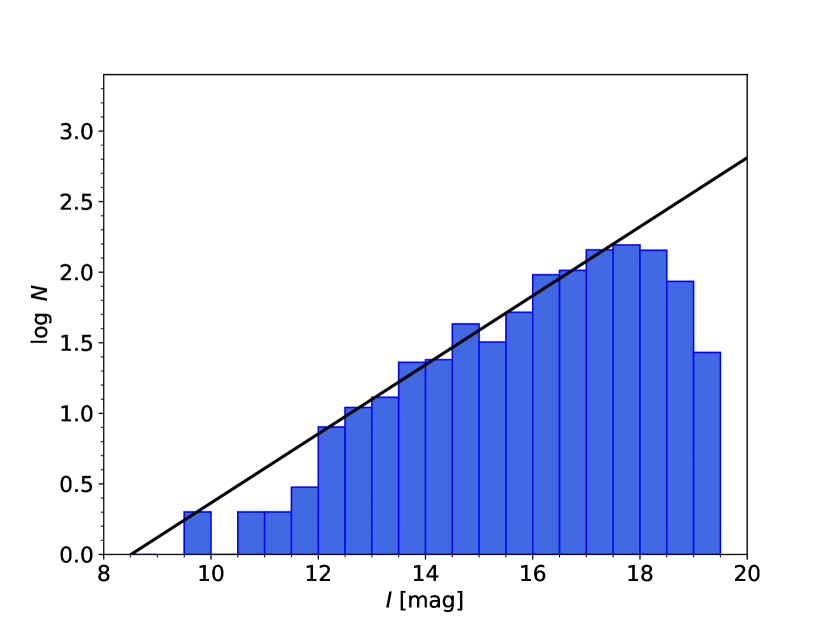
The brightest stars, HD 5005A and HD 5005B, were too bright to be measured reliably. They were saturated in the Kuiper telescope images. Although HD 5005B was not saturated in the observation with the 2k CCD, the errors were large due to the saturated neighboring star HD 5005A. We used instead the photoelectric photometric data of HD 5005A+B of Guetter & Turner (1997). Figure 6 shows the luminosity function of all stars in our survey region. The least-squares method was used to determine the slope of the luminosity function between 13 and 17 mag at which our photometry is complete. If the linear relation is extrapolated beyond 17 mag, our photometry may be 84% complete at the turnover magnitude.
We transformed the CCD coordinates of the observed stars to the equatorial coordinates tied to the Two Micron All Sky Survey (2MASS; Cutri et al., 2003) using several hundreds of stars in common between the two data. A total of 833 2MASS counterparts were found in our data. The near-infrared (NIR) data of some stars are used to investigate the extinction law.
2.2 Archival Datasets
2.2.1 Gaia Data
Since stars in a cluster are considered to have formed from the same molecular cloud on a short timescale, cluster members share almost the same kinematic properties. Astrometric data such as proper motions and parallaxes are useful to isolate members of the cluster from the background/foreground field stars. The EDR3 catalog (Gaia Collaboration et al., 2020) provides accurate proper motion and parallax data for sources across the whole sky. The nominal uncertainties reach and for bright sources () and and for sources. It has been known that the Gaia EDR3 parallaxes have a global zero-point offset of mas (Lindegren et al., 2020). We searched the EDR3 catalog for counterparts of our observed stars, and all stars were matched in a radius of . To obtain reliable results, we did not use stars with a negative parallax and compensated for the global zero-point of .
2.2.2 Chandra ACIS Data
PMS stars are known to be bright X-ray sources (, Feigelson et al., 2003; Linsky et al., 2007). Furthermore, their X-ray activity persists for a long time (Sung et al., 2008). For these reasons, PMS stars in SFRs can be well identified through X-ray imaging observations (Sharma et al., 2012). We took a list of 1185 X-ray sources in this SFR (Townsley et al., 2019). A total of 210 X-ray counterparts were found within a searching radius of .
3 Member Selection
As the majority of open clusters are distributed in the Galactic plane, a large number of field interlopers are observed along the line of sight in the same FoV. Member selection is therefore of crucial importance in the study of open clusters.
3.1 Low-Mass Stars
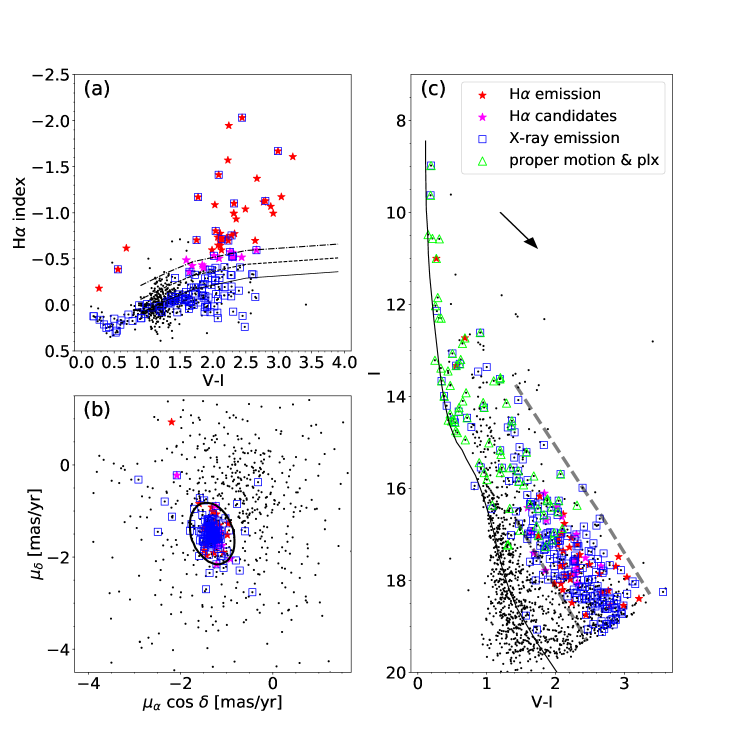
Material in the circumstellar disk of YSOs may accrete onto the stellar surface, manifesting in a UV excess and H emission (Calvet & Gullbring, 1998; Hartmann, 1999). Therefore, H emission can be a useful indicator of CTTS in young open clusters (Sung et al., 1997). The H index ( H) in Figure 7(a) is a measure of H emission introduced by Sung & Bessell (2000). Figure 7(a) shows the H indices of the observed stars with respect to the () color. The fiducial line for H emission stars is adopted from Lim et al. (2015a). The selection criteria were set based on the distribution of , where means the difference between the measured H indices and the fiducial line at a given color. The distribution appears close to a Gaussian distribution with a weak skewed wing toward negative values. The standard deviation of the Gaussian distribution is about 0.15 mag. Normal stars without H emission lines were found within the standard deviation from , while H emitting stars may be detected from the skewed wing. Therefore, we selected emission candidates as having values smaller than a standard deviation () and emission stars as having values smaller than twice the standard deviation () from the zero value. Some stars satisfying the criteria were excluded because of their large photometric errors. A total of 39 H emission stars and 15 H emission candidates were identified. We visually inspected these stars in the H images. In the same FoV, Sharma et al. (2012) found four H emission stars, which were high mass or intermediate-mass stars. In this study, we identified a larger number of low-mass stars showing H emission.
As mentioned above, identifying X-ray emission stars is the most effective way to select low-mass PMS members (Flaccomio et al., 2006; Rauw & Nazé, 2016; Caramazza et al., 2012) because stars in the PMS stage are much brighter in X-ray than main-sequence stars (Prisinzano et al., 2008). The majority of X-ray sources as well as H emission stars are found in a specific locus (hereafter PMS locus) above the field main-sequence stars at given colors (see Figure 7(c)). Most X-ray emission stars in the PMS locus do not show any appreciable H emission, which implies that they are YSOs without an active accretion disk, at least at the time of the H observations. On the other hand, some X-ray emission stars are found below the PMS locus. These stars may be PMS stars going through disk-bearing, or field late-type stars undergoing prolonged X-ray activity due to them being in low-mass close binary systems (Sung et al., 2008; Fang et al., 2021).
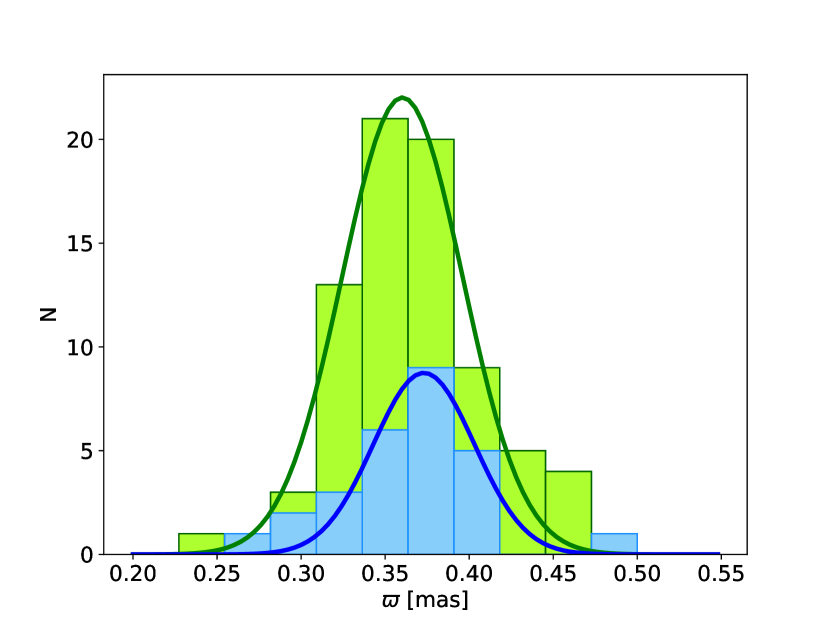
We also used proper motions of stars to select additional members. Figure 7(b) shows the proper motion of stars in the observed FoV. We fit a 2-D Gaussian function, with the principal axis analysis, to the proper motion distribution of X-ray emission stars and H emission stars that were concentrated around the mean value of with the principal axis inclined by . The standard deviations of the major and minor axes were computed to be 0.2 and 0.1, respectively, yielding an elliptical shape that encompasses as many members as possible. Stars with proper motions within three times the standard deviations from the mean values and associated errors smaller than were considered as member candidates (see Figure 7(b)). The parallaxes of stars (Gaia Collaboration et al., 2020) provide crucial constraints on cluster membership. Figure 8 displays the parallax distribution of stars. The mean and standard deviation of X-ray emission stars are . Stars with parallaxes between 0.30 mas and 0.45 were selected as probable members, where we only considered parallaxes larger than three times the errors.
In addition, we considered 44 stars in the PMS locus as PMS star candidates. They were not detected by the Chandra observation (Townsley et al., 2019) and do not show the H emission. Their Gaia parallaxes and proper motions are similar to those of the cluster although the associated errors are large due to their faintness. However, we considered these stars as member candidates in this study. The later release of the Gaia data will be able to judge their membership
Other properties of YSOs are UV excess. The UV excess originates from hot spots in the photosphere due to the release of gravitational energy from accreting material (Calvet & Gullbring, 1998). This phenomenon that occurs in actively accreting YSOs is normally accompanied by strong H emission. Our optical data are rather limited to detect such UV excess stars because our faint YSOs have large photometric errors in the band. However, two H emission stars definitely show UV excesses in Figure 9. In addition, some faint stars, although they have large photometric errors, are bluer in ().
Stars satisfying more than two criteria among X-ray emission, H emission, proper motion, parallax, and PMS locus are selected as the members of IC 1590. If stars fulfill only one criterion, the stars were considered as member candidates. We summarize the criteria of member selection as below:
-
1.
X-ray emission stars
-
2.
H emission stars or candidates
-
3.
proper motion within three times the standard deviations from the mean value
-
4.
parallaxes between 0.03 mas and 0.45 mas
-
5.
stars in the PMS locus in HRD
Finally, we selected 369 of the low-mass stars as members.
3.2 Massive and Intermediate-mass Stars
Massive O- and B-type stars are classified as probable cluster members because their lifetime is so short that they cannot migrate far away from their birth place. Such early-type stars, being luminous and blue in color, can be easily identified in photometric diagrams. But selection of late B- to F-type members of young open clusters is very difficult because H photometry is less effective to identify them (except for Herbig Ae/Be stars), and these stars are quiet in the X-ray (Sung et al., 2017). However, high precision proper motion and parallax data from the Gaia mission make it possible to identify these intermediate-mass members. In Figure 9, stars with and mag corresponds to late-B-type stars, and therefore we considered these stars as early-type member candidates. Their membership was assessed by using proper motions and parallaxes. To do this, we adopted the same criteria 3 and 4 used for the selection of low-mass members. A total of 39 massive and intermediate-mass stars were selected as members.
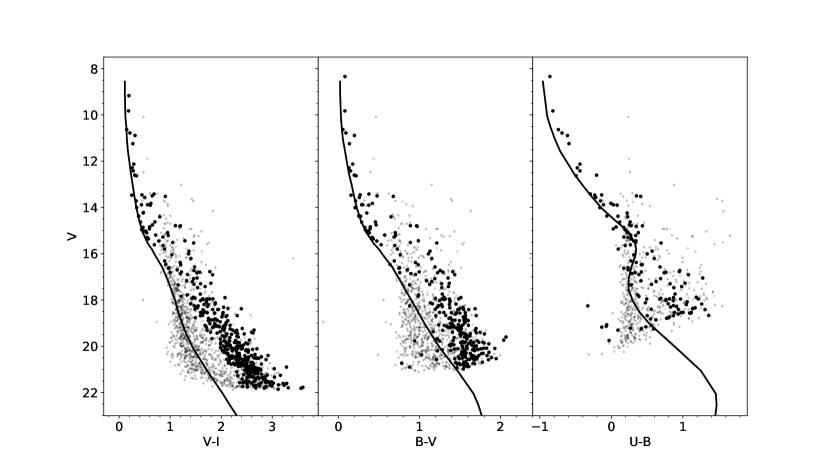
Figure 10 shows the CMD of IC 1590. Grey and black dots represent, respectively, field stars and cluster members. In the () CMD, PMS star population is clearly seen. On the other hand, some PMS stars have colors bluer than those of the zero-age main sequence (ZAMS) relations in the () and () diagrams, which implies a UV excess for these PMS stars, although they have large photometric errors. Indeed, three of these stars were identified as H emission stars.
4 Reddening and Distance
4.1 The Extinction Law
The interstellar extinction can be determined in the (, ) two-color diagram (TCD) shown in Figure 9. The reddening vector is well established as follows (Sung et al., 2013);
| (1) |
We obtained the reddening of individual early-type members by comparing their observed with intrinsic colors (Sung et al., 2013) along this reddening vector.
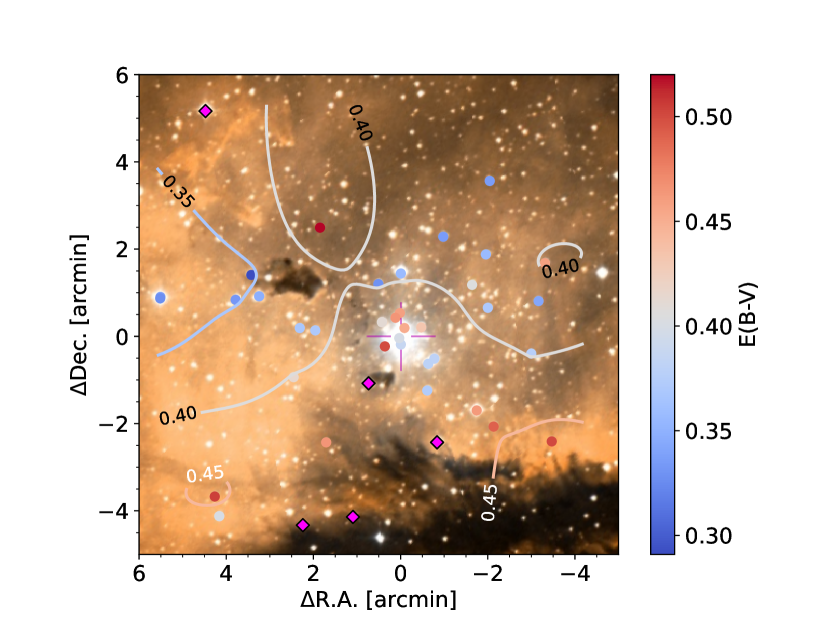
The mean reddening is (s.d.). There is non-negligible differential reddening given the standard deviation larger than the typical photometric errors of mag at mag. Figure 11 shows the spatial variation of . The southern region is more obscured by remaining material than the northern region. The presence of the dense gas toward NGC 281 West was also confirmed from the CO observations (Elmegreen & Lada, 1978; Megeath & Wilson, 1997; Lee & Jung, 2003). The reddening of individual PMS stars could not be obtained from the photometric diagrams. Therefore, we used this map to correct the reddening of PMS stars.
Light from stars in very young open clusters is absorbed by foreground and intracluster media (see Hur et al., 2012; Lim et al., 2015a). The properties of the line of sight extinction in given passbands are, in general, described by the total-to-selective extinction ratio (), which depends on the size distribution of dust grains (Draine, 2003). The canonical value of the total-to-selective extinction ratio () of the diffuse ISM is generally accepted by many investigators (Wegner, 1993; Lada & Lada, 1995; Winkler, 1997). However, a somewhat lower value of was reported toward the Perseus arm (Sung & Bessell, 2014). In the case of intracluster media, can be high because some SFR are so young that large dust grains may still remain without having been destroyed by UV photons from massive stars. Abnormal high extinction laws have been reported in some young open clusters (e.g., Hur et al. 2012; Lim et al. 2015a; Fang et al. 2021), while others have not (e.g., Sung et al. 2017). The interstellar extinction due to the dust associated with IC 1590 was claimed to be larger from (Guetter & Turner, 1997; Sharma et al., 2012). We corrected for the total extinction of each star as follows;
| (2) | |||||
| (3) |
where , , , , , and represent the foreground extinction, foreground reddening, foreground , intracluster extinction, intracluster reddening, and intracluster , respectively.
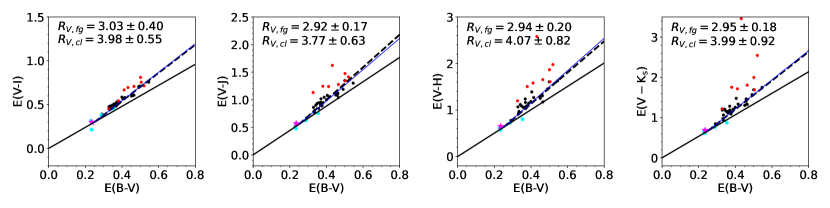
To check whether the extinction law of IC 1590 is abnormal or not, the properties of extinction were investigated using color excess ratios. We estimated the intrinsic colors of early-type stars in the NIR wavelength passbands interpolating their reddening-corrected to the intrinsic color relations between () and (), where is the , , , or magnitude (Sung et al., 2013). The color excesses were calculated by comparing the observed colors with the intrinsic colors. Figure 12 shows the color excess ratios of various passbands with respect to . was obtained from the color excess ratio of to . In some regions, from the band showed a considerably different value than those from the NIR bands (e.g., Hur et al. 2015), so we did not use the band for obtaining . There are several stars with an IR excess emission (see Figure 12). Their IR excess may originate from circumstellar material. Hence, we cautiously excluded stars with larger than 2.5 times the standard deviation from the rest. The mean obtained from the NIR color excess is (s.d.).
In our FoV, there are five foreground early-type stars. Their mean reddening is (s.d.). From these stars, we can examine the foreground extinction law in the same way. The is (s.d.), which is normal value in the direction of the Perseus Arm (Sung & Bessell, 2014).
4.2 Distance
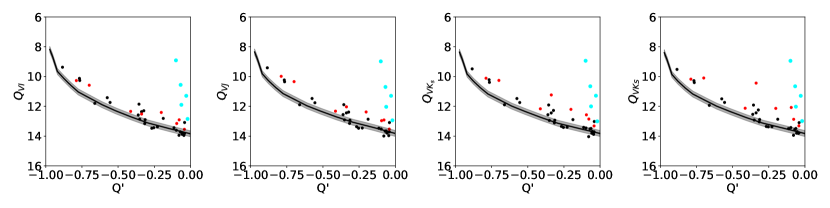
The colors and magnitudes of young main-sequence stars are empirically well established (Sung et al., 2013). We determined the distance of IC 1590 by comparing the CMD of the early-type main sequence members with the ZAMS relations of Sung et al. (2013). Johnson & Morgan (1953) introduced a reddening-free Q value, , and investigated the Q value for O- and B-type stars (e.g., Johnson & Morgan, 1953; van den Bergh & Hagen, 1968). To minimize the effect of reddening, we used reddening-free quantities and a modified Johnson in the distance determination. These quantities are defined as follows (Sung et al., 2013).
| (4) | |||||
| (5) | |||||
| (6) | |||||
| (7) | |||||
| (8) |
Figure 13 shows the reddening-free CMDs of early-type stars. Because a large fraction of high mass stars constitute binary systems (Sana et al., 2012) as well as the effect of rapid evolution, high mass stars may be brighter than the ZAMS at a given effective temperature (Lim et al., 2015a). Therefore, we fit the ZAMS to the lower ridgeline of the mid- to late-B type main-sequence stars within 0.2 mag. The estimated distance modulus is , which is equivalent to the distance of .
We also determined a distance of IC 1590 from the inversion of the parallaxes of members. Stars with a parallax larger than five times the error were used to determine the distance. We fit a Gaussian distribution to the parallax distribution of members (Figure 8) and obtained mas (s.d.). As a result, the distance is computed to be kpc. The distance from the parallaxes is well consistent with that from the ZAMS fitting. Our result is also in a good agreement with the distance from radio VLBA astrometry of an maser in NGC 281 West (Sato et al., 2008).
5 Age and IMF
5.1 Hertzsprung-Russell Diagram
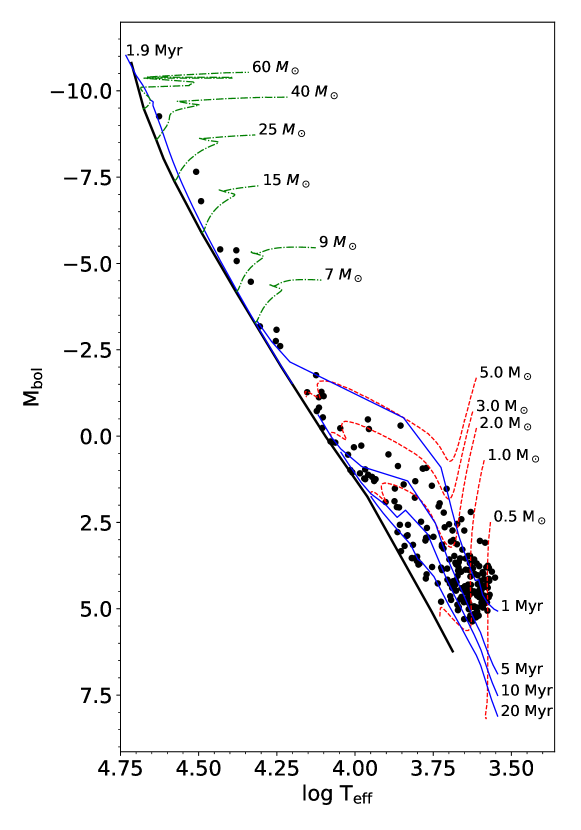
To construct the Hertzsprung-Russell Diagram (HRD), we corrected the reddening and total extinction in visual band, according to Equation 3. While the reddening values of individual early-type members were applied to their observed colors, the values inferred from the reddening map were adopted for the reddening correction of lower-mass stars. We also applied the distance modulus of 12.3 mag to the extinction-corrected visual magnitude. The effective temperature () of O-type stars was inferred from the spectral type- relation, while that of the other stars was estimated by interpolating their intrinsic colors to the color- relations. The bolometric correction values were obtained from the BC- relation. These relations are obtained from Sung et al. (2013).
We present the HRD of IC 1590 in Figure 14 with several stellar evolutionary tracks (Ekstrm et al., 2012) and PMS evolution models (Siess et al., 2000). Stars with masses larger than are in the main-sequence stage. The age of this cluster inferred from the main-sequence turn-off is about . However, the stars in the HD 5005AB system were not spatially resolved, its luminosity may therefore be overestimated. Hence, the age of these stars may be younger than . Most of the PMS members are evolving along Hayashi tracks or in the Kelvin-Helmholz contraction phase. The upper mass range of these PMS members appears to be and the majority of PMS stars are younger than .
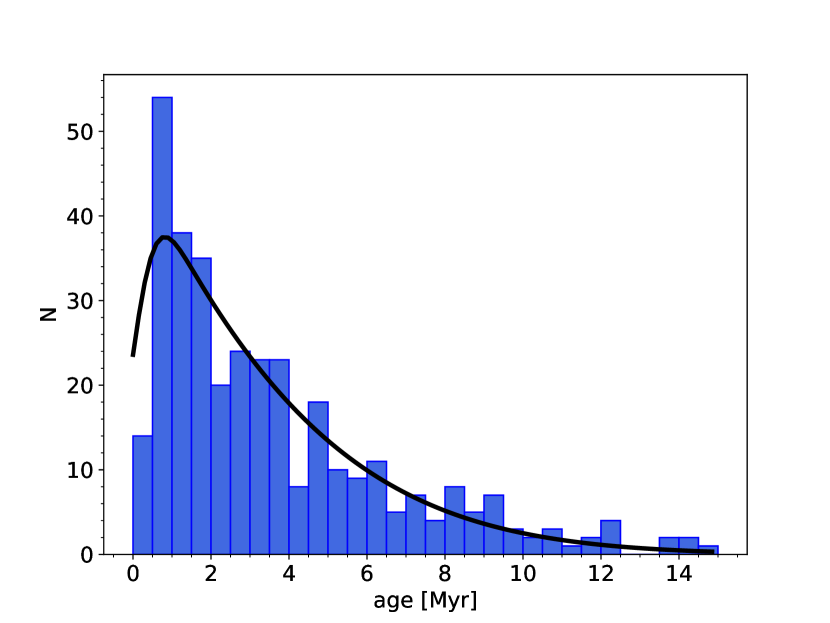
The masses and ages of individual members were derived by interpolating the and of each star to those from the evolutionary tracks for the main-sequence (Ekstrm et al., 2012) and PMS (Siess et al., 2000). We present the age distribution of PMS stars with in Figure 15. The age distribution shows a large spread because the ages of PMS stars are almost certainly overestimated due to imperfect correction for differential reddening as well as internal extinction of disk-bearing stars, variability, and photometric errors for faint stars (Sung et al., 1997, 2004). We fit a skewed Gaussian function to the age distribution. The representative age of this cluster was estimated to be from the mode value of the age distribution. The ages of PMS stars ranges from 0.7 Myr to 8.4 Myr at 10% and 90% of the cumulative distribution.
5.2 Initial Mass Function
The mass function can be derived from the distribution of masses of individual stars. The IMF is expressed as the number of stars in a given logarithmic mass bin in a projected area , i.e. , where and represent the number of stars within a given mass bin and the size of the logarithmic mass bin, respectively. The IMF is approximated as a linear relation of stellar mass in a logarithmic scale, i.e. . Salpeter (1955) obtained the slope for the stars in the Solar neighbourhood.
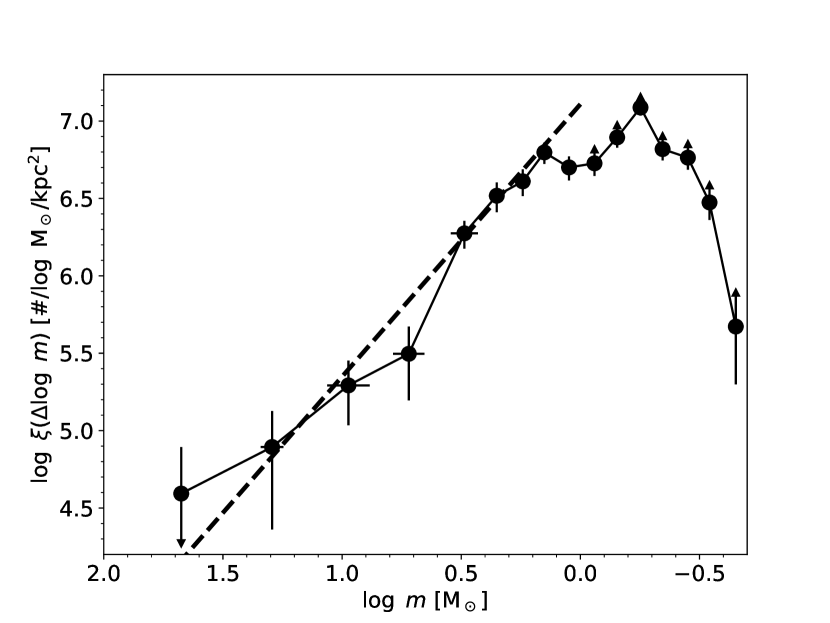
We derived the IMF in the range from to . Different bin sizes were used to include at least one star in a given mass bin; for , for , and for . We did not consider the unresolved binary systems. Figure 16 shows the IMF of IC 1590. Before calculating the slope of the IMF, we need to limit the stars within the completeness of our photometry and member selection. Our photometry has a completeness limit of 17.5 mag in the band, which corresponds to about . Since our member selection depends on X-ray data, the completeness mass of the X-ray dataset should be also considered. Townsley et al. (2019) detected X-ray sources complete down to , and therefore our member selection is likely complete for stars with masses larger than .
We calculated the slope of the IMF for stars with masses larger than . Using the method of maximum likelihood, the slope of the IMF, = , was determined. It is slightly steeper than the slope of derived by Salpeter (1955) and Kroupa (2001) for the Solar neighborhood. This implies that low-mass star formation in this SFR is more dominant than that in the Solar neighborhood. On the other hand, Guetter & Turner (1997) and Sharma et al. (2012) obtained shallow IMFs. They identified a low number of low-mass members and computed the slope of the IMF for stars with masses larger than . Therefore, the discrepancy between their results and ours presumably originates from the completeness of the low-mass member selection.
6 Discussion
6.1 The Effect of binarity in IMF
The effect of binaries has not been considered in the derivation of the stellar IMF (Kroupa, 2001). However, it is a common phenomenon that most stars form or end up in binary or multiple systems during the star formation process. A number of previous studies have investigated stellar multiplicity and mass ratio (Duquennoy & Mayor, 1991; Fischer & Marcy, 1992; Delfosse et al., 2004; Raghavan et al., 2010; Sana et al., 2012; Peter et al., 2012). Duchne & Kraus (2013) reviewed the overall properties of stellar multiplicity. Here, we examined the effects of binarity on the IMF using a Monte-Carlo technique.
We constructed a synthetic cluster containing 10000 stars in the mass range of to using a Monte-Carlo method. The Kroupa IMF was adopted as the underlying IMF. The binary fraction was determined as a function of primary mass. The mass ratio distribution in a given mass bin is expressed as a power law relation where is the mass ratio. The functions for binary fraction and mass ratio were adopted from those of Duchne & Kraus (2013). The typical binary fraction of low-mass stars and are about 20% and 4.2, respectively. More than 80% of massive stars occur in binary systems (Sana et al., 2012), and their mass ratio distribution appears to be flat.
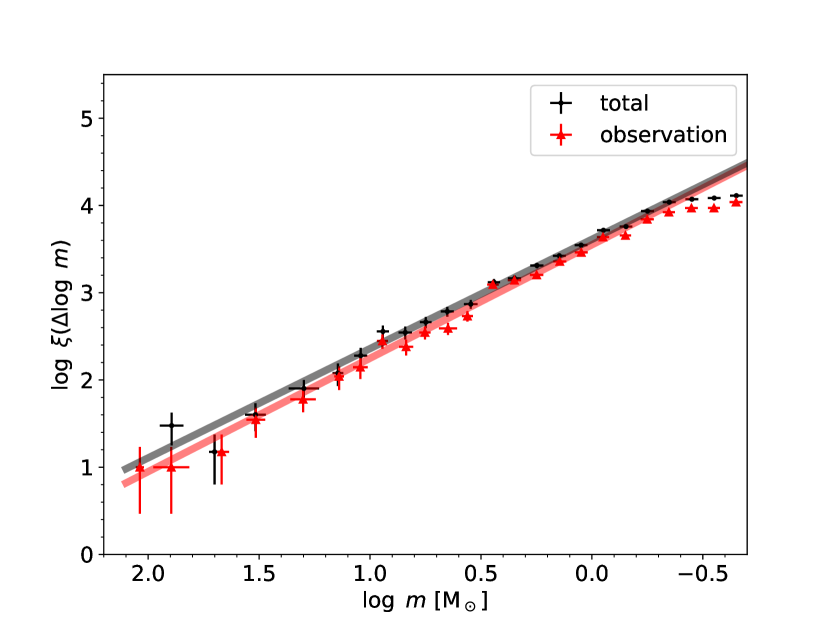
A total of 2730 binary systems and 7270 single stars were generated. The effective temperature and bolometric magnitude of stars in the synthetic cluster were obtained by interpolating their masses to the evolutionary models for MS and PMS stars (Ekstrm et al., 2012; Siess et al., 2000). All the binary systems were assumed to be unresolved binaries. The temperatures of the binary systems may be close to those of the primary stars, while their total luminosities can be obtained from the sum of luminosities of the primary and secondary stars. In turn, we derived the mass of stars from the HRD using the same method described in Section 5.2. The IMF of the synthetic cluster was finally derived as shown in Figure 17 (red dots). We also present the underlying IMF taking into account the resolved binary stars (black dots) for comparison. The slopes of the underlying IMF and simulated one are and , respectively. There is no significant difference between two IMFs. Therefore, the IMF of IC 1590 may not be significantly affected by the binary population in the cluster.
We can guess some reasons that unresolved binaries do not affect the estimation of the IMF very much. The primary stars essentially dominate the total luminosities of binary systems. In the high-mass regime, the size of the mass bins is sufficiently large to cover a number of stars even if stellar masses were misderived due to the contribution of the secondary stars. The low-mass PMS stars are evolving along the Hayashi tracks, and therefore their masses may not significantly misderived even if their luminosities are increased by the binary effects.
6.2 Mass Segregation
Some open clusters exhibit the signature of mass segregation (e.g., the concentration of massive stars; Sung et al., 2013, 2017; Dib et al., 2018; Dib & Henning, 2019; Hetem & Gregorio-Hetem, 2019). Mass segregation is the result of energy equipartition among cluster members (Binney & Tremaine, 1987). This dynamical process takes place on a relaxation time scale which for a typical cluster with about 1000 members is longer than ten crossing times (Bonnell & Davies, 1998). However, because young open clusters are too young to be relaxed, the cause of mass segregation among young open clusters is still debated. One possibility is that the mass segregation found in several young open clusters could have a primordial origin related to star formation in inhomogeneous molecular clouds (Bonnell & Davies, 1998). On the other hand, some assert that the origin of mass segregation in young open clusters is due to rapid dynamical evolution in their early stages (McMillan et al., 2007; Allison et al., 2009, 2010). Such rapid dynamical evolution occurs when substructures in molecular clouds merge together into a star cluster. In this situation, mass segregation can dynamically occur on a shorter timescale than the relaxation time.
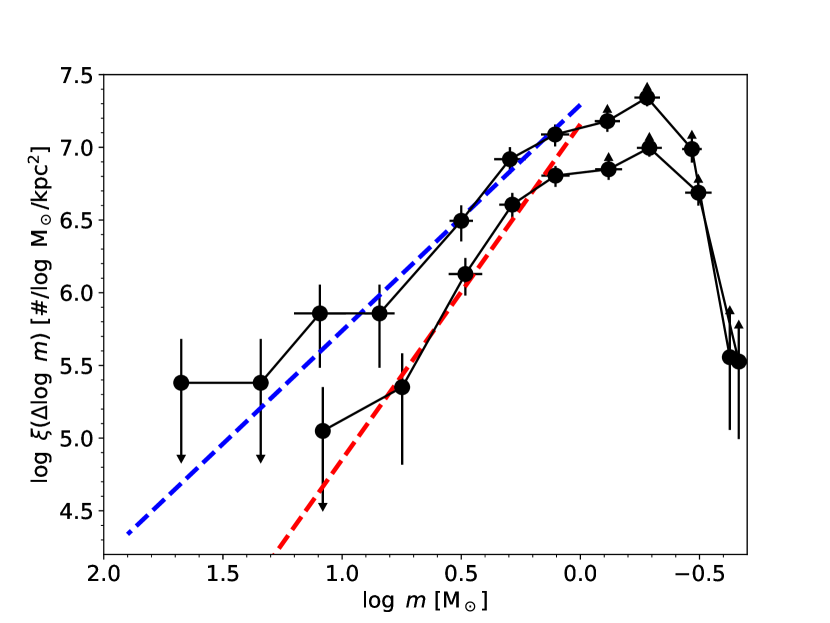
To investigate the signature of mass segregation in IC 1590, we derived the mass functions (MFs) of stars in the inner and outer regions from the half-number radius of , respectively. We derived IMFs of stars in the same manner described in Section 5.2. The number of stars is 206 for the inner region and 202 for the outer region. Six out of seven massive stars including HD 5005AB reside in the inner region. Because there is only one star with in the outer region, we determined the slope of the MFs using stars with for a fair comparison. The slopes of the MFs are somewhat different; for the inner region and for the outer region, respectively (Figure 18). This result indicates that mass segregation occurs in IC 1590.
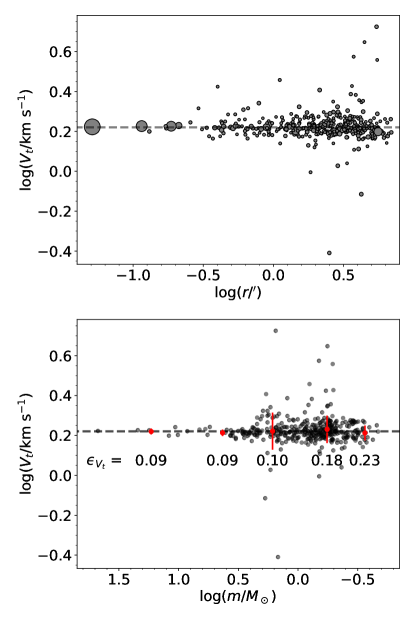
Were the mass segregation caused by rapid dynamical evolution at an early stage, there would be a signature in the stellar mass and velocity correlation. Adopting a distance of 2.8 kpc, we computed two-dimensional tangential velocities () of members using the proper motions from the Gaia EDR3 (Gaia Collaboration et al., 2020). Figure 19 displays the distribution with respect to the radial distances from the cluster center and stellar masses. We could not find any mass-dependent correlation. The dispersion in increases with stellar mass, but the large errors in the proper motions of faint stars may be responsible for the large scatter in . Hence, these results suggest that the mass segregation in IC 1590 more likely has a primordial origin, rather than resulting from the violent dynamical evolution of the cluster.
6.3 Triggered or Sequential Star Formation
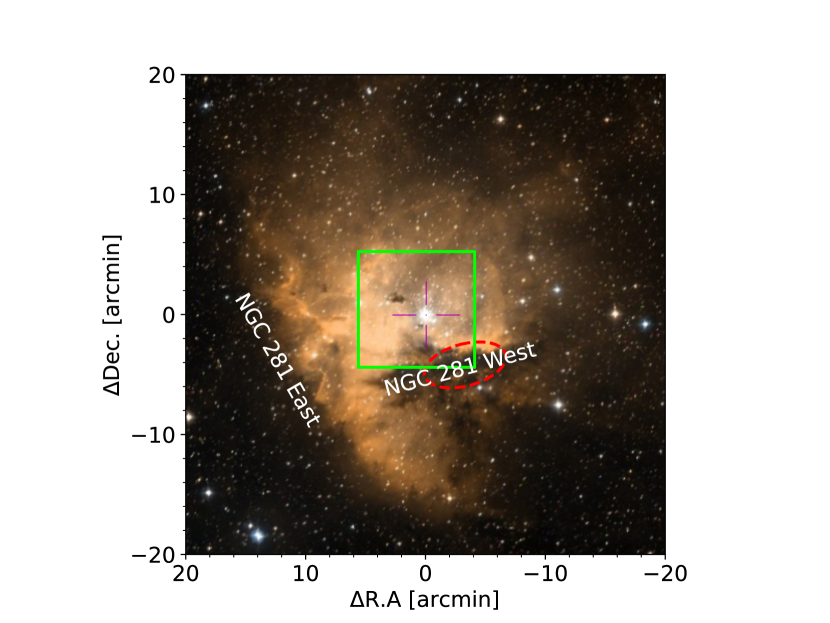
Figure 20 displays two SFRs in NGC 281 region. Based on CO observations and the age sequence of YSOs, Megeath & Wilson (1997) and Sharma et al. (2012) suggested that the star formation of NGC 281 West and NGC 281 East were affected by IC 1590. To investigate the possibility of triggered star formation of NGC 281 West, we estimated the expanding velocity of the HII region NGC 281. If we assume that the Lyman continuum photons from O-type stars are used only for expanding the HII region, the expansion velocity is given by
| (9) |
where and are the number of the Lyman continuum photons per second and the number density of hydrogen atoms. Lim et al. (2018) derived an expansion velocity for the NGC 1893 HII bubble of . NGC 1893 contains the same number of O-type stars and has a HII bubble with the similar diameter to NGC 281. We compared the from O-type stars and the cluster size of IC 1590 with those of NGC 1893 where was obtained from Draine (2011). The expanding velocity of NGC 281 is comparable to that of NGC 1893 when the hydrogen number densities of the two regions are the same.
The projected distance between the O-type Trapezium system of IC 1590 and the northern subcluster of NGC 281 West is about at (Figure 20). The travel time of the ionization front to the northern subcluster of NGC 281 West is 0.5 Myr at the expanding velocity of . If IC 1590 has indeed triggered the star formation of NGC 281 West, the age of NGC 281 West would be 0.3 Myr. Then most of YSOs in NGC 281 West would be at Class 0/I stage if we consider that the lifetime of Class 0/I YSOs is about (Evans et al., 2009). However, Sharma et al. (2012) detect 13 Class II YSOs in the northern subcluster of NGC 281 West. Hence, it is not clear whether the HII region driven by massive stars in IC 1590 has triggered the formation of the northern subcluster in NGC 281 West.
Megeath et al. (2002, 2003) also suggest that the NGC 281 complex was formed in a fragmenting superbubble. Based on VLBA parallax and proper motion data of the IRAS sources, Sato et al. (2008) suggested that the 3-D structure of the superbubble is a slightly elongated shape along the Galactic disk. They proposed that the first-generation of OB stars in IC 1590, which were formed by the superbubble shock, ionized the surrounding materials and could have influenced the next-generation of star formation in the neighboring clouds NGC 281 West. If IC 1590 did not trigger the star formation of NGC 281 West, then the star formation of NGC 281 West might have been sequentially affected by the external stimulus such as the shock of superbubble.
6.4 Individual Notable Stars
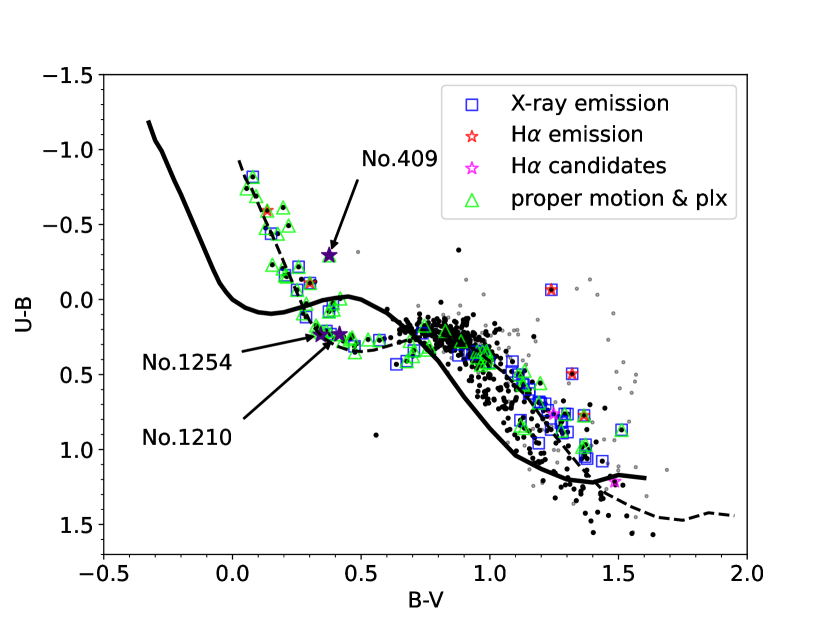
6.4.1 No. 409
No. 409 is an early-type star (see the TCD in Figure 9). This star has almost the same proper motion and parallax of IC 1590. Also, No. 409 shows strong H emission and a NIR excess, which implies the existence of an actively accreting hot disk. Therefore, No. 409 seems to be a Herbig Be star. We excluded No. 409 in constructing the extinction map.
6.4.2 No. 1210 and No. 1254
There is no definitive evidence for the membership of No. 1254 because its proper motion () = () largely deviates from the cluster’s value and the star is not an X-ray source nor an H emitter. No. 1210 has a similar proper motion and parallax as members but X-ray emission or H emission were not detected. These two sources follow a normal interstellar extinction law, but have similar with other members of IC 1590 in Figure 12. Furthermore, they follow the cluster’s sequence in Figure 9 so they are probable members of IC 1590. The normal extinction law for No. 1210 and No. 1254 implies that the outer region of NGC 281 West follows a normal interstellar extinction law.
6.4.3 HD 5005AB
The most massive stars HD 5005AB (=No. 380) in IC 1590 is too bright to be de-convolved. The estimated mass of the system is . Sota et al. (2011) reported the spectral types of HD 5005A and HD 5005B as O4V((fc)) and O9.7II-III, respectively. However, it is not consistent with the binary formation scenario and the stellar evolution models for the less massive star HD 5005B to have already evolved away from the main-sequence while the more massive star HD 5005A is still on the main-sequence. Sota et al. (2011) also reported that the luminosity class of HD 5005B from HeII /HeI conflicts with a very weak Si IV line. Therefore, a luminosity class V may be more appropriate for HD 5005B.
7 Summary
In this paper, we presented deep and H photometry for the central area of the young open cluster IC 1590. We identified 39 H emission stars and 15 H emission candidates from H photometry. We selected 408 members from optical TCDs, CMDs, H photometry, X-ray emission, Gaia EDR3 parallax, and proper motion. Our photometry is complete down to .
The mena reddening was estimated to be (s.d.), and there is differential reddening across the cluster. The extinction law toward IC 1590 was ionvestigated by using the color excess ratios. As a result, we confirmed an abnormal extinction for the intracluster medium (), while a normal extinction law was found for the foreground medium toward the Perseus arm. The distance modulus of IC 1590 determined from the reddening-free CMDs is corresponding to . This result is in good agreement with the distance derived from the Gaia EDR3.
The ages and masses of members were obtained from stellar evolution models and PMS evolutionary tracks. The representative age obtained from the distribution of PMS stars is and the ages of PMS stars distributes from 0.7 Myr (10% percentile) to 8.4 Myr (90% percentile). Our estimation is smaller than the upper limit of 4.4 Myr estimated by Sharma et al. (2012). The IMF of IC 1590 was derived, and its slope is . It is steeper than Salpeter/Kroupa IMF (-1.35), implying that low-mass star formation is dominant in this SFR.
To find a signature of mass segregation in the IC 1590 region, we compared the IMF for the inner region () with that for the outer region (). The slope of the IMF for the outer region appears steeper than that for the inner region. In addition, the distribution of massive stars with is concentrated in the inner region. These observations indicate the signature of mass segregation in IC 1590. But, we could not find any evidence for the energy equipartition among members in the correlation between stellar masses and tangential velocities.
To investigate the possibility of triggered star formation of NGC 281 West, we estimated an expansion velocity of the HII region NGC 281 of . If the O-type stars of IC 1590 have triggered the star formation of the northern sub-cluster of NGC 281 West, the age of the northern sub-cluster would be 0.3 Myr. However, since there are a number of Class II YSOs probably older than 0.55 Myr in NGC 281 West, it is not evident that the massive stars of IC 1590 triggered the star formation of NGC 281 West. Also, to study further star formation history of NGC 281 region, another star forming region NGC 281 East (Elmegreen & Lada, 1978; Megeath & Wilson, 1997) and several molecular clouds nearby NGC 281 (Lee & Jung, 2003) should be investigated thoroughly.
References
- Abdelaziz et al. (2020) Abdelaziz, A. E., Hendy, Y. H. M., Shokry, A., et al. 2020, RMxAA, 56, 245
- Alcalá et al. (2017) Alcalá, J. M., Manara, C. F., Natta, A., et al. 2017, A&A, 600, 20
- Allison et al. (2010) Allison, R. J, Goodwin, S. P., Parker, R. J., et al. 2010, MNRAS, 407, 1098
- Allison et al. (2009) Allison, R. J., Goodwin, S. P., Parker, R. J., et al. 2009, MNRAS, 395, 1449
- Ansdell et al. (2020) Ansdell, M., Haworth, T. J., Williams, J. P., et al. 2020, AJ, 160, 248
- Arenou et al. (2018) Arenou, F., Luri, X., Babusiaux, C., et al. 2018, A&A, 616, A17
- Bally (2008) Bally, J. 2008, in Handbook of Star Forming Regions, ed. Bo. Reipurth, Vol. I (San Francisco, CA: ASP)
- Binney & Tremaine (1987) Binney, J., & Tremaine, S. 1987, Galactic dynamics (Princeton, NJ: Princeton University Press), 747
- Bonnell & Davies (1998) Bonnell, I. A., & Davies, M. B. 1998, MNRAS, 295, 691
- Calvet & Gullbring (1998) Calvet, N. & Gullbring, E. 1998, ApJ, 509, 802
- Caramazza et al. (2012) Caramazza, M., Micela, G., Prisinzano, L., et al. 2012, A&A, 539, A74
- Calvet & Gullbring (1998) Calvet, N., & Gullbring, E. 1998, ApJ, 509, 802
- Carraro et al. (1998) Carraro, G., Ng, Y. K., & Portinari, L., 1998, MNRAS, 296, 1045
- Carraro et al. (2008) Carraro, G., Villanova, S., Demarque, P., et al. 2008, MNRAS, 386, 1625
- Chen et al. (2003) Chen, L., Hou, J. L., & Wang, J. J. 2003, AJ, 125, 1397
- Cutri et al. (2003) Cutri, R. M., Skrutskie, M. F., van Dyk, S., et al. 2003, 2MASS All Sky Catalog of point sources
- Delfosse et al. (2004) Delfosse, X., Beuzit, J.-L., Marchal., L., et al. 2004, ASPC, 318, 166
- Dias et al. (2018) Dias, W. S., Monteiro, H., Lépine, J. R. D., et al. 2018, MNRAS, 481, 3887
- Dib & Henning (2019) Dib, S. & Henning, T. 2019, A&A, 629, A135
- Dib et al. (2018) Dib, S., Schmeja, S., Parker, R. J. 2018, MNRAS, 473, 849
- Draine (2003) Draine, B. T. 2003, ARA&A, 41, 241
- Draine (2011) Draine, B. T. 2011, Physics of the interstellar and intergalactic medium, Princeton University Press, Princeton
- Duchne & Kraus (2013) Duchne, G. & Kraus, A. 2013, ARA&A, 51, 269
- Duquennoy & Mayor (1991) Duquennoy, A., & Mayor, M., 1991, A&A, 248, 485
- Eisner et al. (2018) Eisner, J. A., Arce, H. G., Ballering, N. P., et al. 2018, ApJ, 860, 77
- Ekstrm et al. (2012) Ekstrm, S., Georgy, C., Eggenberger, P., et al. 2012, A&A, 537, A146
- Elmegreen & Lada (1978) Elmegreen, B. G., & Lada, C. J. 1978, ApJ, 219, 467
- Evans et al. (2009) Evans, N. J., II, Dunham, M. M., Jrgensen, J. K., et al. 2009, ApJS, 181, 321
- Fang et al. (2021) Fang, M., Kim, J. S., Pascucci, I., et al. 2021, ApJ, 908, 49
- Feigelson et al. (2003) Feigelson, E., Gaffney, J. A., III, Gamire, G., et al. 2003, ApJ, 584, 911
- Fischer & Marcy (1992) Fischer, D. A., & Marcy, G. W. 1992, ApJ, 396, 178
- Flaccomio et al. (2006) Flaccomio, E., Micela, G., & Sciortino, S. 2006, A&A, 455, 903
- Gaia Collaboration et al. (2018) Gaia Collaboration et al. 2018, A&A, 616, A1
- Gaia Collaboration et al. (2020) Gaia Collaboration et a. 2020, arXiv e-prints, p. arXiv:2012.01533
- Guetter & Turner (1997) Guetter, H. H., & Turner, D. G. 1997, AJ, 113, 2116
- Guetter & Vrba (1989) Guetter, H. H., & Vrba, F. J. 1989, AJ, 98, 611
- Hartmann (1999) Hartmann, L. 1999, NewA Rev., 43, 1
- Hetem & Gregorio-Hetem (2019) Hetem, A., & Gregorio-Hetem, J. 2019, MNRAS, 490, 2521
- Hodapp (1994) Hodapp, K.-W. 1994, ApJS, 94, 615
- Hur et al. (2012) Hur, H., Sung, H., & Bessell, M. S. 2012, AJ, 143, 41
- Hur et al. (2015) Hur, H., Park, B., Sung, H., et al. 2015, MNRAS, 446, 3797
- Johnson & Morgan (1953) Johnson, H. L., & Morgan, W. W. 1953, ApJ, 117, 313
- Kilkenny et al. (1998) Kilkenny, D., van Wyk, F., Roberts, G., et al. 1998, MNRAS, 294, 93
- Kroupa (2001) Kroupa, P. 2001, MNRAS, 322, 231
- Lada (1987) Lada, C. J. 1987, in IAU Symp. 115: Star Forming Regions, ed. M. Peimbert & J. Jugaku, 1-17
- Lada & Lada (2003) Lada, C. J. & Lada, E. A. 2003, ARA&A, 41, 57
- Lada & Lada (1995) Lada, E. A. & Lada, C. J. 1995, AJ, 109, 1682
- Landolt (1992) Landolt, A. U. 1992, AJ, 104, 340
- Lee & Jung (2003) Lee, Y., & Jung, J. H. 2003, New Astron., 8, 191
- Lim et al. (2009) Lim, B., Sung, H., & Bessell, M. S. 2009, JKAS, 42, 161
- Lim et al. (2015a) Lim, B., Sung, H., Bessell, M. S., et al. 2015a, AJ, 149, 127
- Lim et al. (2015b) Lim, B., Sung, H., & Hur, H. 2015b, JKAS, 48, 343
- Lim et al. (2018) Lim, B., Sung, H., Bessell, M. S., et al. 2018, MNRAS, 477, 1993
- Lim et al. (2011) Lim, B., Sung, H., Karimov, R., et al. 2011, JKAS, 44, 39
- Lim et al. (2014a) Lim, B., Sung, H., Kim, J. S., et al. 2014, MNRAS, 438, 1451
- Lim et al. (2014b) Lim, B., Sung, H., Kim, J. S., et al. 2014, MNRAS, 443, 454
- Lindegren et al. (2020) Lindegren, L., Bastian, U., Biermann, M., et al. 2020, A&A, arXiv e-prints, p. arXiv:2012.01742
- Linsky et al. (2007) Linsky, J. L., Gagné, M., Mytyk, A., et al. 2007, ApJ, 654, 347
- Maurya et al. (2020) Maurya, J., Joshi, Y. C., & Gour, A. S. 2020, MNRAS, 495, 2496
- McMillan et al. (2007) McMillan, S. L. W., Vesperini, E., & Portegies Zwart, S. F. 2007, ApJ, 655, L45
- Megeath et al. (2002) Megeath, S. T., Biller, B., Dame, T. M. 2002, ASPC, 267, 257
- Megeath et al. (2003) Megeath, S. T., Biller, B., Dame, T. M. 2003, RMxAC, 15, 151
- Megeath et al. (2012) Megeath, S. T., Gutermuth, R., Muzerolle, J., et al. 2012, AJ, 144, 192
- Megeath & Wilson (1997) Megeath, S. T., & Wilson, T. L. 1997, AJ, 114, 1106
- Menzies et al. (1991) Menzies, J. W., Marang, F., Laing, J. D., et al. 1991, MNRAS, 248, 642
- Mužić et al. (2019) Mužić, K., Scholz, A., Ramírez, K.P., et al. 2019, ApJ, 881, 79
- Peter et al. (2012) Peter, D., Feldt, M., Henning, T., et al. 2012, A&A, 538, 74
- Piskunov et al. (2006) Piskunov, A. E., Kharchenko, N. V., Rser, S., et al. 2008, A&A, 445, 545
- Preibisch et al. (1999) Preibisch, T., Balega, Y., Hofmann, K.-H., et al. 1999, New Astron., 4, 531
- Prisinzano et al. (2008) Prisinzano, L., Micela, G., Flaccomio, E., et al. 2008, ApJ, 677, 401
- Raghavan et al. (2010) Raghavan, D., McAlister, H. A., Henry, T. J., et al. 2010, ApJS, 190, 1
- Rauw & Nazé (2016) Rauw, G. & Nazé, Y., 2016, A&A, 594, A82
- Sagar et al. (1986) Sagar, R., Piskunov, A. E., Miakutin, V. I., et al. 1986, MNRAS, 220, 383
- Salpeter (1955) Salpeter, E. E. 1955, ApJ, 121, 161
- Sana et al. (2012) Sana, H., de Mink, S. E., de Koter, A., et al. 2012, Sci, 337, 444
- Sato et al. (2008) Sato, M., Hirota, T., Honma, M., et al. 2008, PASJ, 60, 975
- Sanchis et al. (2020) Sanchis, E., Testi, L., Natta, A., et al. 2020, A&A, 633, 114
- Sharma et al. (2012) Sharma, S., Pandey, A. K., Pandey, J. C., et al. 2012, PASJ, 64, 107
- Siess et al. (2000) Siess, L., Dufour, E., & Forestini, M. 2000, A&A, 358, 593
- Snell et al. (1990) Snell, R. L., Dickman, R. L., & Huang, Y.-L. 1990, ApJ, 352, 139
- Sota et al. (2011) Sota, A., Maiz-Apellaniz, J., Walborn, N. R., et al. 2011, ApJS, 193, 24
- Stetson (1987) Stetson, P. B. 1987, PASP, 99, 191
- Sung & Bessell (2000) Sung, H., & Bessell, M. S. 2000, PASJ, 17, 244
- Sung & Bessell (2004) Sung, H., & Bessell, M. S. 2004, AJ, 127, 1014
- Sung & Bessell (2010) Sung, H., & Bessell, M. S. 2010, AJ, 140, 2070
- Sung & Bessell (2014) Sung, H., & Bessell, M. S. 2014, ASPC, 482, 275
- Sung et al. (2008) Sung, H., Bessell, M. S., Chun, M.-Y., et al. 2008, AJ, 135, 441
- Sung et al. (2017) Sung, H., Bessell, M. S., Chun, M., et al. 2017, ApJS, 230, 3
- Sung et al. (1997) Sung, H., Bessell, M. S., & Lee, S.-W. 1997, AJ, 114, 2644
- Sung et al. (2004) Sung, H., Bessell, M. S., & Sana, H. 2008, JKAS, 41, 1
- Sung et al. (2019) Sung, H., Bessell, M. S., & Song, I. 2019, MNRAS, 486, 3473
- Sung et al. (2013) Sung, H., Lim, B., Bessell, M. S., et al. 2013, JKAS, 46, 103
- Sung et al. (2009) Sung, H., Stauffer, J. R., & Bessell, M. S. 2009, AJ, 138, 1116
- Townsley et al. (2018) Townsley, L. K., Broos, P. S., Garmire, G. P., et al. 2018, ApJS, 235, 43
- Townsley et al. (2019) Townsley, L. K., Broos, P. S., Garmire, G. P., et al. 2019, ApJS, 244, 28
- van den Bergh & Hagen (1968) van den Bergh, S. & Hagen, G. L. 1968, AJ, 73, 569
- Wegner (1993) Wegner, W. 1993, Acta Astron., 43, 209
- Winkler (1997) Winkler, H. 1997, MNRAS, 287, 481
- Wu et al. (1996) Wu, Y., Huang, M., & He, J. 1996, A&AS, 115, 283