Non-spherical dark matter structures detection
Abstract
A rotation curve inequality that holds for spherically symmetric mass distributions is derived, and tested against the SPARC galaxy rotation curves dataset. We identify several Galaxies, eg NGC7793 and UGC11557, which are candidates for hosting non-spherical dark matter structures that could be detected by more precise measurements.
1 Introduction
Cosmological simulations predict that the dark matter halos of low-redshift galaxies are triaxial on large scales. In addition to such very large scale asphericity, an interaction between dark matter and baryons could lead to an accumulation of dark matter in regions of gas overdensities, resulting in a (puffy) DM disk or other structure in the inner galaxy. Here we propose a strategy for detecting such small-scale DM structures if they exist.
Energy transfer is most efficient in collisions between similar mass particles, so a DM accumulation in the vicinity of baryons would be greatest for DM whose mass is of order the mass of H and He, and likely undetectably small for significantly lower and higher mass DM. The random velocities of DM particles in the halo are generally larger than those of gas in the disk, so on average a DM-baryon collision causes the DM particle final phase space to approach that of the initial baryon. The scattering heats the gas, which then re-cools through standard mechanisms. (An almost infinitesimal fraction of DM particles intersect a star; those would just reflect or more usually be trapped in the star, negligibly impacting the global DM distribution.) The net DM accumulation would be greatest around the longest-lived gas structures and of course would be proportional to the cross-section between DM and baryons.
Our purpose here is to introduce a practical and unambiguous diagnostic of structure in the distribution of DM on small scales, as could result from DM-baryon interactions.
Rotation curves are central tools to study the mass distribution of individual galaxies [12]. The dark matter distribution can be estimated by subtracting the baryonic components from the observed mass distribution. There is a degeneracy in the mass distribution determination using rotation curves: two different mass distributions can lead to the same rotation curve. This degeneracy can be broken by imposing that the DM distribution have a particular functional form. Common DM halo models are spherically symmetric. A given DM distribution model can be favored/excluded because it gives better/worse rotation curves fits, but being able to rigorously exclude a model based on incompatibilities with some rotation curve features would be a powerful tool. One feature to consider is sphericity. Whether DM disks, or DM structures such as non-monotonic radial density exist, is still an open question [4, 14, 2, 8].
In a previous paper, we fit 121 galaxy rotation curves with a hadronically interacting dark matter (HIDM) model composed of a DM halo and a DM disk that scales the halo-baryons interactions [7]. We showed that this model outperforms 7 other canonical DM and modified gravity models. This finding motivates the need for having other, model independent, indicators of non-spherical dark mater structures in galaxies. (Note that the analysis does not reveal the thickness of the DM disk, which is presumably thick.)
Some non-spherical mass distributions can produce rotation curves that are impossible to build from a spherical distribution. For example, a ring of mass produces an outward gravitational pull inside of the ring, a phenomena that is impossible to reproduce with a spherical mass distribution. We propose a method to detect some such asphericities and test it on the SPARC rotation curves dataset [5].
In sections 2 and 3 we derive a general asphericity diagnostic for rotation curves and test it on some ideal mass distributions. In section 4 we evaluate the asphericity diagnostic for the SPARC galaxy rotation curves and show how the asphericity diagnostic is related to our previously developed HIDM model. The diagnostic is defined independently of any specific mass model.
2 Spherical inequalities
We derive spherical inequalities that can be violated when the rotation curve admits some asphericities. These inequalities are only based on the rotation curve and are model-independent. This makes them the perfect tool for asphericity detection in well measured rotation curves. However not all asphericities violate the inequality. Thus, if the inequality is violated (at an observationally robust level), asphericity of the DM halo is rigorously established, but the halo can be aspherical without violating the inequality.
Continuous
Consider a spherical mass distribution : where is the total mass inside the sphere of radius . Then, , so
| (1) |
Hence, since , we have the inequality
| (2) | ||||
| (3) |
at all radii for any spherical mass distribution. Note implies that the mass distribution is non-spherical but the existence of a non-spherical mass distribution does not imply . For example, the Mestel disk [11, 1] is a disk distribution that has the same rotation curve as a point mass and therefore does not violate the spherical inequality.
Discrete
It is usefully to write the spherical inequality for discrete measurements since observations are at a discrete set of radii. Let and be 2 data points of a rotation curve with . Then we have where is the total mass inside the sphere of radius . Assume that the mass distribution is spherical : . This leads to the inequality and
| (4) |
for any spherical mass distribution. Asphericity diagnostic can be used to detect asphericity: negative implies that there exists some non-sperical structure such as a disk or a ring. Let be the error on velocity . Then, the error on is
| (5) |
3 Examples
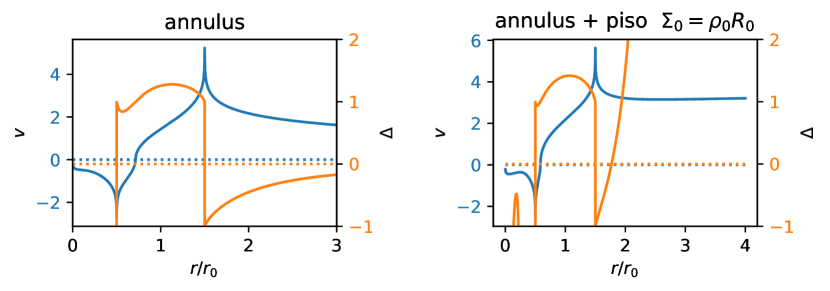
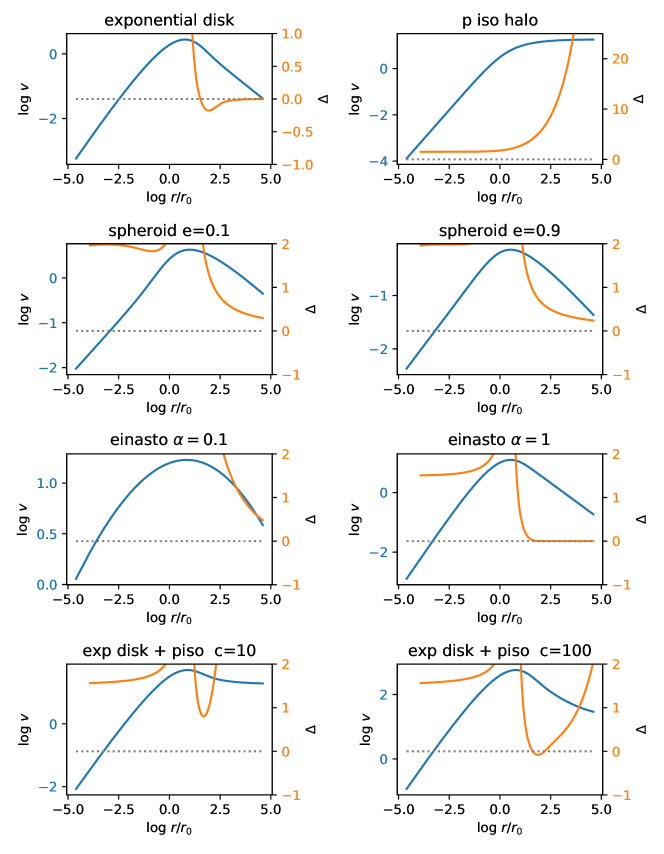
In Figures 1 and 2 we show the asphericity diagnostic for several different mass models: exponential disk, pseudo-isothermal halo, Hubble oblate spheroid, Einasto halo and a superposition of an exponential disk with the pseudo-isothermal (piso) halo (Table 1). The exponential disk violates significantly the spherical inequality. The Hubble oblate spheroid is an example of a non-spherical distribution that doesn’t violate the spherical inequality. When a halo is added to an exponential disk, if the halo is massive enough, the asphericity becomes undetectable. We illustrate this phenomena with a piso halo. If the exponential disk has the same scale radius as the piso halo, the asphericity is detectable iff .
| Mass model | Radial density | Comments |
|---|---|---|
| Exponential disk | detectable sphericity violation | |
| Pseudo isothemal halo | spherical | |
| Oblate spheroid (Hubble profile) [1] | with | :flat, :spherical; no detectable sphericity violation |
| Einasto halo [3] | spherical | |
| Exponential disk + piso halo | superposition of a disk and a halo | |
| Annulus | with | produces a negative inner rotation curve |
4 Asphericity of the DM distribution in the SPARC galaxies
In this section, we compute (4) for the DM contribution of the SPARC galaxies in order to seek unambigiously non-spherical DM structures. The contribution of the DM to the rotation curve is
| (6) |
where is the observed circular velocity, and are the contributions of the stars to the observed velocity assuming a stellar mass-to-light ratio of 1 and is the contribution of the gas. and are the stellar disk and bulge mass to light ratios. Note that is not the velocity of the th component. It is the contribution of the th component to the total circular velocity and is derived by computing the gravitational potential of the th component from the mass densities. The total gravitational potential is the sum of the contributions of each mass component and . The main unknown is . In this work, is estimated by individually fitting each rotation curve with an Einasto halo [3]. We use the Einasto model because it can reproduce a great diversity of spherical halo shapes and has been show to fit the SPARC data particularly well [6, 7]. In order to obtain a realistic mean mass to light ratio around as suggested by stellar population synthesis [13, 9, 10], the following term is added to the when fitting, as in [7]:
| (7) |
where is the assumed mean mass to light ratio and is the standard deviation of values in an ensemble of galaxies, estimated to be ; 111In equation (7), is a global parameter that represents the variance in the true stellar mass to light ratio of the ensemble of galaxies. Recall that each galaxy’s stellar mass to light ratio is determined by fitting a Einasto halo to the rotation curve so is not the error on for each individual fits. Since this error is not straightforward to estimate and the overall asphericity diagnostic significance is not sensitive to , we do not include this error in the estimate of the error on that is then fully determined by the error on the rotation curve measurements (equation (5)). is the disk stellar mass to light ratio of the th galaxy and is the ratio for the bulge; see [7] for more information about these choices. The Einasto fits have 4 free parameters: 3 halo parameters and the stellar mass to light ratio.
For each galaxy we compute a set of where are neighbor data points, then we combine the significances of these values in order to determine the significance that a given galaxy violates sphericity. The error on the DM contribution that is used in eq (5) is
| (8) |
The p-value that one data-point does not violate sphericity (i.e that is positive) is the Gaussian integral
| (9) | ||||
| (10) |
with and (defined in eq. (5)). Note that means that data-point shows significant sphericity violation while means that data-point does not show sphericity violation. Using Fisher’s method for each galaxy, define
| (11) |
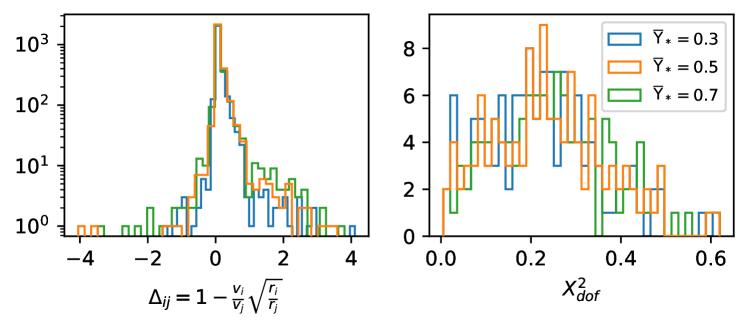
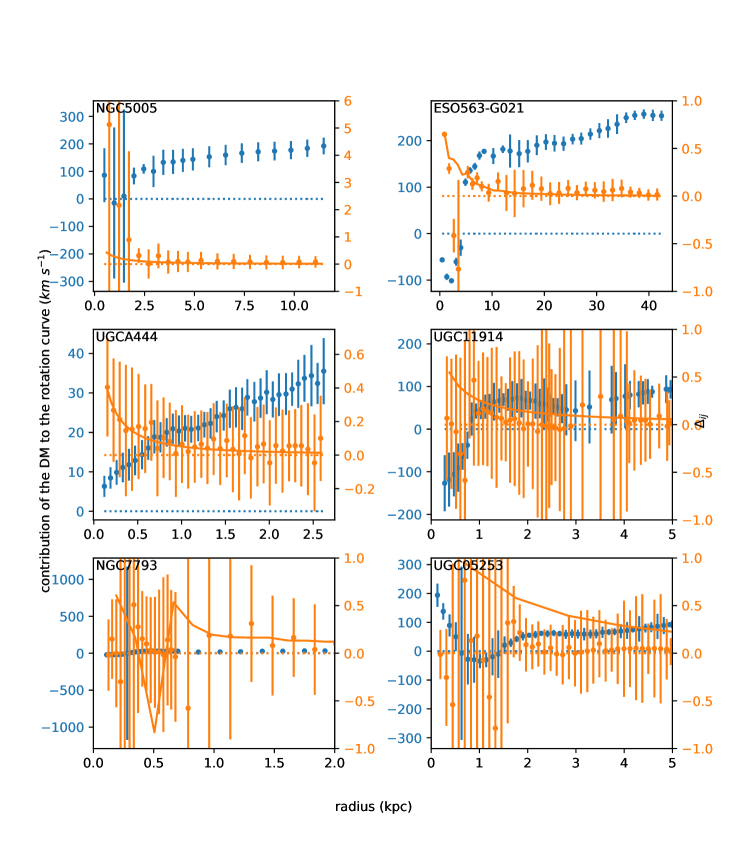
If the are independent random variables drawn from the uniform distribution , then follows a distribution with degrees of freedom. Hence we define . Now we see that implies that there is no preference for asphericity nor sphericity, while implies that the are biased toward 0 and that there is a significant preference for asphericity. We find that for every galaxy in the SPARC dataset and sphericity is not manifestly violated within the measurement uncertainties; this is shown in figure 3. In figures 5 and 6, we show a sample of 16 galaxies from SPARC that exhibit at least one significantly negative value.
Given the error provided by SPARC, these negative values are not sufficient to give evidence for asphericity. More precise measurements of these particular galaxies’ rotation curves are needed in order to determine whether any of these galaxies may contain non-spherical DM structures of the types detectable through a region of negative .
Given the present large error bars on the values from SPARC, the statistical indicator derived above is not very useful for identifying promising candidate galaxies which may have DM structure detectable through a negative . As an alternate approach, we use our fit to the SPARC rotation curves for the hadronically interacting dark matter (HIDM) model developed in [7], and calculate for the model DM distribution. This model includes a piso halo and a DM disk that scales the interaction rate per unit volume between the gas particles in the gas disk and DM particles in the DM halo. The radial density of the DM disk is
| (12) |
where is a galaxy-dependent free parameter. This leads to a model where the total observed velocity is
| (13) |
where with free parameters and ; the contribution of the DM disk is derived from equation (12). The model has a total of 4 free parameters , and per galaxy. The fitting procedure is explained in more detail in [7].
These fits allows us to select 4 galaxies that have particularly massive DM disks (Figure 4). The two galaxies in the upper row should have an in-principle-detectable-negative asphericity diagnostic stemming from their non-spherical DM component, according to our HIDM model fit. (While the fit to UGC06614 yields a small negative value of at large radius, it may be undetectably small.) This means that if the model holds and if the uncertainty on the measurements were low enough, it would be possible to detect non-spherical structures by measuring the asphericity diagnostic for their rotation curves. Fit results for a selection of other galaxies are summarized in table 2, showing that a number of other galaxies are also good candidates to display a negative .
5 Conclusion
We have introduced an asphericity diagnostic , whose positivity is a necessary condition for a spherically symmetric distribution. In section 3 we showed that the asphericity of some mass distributions such as exponential disks and rings can be detected using this tool, via a negative value of asphericity parameter .
In section 4, the diagnostic is tested on real rotation curves in the SPARC dataset in order to look for non-spherical dark matter structures. Overall, there is no strong evidence for non-spherical DM structures in the studied dataset given the precision of the measurements. However, with more precise measurements this tool could be a useful diagnostic of non-spherical DM structures that could emerge from baryon interactions. Given that the distribution of significance of the asphericity diagnostic peaks around (figure 3 right), the exact same measurements with an error smaller could show significant asphericity. Note that this is only a lower bound on the required increase in needed precision assuming identical measurement values.
The five SPARC galaxies with the highest dark matter asphericity significance are NGC5005, UGCA444, UGC11914, NGC7793 and UGC05253, with respectively; is defined (see Sec. 4) such that would be a robust indicator of asphericity. The five galaxies with the highest percentage of negative values are NGC2683, F563-1, UGC11914, NGC6015, NGC7793 with of negative values respectively. Currently, the error bars on the rotation curves are too high for these to be significant evidence of non-spherically symmetric dark matter. Moreover based on the HIDM fit of [7] the DM distribution in these galaxies – in spite of not being spherical – would not be expected to be manifestly asymmetric in the manner needed for the asphericity diagnostic to reveal it. More results for individual galaxies are summarized in table 2.
Using the HIDM model fit from [7], we identified four galaxies that are compatible with a particularly heavy dark mater disk built up through DM accretion in the baryonic disk: UGC11557, NGC7793, UGC06614 and UGC05253. These are displayed in Fig. 4 where it can be seen that NGC7793 and UGC05253 may be good candidates for future detection of small-scale structure in the dark matter distribution using the asphericity diagnostic, if measurement accuracy can be sufficiently improved.
Independently of the HIDM model of [7], galaxies displaying a strong variation in the radial distribution of gas are the best candidates for having , if any galaxies do. A DM ring would a smoking gun for HIDM interactions, and would be strongest in galaxies with the strongest gas rings. The measurement error bars in Fig. 4 include rough systematic errors assigned by the SPARC collaboration which can be reduced by more precise modeling of the radial velocity data, suggesting that the required reduction of errors in can be within reach.
In sum, to most effectively investigate whether there is a non-trivial small-scale structure in DM, as a result of DM collecting with gas, the following observational procedure is suggested:
-
1.
Identify galaxies for which good rotation curves can be obtained (viewing angle neither too edge-on or flat-on).
-
2.
Identify a subset of galaxies with strong radial variations in gas or gas+stars, especially ring-like structures.
-
3.
Make accurate measurements of the circular velocity as well as the mass distribution of gas and stars in the radial region enclosing the gas structure, with high radial resolution. It is crucial to measure all of these accurately, to accurately find the DM contribution. It is not necessary to improve the measurements at large radii far beyond the gas, which is fortunate since tracing the rotation curve at large radius can be difficult.
-
4.
Perform detailed stellar-population modeling of these individual galaxies, in order to accurately assign the correct stellar mass-to-light ratio, which may change as a function of radius.
Using this data, the DM contribution to the rotation curves of the selected galaxies can be determined, so the local asphericity diagnostic introduced here can be measured. Finding that with sufficiently small statistical and systematic error bars, even at one radial position, would provide unambiguous proof that DM has aspherical structure. (Of course, observing it at a sequence of radii and in multiple galaxies would be needed to become convinced.) The last two columns of Table 2 can be helpful in selecting promising galaxies for detecting a negative , based on the HIDM modeling of [7]. Perhaps the most favorable three in the SPARC dataset, in terms of a strong signal covering a significant radial region according to the HIDM fit, would be NGC2915, 6195 and 3521, while independently of the model, NGC7793 and UGC1155 and good candidates.
Acknowledgments
The research of G.R.F. is supported in part by NSF-PHY-2013199 and by the Simons Foundation.


| name | name | neg | name | min | name | neg | name | min | |
|---|---|---|---|---|---|---|---|---|---|
| HIDM | HIDM | ||||||||
| UGC11914 | 0.620 | NGC7793 | 0.333 | NGC7793 | -54.151 | NGC7793 | 0.333 | NGC4088 | -14.914 |
| NGC7793 | 0.598 | NGC2683 | 0.300 | UGC02885 | -4.064 | NGC3521 | 0.325 | NGC2915 | -4.485 |
| UGCA444 | 0.494 | UGC11914 | 0.219 | UGC11557 | -3.589 | NGC2683 | 0.300 | NGC6195 | -3.999 |
| NGC5005 | 0.484 | NGC6015 | 0.209 | NGC5585 | -1.517 | NGC2955 | 0.261 | UGC05253 | -2.994 |
| UGC05253 | 0.482 | F563-1 | 0.188 | NGC4088 | -1.338 | NGC6195 | 0.227 | NGC3521 | -2.165 |
| ESO563-G021 | 0.467 | NGC6195 | 0.182 | NGC6195 | -1.043 | UGC11914 | 0.219 | NGC0891 | -2.112 |
| NGC2915 | 0.461 | IC2574 | 0.182 | ESO563-G021 | -0.885 | F563-1 | 0.188 | UGC06787 | -0.964 |
| NGC2683 | 0.454 | UGC11557 | 0.182 | UGC05253 | -0.788 | IC2574 | 0.182 | UGC02885 | -0.952 |
| NGC3521 | 0.449 | NGC3726 | 0.182 | NGC6946 | -0.704 | UGC11557 | 0.182 | NGC5585 | -0.896 |
| NGC6946 | 0.433 | NGC6946 | 0.175 | UGC11914 | -0.584 | NGC2915 | 0.172 | NGC7793 | -0.883 |
| NGC4013 | 0.426 | UGC11455 | 0.143 | UGC03546 | -0.560 | NGC4013 | 0.171 | NGC7331 | -0.788 |
| NGC4559 | 0.415 | NGC5033 | 0.143 | UGC02953 | -0.485 | NGC2998 | 0.167 | UGC08699 | -0.707 |
| UGC02953 | 0.409 | UGC05253 | 0.139 | F583-1 | -0.321 | NGC5033 | 0.143 | UGC11914 | -0.585 |
| NGC6195 | 0.406 | NGC2915 | 0.138 | UGC08699 | -0.303 | UGC02916 | 0.143 | UGC02953 | -0.520 |
| UGC12506 | 0.405 | UGC03546 | 0.138 | NGC0289 | -0.302 | NGC6946 | 0.140 | UGC03546 | -0.473 |
| NGC0289 | 0.391 | UGC12506 | 0.133 | NGC4157 | -0.211 | NGC6015 | 0.140 | NGC2955 | -0.421 |
| F563-1 | 0.384 | NGC2955 | 0.130 | NGC4013 | -0.106 | UGC12506 | 0.133 | UGC11557 | -0.390 |
| NGC2976 | 0.376 | NGC2976 | 0.115 | NGC3726 | -0.103 | UGC02953 | 0.132 | UGC02916 | -0.345 |
| UGC11557 | 0.374 | NGC4013 | 0.114 | UGC11455 | -0.083 | NGC2403 | 0.125 | F583-1 | -0.327 |
| F583-1 | 0.369 | UGC02953 | 0.114 | UGC09037 | -0.080 | UGC05253 | 0.125 | NGC2998 | -0.298 |
References
- [1] James Binney and Scott Tremaine “Galactic dynamics”, 1987
- [2] Jatan Buch, Shing Chau (John) Leung and JiJi Fan “Using Gaia DR2 to constrain local dark matter density and thin dark disk” In Journal of Cosmology and Astroparticle Physics 2019.04 IOP Publishing, 2019, pp. 026–026 DOI: 10.1088/1475-7516/2019/04/026
- [3] J. Einasto “On the Construction of a Composite Model for the Galaxy and on the Determination of the System of Galactic Parameters” In Trudy Astrofizicheskogo Instituta Alma-Ata 5, 1965, pp. 87–100
- [4] JiJi Fan, Andrey Katz, Lisa Randall and Matthew Reece “Double-Disk Dark Matter” In Physics of the Dark Universe 2.3, 2013, pp. 139–156 DOI: https://doi.org/10.1016/j.dark.2013.07.001
- [5] Federico Lelli, Stacy S. McGaugh and James M. Schombert “SPARC: Mass Models for 175 Disk Galaxies with Spitzer Photometry and Accurate Rotation Curves” In The Astronomical Journal 152.6 American Astronomical Society, 2016, pp. 157 DOI: 10.3847/0004-6256/152/6/157
- [6] Pengfei Li, Federico Lelli, Stacy McGaugh and James Schombert “A Comprehensive Catalog of Dark Matter Halo Models for SPARC Galaxies” In The Astrophysical Journal Supplement Series 247.1 American Astronomical Society, 2020, pp. 31 DOI: 10.3847/1538-4365/ab700e
- [7] Nicolas Loizeau and Glennys R. Farrar “Galaxy Rotation Curves Disfavor Traditional and Self-interacting Dark Matter Halos, Preferring a Disk Component or Einasto Function” In The Astrophysical Journal Letters 920.1 American Astronomical Society, 2021, pp. L10 DOI: 10.3847/2041-8213/ac1bb7
- [8] Matthew McCullough and Lisa Randall “Exothermic double-disk dark matter” In Journal of Cosmology and Astroparticle Physics 2013.10 IOP Publishing, 2013, pp. 058–058 DOI: 10.1088/1475-7516/2013/10/058
- [9] S. S. McGaugh and J. M. Schombert “Color-Mass-to-light-ratio Relations for Disk Galaxies” In AJ 148, 2014, pp. 77 DOI: 10.1088/0004-6256/148/5/77
- [10] S. E. Meidt et al. “Reconstructing the Stellar Mass Distributions of Galaxies Using S4G IRAC 3.6 and 4.5 m Images. II. The Conversion from Light to Mass” In ApJ 788, 2014, pp. 144 DOI: 10.1088/0004-637X/788/2/144
- [11] L. Mestel “On the galactic law of rotation” In MNRAS 126, 1963, pp. 553 DOI: 10.1093/mnras/126.6.553
- [12] V. C. Rubin, Jr. Ford and N. Thonnard “Rotational properties of 21 SC galaxies with a large range of luminosities and radii, from NGC 4605 (R=4kpc) to UGC 2885 (R=122kpc).” In ApJ 238, 1980, pp. 471–487 DOI: 10.1086/158003
- [13] James Schombert and Stacy McGaugh “Stellar Populations and the Star Formation Histories of LSB Galaxies: III. Stellar Population Models” In Publications of the Astronomical Society of Australia 31 Cambridge University Press, 2014, pp. e036 DOI: 10.1017/pasa.2014.32
- [14] Katelin Schutz, Tongyan Lin, Benjamin R. Safdi and Chih-Liang Wu “Constraining a Thin Dark Matter Disk with ” In Phys. Rev. Lett. 121 American Physical Society, 2018, pp. 081101 DOI: 10.1103/PhysRevLett.121.081101