Doing good by fighting fraud: Ethical anti-fraud systems for mobile payments
Abstract
App builders commonly use security challenges, a form of step-up authentication, to add security to their apps. However, the ethical implications of this type of architecture has not been studied previously.
In this paper, we present a large-scale measurement study of running an existing anti-fraud security challenge, Boxer, in real apps running on mobile devices. We find that although Boxer does work well overall, it is unable to scan effectively on devices that run its machine learning models at less than one frame per second (FPS), blocking users who use inexpensive devices.
With the insights from our study, we design Daredevil, a new anti-fraud system for scanning payment cards that works well across the broad range of performance characteristics and hardware configurations found on modern mobile devices. Daredevil reduces the number of devices that run at less than one FPS by an order of magnitude compared to Boxer, providing a more equitable system for fighting fraud.
In total, we collect data from 5,085,444 real devices spread across 496 real apps running production software and interacting with real users.
I Introduction
Smartphones and apps are ubiquitous, with billions of daily users and over 5 million apps available for everything from dating and travel to payments and food deliveries. Unfortunately, smartphones and apps have also ushered in a new generation of attacks [7, 11, 37], forcing app builders to design and implement user-centric security measures, or challenges, in their apps [35, 6, 30]. Examples of this new style of verification include Apple’s FaceID where they use face biometrics to authenticate a user [25], Uber’s credit-card scanning where they ask users to scan their card to prove that they possess it [50, 40], Coinbase’s ID verification where they ask users to scan an ID to prove who they are in the real world [26], and Lime’s Access program that allows people of a low socioeconomic status to scan IDs and utility bills to prove that they qualify for discounted rental fees [28].
Challenges have the potential to skirt the difficult ethical issues that apps face with security decisions in their apps. In a typical app, the app will have an algorithm that predicts whether a user or a transaction is suspicious. These algorithms could potentially rely on features that unfairly influence its decision, such as a zip code. To reduce the impact of mistakes by their algorithms, apps can use user-centric security measures in lieu of suspending users or blocking transactions. This technique allows users that the algorithm blocks incorrectly to verify themselves or their payment methods automatically. Thus, even if their algorithm has bias [19], challenges provide an avenue for making sure that everyone can access the app.
Unfortunately, challenges open a new set of ethical conundrums. Apps that want to respect end-user privacy and run their challenges via compute intensive machine learning models on the device will have to cope with the 1-4 orders of magnitude difference in capabilities on the devices that they will see in practice (Section III). Apps that opt for predictable ML performance by streaming data to a server and running their ML there will have to deal with a 1000x difference in bandwidth between 3G and 5G networks [52], and the people who use it may have to pay for that bandwidth directly. Security challenges must deal with these subtleties of practical deployments or else they will block users unethically.
The most dangerous aspect of the ethical implications inherent with security challenges is that they solve an app’s business problem but have the potential to still make compromises on users of a low socioeconomic status. One example of this tradeoff is with Lime’s Access program [28]. Lime allows users from low-income households to get reduced rates with Lime rentals by proving that they qualify for the program by scanning welfare documents or utility bills. These documents contain personal information that typical Lime users do not have to provide, and Lime does not process these documents themselves, they use a third party for this service [27]. Just to be clear, we, as proponents of this program applaud Lime for implementing it, but Lime forces users to give up privacy to qualify. It would be better if they could prove that these documents are genuine without needing to send sensitive information to a third-party server.
A second example is Boxer [9], a system presented at Usenix Security 2020 for scanning credit cards to prove that the user possesses the genuine physical card. Boxer uses client-side machine learning to verify the credit card. However, based on our measurement study of Boxer’s open-source card scanner (Section III), Boxer fails on 68.13% of Android devices that run its ML at less than one FPS. Slower ML inference corresponds to lower frame rates and thus, fewer inputs that the system processes for verification. Like Lime’s Access program, apps that use Boxer solve their business problem – only 4.19% of the total devices that we measure are Android devices that run Boxer’s ML at less than one FPS. By using Boxer, apps recover most of the people that their security systems flag incorrectly. However, by blocking devices that are unable to run their ML models fast enough, they run the risk of denying access to at-risk populations simply because they have an inexpensive device.
The inability to run challenges on resource-constrained devices introduces a new bias that the existing formulations of machine learning fairness [29, 10, 19, 31, 4] are ill-equipped to solve. Existing formulations of machine learning fairness modify either the decision engine or the feature set corresponding to an individual of a protected group to ensure that protected attributes (e.g., race) do not affect the outcome. However, being unable to run models on resource-constrained devices robs the decision engine of the inputs it needs to make a decision in the first place. Although the decision engine could randomly pass individuals whose devices are low end or randomly block otherwise good users to provide a notion of fairness, both degrade the performance of the overall system since they weaken their ability to distinguish between legitimate and fraudulent users. No algorithmic or theoretical notion of fairness can account for this lack of data.
Our position is that ethical security challenges should run client side, support complex machine learning (if needed), and run effectively on resource-constrained devices. In this paper, we present Daredevil, a system for running complex client-side ML models for security on the full range of devices one is likely to see in practice today. Daredevil’s design includes decomposing machine learning tasks for redundancy and efficiency, streamlining individual tasks for improved performance, and exploiting task and data parallelism.
We demonstrate Daredevil by designing and implementing a new credit card scanning and verification system. Card scanners use complex machine learning models and hundreds of apps use them in practice [9], which make them a good candidate for Daredevil. We deploy Daredevil to real apps and demonstrate how it provides access to a wide range of devices. Through our deployment, we run Daredevil on over 1,580,260 devices from real users and show how Daredevil both enables resource-constrained hardware to run security ML models effectively, and it improves the end-to-end success rates on well-provisioned hardware with support for fast ML models.
Our contributions are:
-
•
We present the first large-scale in-field study of on-device deep learning for security. Our measurements focus on Boxer, a system for scanning credit cards, where we demonstrate that due to the degree of hardware diversity, deep-learning-based security challenges have the potential of being unethical despite solving the apps’ business problem.
-
•
We uncover insights from our measurement study such as critical reasons for failure cases, key system metrics, and mitigation strategies that developers should consider when designing a client-side machine learning pipeline.
-
•
Equipped with the insights from our measurement study, we design, implement, and deploy Daredevil, which empowers card scanning and verification to run on a wide range of devices.
II Background: Card-not-present credit card fraud and card scanning
Fraudsters acquire stolen credit card information and use it to make purchases online, without possessing the actual physical card. This is known as card-not-present credit card fraud. When the real owner of the card notices a suspicious charge on their credit card statement, they report it to the credit card company. Upon investigating the transaction, if the credit card company finds the transaction to be fraudulent, they will issue a chargeback to the app. The app will have to pay back the money to the real owner of the card, and an additional dispute fee to the credit card company [48]. This protects the owner of the credit card and puts the responsibility of curbing card-not-present credit card fraud on the app.
Recently, researchers propose Boxer [9], a mobile SDK and server that app builders integrate with apps to prevent card-not-present credit card fraud. Boxer shows how to scan the number side of a card and verify that it is genuine. Boxer casts card verification as a machine learning problem that it divides into three main parts: optical character recognition (OCR), fake media detection (implemented via screen detection in their paper), and card tampering detection (called a Bank Identification Number or BIN consistency check in their paper). OCR pulls the card number, expiration, and legal name off the card. Screen detection detects when a user scans a card from a screen instead of using a physical card. Card tampering detection finds prominent objects on the card, like the bank logo, and correlates this information with the OCR prediction to confirm that these objects are consistent with the type of card that they expect. For instance, if OCR detects a BIN (first six digits of the card number) of a Chase Visa payment card but the card tampering detection detects a Bank of America logo or Mastercard logo, Boxer flags this scan as fraudulent.
However, Boxer falls short in the following ways: First, OCR, as their first line of defense, stops the vast majority of fraudsters as per their evaluation. However, as we describe in our measurement study (Section III), Boxer’s OCR under performs on low-end devices. Second, Boxer’s fraud checks only scan the number side of the card. However, newer card designs in the wild contain visual design elements on either side of the card, so by scanning only the number side of the card Boxer misses out on key information. Third, Boxer only flags cards scanned off screens and not other fake media.
III Measurement study
In this section, we present the first large-scale measurement study of a security challenge using deep learning on mobile devices. We study the practical characteristics and limitations of credit card scanning using real apps running on end-user devices with real people and credit cards, and all the idiosyncrasies inherent in large-scale software with live deployments.
We believe this study is the first of its kind and has implications for deep learning engineers, app developers, and hardware vendors. The closest to our study in terms of scale is presented by Ignatov et. al [24], however, their study is limited to only 10,000 Android devices and runs pre-defined images through pre-trained models loaded on each device to benchmark the hardware.
Ours is an in-field correlation study and represents a realistic usage scenario for end-users since we benchmark the usage of a deep learning driven application where the user, the phone sensor, image processing, ambient lighting, device surface temperature, the compute capability of the device and other production variables determine the performance of the system. In our study, we protect end-user privacy by limiting the amount and nature of the statistics that we record, the metrics have enough fidelity that they inform our end-to-end design (Section V), resulting in significant improvements in the wild (Section VI).
Our university’s IRB board reviewed our study and ruled it to be exempt from IRB.
III-A Measurement study goals and questions
Our high-level goal is to understand the practical performance and limitations of camera-based mobile security challenges in real-world conditions. We perform our study using Boxer, a widely deployed credit card scanning system and measure its success rate as the primary metric for success. To understand the performance and limitations, we focus our correlation study on three primary questions.
How does the speed of ML predictions influence end-to-end metrics for success? The research community and industry have put a heavy emphasis on performance for ML predictions through machine learning models designed specifically for mobile devices [21, 23, 45, 20] and hardware support for fast inference [2, 16]. We measure the impact of these efforts on high-level metrics for success.
How widely do the ML capabilities on modern phones vary in the field? We measure the range of ML capabilities one is likely to see in practice. By understanding the range of capabilities, one can anticipate the performance differences for security challenges in realistic settings. Also, we quantify the number of devices that are unable to run Boxer ML effectively, which for a security check blocks the user.
How long are people willing to wait when they try to scan documents with their phone? As there are many forms of scanning documents that apps use for security checks, understanding how long people are willing to wait as they try to scan informs the overall design of a security check. Security check designers will know how long they have to capture relevant information before someone gives up.
III-B Measurement Platform
To measure Boxer’s performance, we instrumented Boxer’s open-source SDK and made it available to third-party app developers. We then measured the success rate for the users of their live production apps. We present results from anonymous statistics sent by 496 apps that deployed and ran the instrumented library from July 2019 to late November 2020.
III-C Testbed
Our instrumented Android SDK ran on a total of 329,272 Android devices spanning a total of 611 Android device types. This included 168,658 Samsung devices spanning 281 Samsung device types, 49,329 Huawei devices spanning 91 Huawei device types, 80,351 Xiaomi devices spanning 64 Xiaomi device types, 5,464 LG devices spanning 63 LG device types, 2,939 Google devices spanning 11 Google device types, 2,501 Motorola devices spanning 27 Motorola device types, 2,560 OnePlus devices spanning 18 OnePlus device types and tail of 17,470 devices, spanning 56 device types and 23 vendors. Our instrumented iOS SDK ran on a total of 3,175,912 iOS devices spanning a total of 27 iOS device types.
III-D Task
Our instrumented SDK prompts users to scan their credit cards. When invoked, it starts the camera and prompts users to place their card in the center of the viewport. The OCR processes the frames obtained from the camera and attempts to extract the card number and the expiry from the card. Upon success, the card number and the expiry are displayed to the user and the SDK sends the scan statistics to our server. In case, the OCR is unable to extract the number, the flow doesn’t time-out, instead we let the user cancel the scan which provides us an additional user-level metric that can guide a new design.
Boxer uses a two-stage OCR similar to Deep Text Spotter [8], consisting of a detection phase to detect groups of digits in credit card images and a recognition phase to extract individual digits from these groups.
Both models use a modified version of MobileNet [21], where the detection model occupies 1.75MB and the recognition model occupies 1.19MB on disk.
The detection model processes an input image of size 480x302x3 and generates a total of 1,734 proposals. It has a total of 910,379 parameters of which 901,379 are trainable. There are 16 2D convolution blocks and 10 Depthwise convolution blocks, each followed by a batch-norm and an activation layer.
The recognition model processes input images of size 36x80x3, each corresponding to the proposal generated by the detection model and generates a feature map of 17x11 for each proposal. It has a total of 618,540 parameters of which 611,754 are trainable. There are 14 2D convolution blocks and 8 Depthwise convolution blocks, each followed by a batch-norm and an activation layer.
For inference, the iOS SDK uses the vendor specific CoreML which runs the models on the CPU, the GPU and the Neural engine depending upon the availability and usage at any time. The Android SDK uses a generic interpreter TFlite, where the inference primarily runs on the CPU. Boxer’s models are quantized using 16-bit floating point weights.
III-E Results
III-E1 Key Performance Metrics
Success rate: We define success rate as the ratio of the number of users where the scanner successfully extracted the card number to the total number of users using the scanner.
Frame rate: We define the frame rate as the number of frames from the camera processed by the OCR pipeline (detection and recognition) per second.
| Android FPS | Count | Success rate |
|---|---|---|
| 1 FPS | 146,890 (44.61%) | 31.87% |
| 12 FPS | 97,798 (29.70%) | 49.97% |
| 2 FPS | 84,584 (25.68%) | 68.72% |
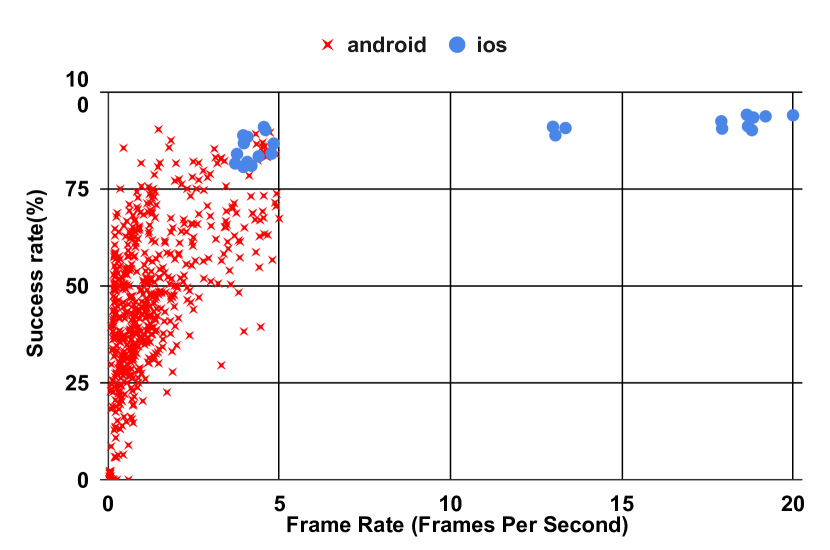
Figure 1 shows the variation in success rate against the frame rate for different devices. We omit iPhone 6 and below devices from our deployment since Boxer does not support them.
Data from Figure 1 and Figure 2 suggests:
-
•
Both the frame rate and the success rate are higher on iOS than on Android when using the same machine learning models and same system architecture.
-
•
Boxer is ineffective on Android devices when the frame rate is less than 1 FPS. These devices make up 44.61% of the Android devices in our study and achieve a success rate of 31.87% compared to 49.97% for devices that run at 1-2 FPS and 68.72% for devices that run at 2 FPS or higher.
| Platform | Count | Avg Success | Avg | Avg |
|---|---|---|---|---|
| Rate | FPS | Duration (s) | ||
| Android | 329,272 | 46.72% | 1.303 | 14.45 |
| iOS | 3,175,912 | 88.60% | 10.00 | 10.02 |
Figure 3 shows aggregate results for iOS and Android. While the success rate for iOS is 88.60%, the success rate for Android is much lower at 46.72%.
| Platform | Count | Avg | Avg |
|---|---|---|---|
| FPS | Duration (s) | ||
| Android | 175,435 | 1.00 | 16.20 |
| iOS | 361,924 | 9.28 | 20.73 |
III-E2 Further analysis of failure cases
We measure how long users are willing to wait to scan their cards by measuring how long people scan for when they are unsuccessful in scanning their card. Measuring the time that people are willing to wait while scanning informs our decisions when designing the system and trading off scan times vs accuracy and fraud signal fidelity.
From our real-world deployment of 3,505,184 scans, we observed 537,359 failed attempts where users gave up on trying to scan their card. We aggregate the duration of these scans on iOS and Android to report that Android users waited an average of 16.20s and iOS users waited an average of 20.73s to scan their cards before giving up (Figure 4).
III-F Context for the results
For its fraud challenge, Boxer uses OCR to verify the card number that the app has on record for any user. Thus, anyone who is unable to scan their number will be unable to pass the fraud challenge. Additionally, OCR is the first model in the Boxer pipeline and is used to extract data like the first six digits (BIN), which is then correlated with other features like the credit card design to determine fraud. However, if the first model in the pipeline fails to run, the device is implicitly denied the service.
Boxer solves the business problem that its designers intended to solve, since it runs OCR successfully on 84.7% of the devices overall. However, the success rate on devices that run at a rate of less than 1 FPS is mere 31.87%, and these devices make up 44.61% of the Android devices we measure, introducing a potential ethical conundrum by blocking users solely because they have an inexpensive device.
IV Overview
In this paper, we introduce Daredevil, a new system that we design and implement to realize ethical deep learning powered user-centric security challenges, with the goal of providing equal access to all users. Although we built Daredevil to prevent card-not-present credit card fraud, the insights gained from Daredevil can also be applied to design other end-user security challenges.
To provide equal access, Daredevil must be fast, even on resource-constrained devices that lack hardware acceleration for machine learning, Daredevil must respect end user privacy, and Daredevil must be accurate to avoid incorrectly flagging otherwise good users as being fraudulent.
Our work on Daredevil builds off recent work from Din et al. [9] that shows how to scan the number side of a card and verify that it is genuine using a system called Boxer, as described in Section II.
We demonstrate the design of an ethical fraud challenge by improving Boxer in the following ways:
-
•
We design a new fast and efficient OCR that also runs well on resource-constrained devices.
-
•
We propose a machine learning pipeline that combines the different models to provide efficiency and redundancy.
-
•
We introduce a new card detection model that operates in concert with card tampering detection to scan both sides of the card.
IV-A Threat model
In our threat model, our goal is to reduce financial fraud while ensuring that all users can pass our challenge. Our focus is on challenges that apps can use to verify that people possess a genuine credit card.
We assume that the attacker has stolen credit card credentials (e.g., the card number and billing ZIP code), but does not possess the real credit card.
Our machine learning models run client side, where Daredevil processes credit card images on the device before passing a distilled summary of the machine learning output to our server, where we make the ultimate decision about if a scan is genuine. As our models run client side, we are susceptible to attackers who tamper with the app, the video stream, or our machine learning models. Although we do have some measures in place to assess the integrity of our client-side software (e.g., DeviceCheck on iOS and SafetyNet on Android), we recognize that this type of assurance is still an ongoing arms race between app builders, device manufacturers, and attackers. Our design favors end-user privacy even though it does open us up to client-side attacks.
IV-B Architecture
To scan cards and verify that they are genuine, Daredevil asks users to scan the front of their card and the back. This makes Daredevil flexible to verify a wide range of card designs where meaningful information can be on either side of the card. Scanning both sides also provides more data for us to detect signs of tampering than if we scan only a single side. Our checks inspect individual card sides to ensure that they are genuine, as well as combining information from both sides to make sure that it is consistent.
However, scanning both sides of the card complicates the machine learning aspects of verifying a card. First, credit cards are free to print design elements on either side. Second, users (and some of the authors) are unaware of which side of the card is the front versus the back. Therefore, Daredevil must be flexible enough to pull out the appropriate information to detect fraud dynamically and adapt automatically to scan the appropriate side of the card for each scan. The net result is that to verify cards Daredevil must run more machine learning models than it would if it were just scanning a single side of the card.
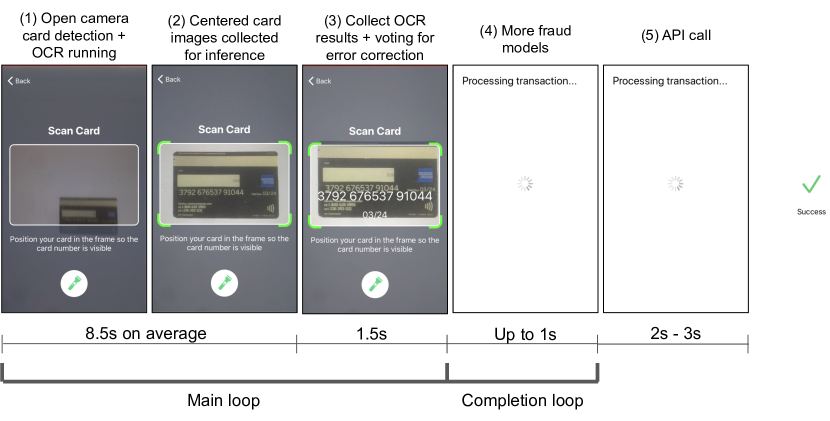
Figure 5 shows this overall process from a user’s perspective. First, the user (1) opens the flow, which starts the camera. Then (2) when they put the card in the center of the viewport, we update the user interface to give them feedback. In parallel, (3) the card detection and the OCR models run and we display the details that the OCR extracts from the card. After the first successful OCR prediction we continue running the card detection and OCR models for 1.5s and collect additional predictions about the OCR details to vote and correct any mispredictions. After the error correction process completes, (4) we run the fake media detection and card tampering detection models on a subset of the images that we process for up to 1s, before (5) making an API call to our server to judge if the scan included a genuine physical card. This API call includes the output of our client-side machine learning models and our server-side logic implements rules to make a final overall decision about the validity of a scan.
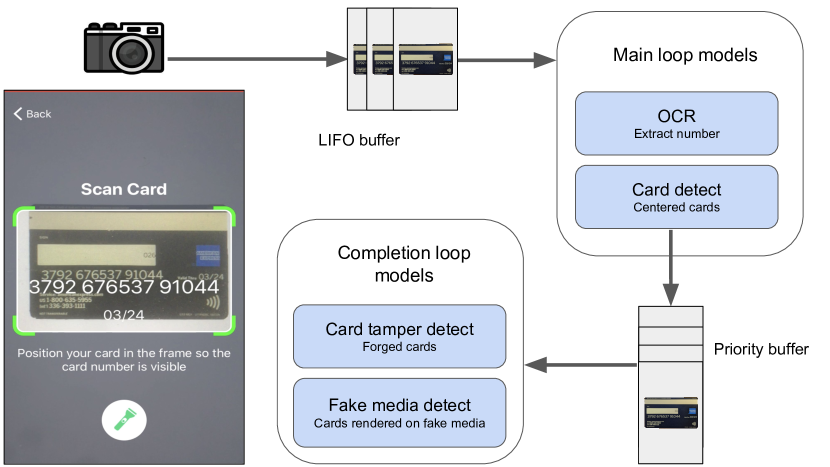
Figure 6 shows our client-side machine learning pipeline for processing images (frames) from the camera. This pipeline uses two different producer/consumer modules and divides the computation up into a main loop and a completion loop. The main loop runs on images in real time as the camera extracts images, and the completion loop runs after the main loop finishes but before making the final API call.
In this flow we show the scanning process for a single side of the card, but in Daredevil we scan both sides of the card using the same basic process before making the final API call. We introduce a card detection model that detects the side of the card, which we use as the basis for our two-side scan. See Section V-D for more details.
V Design
V-A Challenge: Where to run verification?
Card verification can either run on the client or on the server. Server-side verification moves compute intensive machine learning inference away from the edge. This server-centric architecture ensures verification can run on all phones, regardless of their compute capabilities while also simplifying the role of the client to merely relay data to the server. However, server-side verification puts higher strain on network bandwidth and latency, with the need to transmit frames from the camera to the server, resulting in delays in verification.
Server-side verification also disregards end-user privacy. With server-side verification, the app sends sensitive user information, such as card images, to the server, thereby introducing potential avenues for data breach.
Running verification on the mobile client involves running compute intensive machine-learning inference on the client and only sending high-level features to the server. This client-first architecture puts less strain on the network and can process more frames faster by virtue of running closer to the camera. Importantly, client-side verification is more respectful of end-user privacy since it avoids sending sensitive card images to the server.
V-B Solution: Run verification on the client
We believe that there are more good users than fraudsters and respecting the good user’s privacy should be the foremost concern for anyone attempting to combat fraud. Additionally, one way fraudsters source stolen card information is through data breaches, and we strive to minimize these avenues. Thus, Daredevil chooses to run its verification on the client. Daredevil’s system design and algorithmic improvements ensure the running of uniform verification on resource-constrained and well-provisioned devices across different platforms.
V-C Challenge: How to ensure high verification accuracy on a mobile phone?
The input to our models is an image or a video stream of a user holding a card. Changes in illumination, varying camera quality, orientation of the payment card, wear patterns on the card, and so on add to the stochasticity of the inputs, which makes it difficult to ensure high accuracy. However, since we use this input to verify or block a user, ensuring high accuracy is critical to provide uniform verification.
A common solution to ensure high accuracy in machine learning is to increase the model size. However, apps are hesitant to increase the size of their binary [44], mobile networks can be slow and content distribution networks are expensive (a 5MB machine learning model downloaded 50 million times in a month costs north of $30k / month) complicating model downloads in the background. All of which puts pressure on client-side machine learning to keep model sizes down while still providing fast and accurate predictions.
V-D Solution: Decompose verification to sub-tasks for improved efficiency and redundancy
We decompose card verification into multiple tasks, with each task having its own independent machine learning model. Decomposition of the verification process into sub-tasks keeps each sub-task efficient while also providing redundancy across tasks for improved accuracy. Decomposition also enables us to iteratively refine models for each individual task until the models reach an acceptable level of accuracy.
Daredevil decomposes verification into four distinct sub-tasks: OCR, card detection, fake media detection, and card tampering detection. OCR scans the number side of the card and extracts the card number, card detection detects frames where the user centers the card in the viewport and detects the side of the card that the user scans (number or non-number side), and fake media detection checks both sides of the card to detect cards scanned off fake media such as device screens, paper, cardboard etc.
Card tampering detection also scans both sides of the card to detect signs of tampering and inconsistencies. We scan both sides since newer card designs have meaningful information printed on both sides. For instance, newer Wells Fargo payment cards contain the bank and payment network logos on one side and the card number and expiry on the other side. In this case, if the card tampering detection detects a Wells Fargo card number on one side and detects a conflicting bank logo on the same or opposite side, Daredevil flags the scan as fake.
Decomposition leads to higher accuracy in two ways. First, our decomposition makes our overall system more efficient, allocating limited ML resources towards the images that are most likely to generate meaningful signals (Section V-D1). Second, our decomposition provides redundant signals to increase the confidence of the predictions that Daredevil makes (Section V-D2).
V-D1 Efficiency with decomposition
If we pass every frame coming from the camera through all our machine learning models, then we waste computation. For example, if there is an image without a card in it, then running the fake media detection model or the card tampering detection model on that image is wasteful because there isn’t even a card in the image, and it won’t provide meaningful results.
Instead, to make our overall ML pipeline more efficient, we divide computation up into a main loop that runs on all frames in real-time, and a completion loop that defers running of models and operates on only a subset of the frames that we believe are most likely to have relevant fraud signals. Logic in the main loop dictates which frames it passes on to the completion loop, which in Daredevil are any images that have centered cards in them. Figure 6 shows Daredevil’s decomposition.
At the heart of our design is the card detector model. The card detector model is a 3-class image classifier that we train to detect a centered image of the number side or a centered image of the non-number side of a card. The card detector also has a third class, called the background class, to filter out frames that contain off-center cards or no cards at all.
We execute the card detector and OCR models on the main loop. The reason that we run these models on the main loop is because they both produce user-visible outputs (Figure 5). The card detection model highlights the corner of our viewport when it detects a centered card and our OCR model displays the recognized card number and expiration date using an animation as it captures them. Thus, these models must run in the main loop to process frames in real-time and display their results to the user. We finish the main loop by using the results from the card detection model to determine when the user scans either the number side or non-number side of a card for 1.5 seconds.
We execute the fake media detection and card tampering detection models on the completion loop. These models only produce a result that our system uses to detect fake cards via an API call, so we defer execution until after the main loop finishes and only run them on a subset of frames (up to six in our current system) identified by the card detector model that are likely to produce evidence of fake cards. Our decomposition keeps the system efficient by having the completion loop save computation by only processing frames with centered cards.
V-D2 Redundancy with decomposition
Daredevil uses different forms of redundancy for each of its models to provide high confidence in the accuracy of its decisions. Some models have a built-in validation signal for redundancy, while others require external validation signals for redundancy.
More concretely, OCR has redundancy built into its design from the Luhn algorithm [18]. The Luhn algorithm is a checksum used to validate credit card numbers. Thus, we validate OCR predictions by making sure that they satisfy the Luhn checksum.
In contrast, our card tampering detection model detects prominent objects on cards (e.g., the Visa symbol) and our fake media detection model detects cards scanned off fake media and do not contain a built-in validation signal. Thus, we use the predictions of the card detection model and OCR to provide redundancy. Correlating predictions between models reinforces their decisions. For example, predictions of seeing a card by the card detection model, and detecting the presence of a Visa symbol by the card tampering detection model reinforce each other. For the number side, these predictions also reinforce OCR and in turn OCR reinforces them.
Additionally, OCR, card tampering detection, and fake media detection benefit from voting on predictions across the frames they process for redundancy. For example, if our fake media detection model processes five frames and predicts the presence of a computer screen on three of them, and no screen on the remaining two, its final decision is that a screen is present.
| Task | Redundancy used | Redundancy provided |
|---|---|---|
| Card detection | None | Centered and focused card present |
| OCR | Luhn + voting | Card number and location |
| Card tampering | Voting + validation from card detection and OCR | None |
| Fake media detection | Voting + validation from card detection | None |
Figure 7 summarizes the different forms of redundancy we use with each model.
Redundancy is the most important lesson learned from our implementation. Even if a model achieves an accuracy of 100% on a benchmark validation dataset, it can still fall short for a practical system. Instead, one needs to supplement these predictions with additional data via voting and validation signals. To cope with the uncertainty inherent in real deployments and to handle active attackers, we need these forms of redundancy.
V-E Challenge: How to account for resource-constrained mobile phones?
Owing to differences in sensor quality and compute capabilities, there is a stark difference in the performance of running image processing machine learning tasks on resource-constrained and well-provisioned phones. At best, the result of the difference in this performance inconveniences users by making them wait longer to verify their cards, and at worst, prevents users from verifying themselves. In either case, fraud systems penalize users attempting to verify themselves simply for not possessing a well-provisioned phone.
From our measurement study (Section III), we can see first-hand the stark differences in running the same machine learning models on well-provisioned and resource-constrained devices in a production setting. Even though machine learning inference is expected to improve with streamlined accelerated hardware support (GPUs, Neural Engine) on iOS which will bridge the gap between resource-constrained and well-provisioned iPhones, it continues to be a problem on Android phones due to inherent hardware heterogeneity, with over 2000 SoCs in distribution, making optimizing for each of them difficult.
Thus, to have uniform verification on all devices irrespective of hardware capabilities, there is a need for software enhancements for efficient machine learning inference.
V-F Solution: Refine machine learning models and improve system design to provide faster effective frame rates
Our solution to account for resource-constrained phones consists of algorithmic machine learning improvements for faster inference times and refined system design for higher utilization of the hardware.
V-F1 Improvements in machine learning
The following two key principles inform our machine learning re-design:
(1) Optimize machine learning for resource-constrained phones: Machine learning optimization for resource-constrained phones translates to well-provisioned phones as well but the reverse is not true. Well provisioned phones often employ hardware acceleration optimized for efficient machine learning inference. Having this hardware support means that we can increase the capacity of machine learning models either by adding more parameters or by breaking a problem into sub-problems each executed with a separate machine learning model. This has a sub-linear slow-down in performance, leading to a better speed versus accuracy trade off. However, resource-constrained phones do not possess this luxury and adding parameters to the model has at least a linear slow-down in performance (it was quadratic in our case).
We thus create a unified model for OCR and reduce the number of parameters by half. This leads to a quadratic speed up on resource-constrained phones and close to a linear speed up on well-provisioned phones as well. The new model also occupies half the disk and memory space of the original model, as an added benefit to memory constrained devices.
In addition to the algorithmic improvements, using a single model avoids expensive and complex processing to convert the output of one model into the input of another, leading to a more efficient implementation with less code needed to interpret the results.
(2) Optimize machine learning for the common case: Following our previous design principle of using a single model for OCR implies that we are operating at half the machine learning capacity as before leading to an inevitable tradeoff between accuracy and speed. We observe that with a unified model for OCR we need to add complex auxiliary layers at multiple stages in the model to scan all payment card designs. However, these auxiliary layers add parameters to the model as well as increase the post processing complexity making them prohibitively slow on resource-constrained devices.
We thus add native support in the model for the most common designs and employ system design strategies to account for less common card designs. This ensures our machine learning inference is efficient for the common case employing gated execution of more complex pipeline for less common cases.
OCR model design: With the above two design principles, we design and implement a new OCR model to work in a single pass. Our new model draws on ideas from existing work on Faster-RCNN [43], SSD [34] and Yolo [42].
We replace Boxer’s detection and recognition stages, which were implemented using two separate models, with a single network. The network reasons globally about the entire image resulting in end-to-end training and faster inference. We implement the model as a fully convolutional MobileNetV2 [45] with auxiliary features for detection and recognition unifying separate components of the detection and recognition into a single network. We append these features to the network at different layers to account for multi-sized feature maps, like SSD [34]. This flexibility gives us the ability to operate on credit cards with varied font sizes.
Our OCR model operates on an input image size of 600x375 pixels, which is close to the aspect ratio of a credit card. As with any CNN, the feature map shrinks in size and expands in the depth dimension as the network processes the image. We add auxiliary layers to the network at two places, one where the feature map size is 38x24, and another where the feature map size is 19x12. We find adding multi-layer predictions at these two layers captures the vast majority of credit card fonts. The activations corresponding to feature map of size 38x24 are useful for small and flat font payment cards while the activations corresponding to the feature map size 19x12 are used for embossed cards that have bigger fonts.
At the output feature maps, each activation is responsible for detecting a digit. To extract the card number from an image, we need to localize and recognize individual digits. Knowing the location and value of each digit in the input image aids in post processing to remove false positives. Accordingly, each activation in the two output feature maps is mapped to a regression layer (for localization) and a classification layer (for recognition). We implement the regression layer with anchor boxes like Faster-RCNN [43], where the possible output locations are captured with multi-aspect-ratio bounding boxes. Unlike Faster-RCNN which uses nine anchor boxes per location, we only use three, since we find this to be sufficient for OCR. We also fine-tune our bounding box scales for OCR; however, we defer these details to the open source code we make available. To each output feature map activation, we append a regression layer that consists of mapping each input activation to 12 output activations, since we output three bounding box proposals each containing four coordinates. Each of these proposals (bounding boxes) can contain a digit that the classification layer detects. The classification layer maps each input activation to 33 output activations, 11 activations (background, 0 to 9) per bounding box.
During inference we apply standard post processing techniques like non-max suppression [12] and heuristic based refining that is relevant to different credit card designs.
Our OCR model has difficulty in localizing small objects precisely, much like Yolo [42] and SSD [34]. Since each output activation is responsible for detecting a single digit, if the corresponding receptive field of a single activation spans multiple digits, the model will only be able to detect a single digit. In our experience, we found one credit card design (Brex credit cards) that the model struggles to perform OCR on. One way to fix this corner case is to make the input feature map size bigger or add auxiliary layers earlier in the network where the feature map sizes are bigger. However, this adds more computation to the machine learning inference effectively decreasing the frame rates on resource-constrained devices.
To successfully perform OCR on payment cards with tiny fonts, we first detect the ratio of the size of an individual digit compared to the size of the input feature map. If it is below our empirically determined threshold, we pass a zoomed in image of the input through the machine learning pipeline effectively mapping a card with small font to one with a relatively bigger font that the model supports natively. This flow adds latency to our overall inference pipeline; however, Daredevil only needs to trigger it sparingly.
We use 1 million real and synthetic card images to train our OCR model. However, we find that, on our internal benchmark datasets, this model is unable to reproduce Boxer OCR’s precision and recall, owing to the overall reduced number of parameters. To account for this reduction, we generate an additional 1.5 million synthetic credit card images. Ultimately, we train the OCR model with 2.5 million real and synthetic card images to match Boxer OCR’s baseline on our benchmark datasets.
V-F2 Improvements in system design
To further increase the frame rate, we refine our system design to use a producer/consumer pipeline with a bounded buffer. We collect multiple frames from the camera and run machine learning inference on all of them in parallel. Since running machine learning inference takes time, this design ensures that fetching frames from the camera is not blocked, making the entire system parallel from reading camera frames to completing machine learning inference.
We find that buffering images and running the same inference in parallel leads to speedups of up to 117% for our workload (see Appendix -B for our results). Processing more frames is critical for improving the end-to-end success rate for complex machine learning problems that demand high accuracy as concluded in our measurement study (see Section III).
VI Evaluation
In our evaluation, we answer the following questions:
-
•
Does Daredevil bridge the gap between low- and high-end devices?
-
•
Does Daredevil prevent fraud in the wild while remaining ethical?
-
•
What is Daredevil’s false positive rate when scanning real cards and running anti-fraud models?
-
•
Does our use of redundancy improve overall accuracy?
-
•
What is the impact of back-end networks and data augmentation on overall success rates?
VI-A Does Daredevil bridge the gap between low- and high-end devices?
In this section, we measure Daredevil’s performance for its most complex and carefully designed machine learning model: OCR. Although OCR is a critical part of our fraud system (see Section VI-B for real-world results of using Daredevil to stop fraud), in this experiment we use OCR to help people add credit and debit cards to an app more effectively by scanning instead of typing in numbers.
VI-A1 Measurement Platform
To measure Daredevil’s performance, we perform a correlation study by making it available to third-party app developers and measuring the success rate for the users of their live production apps. For Daredevil Android SDK, we present results from anonymous statistics sent by 70 apps that deploy our library from December 2019 to late November 2020. For Daredevil iOS SDK, we present results from anonymous statistics sent by 44 apps that deploy our library from late July 2020 to late November 2020.
VI-A2 Testbed
Daredevil Android SDK ran on a total of 477,594 Android devices spanning a total of 722 Android device types. This included 328,600 Samsung devices spanning 302 Samsung device types, 42,619 Huawei devices spanning 111 Huawei device types, 6,876 Xiaomi devices spanning 38 Xiaomi device types, 22,952 LG devices spanning 78 LG device types, 31,699 Google devices spanning 17 Google device types, 18,407 Motorola devices spanning 58 Motorola device types, 8,751 OnePlus devices spanning 29 OnePlus device types and tail of 17,690 devices, spanning 89 device types and 28 vendors. Daredevil iOS SDK ran on a total of 1,102,666 iOS devices spanning a total of 28 iOS device types.
VI-A3 Task
As before, Daredevil prompts users to scan their credit cards. The task, UI and the control flow is identical to the measurement study (Section III-D)
Daredevil consists of a single-stage OCR where both detection and recognition happen in a single pass. The input image from the camera is processed and sent to the OCR model which outputs a string of digits.
| Model | Size | # | # 2D | # Depth-wise |
|---|---|---|---|---|
| params. | Conv(s) | Conv(s) | ||
| Daredevil | 1.65MB | 861,242 | 39 | 25 |
| Boxer | 2.94MB | 1,528,919 | 30 | 18 |
Daredevil uses a fully convolutional MobileNetV2 [45] with auxiliary features for detection and recognition for OCR and occupies 1.65MB on disk. The OCR model processes an input image of size 600x375 and generates 51,300 output values which are used to detect and localize the information for extraction. It has a total of 861,242 parameters of which 830,362 are trainable. Daredevil uses 44% fewer parameters than Boxer. Figure 8 shows a comparison of the model parameters between Boxer and Daredevil.
We use the same inference engines (CoreML for iOS and TFLite CPU for Android) for Daredevil as Boxer, detailed in our measurement study Section III. Like Boxer, we quantize all our models using 16-bit floating point weights.
VI-A4 Results- Key Performance Metrics
As before, we use the same definitions for frame rate and success rate for our performance metrics as in Section III.
We show the impact that the new Daredevil OCR model (Section V-F1) has on the overall scanning success rate. Our informal goal with Daredevil was to improve the success rates on Android to match Boxer iOS. Daredevil uses algorithmic machine learning improvements, empirical accuracy-preserving optimizations, high fidelity synthetic data, and an improved system design to achieve this goal.
| Version | Count | Avg Suc | Avg | Avg |
|---|---|---|---|---|
| Rate | FPS | Dur (s) | ||
| Daredevil iOS | 1,102,666 | 89.13% | 20.00 | 9.37 |
| Boxer iOS | 3,175,912 | 88.60% | 10.00 | 10.02 |
| Daredevil Android | 477,594 | 88.46% | 4.07 | 10.55 |
| Boxer Android | 329,272 | 46.72% | 1.30 | 15.45 |
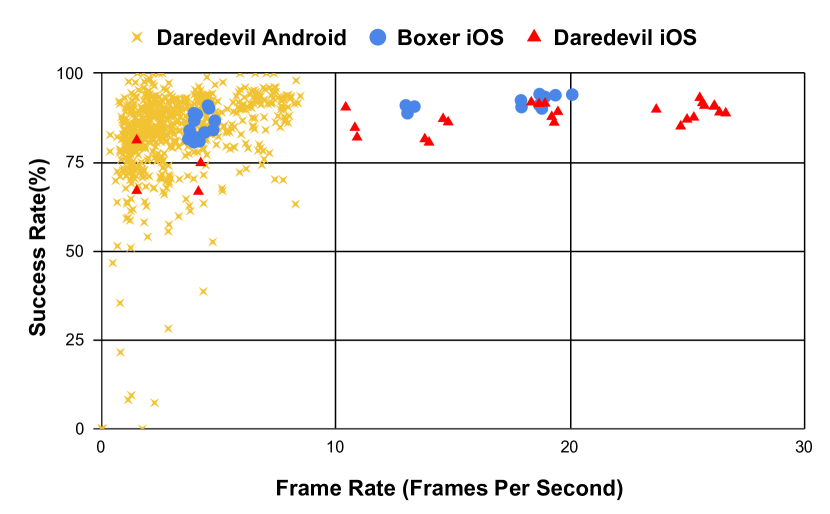
Figure 9 shows the results of Daredevil deployed on Android (which we refer to as Daredevil Android) and iOS (which we refer to as Daredevil iOS) against Boxer iOS. This figure shows that Daredevil’s improvements increase the success rate on Android to closely match success rates on Boxer iOS, despite the massive hardware advantages present on iOS. Seeing the success of Daredevil Android, we ported it to iOS and observed a more than 2x speedup in frame rates and a moderate improvement in the success rates as well (Figure 10). The increase in frame rates also lead to Daredevil being able to support iPhone 6 and below, which Boxer does not support.
Concretely, from Figure 10 which presents more detailed results, we see that the average frame rate improves from 1.30 FPS on devices running Boxer Android to 4.07 FPS on devices running Daredevil Android. Daredevil Android also increases the average success rate from 46.72% to 88.46%. We also see an improvement in success rates on iOS, going from 88.60% on Boxer iOS to 89.13% on Daredevil iOS. Additionally, the average scan duration decreases from 15.45s to 10.55s on Android and from 10.02s to 9.37s on iOS. In our system we start the scan duration timer when the user clicks on the “scan card” button and finish it after the scan is complete, which includes accepting camera permissions, pulling their card out of their wallet, scanning the card, and the 1.5s voting phase for error correction in the main loop.
| Daredevil | Boxer | |||
|---|---|---|---|---|
| Android FPS | Count | Success rate | Count | Success rate |
| 1 FPS | 23,314 (4.88%) | 37.92% | 146,890 (44.61%) | 31.87% |
| 12 FPS | 48,271 (10.10%) | 84.08% | 97,798 (29.70%) | 49.97% |
| 2 FPS | 406,009 (85.01%) | 91.88% | 84,584 (25.68%) | 68.72% |
Daredevil also improves the usability of card scanning with 4.88% (Figure 11) of Android phones being able to process fewer than 1 FPS, compared to 44.61% with Boxer Android. Similar to Boxer, the success rate for Android devices with less than 1 FPS (37.92%) is lower than the average success rate for Android overall (88.46%), however the overall increase in devices that can run the Daredevil ML at 1 FPS or higher leads to a higher overall success rate (Figure 10 and Figure 11).
We see from Figure 11 that for both Boxer and Daredevil, as the frame rate increases the overall success rate increases as well. Beyond 1 FPS, the success rate for Daredevil witnesses a precipitous rise compared to Boxer, this can be attributed to Daredevil being trained with orders of magnitude more data (Section VI-E), the use of an efficient machine learning pipeline (Section V-D) and marginal improvements seen from the updated back-end network (Section VI-E). It is clear that Boxer can also benefit from these improvements, however, given that 44.61% of the Android devices operate at below 1 FPS for Boxer (and Daredevil also struggles with devices that operate at frame rates below 1 FPS), a significant portion of the devices will be excluded from these improvements. Daredevil’s architecture reduces the number of devices that operate at below 1 FPS to 4.88% which results in significantly higher overall success rates.
VI-B Does Daredevil’s fraud check work in the wild, while remaining ethical?
To evaluate Daredevil’s ability to stop fraud in real-time, we report results from a large international app deploying our SDK. For a test period of 3 months, the app flagged 12,474 transactions as suspicious and challenged them with Daredevil to verify their payment method.
Daredevil passed 7,612 transactions and blocked the remaining 4,862 transactions. Of the 7,612 transactions passed by Daredevil, only 12 resulted in chargebacks, leading to a false negative rate of 0.16%. We are unable to report the false positive rate since the app did not share the false positive data with us, please see Section VI-C for a evaluation of the Daredevil’s false positive rate. Based on this initial test, the app has decided to deploy Daredevil.
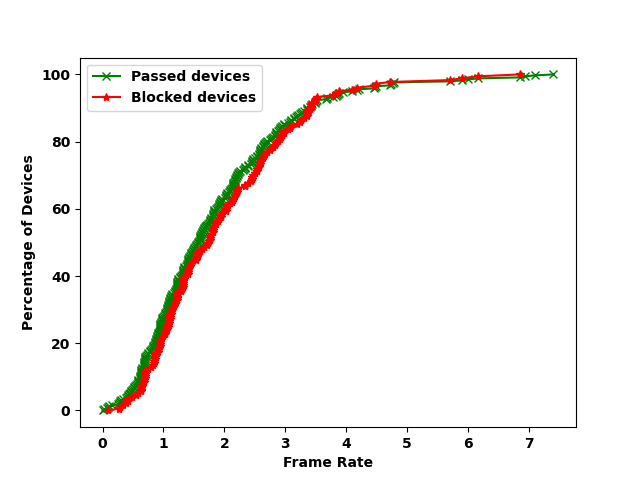
To determine if Daredevil’s fraud decisions are correlated with the device frame rates we further analyze the performance characteristics of the passed and blocked devices. We find that the average frame rate of devices that Daredevil passed was 1.84 FPS and the average frame rate of the devices that Daredevil blocked was 1.94 FPS, indicating that the frame rates for the two groups is roughly the same. To visualize these results, we plot the CDF of percentage of devices vs frame rate (FPS) for the two groups and present the results in Figure 12. We see that the plots look very similar indicating that frame rate is not a discriminating factor between the blocked and passed groups.
For companies, chargebacks are the ground truth because they represent exactly what they are liable for financially. However, it is possible that there was fraud that happened but the victim failed to report the fraudulent charge to their issuing bank, thus the actual amount of fraud may be higher than the chargeback count that we report in this experiment.
VI-C What is Daredevil’s false positive rate when scanning real cards and running anti-fraud models?
To evaluate Daredevil’s false positive rate, we report results from four authors scanning 105 cards in a lab setting using the latest production anti-fraud models as of December 2020. In this experiment, we invoke the fraud flow and record the number of scans that the system incorrectly flags as being fraudulent. This section complements our real-world evaluation of Daredevil’s fraud systems in VI-B that shows our false negative rate.
We scan 105 different real cards multiple times on different resource-constrained and well-provisioned Android and iOS devices for a total of 310 scans. The devices we use are iPhone SE (1st gen), Google Pixel 2, Nexus 6, iPhone 6s, and iPhone 11. Of these 310 scans, Daredevil incorrectly flags seven scans as fraudulent, giving a false positive rate of 2.2%. The false positives are uniformly spread across all devices, indicating that Daredevil does not unfairly permit well-provisioned or resource-constrained devices, similar to our fraud decisions as discussed in Figure 12.
Six out of the seven reported false positives were transient in nature, i.e. further scans of the same card (which we would expect from a good user) did not result in false positives. The other card was consistently flagged incorrectly by our fake media detection model.
VI-D Does our use of redundancy improve overall accuracy?
In this section, we evaluate the effectiveness of our redundancy based decomposition strategy (described in Section V-D) in aiding fraud detection. Specifically, we evaluate the gains in accuracy on executing our card tampering detection and fake media detection models in the completion loop.
We run a user study with and without the card detection model in the main loop to show how it benefits the card tampering detection and fake media detection models running in the completion loop. The user-facing feedback from the card detection model ensures that users center their credit cards so that both models necessarily make their predictions on valid credit card images.
Users participating in our study randomly run one of two versions of our app and scan 30 different predetermined credit card images on a browser that we provide via a link. We use their scans to evaluate the impact of the feedback from card detection in terms of the number of mistakes made by card tampering detection (i.e. objects present on the card that the model fails to detect as well as objects not present on the card that the model incorrectly detects) and the accuracy of fake media detection in detecting both, the presence and absence of screens.
Our university’s IRB board reviewed our user study and ruled it to be exempt from IRB.
| Card tampering | Fake media | |
|---|---|---|
| detect. # errors | detect. acc. | |
| No Card Detection | 1.94 errors per frame | 86.24% |
| With Card Detection | 1.26 errors per frame | 95.26% |
Figure 13 summarizes our results. Our design of decomposition centered on the card detection model ensures that we pass high-quality frames to the machine learning models, resulting in fewer errors for the card tampering detection model, decreasing the errors per frame from 1.94 errors per frame down to 1.26 errors per frame. This change also improves accuracy for our fake media detection model increasing the accuracy from 86.24% to 95.26%. Overall, these improvement lead to more accurate fraud detection. For more details on our user study, please see Appendix -D.
VI-E What is the impact of back-end networks and data augmentation on overall success rates?
| Back | Size | No. of | Recall | Precision | FPS on |
|---|---|---|---|---|---|
| End | Params. | Pixel 3a | |||
| MBv1 | 1.8MB | 869,754 | 54.06% | 100% | 7.19 |
| MBv2 | 1.65MB | 861,242 | 56.25% | 100% | 7.09 |
To quantify the impact of back-end networks, we validate our models on image frames extracted from videos recorded by users scanning their credit cards. Crucially, this is the same benchmark we use to evaluate models that are shipped in production. The test set consists of 640 image frames extracted from 32 videos. We train Daredevil OCR with MobileNet V1 and MobileNet V2 back-ends and report the results in Figure 14. We define a correct prediction as one where the model can correctly extract the card number from the image frame, while an incorrect prediction is one where the model extracts an incorrect card number (valid but incorrect), finally all frames where the model is able to extract only a partial number are considered missed predictions. Accordingly, recall is the fraction of the frames where the model produced a correct prediction and precision is the fraction of the all the predictions that were correct.
| No. of images | Recall | Precision |
|---|---|---|
| 495,134 | 20% | 98.46% |
| 939,165 | 27.96% | 98.89% |
| 1,374,707 | 42.08% | 99.26% |
| 2,006,452 | 49.06% | 100% |
| 2,500,612 | 56.25% | 100% |
Critically, from Figure 14 we see that using MobileNet V2 instead of MobileNet V1 as the back-end network results in less than 1% reduction in the number of parameters, indicating that the reduction in the overall parameters is a direct result of Daredevil’s architecture independent of the back-end network. We also see Daredevil with MobileNet V1 closely matches Daredevil with MobileNet V2 in recall and precision (Figure 14) further highlighting the back-end agnostic nature of Daredevil.
To quantify the impact of data augmentation on the improvement of overall success rates. We train Daredevil OCR (Mobile Net V2 back-end) by varying the amount of training data. Our training data is generated using a custom Generative Adversarial Network (GAN) [13] architecture and we also use standard data augmentation techniques in addition to the GAN. We evaluate the models using the same benchmark as before and report the results in Figure 15.
In summary, we conclude that with Daredevil’s architecture we are able to achieve the desired frame rate and with high-fidelity synthetic data we are able to achieve the desired accuracy.
VII Related work
Our work is related to papers in the areas of financial fraud, challenge based authentication, computer vision, machine learning systems and machine learning for mobile.
Recent work has focused on devising challenges that rely on having users interact with their mobile phones to collect signals that are then processed for verification [32, 51]. Liu et al. propose CardioCam [32] to verify users based on their cardiac biometrics. Researchers have also devised authentication systems where users are challenged to respond to a Captcha challenge on their mobile phones, while collecting audio and visual data of the response that is transmitted to a secure server for processing [51].
The execution of machine learning models on resource constrained platforms such as mobile phones has seen active research in both algorithmic machine learning improvements [21, 53] as well as enhanced system design [54, 17, 33]. Liu et al. devise a selection framework, AdaDeep, that automatically selects a combination of compression techniques to be applied to a given neural network to balance between performance and availability of resources [33]. Closer to our work, researchers at Facebook extensively profile the wide diversity in compute capabilities on mobile phones for machine learning [54]. They also identify the benefits of optimizing to run inference on CPUs over GPUs to provide stable execution on Android devices, and Daredevil follows this general plan where we run Android models on the CPU but use the hardware acceleration available on iOS to speed up our models. Ran et al. [41] create a client-server hybrid framework to provide sufficient compute power for running augmented reality apps. Authors in [38], [55] conduct a measurement study of mobile performance analysis of various deep learning models and conclude the need for extensive optimization and both on-device and cloud based inference.
Recently there has been work on improving the performance of parallel DNN training [36, 22]. Narayanan et el. [36] cast DNN training as a computational pipeline to efficiently utilize the hardware resources. In contrast, Huang et al. [22], while also using pipelining to train large models, significantly reduce the memory overhead by re-materialization.
Apps such as Google Pay and Apple Pay are restrictive in the users they allow to use their systems. Firstly, they are not available in all regions around the world [15], [3]. More importantly, these services are restrictive in their support to pre-paid cards [14]. Over 8 million households in the United States rely on pre-paid cards, most of whom are blocked from using these services [5].
Payment card fraud using card skimmers has been studied recently by Scaife et al. [47]. In this work, researchers built a card skimmer detector that can be used at physical payment terminals such as ATMs and gas stations. In another work, Scaife et al. [46] did a survey of gas pump card skimmer detection techniques including Bluetooth skimmer detection on iOS and Android apps, to identify common skimmer detection characteristics.
VIII Conclusions
Deep learning has seen a widespread adoption in a multitude of domains, outperforming traditional machine learning and rule-based algorithms. We have also seen it make in-roads into security with its potential to empower data engineers with newer features that can limit the prejudices of prior algorithms. However, if not careful, deep-learning-based security challenges have the potential of reproducing historical prejudices, improving the security and user experience of one group at the expense of altogether blocking the other.
In this paper, with a wide-scale measurement study consisting of 3,505,184 devices that ran in real apps. Our study looked at a widely deployed deep-learning-based system for scanning payment cards where we demonstrated that while these challenges can solve the app’s business problem by functioning reliably on high-end phones, this challenge has the potential to disproportionately block users from low socio-economic tiers who rely on lower tier smartphones.
With the lessons learned from our measurement study, we designed Daredevil, a payment card verification system that used deep learning optimizations and improved system design to build a complex security system that works uniformly on low-end and high-end mobile devices. We showed the results from 1,580,260 devices from Daredevil’s public deployment to demonstrate the practical nature of our system across all devices.
Acknowledgments
We would like to thank Xiaojing Liao and the anonymous reviewers who provided valuable feedback on this work. We would also like to the thank Weisu Yin, Sven Kuhne and Allison Tearjen for their contributions to this work. This research was funded by a grant from Bouncer Technologies.
-A How does Daredevil compare against other card scanners?
Card.io [39] is a popular open-source scanning library commonly used in the industry. We compare Daredevil against Card.io via a lab experiment to measure their scan success rates on our benchmark test set of 100 credit cards. We observe that Daredevil is able to extract the correct card number from each card, while Card.io is able to extract the correct card number from only 58 cards. Accordingly, Daredevil’s precision and recall are both at 100%, while Card.io’s precision and recall are 100% and 58% respectively. The lower recall of Card.io is attributed to its inability to scan cards with flat fonts.
-B Impact of the producer / consumer design on frame rates.
| Device | Blocking | + Buffer | + Parallel |
|---|---|---|---|
| iPhone 5s | 1.65 fps | 1.70 fps | 2.95 fps |
| iPhone SE | 7.60 fps | 7.90 fps | 14.90 fps |
| iPhone XR | 28.45 fps | 32.60 fps | 32.60 fps |
| LG K20 Plus | 1.03 fps | 1.04 fps | 1.39 fps |
| Xiaomi Redmi 7 | 3.16 fps | 3.47 fps | 4.89 fps |
| Pixel 2 | 3.66 fps | 4.35 fps | 7.95 fps |
Daredevil processes frames obtained from a live camera feed. In most cases, the camera runs at a higher frame rate than the machine learning model, meaning that applications will have to drop some number of frames while the user is scanning their card. A natural and common solution to this problem is to block the live feed while the prediction runs, waiting for the machine learning models to finish processing the frame before grabbing the next available frame from the camera. This solution leads to a lower effective frame rate because of the waiting time but is memory efficient and ensures that the models always have fresh data to process by virtue of using only the latest frame from the camera.
As opposed to processing each camera frame serially and blocking the live feed while the model runs, Daredevil uses a producer (the camera) / consumer (machine learning models) architecture with a bounded LIFO buffer to store the most recent frames, and run multiple predictions in parallel. This architecture comes at the increased cost of memory but enables the machine learning models to execute without any waiting and ensures that the models process frames that are close to what the user sees.
We have already seen the producer/consumer design leading to higher frame rates and success rates in production (Section VI-A). In this section, we run a controlled lab experiment to compare the frame rates between the blocking design and producer/consumer design of running our main loop (the card detection and OCR models) on frames produced from a fixed camera feed. We follow this up with a qualitative analysis of why the blocking design is slower on both Android and iOS, despite the considerable differences in how the two platforms execute machine learning inference.
Specifically, we consider three different variations: (1) a blocking style with a single instance of our main loop models driven at the frame rate of the camera, (2) a non-blocking style using a buffer to store the two most recent frames with a single thread running our main loop models, and (3) a non-blocking style using a buffer to store the two most recent frames with two threads on iOS and four threads on Android running our main loop models. We run this experiment by measuring the frame rates observed on running the three variations on different iOS and Android devices of varying capabilities for 20 seconds each.
Figure 16 summarizes our results from these experiments. From these results we can see a clear increase in the frame rates across all phones on both iOS and Android on moving from a blocking system to a system that buffers frames to a system that buffers frames and runs our main loop models in parallel.
Improvements in frame rates due to buffering alone range from 1% to 19%, with faster devices seeing larger gains. The reason that faster devices see larger gains is because the time spent waiting for a camera frame is a larger portion of the overall execution time as the time spent on machine learning predictions goes down.
Surprisingly, we observe speed ups ranging from 15% to 117% due to adding multiple instances of our main loop models that run predictions in parallel. This speed up is surprising because machine learning inference is embarrassingly parallel and the underlying hardware architectures for iOS and Android are vastly different, so we did not expect to see gains in performance on both platforms from the same architectural improvements.
On iOS as opposed to Android, our machine learning models run on the GPU, however, the CPU needs to encode the work on a command buffer before GPU can execute it. Blocking the live feed while the prediction is running can lead to idle time, since the GPU has to wait for the CPU to encode the task.
Our producer/consumer style OCR addresses the GPU idling issue by creating parallel workloads which ensures that the CPU will encode the next workload while the GPU is executing the current workload. The producer pushes the frames from the camera feed onto a buffer keeping the most recent frames and removing old stale frames. The consumer which consists of independent machine learning analyzers pull images from the buffer and run predictions on the frames in parallel. Internally, Core ML (Apple’s machine learning framework) serializes the requests, however, with this style, encoding and execution happens in parallel.
On Android, since we run our machine learning models on the CPU, bubbles arising as a result of the communication between the CPU and GPU are not applicable to Android. Our producer/consumer OCR as well as a sequential blocking OCR, both run multi-threaded machine learning inference (using the industry standard TensorFlow Lite). The two differ in terms of the number of TensorFlow Lite interpreters running inference, with the former using multiple independent interpreters and the latter using a single interpreter. In this section, we seek to understand why we observe higher frame rates with the producer/consumer OCR. More concretely, we seek to understand the differences in how much parallelism is available and how the hardware is utilized in both cases to explain the improvements.
TensorFlow Lite runs machine learning inference by traversing a computational graph where the nodes represent computations that are part of the model and edges represent the dependence of values between different computations [1]. We inspect the TensorFlow Lite source code to find that while running multi-threaded inference through a single interpreter, it is only the individual computations corresponding to the nodes of the computational graph that execute on multiple threads, while the invocation of these nodes happens sequentially on a single thread. Thus, with a single interpreter not more than one node of the computational graph can run at a given time.
As a result, increasing the number of threads for a single interpreter does not lead to faster inference if some threads execute slower than others. While most Android phones in use today either have 4 or 8 CPU cores, we uniformly see the optimal performance when using 4 threads for inference. We attribute this to the adoption of Arm’s big.LITTLE architecture [49] on phones with 8 cores, where 4 cores are designed for efficiency rather than performance, and are thus slower than the other 4 cores designed for performance, while all cores are uniform in quad core Android devices.
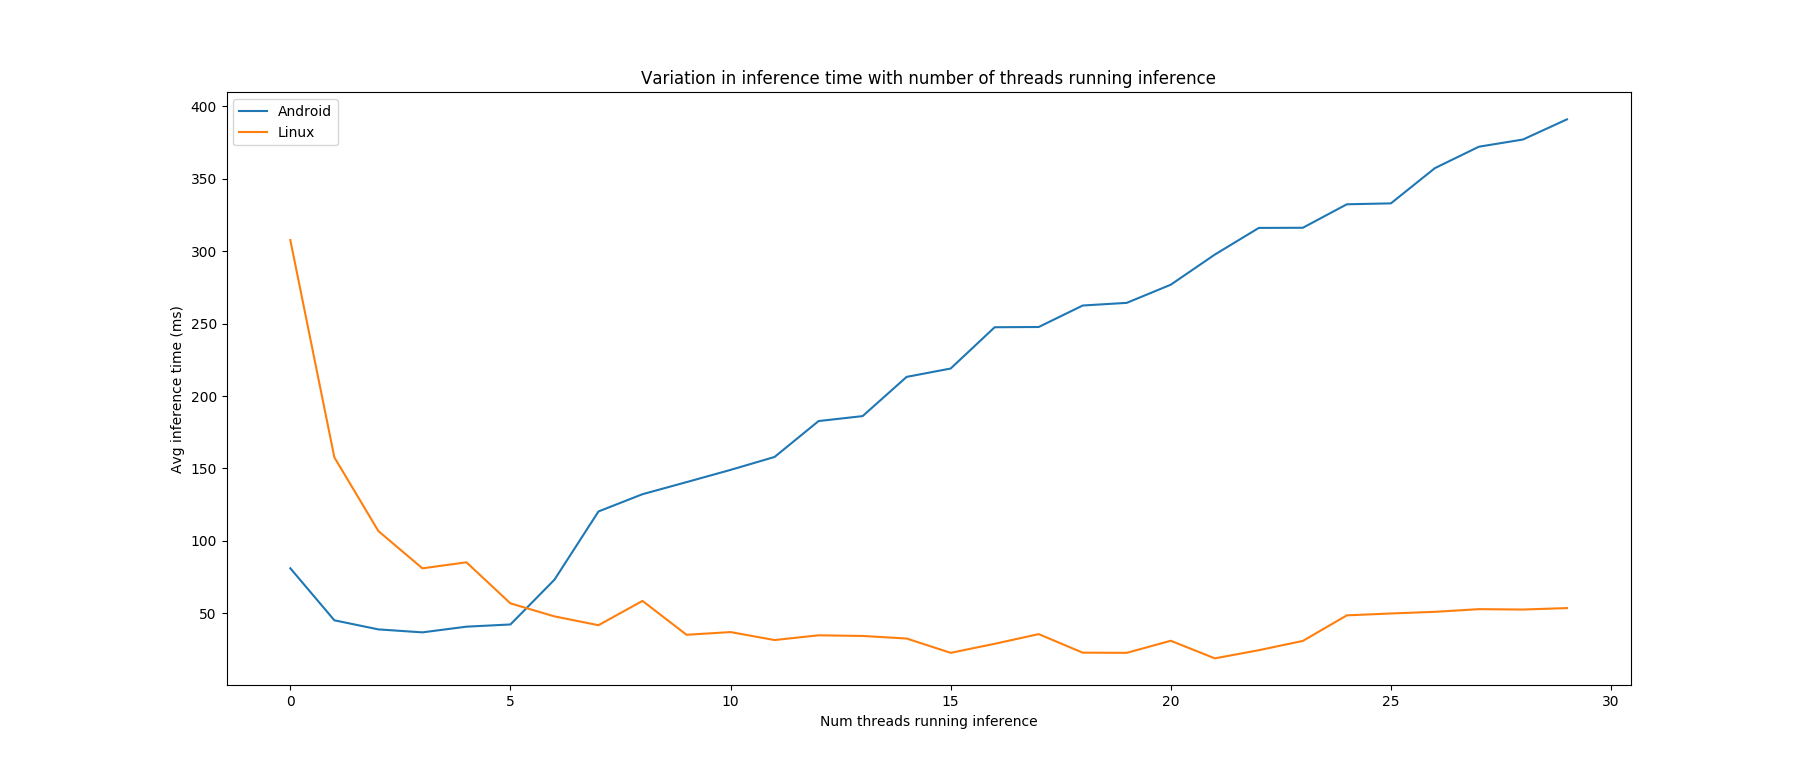
We verify the slowing down of inference on heterogeneous cores by plotting the variation in inference time against the number of threads used on an Android device having 8 cores following ARM’s big.LITTLE architecture and a Linux server having 24 equivalent cores running x86. The inference times start going up beyond 4 inference threads on the Android device, while it starts to go up only after 24 threads on the Linux server. These plots are shown in Figure 17.
Our producer/consumer OCR is not affected by the heterogeneity of CPU cores since it invokes multiple interpreters in parallel. Multiple nodes belonging to separate graphs coming from distinct interpreters can execute at the same time, showing a better utilization of the available hardware and correspondingly faster scan times with the producer/consumer OCR.
| Platform | Count | Avg | Avg |
|---|---|---|---|
| FPS | Duration (s) | ||
| Daredevil Android | 55,093 | 3.04 | 22.58 |
| Daredevil iOS | 119,826 | 18.77 | 17.38 |
-C Analysis of Daredevil’s failure cases
From our real-world deployment of Daredevil, we observed 174,919 failed attempts where users gave up on trying to scan their card. We aggregate the duration of these scans on iOS and Android to report that Android users waited an average of 22.58s and iOS users waited an average of 17.38s to scan their cards before giving up. This is shown in Figure 18.
-D User study to evaluate the use of redundancy based decomposition
We ask users participating in our study to visit a link where they can scan 30 different credit card images via our app running on their phone. On opening the link, we display 30 credit card images in a random sequence from a predetermined set of cards. We manually label the objects present on these cards, such as bank logo etc., for each frame collected from our user study videos which serve as ground truth labels for card tampering detection. Although users participating in the study scan cards that are displayed on device screens, we manually label each frame from each video for the presence of screens to cover cases where the user starts executing the app on the phone before pointing it at the screen. These labels are our ground truth labels for fake media detection. The users randomly run one of two versions of the app: with and without the card detection model. We carry out our user study virtually due to the restrictions imposed by the COVID-19 pandemic.
We obtain a total of 603 scan videos from the user study, of which 273 were collected by providing explicit feedback to the user to center their card by running the card detection model and the remaining 330 were collected without any such feedback. For the scans collected without feedback, we pass all extracted frames through the card tampering detection and fake media detection models. For the scans with feedback, we first pass the frames through the card detection model to only select those with centered cards to pass to the card tampering detection and fake media detection models. We then compare the performance of the two models in both cases.
From scans without feedback from card detection, we randomly sample 50 scans and pass all 4,213 frames extracted from them to the card tampering detection model. We consider expected objects not detected by the model as well as objects incorrectly predicted by the model that are not present in the card as errors. The model makes a total of 8,163 errors at an average of 1.94 errors per frame. We also sample 50 random scans from those with feedback and pass 1,973 centered frames extracted from them to the card tampering detection model. In this case, it makes a total of 1.26 errors per frame.
The fake media detection model makes correct predictions on 21,413 out of 24,829 frames extracted from all 330 scans without feedback at an accuracy of 86.24%. Of the 9,512 centered frames extracted from all 273 scans with feedback, the fake media detection model makes correct predictions on 9,061 frames at an accuracy of 95.26%.
-E Will increasing the frame rate further continue to increase the success rate?
This section serves to answer the question of whether increasing our current frame rates would lead to further improvements in success rate without changing the machine learning model. Since card scanning involves sending frames from a live camera feed through a machine learning model, faster frame rates could imply two consecutive frames being practically identical to the eyes of a machine learning model, leading to no gains obtained from a higher frame rate. Alternatively, it could be that there are sufficient differences between two consecutive frames for the machine learning model to produce a different and possibly better prediction, resulting in a shorter scanning duration.
Concretely, consider an example where an OCR model is able to process frames from the user’s video feed at a rate of 5 FPS, and the user scans for 10 seconds. This means that we run OCR inference on 50 frames in total. We refer to the number of frames on which the model makes correct predictions as the number of useful frames. If this model makes correct predictions on 10 frames, then we have 10 useful frames from the total set of 50 frames. Now suppose, the same OCR model processes the same 10 second feed at 10 FPS instead of 5, i.e., this model processes a total of 100 frames. If this setting results in more useful frames, then running at a higher frame rate would lead to shorter scanning times on average.
To study this, we analyze videos of users scanning cards from our user study described in Section VI-D. We simulate different frame rates by extracting frames at differently spaced intervals from the recorded videos. Closer intervals represent faster frame rates and possibly identical frames, and vice versa for wider intervals. We then pass these frames through two different OCR models (Boxer OCR and Daredevil OCR) and for each frame rate we compute the percentage of useful frames obtained to the total number of frames processed.
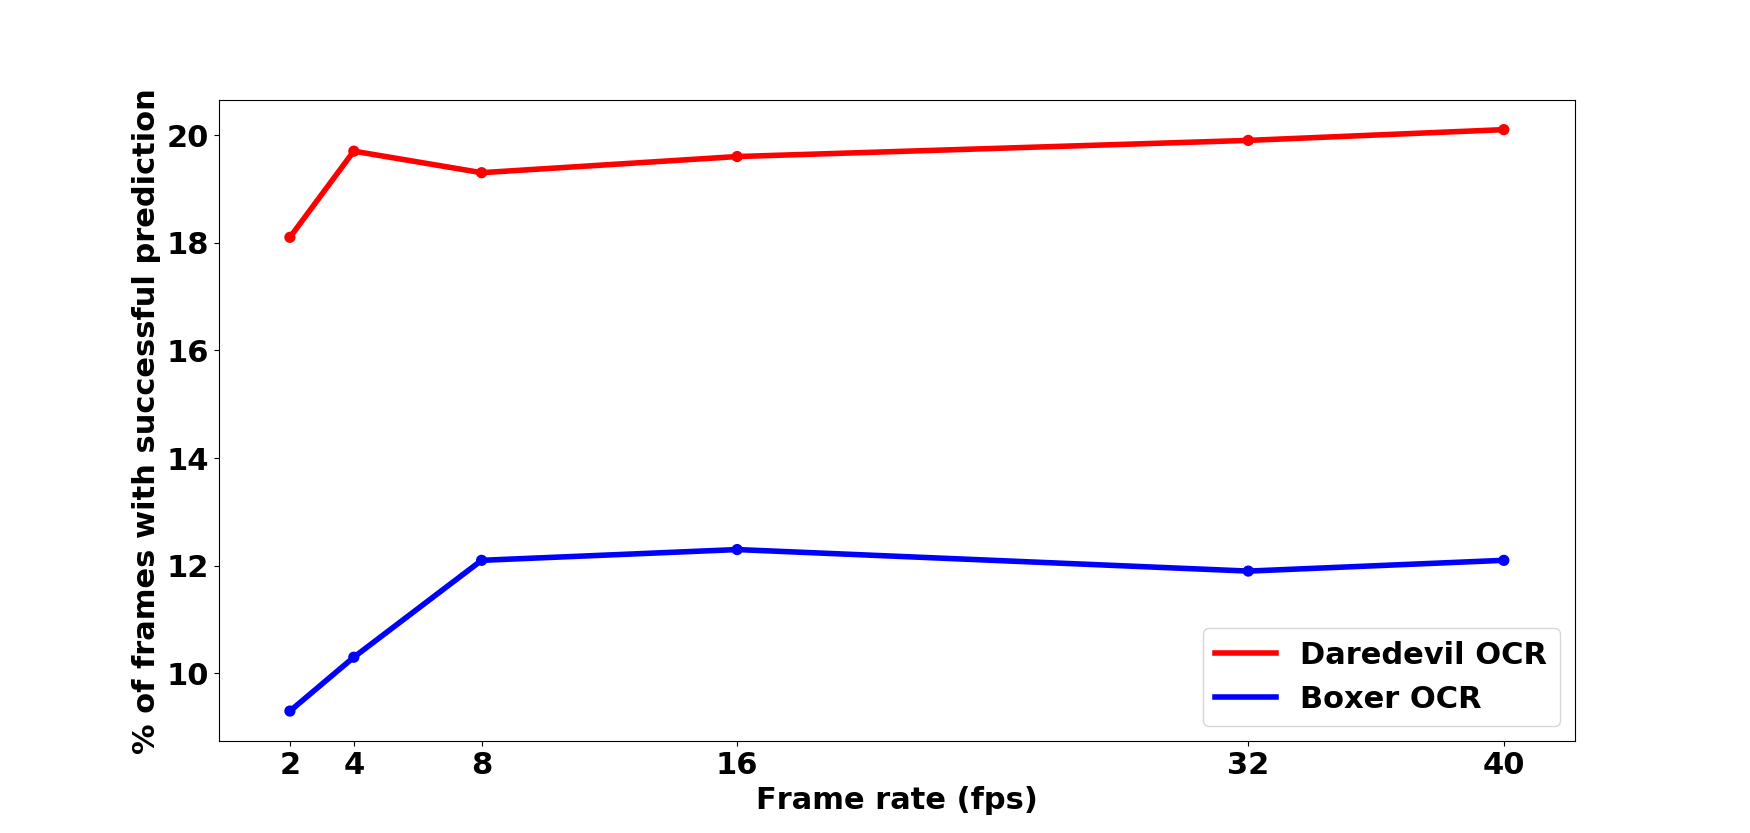
Figure 19 plots the variation of frame rates to percentage of frames with successful predictions averaged over 27 different scanning videos sampled from our user study. The plots are roughly constant for both Boxer OCR and Daredevil OCR. This indicates that with increasing frame rates and correspondingly increasing the number of frames processed by the models, the number of useful frames (i.e., the number of frames on which we are successfully able to run OCR) also increases. These results suggest that even closely spaced frames contain sufficient diversity leading to different, and possibly correct predictions with the same machine learning model. Thus, further systems enhancements that lead to higher frame rates with the same OCR model contribute to faster scan times and better user experience.
References
- [1] Martín Abadi, Paul Barham, Jianmin Chen, Zhifeng Chen, Andy Davis, Jeffrey Dean, Matthieu Devin, Sanjay Ghemawat, Geoffrey Irving, Michael Isard, Manjunath Kudlur, Josh Levenberg, Rajat Monga, Sherry Moore, Derek G. Murray, Benoit Steiner, Paul Tucker, Vijay Vasudevan, Pete Warden, Martin Wicke, Yuan Yu, and Xiaoqiang Zheng. Tensorflow: A system for large-scale machine learning. In Proceedings of the 12th USENIX Conference on Operating Systems Design and Implementation, OSDI’16, page 265–283, USA, 2016. USENIX Association.
- [2] Apple, Inc. CoreML. https://developer.apple.com/machine-learning/core-ml/.
- [3] Apple, Inc. Countries and regions that support Apple Pay. https://support.apple.com/en-us/HT207957.
- [4] Alex Beutel, Jilin Chen, Tulsee Doshi, Hai Qian, Allison Woodruff, Christine Luu, Pierre Kreitmann, Jonathan Bischof, and Ed H. Chi. Putting fairness principles into practice: Challenges, metrics, and improvements. In Proceedings of the 2019 AAAI/ACM Conference on AI, Ethics, and Society, AIES ’19, page 453–459, New York, NY, USA, 2019. Association for Computing Machinery.
- [5] Need Help Paying Bills. Prepaid Cards for the Unbanked and Underbanked. https://www.needhelppayingbills.com/html/prepaid_cards_help_unbanked_and_underbanked.html.
- [6] Airbnb Data Science Blog. Fighting financial fraud with targeted friction, February 2018. https://medium.com/airbnb-engineering/fighting-financial-fraud-with-targeted-friction-82d950d8900e.
- [7] Uber Engineering Blog. Advanced technologies for detecting and preventing fraud at uber, June 2018. https://eng.uber.com/advanced-technologies-detecting-preventing-fraud-uber/.
- [8] Michal Busta, Lukas Neumann, and Jiri Matas. Deep textspotter: An end-to-end trainable scene text localization and recognition framework. In The IEEE International Conference on Computer Vision (ICCV), Oct 2017.
- [9] Zainul Abi Din, Hari Venugopalan, Jaime Park, Andy Li, Weisu Yin, Haohui Mai, Yong Jae Lee, Steven Liu, and Samuel T. King. Boxer: Preventing fraud by scanning credit cards. In USENIX Security Symposium (USENIX Security 2020). USENIX, 2020.
- [10] Sanghamitra Dutta, Dennis Wei, Hazar Yueksel, Pin-Yu Chen, Sijia Liu, and Kush R. Varshney. An information-theoretic perspective on the relationship between fairness and accuracy, 2019.
- [11] Kate Fazzini. How criminals use uber and airbnb to launder money stolen from your credit card, 2019. https://www.cnbc.com/2019/02/07/how-criminals-use-airbnb-uber-launder-stolen-credit-card-money.html.
- [12] R. Girshick, J. Donahue, T. Darrell, and J. Malik. Rich feature hierarchies for accurate object detection and semantic segmentation. In 2014 IEEE Conference on Computer Vision and Pattern Recognition, pages 580–587, 2014.
- [13] Ian J. Goodfellow, Jean Pouget-Abadie, Mehdi Mirza, Bing Xu, David Warde-Farley, Sherjil Ozair, Aaron Courville, and Yoshua Bengio. Generative adversarial networks, 2014.
- [14] Google. Add a payment method. https://support.google.com/pay/answer/7625139.
- [15] Google. Countries where you can use Google Pay. https://support.google.com/pay/answer/9023773.
- [16] Google. Edge TPU. https://cloud.google.com/edge-tpu.
- [17] Seungyeop Han, Haichen Shen, Matthai Philipose, Sharad Agarwal, Alec Wolman, and Arvind Krishnamurthy. Mcdnn: An approximation-based execution framework for deep stream processing under resource constraints. In Proceedings of the 14th Annual International Conference on Mobile Systems, Applications, and Services, MobiSys ’16, page 123–136, New York, NY, USA, 2016. Association for Computing Machinery.
- [18] Hans Peter Luhn. Computer for verifying numbers, August 1960. https://patents.google.com/patent/US2950048.
- [19] Moritz Hardt, Eric Price, and Nathan Srebro. Equality of opportunity in supervised learning. In Proceedings of the 30th International Conference on Neural Information Processing Systems, NIPS’16, page 3323–3331, Red Hook, NY, USA, 2016. Curran Associates Inc.
- [20] Andrew Howard, Mark Sandler, Grace Chu, Liang-Chieh Chen, Bo Chen, Mingxing Tan, Weijun Wang, Yukun Zhu, Ruoming Pang, Vijay Vasudevan, Quoc V. Le, and Hartwig Adam. Searching for mobilenetv3. CoRR, abs/1905.02244, 2019.
- [21] Andrew G. Howard, Menglong Zhu, Bo Chen, Dmitry Kalenichenko, Weijun Wang, Tobias Weyand, Marco Andreetto, and Hartwig Adam. Mobilenets: Efficient convolutional neural networks for mobile vision applications. CoRR, abs/1704.04861, 2017.
- [22] Yanping Huang, Youlong Cheng, Ankur Bapna, Orhan Firat, Dehao Chen, Mia Chen, HyoukJoong Lee, Jiquan Ngiam, Quoc V Le, Yonghui Wu, and zhifeng Chen. Gpipe: Efficient training of giant neural networks using pipeline parallelism. In Advances in Neural Information Processing Systems 32, pages 103–112. Curran Associates, Inc., 2019.
- [23] Forrest N. Iandola, Matthew W. Moskewicz, Khalid Ashraf, Song Han, William J. Dally, and Kurt Keutzer. Squeezenet: Alexnet-level accuracy with 50x fewer parameters and <1mb model size. CoRR, abs/1602.07360, 2016.
- [24] Andrey Ignatov, Radu Timofte, William Chou, Ke Wang, Max Wu, Tim Hartley, and Luc Van Gool. AI benchmark: Running deep neural networks on android smartphones. CoRR, abs/1810.01109, 2018.
- [25] Apple Inc. About face id advanced technology. https://support.apple.com/en-us/HT208108.
- [26] Coinbase Inc. Id document verification. https://help.coinbase.com/en/coinbase/getting-started/authentication-and-verification/identity-verification.html.
- [27] Lime Inc. Apply for lime access. https://www.fountain.com/limebike/apply/united-states-limeaccess.
- [28] Lime Inc. Lime access: Mobility for all. https://www.li.me/community-impact.
- [29] Heinrich Jiang and Ofir Nachum. Identifying and correcting label bias in machine learning. CoRR, abs/1901.04966, 2019.
- [30] Jumio. Breathtaking growth requires smart onboarding. https://www.jumio.com/app/uploads/2018/01/Instacart-Case-Study.pdf.
- [31] Niki Kilbertus, Mateo Rojas-Carulla, Giambattista Parascandolo, Moritz Hardt, Dominik Janzing, and Bernhard Schölkopf. Avoiding discrimination through causal reasoning. In Proceedings of the 31st International Conference on Neural Information Processing Systems, NIPS’17, page 656–666, Red Hook, NY, USA, 2017. Curran Associates Inc.
- [32] Jian Liu, Cong Shi, Yingying Chen, Hongbo Liu, and Marco Gruteser. Cardiocam: Leveraging camera on mobile devices to verify users while their heart is pumping. In Proceedings of the 17th Annual International Conference on Mobile Systems, Applications, and Services, MobiSys ’19, page 249–261, New York, NY, USA, 2019. Association for Computing Machinery.
- [33] Sicong Liu, Yingyan Lin, Zimu Zhou, Kaiming Nan, Hui Liu, and Junzhao Du. On-demand deep model compression for mobile devices: A usage-driven model selection framework. In Proceedings of the 16th Annual International Conference on Mobile Systems, Applications, and Services, MobiSys ’18, page 389–400, New York, NY, USA, 2018. Association for Computing Machinery.
- [34] Wei Liu, Dragomir Anguelov, Dumitru Erhan, Christian Szegedy, Scott Reed, Cheng-Yang Fu, and Alexander C. Berg. Ssd: Single shot multibox detector. In Bastian Leibe, Jiri Matas, Nicu Sebe, and Max Welling, editors, Computer Vision – ECCV 2016, pages 21–37, Cham, 2016. Springer International Publishing.
- [35] Lyft Engineering Blog. Stopping fraudsters by changing products, December 2017. https://eng.lyft.com/stopping-fraudsters-by-changing-products-452240f2d2cc.
- [36] Deepak Narayanan, Aaron Harlap, Amar Phanishayee, Vivek Seshadri, Nikhil R. Devanur, Gregory R. Ganger, Phillip B. Gibbons, and Matei Zaharia. Pipedream: Generalized pipeline parallelism for dnn training. In Proceedings of the 27th ACM Symposium on Operating Systems Principles, SOSP ’19, page 1–15, New York, NY, USA, 2019. Association for Computing Machinery.
- [37] Alfred Ng. Uber fights off scammers every day. here’s how it learned the tricks. https://www-cnet-com.cdn.ampproject.org/c/s/www.cnet.com/google-amp/news/uber-fights-off-scammers-every-day-heres-how-it-learned-the-tricks/.
- [38] Samuel S. Ogden and Tian Guo. Characterizing the deep neural networks inference performance of mobile applications, 2019.
- [39] PayPal. Card.io: Scan credit cards in your mobile app. https://card.io.
- [40] Karthik Ramasamy and Lenny Evans. Using computer vision to combat stolen credit card fraud. In Strata data conference, March 2018.
- [41] X. Ran, H. Chen, X. Zhu, Z. Liu, and J. Chen. Deepdecision: A mobile deep learning framework for edge video analytics. In IEEE INFOCOM 2018 - IEEE Conference on Computer Communications, pages 1421–1429, 2018.
- [42] Joseph Redmon, Santosh Kumar Divvala, Ross B. Girshick, and Ali Farhadi. You only look once: Unified, real-time object detection. 2016 IEEE Conference on Computer Vision and Pattern Recognition (CVPR), pages 779–788, 2016.
- [43] Shaoqing Ren, Kaiming He, Ross Girshick, and Jian Sun. Faster r-cnn: Towards real-time object detection with region proposal networks. In C. Cortes, N. D. Lawrence, D. D. Lee, M. Sugiyama, and R. Garnett, editors, Advances in Neural Information Processing Systems 28, pages 91–99. Curran Associates, Inc., 2015.
- [44] Sam Tolomei. Shrinking APKs, growing installs. https://medium.com/googleplaydev/shrinking-apks-growing-installs-5d3fcba23ce2.
- [45] Mark Sandler, Andrew G. Howard, Menglong Zhu, Andrey Zhmoginov, and Liang-Chieh Chen. Inverted residuals and linear bottlenecks: Mobile networks for classification, detection and segmentation. CoRR, abs/1801.04381, 2018.
- [46] N. Scaife, J. Bowers, C. Peeters, G. Hernandez, I. N. Sherman, P. Traynor, and L. Anthony. Kiss from a rogue: Evaluating detectability of pay-at-the-pump card skimmers. In 2019 IEEE Symposium on Security and Privacy (SP), pages 1000–1014, 2019.
- [47] Nolen Scaife, Christian Peeters, and Patrick Traynor. Fear the reaper: Characterization and fast detection of card skimmers. In 27th USENIX Security Symposium (USENIX Security 18), pages 1–14, Baltimore, MD, 2018. USENIX Association.
- [48] Stripe. Disputes and fraud. https://stripe.com/docs/disputes.
- [49] Arm technologies. Arm big.little. https://www.arm.com/why-arm/technologies/big-little.
- [50] Uber. Verifying your account. https://help.uber.com/ubereats/article/verifying-your-account?nodeId=0b38e02f-eb4c-41f9-92e5-6b8c409e20c7.
- [51] Erkam Uzun, S. P. Chung, Irfan Essa, and W. Lee. rtcaptcha: A real-time captcha based liveness detection system. In NDSS, 2018.
- [52] Verizon. What is the difference between 3G, 4G and 5G? https://www.verizon.com/about/our-company/5g/difference-between-3g-4g-5g.
- [53] Robert J. Wang, Xiang Li, and Charles X. Ling. Pelee: A real-time object detection system on mobile devices. In Proceedings of the 32nd International Conference on Neural Information Processing Systems, NIPS’18, page 1967–1976, Red Hook, NY, USA, 2018. Curran Associates Inc.
- [54] C. Wu, D. Brooks, K. Chen, D. Chen, S. Choudhury, M. Dukhan, K. Hazelwood, E. Isaac, Y. Jia, B. Jia, T. Leyvand, H. Lu, Y. Lu, L. Qiao, B. Reagen, J. Spisak, F. Sun, A. Tulloch, P. Vajda, X. Wang, Y. Wang, B. Wasti, Y. Wu, R. Xian, S. Yoo, and P. Zhang. Machine learning at facebook: Understanding inference at the edge. In 2019 IEEE International Symposium on High Performance Computer Architecture (HPCA), pages 331–344, 2019.
- [55] Mengwei Xu, Jiawei Liu, Yuanqiang Liu, Felix Xiaozhu Lin, Yunxin Liu, and Xuanzhe Liu. A first look at deep learning apps on smartphones. In The World Wide Web Conference, WWW ’19, page 2125–2136, New York, NY, USA, 2019. Association for Computing Machinery.