Superconductivity in an extreme strange metal
D. H. Nguyen,1 A. Sidorenko,1 M. Taupin,1 G. Knebel,2 G. Lapertot,2
E. Schuberth,3 and S. Paschen1,∗
1Institute of Solid State Physics, Vienna University of Technology, 1040 Vienna, Austria
2Université Grenoble Alpes, CEA, Grenoble INP, IRIG, PHELIQS, 38000 Grenoble, France
3Technische Universität München, 85748 Garching, Germany
ABSTRACT
Some of the highest-transition-temperature superconductors across various materials classes exhibit linear-in-temperature ‘strange metal’ or ‘Planckian’ electrical resistivities in their normal state. It is thus believed by many that this behavior holds the key to unlock the secrets of high-temperature superconductivity. However, these materials typically display complex phase diagrams governed by various competing energy scales, making an unambiguous identification of the physics at play difficult. Here we use electrical resistivity measurements into the micro-Kelvin regime to discover superconductivity condensing out of an extreme strange metal state—with linear resistivity over 3.5 orders of magnitude in temperature. We propose that the Cooper pairing is mediated by the modes associated with a recently evidenced dynamical charge localization–delocalization transition, a mechanism that may well be pertinent also in other strange metal superconductors.
E-mail: ∗paschen@ifp.tuwien.ac.at
INTRODUCTION
The phenomenon of superconductivity has fascinated scientists since its discovery in 1911. It had to await microscopic understanding, achieved in the BCS theory 1, for almost 50 years. Conventional superconductors such as aluminum and niobium are now key players in the race for realizing the quantum computer 2. Understanding superconductivity that goes beyond this framework, as first seen in the the heavy fermion compound CeCu2Si2 3 and since then considered for numerous materials classes 4, is the next grand challenge.
In several of these ‘unconventional’ superconductors—across high- cuprates 5, iron pnictides and organic conductors 6, heavy fermion metals 7, 8 and, very recently, infinite-layer nickelates 9, twisted bilayer graphene 10, and WSe2 11—the normal state shows a linear-in-temperature ‘strange metal’ electrical resistivity, at least in certain temperature ranges. This suggests that to decipher this type of superconductivity requires understanding the mechanism of the underlying strange metal normal state. However, because of the complexity of the phase diagrams of many of these systems, this has proven challenging. Multiple competing effects 4, crossovers between different scaling behaviors 12, possible trivial linear-in-temperature resistivity contributions 13, or simply the fact that strong superconductivity covers much of the normal-state phase space and needs to be suppressed by external parameters 14, which may modify the original normal state, are inhibiting consensus on the key mechanism at play.
On the other hand, there is a material—the heavy fermion compound YbRh2Si2 15—where such complications are absent and linear-in-temperature strange metal behavior 15, 16, 17, 18 has recently been pinned down as resulting from a dynamical electron localization-delocalization transition 19 as the Kondo effect is destroyed at a magnetic quantum critical point (QCP) 20. Alas, this QCP appeared to lack superconductivity.
Our work unblocks this situation. By developing electrical resistivity measurements down to record low temperatures—more than 1.5 orders of magnitude below state-of-the-art—and using them to study YbRh2Si2, we discover unconventional superconductivity condensing out of a further expanded range of strange metal behavior, now covering 3.5 orders of magnitude in temperature. This establishes the connection between electron localization-delocalization-derived strange metal behavior and superconductivity, discussed previously for several other materials 21, 22, 23, 24, to a new level of confidence, thereby pointing to its universality and putting the spotlight on Cooper pairing mediated by the critical modes that are associated with this transition.
We note that in purely itinerant systems at the border of an antiferromagnetic phase with spin density wave (SDW) order, antiferromagnetic paramagnons 25 may lead to deviations from Fermi liquid behavior (although generally not to strictly linear-in-temperature resistivities) and provide superconducting pairing, a mechanism evoked for CePd2Si2 26. However, for the above strange metals 5, 6, 7, 8, 9, 10, 11 this mechanism seems unlikely, because no magnetic phase exists nearby and/or because there is evidence that this (weak-coupling) magnetic order parameter description is inappropriate.
The heavy fermion compound YbRh2Si2 exhibits a low-lying antiferromagnetic phase that is continuously suppressed to zero by a small magnetic field, establishing a field-induced QCP 16. A linear temperature dependence of the electrical resistivity is seen below about 10 K 16, 17, 18. This behavior is ruled out to be due to electron-phonon scattering because the non- reference material LuRh2Si2 is a normal metal and because Fermi liquid behavior is recovered when YbRh2Si2 is tuned away from the QCP by magnetic field 16, 17, 18. The recent observation of quantum critical energy-over-temperature () scaling in the charge dynamics 19, together with jumps in the extrapolated zero-temperature Hall coefficient 27, 28 and associated thermodynamic 29 and spectroscopic signatures 30 identifies a dynamical electron localization–delocalization transition as underlying the strange metal behavior.
RESULTS AND DISCUSSION
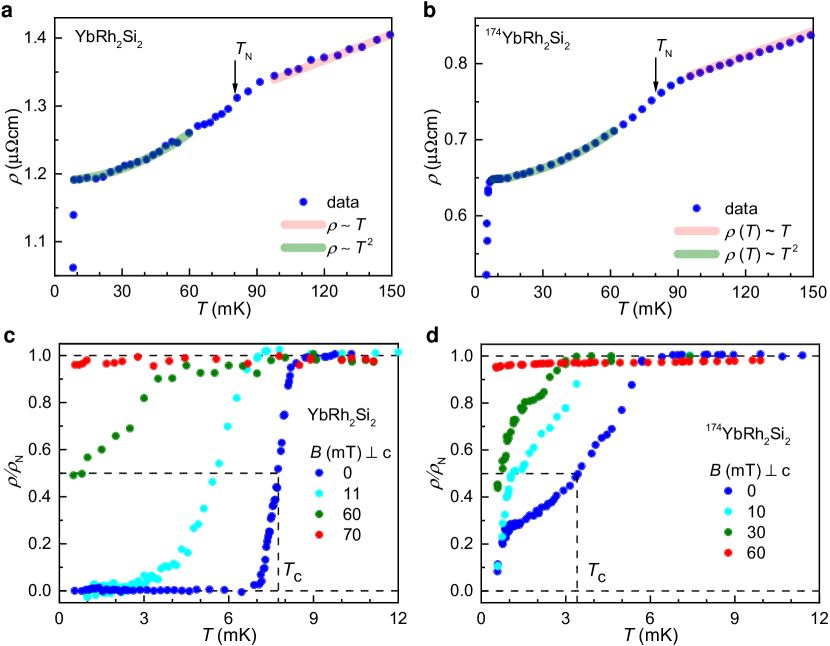
We have developed, and implemented in a nuclear demagnetization cryostat 31, a setup for high-resolution electrical resistivity measurements to temperatures well below 1 mK (see Methods), and used it to measure state-of-the-art YbRh2Si2 single crystals 32, 17. To assess the previously discussed 33 role of Yb nuclear moments, in addition to samples with natural abundance Yb (containing 14.2% 171Yb with a nuclear moment and 16.1% 173Yb with a nuclear moment ) 32, we also studied 174YbRh2Si2, which is free of nuclear Yb moments 17. In zero magnetic field, both samples show the characteristic kink near the Néel temperature , as well as linear-in-temperature behavior above and Fermi liquid behavior below (Fig. 1a,b). The parameters extracted from these fits (Table 1) are in good agreement with previous results 15, 16, 17, 18, confirming the high reproducibility of the properties in state-of-the-art YbRh2Si2 single crystals. At the lowest temperatures, a pronounced drop of the resistivity signals the onset of superconductivity. It is fully displayed in Fig. 1c,d. In YbRh2Si2, the transition is rather sharp ( for a resistance change from 90% to 10% of the value above the transition), with an onset somewhat below 9 mK. In 174YbRh2Si2, the onset is shifted to below 6 mK, and the transition is broadened, even though the residual resistance ratio of this sample is almost twice that of the normal YbRh2Si2 sample (Table 1), an effect that will be discussed later.
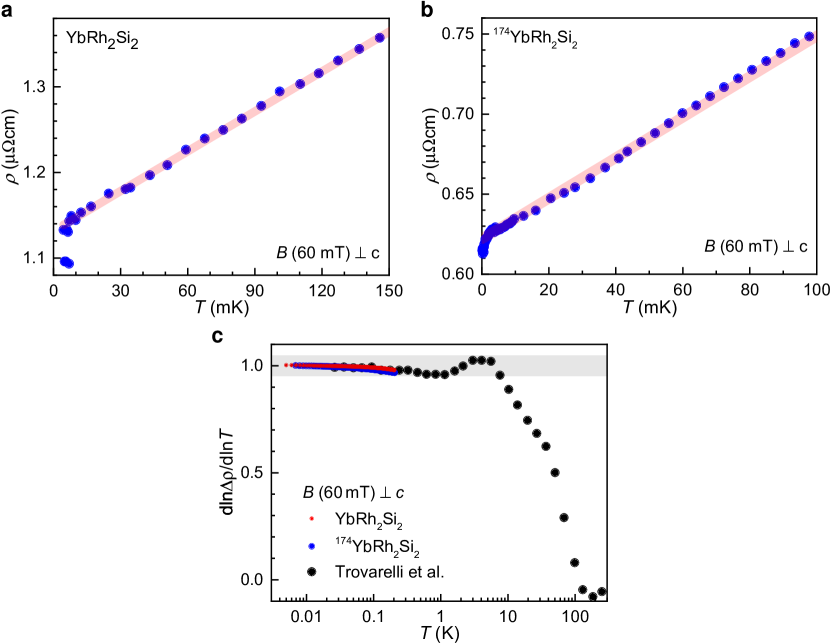
Application of magnetic fields within the - plane of the tetragonal crystal successively suppresses superconductivity in both samples (Fig. 1c,d). Note, however, that clear signs of superconductivity are visible even at the quantum critical field (see Fig. 1c, green curve, for YbRh2Si2, and Fig. 2b for 174YbRh2Si2), thus demonstrating superconductivity that nucleates directly out of the strange metal state (Fig. 2a,b). Our measurements expand the previously established strange metal regime to a record span of linear electrical resistivity over 3.5 orders of magnitude in temperature, with a high accuracy of 5% in the linear exponent (Fig. 2c).
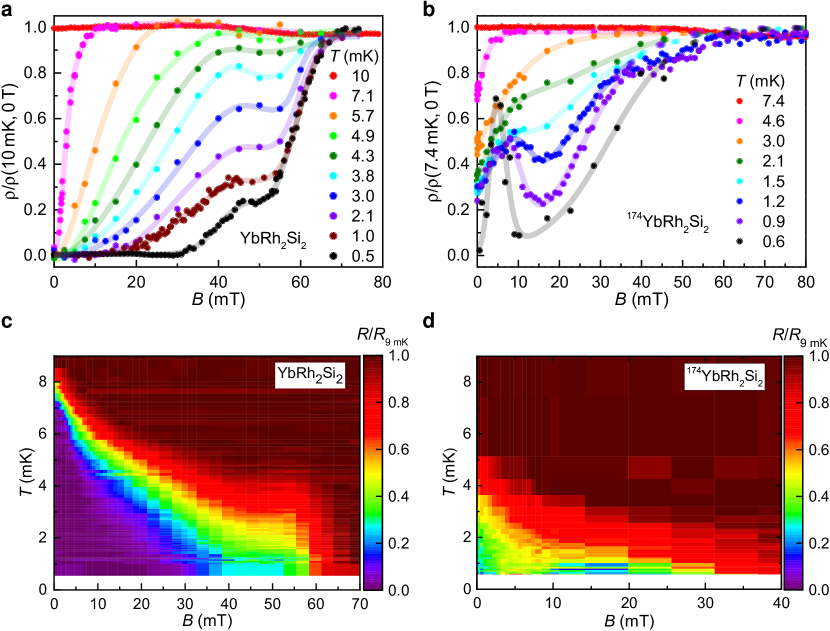
To characterize the superconductivity further, we performed isothermal magnetic field sweeps. In YbRh2Si2, all traces of superconductivity disappear only in fields beyond 70 mT, which is well above the quantum critical field of 60 mT (Fig. 3a). The unusual two-step-like shape of the resistivity isotherms below 5 mK, which is distinct from normal broadening in applied fields, suggests that two different superconducting phases might be involved. This is corroborated by the results on 174YbRh2Si2, where the lowest-temperature isotherms show clear signs of reentrance (Fig. 3b). We note that no current dependence was observed, ruling out that flux-flow resistivity is at the origin of these characteristics. Next, we present color-coded temperature–magnetic field phase diagrams of YbRh2Si2 and 174YbRh2Si2 (Fig. 3c,d), constructed from a large number of isotherms. Their merit is to give a general and fully unbiased impression of the phases present: an ‘S-shaped’ superconducting region in YbRh2Si2 and two, possibly separated superconducting regions in 174YbRh2Si2.
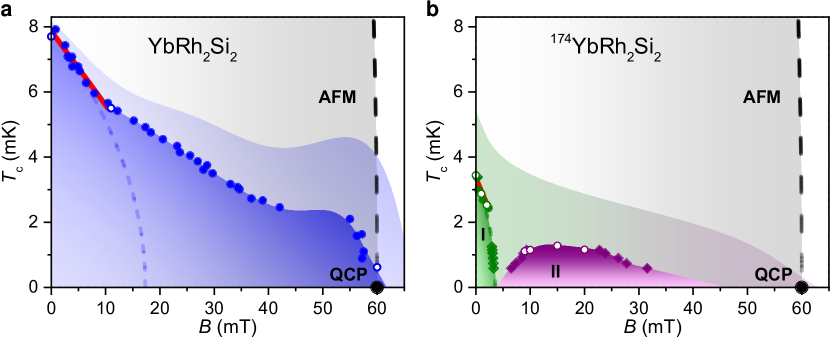
For more quantitative phase diagrams, a definition of the (field-dependent) transition temperatures and (temperature-dependent) upper critical fields has to be adopted. We choose the midpoints of the resistive transitions, as sketched in Fig. 1c,d. For YbRh2Si2 this leads to the phase boundary delineated by the full () and open () blue circles in Fig. 4a, which closely resembles the shape drawn by the yellow color code (50% resistance) in Fig. 3c. An initial rapid suppression of is followed by a much more gradual one, indicating that moving towards the QCP boosts the superconductivity against the general trend of field suppression associated with the Pauli- and/or orbital-limiting effect of the magnetic field (for cartoons of this field effect, see Supplementary Fig. 3). This is seen even more clearly in the 90% resistance line (boundary of the pale shading in Fig. 4a), that exhibits a local maximum at a magnetic field only slightly below the QCP. This evidences that at least a component of the superconductivity of YbRh2Si2 is promoted by the same quantum critical fluctuations that are also responsible for the extreme strange metal behavior—thus anchoring both phenomena to the material’s QCP. That there might indeed be two distinct superconducting phases, one more readily suppressed by magnetic field and one that is less field sensitive, receives further support from the phase diagram of 174YbRh2Si2, presented next.
Because the resistive transitions have finite widths, they interfere if two or more phase boundaries are nearby. For 174YbRh2Si2, where the ‘unbiased’ color-coded phase diagram already suggests two adjacent phases, we used a simple model to disentangle their effects (see Supplementary Note 1: Analysis of resistivity vs magnetic field isotherms and Supplementary Fig. 1). Indeed, by fitting this model to the data we find two distinct phases, a low-field one which we denote as phase I, and a field-induced one which we call phase II (Fig. 4b, see caption for the meaning of the different symbols). Again, we also show the 90% resistance line as the boundary of the pale shading. Using this criterion, phase I and II of 174YbRh2Si2 grow together into a single superconducting region, similar to what is observed for YbRh2Si2. Conversely, this adds evidence to the above-proposed two-phase interpretation of the peculiarly shaped superconducting region of YbRh2Si2 (see cartoons in Supplementary Fig. 2). Despite the qualitative similarities between the phase diagrams of YbRh2Si2 and 174YbRh2Si2, it is clear that quantitatively, the superconductivity is much weaker in 174YbRh2Si2. Thus, whereas nuclear moments—present in YbRh2Si2 but absent in 174YbRh2Si2—are not a necessary ingredient to create superconductivity, they do considerably strengthen it.
In what follows we give a few simple estimates of characteristics of the superconductivity in YbRh2Si2 and 174YbRh2Si2 (see Table 2). From the zero-field values (7.9 and 3.4 mK for YbRh2Si2 and 174YbRh2Si2, respectively) and upper critical field slopes (4.4 and 2.1 T/K, much larger than in conventional superconductors), which we determined from linear fits in Fig. 4 (see red lines), we estimate the weak-coupling BCS Ginzburg-Landau coherence lengths (97 and 215 nm). Together with the relevant (non-quantum critical) Sommerfeld coefficients (see Table 1) we derive the average Fermi wave vectors (5.2 and 4.8 nm-1) and, with the residual resistivities (see Table 1), the transport scattering lengths (371 and 976 nm) and the Ginzburg-Landau penetration depths (1.8 and 2.0 m). These describe moderately clean (), strongly type-II () superconductivity. Estimates of the orbital and Pauli limiting upper critical fields, via and (24 and 15 mT for YbRh2Si2, and 5 and 6.4 mT for 174YbRh2Si2, respectively) might well be compatible with the phase boundary of phase I in 174YbRh2Si2 and a putative corresponding low-field phase in YbRh2Si2. It is clear, however, that superconductivity in both YbRh2Si2 and 174YbRh2Si2 extends to much larger fields (Fig. 4), providing further evidence for the unconventional nature of the observed superconductivity.
Next we discuss how our results relate to previous thermodynamic measurements on YbRh2Si2 with natural abundance Yb, which provided evidence for superconductivity away from the QCP: Shielding signals were detected, with onsets somewhat below 10 mK and near 2 mK, in fields up to 0.055 and 0.418 mT, respectively 33, leaving it open whether this superconductivity is related to the strange metal state of YbRh2Si2. The transition temperature we determine from zero-field electrical resistivity measurements on YbRh2Si2 (with an onset near 9 mK) is in good agreement with the upper transition (into the B phase) detected there, identifying it thus with our phase I. The observation of the lower transition (into the A + sc phase of ref.33) could then be taken as evidence that the two superconducting phases of YbRh2Si2 postulated above intersect (see sketch in Supplementary Fig. 2a). Alternatively, our low-field superconducting region could comprise both the B and sc phase of ref.33; then our high-field region would be a separate phase not detected in ref.33 (see sketch in Supplementary Fig. 2b), just as the high-field phase of 174YbRh2Si2. This should be clarified by future magnetization/susceptibility measurements in lower fields (below the background field of 0.012 mT reached in ref.33, which appears to be well above the lower critical field of the B phase), ideally on powdered samples to better assess the Meissner volume of the B phase.
The lower transition of ref.33 is accompanied by a specific heat anomaly that releases a giant amount of entropy. It was interpreted as phase transition into a state of hybrid nuclear and electronic spin order of Yb, which reduces the internal (staggered) magnetic field of the primary electronic order and thus creates a less hostile environment for superconductivity. As our study reveals, the superconductivity in 174YbRh2Si2, which lacks nuclear Yb moments and can thus not exhibit such hybrid order, is indeed considerably weaker than in YbRh2Si2. This confirms that nuclear Yb moments boost the superconductivity in YbRh2Si2. That this mechanism apparently works up to temperatures well above the hybrid ordering temperature may be ascribed to short-range fluctuations, evidenced by the entropy release extending up to about 10 mK. Apart from the overall weakening of the superconductivity in 174YbRh2Si2 compared to YbRh2Si2, the phase diagrams of the two materials do, however, share many similarities (Fig. 4), calling for an understanding within the same framework.
The question that then arises is what is the mechanism of the Cooper pairing in the detected superconducting phases?
We start by recapitulating our results that make the BCS mechanism extremely unlikely: (i) Superconductivity in YbRh2Si2 condenses out of an extreme strange metal state, with linear-in-temperature resistivity right down to the onset of superconductivity (Fig. 2a); (ii) the upper critical field slope (Table 2) as well as the directly measured critical field (Fig. 4a) strongly overshoot both the Pauli and the orbital limiting fields; (iii) the low-temperature resistivity isotherms exhibit a two-step transition (Fig. 3a), evidencing that one component is much less field-sensitive than the other; (iv) the superconducting phase boundary deviates strongly from a mean-field shape (Figs. 3a and 4a), evidencing that the field boosts (at least part of) the superconductivity against the general trend of field suppression; (v) superconductivity is strongly suppressed by substituting the natural abundance Yb (of atomic mass 173.04) by 174Yb, though the isotope effect in a BCS picture would have a minimal effect (a reduction of by 0.1%). It is thus natural to assume that quantum critical fluctuations are involved in stabilizing (at least the high-field part of) the superconductivity in YbRh2Si2.
Very recently, in a two-impurity Anderson model that features Kondo destruction 20, the singlet-pairing susceptibility was found to be strongly enhanced by critical local moment fluctuations 34. Because singlet pairing may be subject to Pauli limiting, this phase—though stabilized by quantum critical fluctuations—might be suppressed by the applied magnetic field even well before the QCP is reached. Thus, phase I of 174YbRh2Si2 and the putative corresponding low-field phase of YbRh2Si2 are promising candidates for this type of superconductivity. Interestingly, in this context, unconventional superconductivity is also discussed in the spin-triplet channel 35, 36. It is tempting to consider phase II of 174YbRh2Si2 and the putative corresponding high-field phase of YbRh2Si2 to be of this kind, which would provide a compelling link to recently discovered candidate spin-triplet topological superconductors 37, 38. Of course, any model for superconductivity in YbRh2Si2 (and 174YbRh2Si2) should also correctly capture the normal state properties.
At the QCP of YbRh2Si2, a dynamical electron localization–delocalization transition, featuring both linear-in-temperature dc resistivity, and linear-in-frequency and linear-in-temperature ‘optical resistivity’, was evidenced by quantum critical frequency-over-temperature scaling, with a critical exponent of 1, of the THz conductivity of YbRh2Si2 19. This evidences critical modes in addition to the ones associated with the suppression of the (antiferro)magnetic order parameter. A microscopic mechanism compatible with this scaling is the disentanglement of the (electronic) Yb moments from the conduction electrons as static Kondo screening breaks down at the QCP 20, 19, 27, 28, 29, 30. Whether spin-triplet superconductivity may arise in models that capture this physics remains to be clarified by future work. Given that the quantum critical magnetic field is considerably larger than the scale associated with the superconducting transition temperature near the QCP, a promising direction is to consider the role of the applied magnetic field as reducing the spin symmetry from being in-plane continuous to Ising-anisotropic. In fact, calculations in an Ising-anisotropic two-impurity Bose-Fermi Anderson model suggest that near the model’s Kondo-destruction QCP the spin-triplet pairing correlation is competitive with the spin-singlet one 39. Naturally, the proposal of spin-triplet superconductivity should also be scrutinized by future experiments, including probes of anisotropies and NMR investigations, which are in principle feasible at ultralow temperatures.
Our observation of unconventional superconductivity condensing out of the textbook strange metal state of YbRh2Si2 ends a debate about reasons for its (previously supposed) absence. Thus, neither the moment stemming from Yb or the tuning parameter being magnetic field (as opposed to the typical situation of Ce-based systems under pressure or doping tuning), nor the QCP being governed by effects beyond order parameter fluctuations inhibit superconductivity. Instead, we propose that critical modes associated with a dynamical electron localization–delocalization transition mediate the strange-metal unconventional superconductivity in YbRh2Si2. Future experiments, ideally in conjunction with ab initio-based theoretical work, shall ascertain this assignment, disentangle the different superconducting phases, determine the symmetry of the order parameter, clarify further important details such as the single vs multiband nature of the superconductivity, and even explore the possibility of exotic surface phases.
Finally, we relate our discovery to strange-metal unconventional superconductors in other materials classes. It has been pointed out that the strange metal behavior in many of these is compatible with ‘Planckian dissipation’, i.e., with the transport scattering rate in a simple Drude conductor being equal to , with 40. For YbRh2Si2 and 174YbRh2Si2, we estimate much smaller values (see Table 2, and Supplementary Note 2: Estimates on Planckian dissipation), suggesting that linear-in-temperature resistivity—even in the extreme form observed here—does not require the Planckian limit to be reached. Whether this is related to the very strongly correlated nature of this compound (with effective masses above , much beyond those in the materials considered in ref. 40) or its pronounced deviation from Drude-like behavior (see Supplementary Materials of ref. 19), is an interesting question for future studies. As to a microscopic understanding of the phenomenon, we point out that charge delocalization transitions, similar to those observed in YbRh2Si2, are being discussed also in other strange-metal superconductors, including the high- cuprates 21, 22, an organic conductor 23 and, tentatively, even magic angle bilayer graphene 24. Our results thus point to the exciting possibility that a dynamical electron localization–delocalization transition may mediate strange-metal unconventional superconductivity in a broad range of materials classes.
METHODS
A. Refrigerator and thermometry
All measurements were carried out in the Vienna nuclear demagnetization refrigerator 31. We use resistance thermometry (Pt resistance thermometers Pt-1000, RuO2 thermometers, and sliced Speer carbon resistance thermometers) for temperatures above 10 mK and magnetic thermometry (CMN, pulsed Pt-NMR thermometers, via the pulsed nuclear magnetic resonance of 195Pt nuclei) for temperature below 20 mK. For the presented results, we used a CMN thermometer between 20 and 2 mK, a Speer thermometer above, and a Pt-NMR thermometer below.
B. Filters
To attenuate radiofrequency radiation, a series of filters and thermalization stages consisting of thermo-coax cables (from room temperature to the 50 mK plate), silver-epoxy filters, and RC filters were installed. The silver-epoxy filters are also used for thermalization (down to the mixing chamber temperature).
C. Sample holders and thermalization
Machined silver sample holders made from a 5N silver rod were annealed to reach a residual resistance ratio of 2000. They are directly screwed to the nuclear stage using home-made silver screws. To thermalize the samples, one of the two outer contact points (of the 4-point technique, see point E below) was connected by m gold wires to the silver holder, via spot welding on the sample and screwing to the silver holder. A separate grounding point of excellent quality (anchored 600 m below ground level) was used. The different stages of the cryostat (4 K and 1 K plate, still, 50 mK plate, mixing chamber, copper nuclear stage) were all connected via NbTi/CuNi superconducting wires to the same ground, such that the ground potential was highly uniform. To avoid ground loops, all measurements devices were connected via opto-couplers. During the measurements at ultralow temperatures (below 10 mK), all measurement devices were powered by V A batteries with floating ground. For electrical isolation (away from the ground point), Vespel was used on the sample holder, the superconducting coil, and the Nb-superconducting shield.
D. Magnetic field applied to the samples
A dc magnetic field coil made of superconducting NbTi wire ( K), a superconducting Nb cylinder (20 mm diameter, 10 cm length), and the sample holder are concentrically assembled. The field coil and the superconducting shield are thermalized to the mixing chamber, the sample holder to the nuclear stage. Magnetic fields at the position of the samples up to 80 mT were generated by applying a dc current, with the precision of a few T. For the highest fields, a current above 1.4 A was passed through the self-made coil. Because this represented a considerable risk of quenching and breaking the magnet, only a final set of experiments was done up to the highest fields. In particular, most of the measurements on 174YbRh2Si2 were done up to 45 mT only.
E. Resistivity measurements
Electrical resistivity measurements were done with a 7124 Precision Lock-in Amplifier. Electrical currents were sourced by a CS580 voltage-controlled current source. The lowest measurement current in our experiments was 10 nA. To increase the signal to noise ratio, low-temperature transformers (encapsulated in a lead shield) with a gain of 1000 were used. They were installed at and thermalized to the mixing chamber. In addition, a SR560 low noise voltage pre-amplifier was used at room temperature. Electrical contacts for these measurements where made by spot-welding gold wires to the samples, in a standard 4-point geometry. Carefully derived measurement protocols (electrical current densities, sweep rates, waiting times etc.) for a good thermalization of the samples to the nuclear stage were followed for all presented measurements; the good thermalization is confirmed by the reproducibility of the results between different types of experiments (e.g. temperature vs magnetic-field sweeps, cooling vs warming curves). Applying larger currents leads to overheating effects at the lowest temperatures, but no evidence for flux-flow resistance could be revealed.
Data availability
The datasets generated during and/or analysed during the current study are available from the corresponding author on reasonable request.
References
- 1 Bardeen, J., Cooper, L. N. & Schrieffer, J. R. Theory of superconductivity. Phys. Rev. 108, 1175 (1957).
- 2 Wendin, G. Quantum information processing with superconducting circuits: a review. Rep. Prog. Phys. 80, 106001 (2017).
- 3 Steglich, F., Aarts, J., Bredl, C. D., Lieke, W., Meschede, D., Franz, W. & Schäfer, H. Superconductivity in the presence of strong Pauli paramagnetism: CeCu2Si2. Phys. Rev. Lett. 43, 1892 (1979).
- 4 Stewart, G. R. Unconventional superconductivity. Adv. Phys. 66, 75 (2017).
- 5 Legros, A., Benhabib, S., Tabis, W., Laliberté, F., Dion, M., Lizaire, M., Vignolle, B., Vignolles, D., Raffy, H., Li, Z. Z., Auban-Senzier, P., Doiron-Leyraud, N., Fournier, P., Colson, D., Taillefer, L. & Proust, C. Universal -linear resistivity and Planckian dissipation in overdoped cuprates. Nat. Phys. 15, 142 (2019).
- 6 Doiron-Leyraud, N., Auban-Senzier, P., René de Cotret, S., Bourbonnais, C., Jérome, D., Bechgaard, K. & Taillefer, L. Correlation between linear resistivity and in the Bechgaard salts and the pnictide superconductor . Phys. Rev. B 80, 214531 (2009).
- 7 Park, T., Sidorov, V. A., Ronning, F., Zhu, J.-X., Tokiwa, Y., Lee, H., Bauer, E. D., Movshovich, R., Sarrao, J. L. & Thompson, J. D. Isotropic quantum scattering and unconventional superconductivity. Nature 456, 366 (2008).
- 8 Knebel, G., Aoki, D., Brison, J.-P. & Flouquet, J. The quantum critical point in CeRhIn5: a resistivity study. J. Phys. Soc. Jpn. 77, 114704 (2008).
- 9 Li, D., Lee, K., Wang, B. Y., Osada, M., Crossley, S., Lee, H. R., Cui, Y., Hikita, Y. & Hwang, H. Y. Superconductivity in an infinite-layer nickelate. Nature 572, 624 (2019).
- 10 Cao, Y., Chowdhury, D., Rodan-Legrain, D., Rubies-Bigorda, O., Watanabe, K., Taniguchi, T., Senthil, T. & Jarillo-Herrero, P. Strange metal in magic-angle graphene with near Planckian dissipation. Phys. Rev. Lett. 124, 076801 (2020).
- 11 Wang, L., Shih, E.-M., Ghiotto, A., Xian, L., Rhodes, D. A., Tan, C., Claassen, M., Kennes, D. M., Bai, Y., Kim, B., Watanabe, K., Taniguchi, T., Zhu, X., Hone, J., Rubio, A., Pasupathy, A. N. & Dean, C. R. Correlated electronic phases in twisted bilayer transition metal dichalcogenides. Nat. Mater. 19, 861 (2020).
- 12 van der Marel, D., Molegraaf, H. J. A., Zaanen, J., Nussinov, Z., Carbone, F., Damascelli, A., Eisaki, H., Greven, M., Kes, P. H. & Li, M. Quantum critical behaviour in a high superconductor. Nature 425, 271 (2003).
- 13 Polshyn, H., Yankowitz, M., Chen, S., Zhang, Y., Watanabe, K., Taniguchi, T., Dean, C. R. & Young, A. F. Large linear-in-temperature resistivity in twisted bilayer graphene. Nat. Phys. 15, 1011 (2019).
- 14 Proust, C. & Taillefer, L. The remarkable underlying ground states of cuprate superconductors. Annu. Rev. Condens. Matter Phys. 10, 409–429 (2019).
- 15 Trovarelli, O., Geibel, C., Mederle, S., Langhammer, C., Grosche, F. M., Gegenwart, P., Lang, M., Sparn, G. & Steglich, F. YbRh2Si2: Pronounced non-Fermi-liquid effects above a low-lying magnetic phase transition. Phys. Rev. Lett. 85, 626 (2000).
- 16 Gegenwart, P., Custers, J., Geibel, C., Neumaier, K., Tayama, T., Tenya, K., Trovarelli, O. & Steglich, F. Magnetic-field induced quantum critical point in YbRh2Si2. Phys. Rev. Lett. 89, 056402 (2002).
- 17 Knebel, G., Boursier, R., Hassinger, E., Lapertot, G., G. Niklowitz, P., Pourret, A., Salce, B., P. Sanchez, J., Sheikin, I., Bonville, P., Harima, H. & Flouquet, J. Localization of state in YbRh2Si2 under magnetic field and high pressure: Comparison with CeRh2Si2. J. Phys. Soc. Jpn. 75, 114709 (2006).
- 18 Taupin, M., Knebel, G., Matsuda, T. D., Lapertot, G., Machida, Y., Izawa, K., Brison, J.-P. & Flouquet, J. Thermal conductivity through the quantum critical point in YbRh2Si2 at very low temperature. Phys. Rev. Lett. 115, 046402 (2015).
- 19 Prochaska, L., Li, X., MacFarland, D. C., Andrews, A. M., Bonta, M., Bianco, E. F., Yazdi, S., Schrenk, W., Detz, H., Limbeck, A., Si, Q., Ringe, E., Strasser, G., Kono, J. & Paschen, S. Singular charge fluctuations at a magnetic quantum critical point. Science 367, 285 (2020).
- 20 Si, Q., Rabello, S., Ingersent, K. & Smith, J. Locally critical quantum phase transitions in strongly correlated metals. Nature 413, 804 (2001).
- 21 Balakirev, F. F., Betts, J. B., Migliori, A., Ono, S., Ando, Y. & Boebinger, G. Signature of optimal doping in Hall-effect measurements on a high-temperature superconductor. Nature 424, 912 (2003).
- 22 Badoux, S., Tabis, W., Laliberté, F., Grissonnanche, G., Vignolle, B., Vignolles, D., Béard, J., Bonn, D. A., Hardy, W. N., Liang, R., Doiron-Leyraud, N., Taillefer, L. & Proust, C. Change of carrier density at the pseudogap critical point of a cuprate superconductor. Nature 531, 210–214 (2016).
- 23 Oike, H., Miyagawa, K., Taniguchi, H. & Kanoda, K. Pressure-induced Mott transition in an organic superconductor with a finite doping level. Phys. Rev. Lett. 114, 067002 (2015).
- 24 Cao, Y., Fatemi, V., Fang, S., Watanabe, K., Taniguchi, T., Kaxiras, E. & Jarillo-Herrero, P. Unconventional superconductivity in magic-angle graphene superlattices. Nature 556, 43 (2018).
- 25 Scalapino, D. J. A common thread: The pairing interaction for unconventional superconductors. Rev. Mod. Phys. 84, 1383 (2012).
- 26 Mathur, N., Grosche, F., Julian, S., Walker, I., Freye, D., Haselwimmer, R. & Lonzarich, G. Magnetically mediated superconductivity in heavy fermion compounds. Nature 394, 39 (1998).
- 27 Paschen, S., Lühmann, T., Wirth, S., Gegenwart, P., Trovarelli, O., Geibel, C., Steglich, F., Coleman, P. & Si, Q. Hall-effect evolution across a heavy-fermion quantum critical point. Nature 432, 881 (2004).
- 28 Friedemann, S., Oeschler, N., Wirth, S., Krellner, C., Geibel, C., Steglich, F., Paschen, S., Kirchner, S. & Si, Q. Fermi-surface collapse and dynamical scaling near a quantum-critical point. Proc. Natl. Acad. Sci. U.S.A. 107, 14547 (2010).
- 29 Gegenwart, P., Westerkamp, T., Krellner, C., Tokiwa, Y., Paschen, S., Geibel, C., Steglich, F., Abrahams, E. & Si, Q. Multiple energy scales at a quantum critical point. Science 315, 969 (2007).
- 30 Seiro, S., Jiao, L., Kirchner, S., Hartmann, S., Friedemann, S., Krellner, C., Geibel, C., Si, Q., Steglich, F. & Wirth, S. Evolution of the Kondo lattice and non-Fermi liquid excitations in a heavy-fermion metal. Nat. Commun. 9, 3324 (2018).
- 31 Nguyen, D. H., Sidorenko, A., Müller, M., Paschen, S., Waard, A. & Frossati, G. The Vienna nuclear demagnetization refrigerator. J. Phys. Conf. Series 400, 052024 (2012).
- 32 Krellner, C., Taube, S., Westerkamp, T., Hossain, Z. & Geibel, C. Single-crystal growth of YbRh2Si2 and YbIr2Si2. Philos. Mag. 92, 2508 (2012).
- 33 Schuberth, E., Tippmann, M., Steinke, L., Lausberg, S., Steppke, A., Brando, M., Krellner, C., Geibel, C., Yu, R., Si, Q. & Steglich, F. Emergence of superconductivity in the canonical heavy-electron metal YbRh2Si2. Science 351, 485 (2016).
- 34 Cai, A., Pixley, J. H., Ingersent, K. & Si, Q. Critical local moment fluctuations and enhanced pairing correlations in a cluster Anderson model. Phys. Rev. B 101, 014452 (2020).
- 35 Kang, J., Fernandes, R. M., Abrahams, E. & Wölfle, P. Superconductivity at an antiferromagnetic quantum critical point: Role of energy fluctuations. Phys. Rev. B 98, 214515 (2018).
- 36 Li, Y., Wang, Q., Xu, Y., Xie, W. & Yang, Y.-f. Nearly degenerate and pairing symmetry in the heavy fermion superconductor . Phys. Rev. B 100, 085132 (2019).
- 37 Zhang, P., Yaji, K., Hashimoto, T., Ota, Y., Kondo, T., Okazaki, K., Wang, Z., Wen, J., Gu, G. D., Ding, H. & Shin, S. Observation of topological superconductivity on the surface of an iron-based superconductor. Science 360, 182 (2018).
- 38 Ran, S., Eckberg, C., Ding, Q.-P., Furukawa, Y., Metz, T., Saha, S. R., Liu, I.-L., Zic, M., Kim, H., Paglione, J. & Butch, N. P. Nearly ferromagnetic spin-triplet superconductivity. Science 365, 684 (2019).
- 39 Pixley, J. H., Deng, L., Ingersent, K. & Si, Q. Pairing correlations near a Kondo-destruction quantum critical point. Phys. Rev. B 91, 201109 (2015).
- 40 Bruin, J. A. N., Sakai, H., Perry, R. S. & Mackenzie, A. P. Similarity of scattering rates in metals showing -linear resistivity. Science 339, 804 (2013). References supplementary information
- 41 Friedemann, S., Wirth, S., Oeschler, N., Krellner, C., Geibel, C., Steglich, F., MaQuilon, S., Fisk, S., Paschen, S. & Zwicknagl, G. Hall effect measurements and electronic structure calculations on YbRh2Si2 and its reference compounds LuRh2Si2 and YbIr2Si2. Phys. Rev. B 82, 035103 (2010).
- 42 Rauchschwalbe, U., Lieke, W., Bredl, C. D., Steglich, F., Aarts, J., Martini, K. M. & Mota, A. C. Critical fields of the “heavy-fermion” superconductor CeCu2Si2. Phys. Rev. Lett. 49, 1448–1451 (1982).
- 43 Orlando, T. P., McNiff, Jr., E. J., Foner, S. & Beasleya, M. R. Critical fields, Pauli paramagnetic limiting, and material parameters of Nb3Sn and V3Si. Phys. Rev. B 19, 4545 (1979).
Acknowledgements
The authors thank A. Casey, Ch. Enss, G. Frossatti, L. Levitin, J. Saunders, A. de Waard, D. Zumbuehl and other colleagues from the European
Microkelvin Platform (EMP) for sharing expertise in ultralow-temperature
techniques, C. Krellner for growing YbRh2Si2 single crystals under supervision of
Ch. Geibel and F. Steglich in Dresden, M. Brando for assistance in the
selection of suitable single crystals, and P. Buehler, A. Prokofiev, Q. Si,
and F. Steglich for fruitful discussions. The team in Vienna acknowledges
financial support from the Austrian Science Fund (FWF grants P29296-N27 and DK
W1243), the EMP (H2020 Project 824109), and the European Research Council (ERC
Advanced Grant 227378).
Author contributions
S.P. initiated and lead the study. G.K. and G.L. synthesized and
characterized the 174YbRh2Si2 single crystals. D.H.N. and A.S. set up the
ultralow-temperature experiments, with initial guidance by E.S., and performed
the measurements. D.H.N., M.T., and S.P. analyzed the data. S.P. wrote the
manuscript, with input from all authors. All authors contributed to the
discussion.
Competing interests
The authors declare no competing interests.
Correspondence and requests for materials should be addressed to S.P.
Figures and tables
| sample | batch | RRR | (cm) | (cm/K2) | (cm) | (cm/K) | (J/molK2) |
|---|---|---|---|---|---|---|---|
| YbRh2Si2 | 63113_1 | 67 | 1.19 | 20.2 | 1.23 | 1.17 | 1.42 |
| 174YbRh2Si2 | Lap0288 | 123 | 0.55 | 14.8 | 0.59 | 0.85 | 1.22 |
| sample | (mK) | () | (nm) | () | (nm) | (m) | (mT) | (mT) | |
|---|---|---|---|---|---|---|---|---|---|
| YbRh2Si2 | 7.9 | 4.4 | 97 | 5.2 | 371 | 1.8 | 24 | 15 | 0.011 |
| 174YbRh2Si2 | 3.4 | 2.1 | 215 | 4.8 | 976 | 2.0 | 5.0 | 6.4 | 0.0065 |
Supplementary Information
Superconductivity in an extreme strange metal
D. H. Nguyen,1 A. Sidorenko,1 M. Taupin,1 G. Knebel,2 G. Lapertot,2
E. Schuberth,3 and S. Paschen1,∗
1Institute of Solid State Physics, Vienna University of Technology, 1040 Vienna, Austria
2Université Grenoble Alpes, CEA, IRIG, PHELIQS, 38000 Grenoble, France
3Technische Universität München, 85748 Garching, Germany
Supplementary Note 1: Analysis of resistivity vs magnetic field isotherms
In 174YbRh2Si2 the electrical resistivity vs magnetic field isotherms (Fig. 3b) at the lowest temperatures show clear signs of reentrance. To extract meaningful upper critical field and critical temperature values is thus more involved than in the case of a single superconductor–normal conductor phase boundary (where the criterion of a 50% resistivity drop is frequently adopted). We have thus devised a simple ‘multi-transition model’ to separate the different effects. A single magnetic field-driven transition from a superconductor to a normal conductor is (phenomenologically) described by
| (1) |
where represents the half-hight (50% resistivity drop) criterion and is a measure of the sharpness of the transition. The effect of first entering and then leaving a superconducting phase II as function of magnetic field is then captured by
| (2) |
and the total effect of starting in a superconducting phase I, leaving it, and passing through the superconducting phase II by
| (3) |
as shown in Supplementary Fig. 1. This corresponds to a parallel circuit. Note that the total trace (black curve) does not cross the 50% line at the same fields as the separate traces (blue, green, and red lines). Not using such a model will wash out the transitions between adjacent superconducting phases.
In fitting the isotherms of 174YbRh2Si2 (Fig. 3b), only for the lowest temperature (0.6 mK) the fit fully converged with all fit parameters (, , , -, -) open. Thus, to enable fits also at higher temperatures, we used the value determined in this lowest-temperature fit and the critical temperature in zero field to approximate the phase boundary with the mean-field form , and fixed in the higher-temperature fits to the corresponding values. All other parameters were left open and the fits converged.
Also the low-temperature isotherms of YbRh2Si2 (Fig. 3a) show ‘double transition’ signatures, but because they are less pronounced than in 174YbRh2Si2 we have refrained from doing a similar analysis there (the critical fields are simply determined by the 50% resistivity drop criterion, as explained in the main text).
Supplementary Note 2: Estimates on Planckian dissipation
In a material with Planckian dissipation, a linear-in-temperature electrical resistivity arises when the scattering rate reaches the Planckian limit, . To test whether this is the case in YbRh2Si2, we have determined the proportionality coefficient in
| (4) |
in two different ways. In a first approach, we use the simple Drude form
| (5) |
for the inelastic part
| (6) |
of the strange-metal electrical resistivity , identify in Supplementary Eq. 5 with Supplementary Eq. 4, and obtain
| (7) |
Here is the charge carrier concentration and the charge carriers’ effective mass. Because YbRh2Si2 is a multiband conductor 41, estimating from Hall effect measurements 27, 28 in a simple one-band model may introduce a sizable error. Thus, instead, we determined from the Ginzburg-Landau coherence length , the superconducting transition temperature , and the Sommerfeld coefficient , via the relation
| (8) |
as described in refs. 42, 43. and are taken from Table 2. is calculated from the zero-field coefficient of the Fermi liquid form (from Table 1) via the universal Kadowaki-Woods ratio . We expect this value, (see Table 1) to be a more reliable estimate of the Sommerfeld coefficient than the directly measured specific heat data because the phase transition anomaly from the Néel transition 16, 17 is superimposed on the data and difficult to subtract. The corresponding averaged Fermi wavevector
| (9) |
is given in Table 2 for both YbRh2Si2 and 174YbRh2Si2. This and are used to calculate the effective mass as
| (10) |
The values thus obtained from Supplementary Eq. 7 are 0.011 and 0.0065 for YbRh2Si2 and 174YbRh2Si2, respectively (Table 2), much smaller than expected for Planckian dissipation.
Our second approach makes use of recent optical conductivity measurements on YbRh2Si2 19, which showed that the inverse of the real part of the inelastic optical conductivity (an optical resistivity) is linear in frequency :
| (11) |
By equating Supplementary Eq. 6 and Supplementary Eq. 11 and using Supplementary Eq. 4 for we can calculate as
| (12) |
which yields 0.0062, in good agreement with the estimates from approach 1.
Supplementary Figures
![[Uncaptioned image]](/html/2106.14849/assets/x5.png)
![[Uncaptioned image]](/html/2106.14849/assets/x6.png)
a
b
Supplementary Fig. 1: Determination of critical fields in a
conductor with two adjacent superconducting phases. a Example of two
superconducting phases, I and II, described by our simple ‘multi-transition
model’ (see text). b Electrical resistivity , normalized to its
value in the normal state just above the onset of
superconductivity, as function of the applied magnetic field , at a fixed
temperature . The total trace (black) is compose of
three logistic functions (green, blue, red), with transitions at ,
, and , as described in the text.
![[Uncaptioned image]](/html/2106.14849/assets/x7.png)
a b
Supplementary Fig. 2: Cartoons of possible superconducting phases in YbRh2Si2. a Two intersecting phases. b Two separated phases, with an internal phase boundary in the low-field phase. Both are consistent with the combined results from the present work and ref. 33.
![[Uncaptioned image]](/html/2106.14849/assets/x8.png)
![[Uncaptioned image]](/html/2106.14849/assets/x9.png)
![[Uncaptioned image]](/html/2106.14849/assets/x10.png)
a b c
Supplementary Fig. 3: Cartoons of magnetic-field effect on superconducting domes around a quantum critical point (QCP). a The fat blue curve is a hypothetical curve where any (hostile) effect of the magnetic field on superconductivity (from Pauli or orbital limiting) is imagined to be absent. For the successive curves (from blue to green), an increasingly strong field effect is considered (using a simple mean-field-type suppression of by the magnetic field , which increases from zero along the tuning parameter axis). b Same as a, but for a superconducting phase with a dome that does not extend to the zero of the tuning parameter axis (fat red curve). Again, an increasingly strong field effect is added for the successive curves (from red to brown). c Lowest curve from panel a (green) and middle curve of panel b (purple), scaled in absolute values. A material with two QCP-derived superconducting phases, one with stronger pairing but larger field sensitivity (as in panel a, e.g., a spin-singlet superconductor) and one with weaker pairing but also weaker field sensitivity (as in panel b, e.g., a spin-triplet superconductor), could display such a magnetic-field-tuned phase diagram.