Modeling the Block Verification Time of Zcash
Abstract
An important aspect of the propagation delay in blockchain networks is the block verification time, which is also responsible for the so-called verifier’s dilemma. Models for the block verification time can help to understand and improve the verification process. Moreover, modeling the verification time is necessary for blockchain network simulations. In this paper, we present JOIST, a new model for the block verification time of Zcash. We identify computationally complex operations in the verification process of Zcash, and derive our model based on characteristic transaction features. We evaluate JOIST and show that the model is consistently more accurate than existing models, which consider the block size only.
Index Terms:
Blockchain, Simulation, Zcash1 Introduction
The independent verification of blocks is a core principle of a permissionless blockchain. While the verification of a block header is simple, the verification of transactions in a block can become much more time consuming. The large number of transactions and the complexity of transactions drives the required verification time. This leads to a fundamental design flaw, which is captured by the so-called verifier’s dilemma [1]. It describes the conflict of a miner between verifying a block for the “common good” and skipping expensive verifications altogether. In either way, the consequences are unfavorable as the network and in particular miners become susceptible to attacks.
Understanding the verification of blocks and transactions is therefore crucial to analyze and improve the mechanics of blockchain networks. For example, the verification time plays a role in the block distribution [2, 3, 4], blockchain simulations [5], as well as topology inference [6]. Today’s models estimating the block verification time mainly rely only on the block size as a rough approximation. The verification time, however, depends on the complexity of included transactions and therefore can differ between blocks of the same size.
Zcash [7] is a prime example for complex transaction scripting, where an accurate model of the verification time is highly relevant. Zcash uses various transaction types and zero-knowledge proofs, which are more complex than Bitcoin’s transaction scripting [8]. While in Bitcoin the transfer time seems to be the dominating factor of block propagation [9], the verification time in Zcash can be expected to have a higher impact on system properties as the network is smaller and block propagation delays are shorter [6]. Thus, more sophisticated models are required.
In this paper, we present JOIST, a novel—yet deliberately simple—model for the block verification time of Zcash. Our model considers different transaction features to predict the block verification time. We evaluate JOIST based on a benchmark of real-world Zcash block verification time samples. Our model has a lower error compared to block size-based models, yielding a mean absolute error of compared to approximately . In addition, JOIST captures extreme values better, which have a higher impact on the overall block propagation. Our results also provide general insights, i.e., varying transaction complexity of transactions not specific to Zcash render block size-based models inaccurate even beyond Zcash.
Our main contributions are (i) a model for the block verification time of Zcash based on transaction features and (ii) a benchmark of the Zcash client’s block verification process and its employed cryptographic primitives to support and evaluate our model.
2 Related Work
Block propagation is an important aspect of analyzing and modeling blockchain networks. Some approaches try to reduce the impact of block verification [10, 11, 12, 13], which is orthogonal to our work.
Blockchain simulation models need to consider verification time or need to implement the verification procedure. Simulations and analytical models abstract the Bitcoin logic [5, 3, 2, 4]. These approaches assume a linear block size-based verification time. Block verification can also be a measurement based delay [14, 15].
Research directly related to Zcash’s verification time also exists: The Zerocash paper [16] approximates verification time for a transactions with a constant of . Another block size-based model fitted for Zcash considers verification time differences of different nodes [6]. To the best of our knowledge, we present the first block verification model independent of block size for Zcash.
3 JOIST Verification Model
We analyzed the Zcash code and identified relevant predictors for the block verification time. While verifying the block header can be considered constant, the verification steps for transactions differ greatly based on the set of transaction types. More specifically, we consider the number of JoinSplits, Output descriptions, Inputs, and Spend descriptions in Transactions, i.e., JOIST.
3.1 Transaction Complexity
Zcash uses shielded and transparent transactions. While transparent transactions are comparable to Bitcoin transactions, shielded transactions use zero knowledge proofs to hide sender and receiver information as well as the amount of Zcash coins (ZEC) in a transaction. Since the Sapling network upgrade shielded transactions contain Spend and Output descriptions instead of so-called JoinSplit descriptions. In the following, we identify and enumerate expensive computations in the transaction and block verification process of Zcash. At the same time, we strive to find simple features to predict the complexity.
For transparent transactions, we abstract from the scripting engine and assume P2PKH scripts, which require one signature check. Therefore, we assume verification time scales linearly with the number of transparent inputs.
For shielded transactions, each Spend, Output, and JoinSplit description incurs a separate zk-SNARK proof. Verifying a single zk-SNARK proof can be computed in . We therefore assume a linear relationship between the verification time of zk-SNARK proofs and the number of transparent inputs, Spend and Output descriptions, and JoinSplits.
In addition, all transaction types require repeated calculations of transaction hashes, e.g., to check signatures. One could conclude that the verification time scales linearly with the number of verification steps. Zcash, however, allows re-use of transaction hashes by caching them.111See ZIP: 143, Transaction Signature Validation for Overwinter https://zips.z.cash/zip-0143 and ZIP: 243, Transaction Signature Validation for Sapling https://zips.z.cash/zip-0243 [Both Accessed: 02-Sep-2020]. Therefore, they do not have to be re-computed for multiple verification steps across one transaction, yielding a constant complexity per transaction. We similarly model the hash calculations on the block level as constant operation.
Since transparent outputs are referenced by inputs and do not trigger complex computations on their own, we can ignore them in our model.
3.2 Statistical Analysis
We analyze the statistical correlation between different transaction properties and verification time. Therefore, we calculate Pearson’s correlation coefficient for each selected feature in relation to the block verification time (cf. TABLE I). As a sample we use Zcash blocks from block height 715,578 to block height 915,578, which were the most recent blocks at the beginning of our work. The verification time is determined in a benchmark, described in detail in Section 4. For each observation in our sample, i.e., for each observed block height, let be our feature and let be the verification time. Then
| (1) |
where is the sample size, is the mean over all feature observations, and is the mean block verification time.
We show the results for each selected feature in TABLE I. The results show that the number of JoinSplits, Output descriptions, transparent inputs, and Spend descriptions of the transactions exhibit a linear relationship with respect to the verification time. Outputs have only a small effect on the verification process, since they are not involved in the process.
The analysis further shows that JoinSplits, although legacy, cannot be ignored. We identified many blocks still containing JoinSplits. Once a JoinSplit is included, verification time increases significantly as it often includes the verification of two zk-SNARK proofs.
3.3 Model
We consider the number of JoinSplit , Output descriptions , transparent Inputs , and Spend descriptions of all transactions in the block as the predictors of JOIST. We derive our model to estimate the verification time of a given block as
| (2) |
The constant accounts for verification overhead of block header, hashing transactions, and possible I/O operations.
The values , , , and are constant coefficients used as weights. The coefficients for the model can be found by performing a benchmark on a local client. It is certainly possible to parametrize the model by using the mean or median time of the respective verification operations. For improved accuracy, however, coefficients should be discovered by linear regression. For our evaluation, we use ordinary least squares to parametrize JOIST.
| Feature (number of) | -Value | |
|---|---|---|
| Transparent inputs | 0.11 | |
| Transparent outputs | 0.04 | |
| Spend descriptions | 0.38 | |
| Output descriptions | 0.53 | |
| JoinSplit descriptions | 0.60 |
4 Evaluation
In this section, we evaluate JOIST and compare it to block size-based models used in literature. In order to parametrize the models, we utilize two benchmarks on two different systems.
| HDD | SSD | |
|---|---|---|
| Cores | 2 | 6 |
| Processor | Intel Core i5 | AMD Ryzen 5 2600X |
| Clock rate | ||
| RAM, SWAP | , | , |
| Disk |
WD Elements
USB 3.0 |
Samsung
SSD 860 Evo |
| Disk I/O | 100 MB/s | 540 MB/s |
4.1 Benchmark Setup
We perform the benchmarks utilizing two different setups. One benchmark is performed on a low performance system with an HDD disk, limited RAM, and restricted CPU. The other system is a high(er) performance, consumer-grade system with an SSD disk, more RAM, and faster CPU. The specific hardware configurations are shown in TABLE II. For short, we refer to the two systems as HDD and SSD, because we believe that the access times in general will have a major impact on our results. More specifically, we use the limited HDD system to show the influence of disk access and slower CPU times on the overall verification process. In contrast, we use the SSD system to simulate more realistic client hardware.
For our benchmark, we perform a black box-like benchmark on both systems, capturing the complete block verification process. The verification process amounts to the time the client processes the ProcessNewBlock function during synchronization with the network. For a fine grained analysis, we separately performed benchmarks of singular computational steps, such as verifying singular inputs or spends, performed during verification. Our evaluation is based on different sequences starting with the latest block in our sample at block height . For improved reproducibility, we compiled and run the Zcash 3.0 client inside a Docker container. The used code and data sets are publicly available.222https://github.com/fstiehle/zcash-benchmark
4.2 Model validation
In order to evaluate JOIST, we consider the mean absolute error (MAE) as well as the error mean ratio (EMR), which we define for completeness in Appendix A. In order to evaluate the general fit of our model, we calculate the coefficient of determination and the adjusted , denoted as . Let be the sample size (number of blocks), be the predicted, the observed verification time at block height , and be the average verification time over our complete sample. Therefore, and can be calculated as
| (3) | ||||
| (4) |
where is the number of the model’s predictors.
For the model validation, we use a sample size of 15k and 220k blocks. We then uniformly at random choose 5k blocks to fit the model and use the remaining 10k blocks to predict the verification time. For the 220k block sample, we analogously use 20k to fit the model and use the remaining 200k blocks to predict verification times. We use ordinary least squares (OLS) to discover coefficients for JOIST, which are listed in Appendix B.
In TABLE III, we summarize the results for the HDD and SSD benchmark. Notably for the SSD benchmark predicting 10k blocks, JOIST was able to predict the block verification time with and . Moreover, our model was able to explain most of the variance with . For the SSD benchmark predicting 200k blocks, where approximately 10 % of blocks were used for parametrization, JOIST performed expectedly less accurate. However, JOIST sill achieves an , an , and .
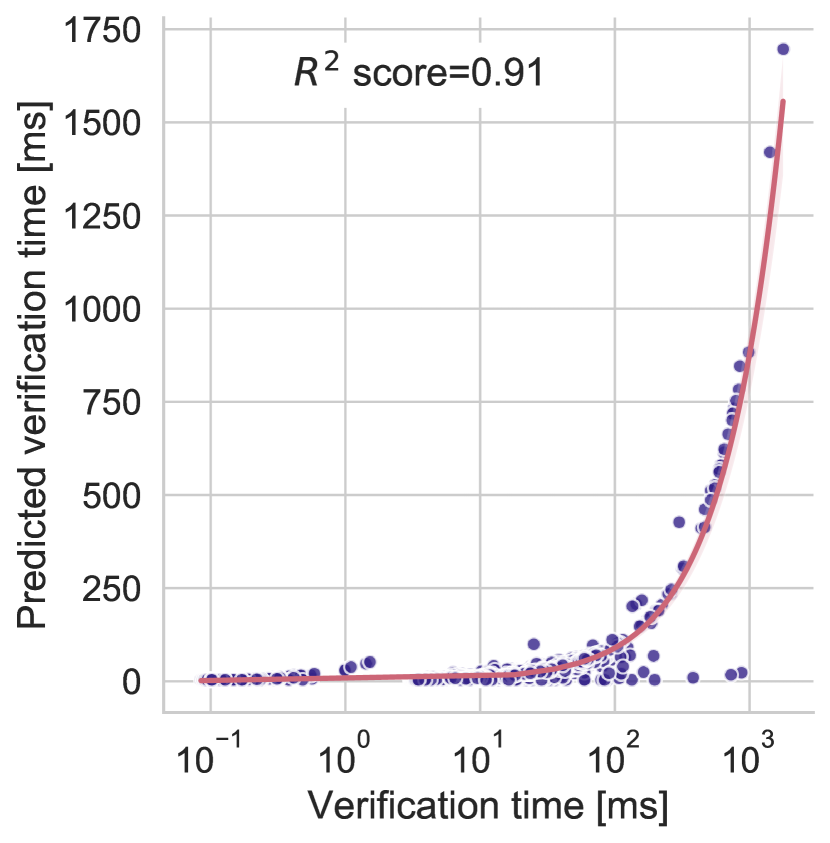
In Fig. 1(a), we compare estimated with measured verification time for the SSD benchmark (mind the log scale on the x axis). While we see some variance for verification times between and , we observe a generally good fit. Our model is even able to explain most of the outliers with verification times over .
As expected, the HDD benchmark is more erratic. The results yield an and an when predicting 10k blocks and an and an when predicting 200k blocks. For both benchmarks, is very close to which suggests that all our predictors actually contribute to the prediction.
4.3 Model Comparison
Previous models [5, 3, 6, 4, 2] assume a linear relationship between the block size and the block verification time. In order to compare this approach to our model, we introduce a generic block size-based model, predicting the verification time of a block as
| (5) |
where is the block size, a constant weighting coefficient, and a constant to capture disturbances. In the following, we refer to this model as Block size model.
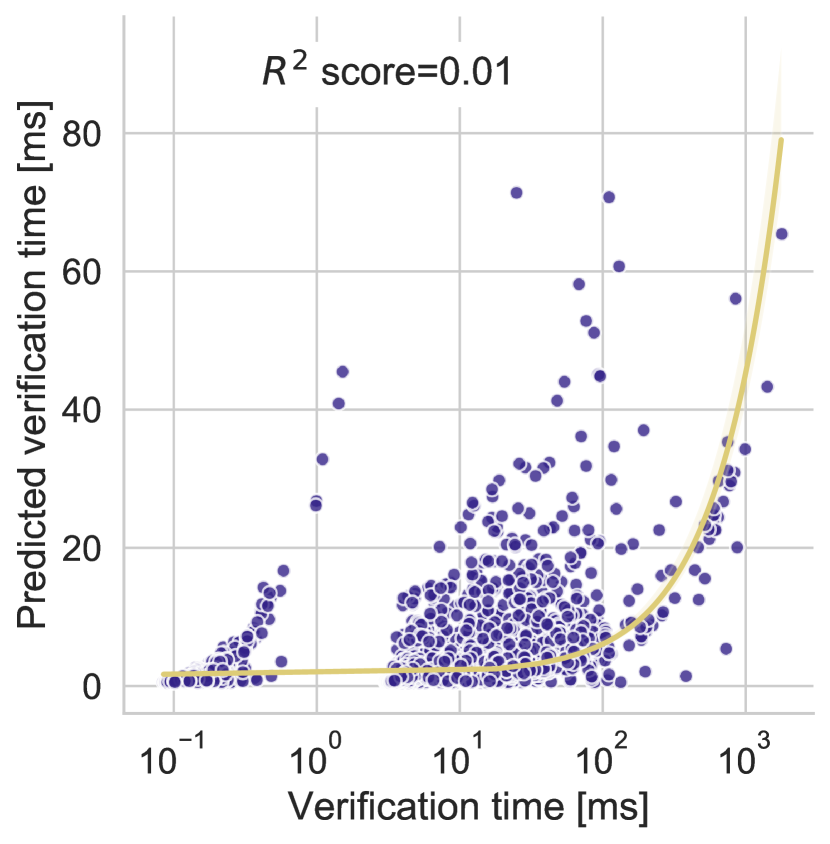
In addition, we use the model by [5] [5], which is a block size-based model, assuming a mean block size of and mean validation time of . While it is designed for Bitcoin, we include it in our evaluation due to the prevalent number of transparent transactions in Zcash, which are identical to Bitcoin. An overview over the distribution of different transaction types is provided in Appendix C.
| Model | MAE | EMR | ||||
|---|---|---|---|---|---|---|
| SSD Benchmark | JOIST | 10k | 3.11 ms | 23 % | 0.91 | 0.91 |
| 200k | 7.11 ms | 43 % | 0.72 | 0.72 | ||
| Block size | 10k | 10.60 ms | 78 % | 0.25 | 0.25 | |
| 200k | 15.13 ms | 92 % | 0.14 | 0.14 | ||
| [5] | 10k | 11.66 ms | 86 % | 0.01 | 0.01 | |
| 200k | 14.60 ms | 89 % | 0.04 | 0.04 | ||
| HDD Benchmark | JOIST | 10k | 22.05 ms | 64 % | 0.16 | 0.16 |
| 200k | 30.03 ms | 69 % | 0.40 | 0.40 | ||
| Block size | 10k | 31.20 ms | 91 % | 0.09 | 0.09 | |
| 200k | 42.46 ms | 98 % | 0.12 | 0.12 | ||
| [5] | 10k | 32.48 ms | 95 % | -0.03 | -0.03 | |
| 200k | 41.25 ms | 95 % | -0.01 | -0.01 |
For the comparison, we evaluate MAE, EMR, , and . We use a sample size of 15k and 220k blocks and uniformly at random choose 5k and 20k blocks to calculate coefficients, respectively. The remaining blocks, 10k and 200k blocks, are used to predict verification times. We use OLS to calculate coefficients for both models, JOIST and block size-based. In Appendix B, we list all fitting parameters for all evaluated models and benchmarks. A summary of our results is shown in TABLE III.
For the SSD benchmark predicting 10k blocks, JOIST provides better estimations than both block sized-based models. Our model was able to predict the verification time with an MAE of , compared to approximately . Even when predicting 200k blocks, using only 20k blocks for fitting the model, our evaluation resulted in an MAE of , compared to , an EMR of , compared to , and an , compared to .
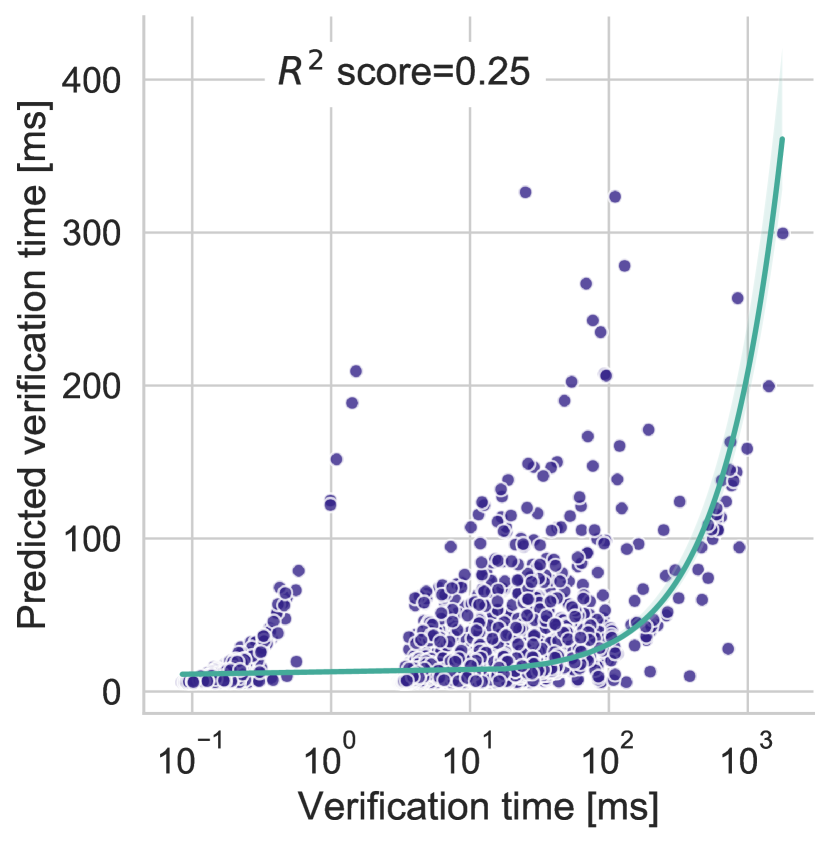
We compare the fit of the respective models in Fig. 1, where we show the estimated versus the measured verification time and a fitted regression line. We can observe a good fit for our model. The block size-based models are unable to explain a number of variances, particularly in the range between and , which contains most of our observed blocks. The resulting low score of the block size-based models suggests that these models make only slightly better predictions than the median.
In addition, JOIST performs well for extreme values, which have a higher impact on the overall block distribution time and are therefore important to simulate realistic block propagation, for example. While the highest prediction of JOIST was , only four blocks (0.02 %) exhibit a higher verification time. In contrast, the maximal prediction of the Block size model was and of [5] . That is, 68 blocks (0.34 %) for the Block size model and 2,849 blocks (14 %) for [5] exhibit a higher measured verification time than the prediction. As a result, JOIST exhibits a max error of , the Block size model a max error of , and [5] a max error of .
4.4 Discussion
While we showed that our model predicts the block verification time of Zcash more accurately than other models proposed in literature, we observe that it performs much better for modern systems with faster disk access, more RAM, and more CPU cores. Low RAM forces the Zcash client to flush state to disk more frequently, which leads to unpredictable access times. Similarly, the impact of multi-core, high(er) clock rate CPUs is visible. Delays introduced by a single verification step, e.g., verifying a single input, is a magnitude faster in the SSD benchmark () when compared to the HDD benchmark (). By comparing both benchmarks and the performance of our model, we can conclude that I/O operations are a negligible factor during block verification on modern systems.
We additionally observe a high variance of verification time for blocks containing transparent transactions only. In such scenarios, our modeling approach is not able to accurately capture this variance. Likely, our abstraction of the scripting system, i.e., our assumption to consider P2PKH scripts only, led to this result. Improving our model towards transparent transactions will require a more in-depth analysis of the scripting system. A major challenge would be to classify and identify relevant opcodes with the highest impact on the verification time. Extracting these features, including sample data, would also be significantly more complex. This direction, however, would increase our model’s applicability for other blockchains.
While we focus on Zcash, we separately evaluated blocks with transparent transactions only. We observed that all models perform similarly with a high error yielding , , and . This indicates a general weakness. That is, models using the block size as the only predictor might be unable to predict block verification times accurately for blockchains such as Bitcoin. Therefore, not only blockchains with complex block verification procedures such as Zcash or Ethereum [17] require additional modeling efforts, but also blockchains with a rather simple scripting system.
In general, our model is a trade off between abstraction, complexity, and transparency. We deliberately use basic, easily acquirable features. Each feature is encoded in the Zcash RPC response and can be easily retrieved.
5 Conclusion
In this paper, we developed JOIST, a new model based on transaction features that provides more accurate results than the prevalent block size-based models. To this end, we extracted time-consuming primitives from Zcash’s transaction verification process. JOIST is simple to parametrize and at the same time able to predict the block verification time accurately.
Overall, we believe that JOIST is a promising first step in modeling and predicting the block verification time of blockchains, which in turn can improve modeling and simulation efforts of the propagation delay and blockchain systems in general. Furthermore, the model could help miners to quantify verification risk and therefore address the verifiers dilemma.
References
- [1] Loi Luu, Jason Teutsch, Raghav Kulkarni and Prateek Saxena “Demystifying Incentives in the Consensus Computer” In CCS ’15: Proceedings of the 22nd ACM SIGSAC Conference on Computer and Communications Security, 2015, pp. 706–719
- [2] Saeideh G Motlagh, Jelena Mišić and Vojislav B Mišić “An analytical model for churn process in Bitcoin network with ordinary and relay nodes” In Peer-to-Peer Networking and Applications 13 Springer, 2020, pp. 1931–1942
- [3] Elias Rohrer and Florian Tschorsch “Kadcast: A Structured Approach to Broadcast in Blockchain Networks” In AFT ’19: Proceedings of the first ACM conference on Advances in Financial Technologies, 2019, pp. 199–213
- [4] Yahya Shahsavari, Kaiwen Zhang and Chamseddine Talhi “A Theoretical Model for Block Propagation Analysis in Bitcoin Network” In IEEE Transactions on Engineering Management, 2020, pp. 1–18 DOI: 10.1109/TEM.2020.2989170
- [5] Arthur Gervais, Ghassan Karame, Karl Wüst, Vasileios Glykantzis, Hubert Ritzdorf and Srdjan Capkun “On the Security and Performance of Proof of Work Blockchains” In CCS ’16: Proceedings of the 23rd ACM SIGSAC Conference on Computer and Communications Security, 2016
- [6] Erik Daniel, Elias Rohrer and Florian Tschorsch “Map-Z: Exposing the Zcash Network in Times of Transition” In LCN ’19: Proceedings of the 44th IEEE International Conference on Local Computer Networks, 2019, pp. 84–92
- [7] Daira Hopwood, Sean Bowe, Taylor Hornby and Nathan Wilcox “Zcash Protocol Specification (Version 2020.1.15)”, 2020
- [8] Satoshi Nakamoto “Bitcoin: A peer-to-peer electronic cash system”, 2009 URL: http://www.bitcoin.org/bitcoin.pdf
- [9] Reiki Kanda and Kazuyuki Shudo “Estimation of Data Propagation Time on the Bitcoin Network” In AINTEC ’19: Proceedings of the 15th Asian Internet Engineering Conference, 2019, pp. 47–52
- [10] Sourav Das, Nitin Awathare, Ling Ren, Vinay Joseph Ribeiro and Umesh Bellur “Better Late than Never; Scaling Computations in Blockchain by Delaying Transactions” In arXiv preprint arXiv:2005.11791, 2020
- [11] Bing Liu, Yang Qin and Xiaowen Chu “Reducing forks in the blockchain via probabilistic verification” In ICDEW ’19: Proceedings of the 35th IEEE International Conference on Data Engineering Workshops, 2019, pp. 13–18
- [12] Jacob Eberhardt and Stefan Tai “Zokrates-Scalable Privacy-Preserving Off-Chain Computations” In BLOCKCHAIN ’18: Proceedings of the IEEE International Conference on Blockchain, 2018, pp. 1084–1091
- [13] Matt Corallo “BIP 152: Compact Block Relay”, 2016 URL: https://github.com/bitcoin/bips/blob/master/bip-0152.mediawiki
- [14] Andrew Miller and Rob Jansen “Shadow-Bitcoin: Scalable Simulation via Direct Execution of Multi-Threaded Applications” In CSET ’15: Proceedings of the 8th Workshop on Cyber Security Experimentation and Test, 2015
- [15] Carlos Faria and Miguel Correia “BlockSim: Blockchain Simulator” In Blockchain ’19: Proceedings of the 2019 IEEE International Conference on Blockchain, 2019, pp. 439–446
- [16] Eli Ben-Sasson, Alessandro Chiesa, Christina Garman, Matthew Green, Ian Miers, Eran Tromer and Madars Virza “Zerocash: Decentralized anonymous payments from Bitcoin” In SP ’14: Proceedings of the 35th IEEE Symposium on Security and Privacy, 2014
- [17] Gavin Wood “Ethereum: A Secure Decentralised Generalised Transaction Ledger”, 2014 URL: http://gavwood.com/Paper.pdf
Appendix A Error Calculation
For completeness, we include the formulas for calculating MAE and EMR. Let be the sample size, i.e., the number of blocks. Let be the predicted and the real observed verification time at block height . We define the error as the difference between the real verification time and the prediction , i.e., Moreover, let be the average verification time over our complete sample, i.e., We accordingly define MAE and EMR as
| MAE | (6) | |||
| EMR | (7) |
Appendix B Fitting Parameters
| Model | Benchmark | Parameters [] |
| JOIST | 5k, HDD | |
| 5k, SSD | ||
| 20k, HDD | ||
| 20k, SSD | ||
| Block size | 5k, HDD | |
| 5k, SSD | ||
| 20k, HDD | ||
| 20k, SSD | ||
| [5] | N/A | , |
Appendix C Transaction Types
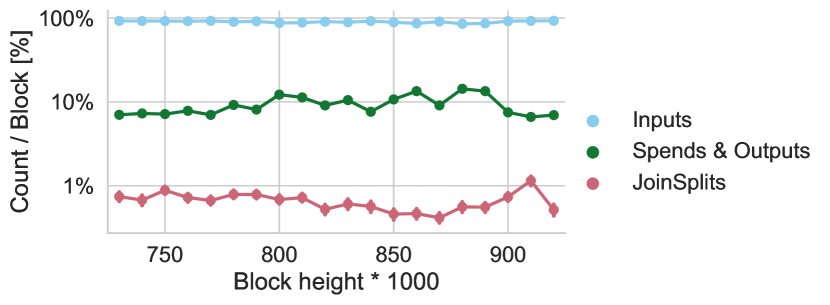
In Fig. 2, we distinguish the different transaction types over the last 200k blocks in our sample. To this end, we consider a block as a set of transparent inputs, Spend, Output, and JoinSplit descriptions. We find that blocks consist on average of 90 % transparent inputs, while Spend an Output descriptions make up 9 %, and JoinSplit descriptions remain largely stable at around 1 % per block.