Resonance from antiferromagnetic spin fluctuations for superconductivity in UTe2
Superconductivity originates from the formation of bound (Cooper) pairs of electrons that can move through the lattice without resistance below the superconducting transition temperature bcs . Electron Cooper pairs in most superconductors form anti-parallel spin singlets with total spin scalapinormp , although they can also form parallel spin-triplet Cooper pairs with and an odd parity wavefunction andy . Spin-triplet pairing is important because it can host topological states and Majorana fermions relevant for quantum computation MSato2017 ; Kitaev2001 . Because spin-triplet pairing is usually mediated by ferromagnetic (FM) spin fluctuations andy , uranium based materials near an FM instability are considered to be ideal candidates for realizing spin-triplet superconductivity Aoki2019a . Indeed, UTe2, which has a K Ran2019 ; Aoki2019 , has been identified as a candidate for a chiral spin-triplet topological superconductor near an FM instability Ran2019 ; Aoki2019 ; Ran2019b ; Knebel2019 ; Sundar2019 ; Jiao2020 ; Nakamine2021 ; Hayes2020 , although it also has antiferromagnetic (AF) spin fluctuations Thomas2020 ; Duan2020 . Here we use inelastic neutron scattering (INS) to show that superconductivity in UTe2 is coupled to a sharp magnetic excitation, termed resonance mignod ; Wilson2006 ; Dai ; Sato2001 ; Bernhoeft2000 ; CStock2008 ; OStockert2011 , at the Brillouin zone boundary near AF order. Because the resonance has only been found in spin-singlet unconventional superconductors near an AF instability mignod ; Wilson2006 ; Dai ; Sato2001 ; Bernhoeft2000 ; CStock2008 ; OStockert2011 , its observation in UTe2 suggests that AF spin fluctuations may also induce spin-triplet pairing Kuwabara2000 or that electron pairing in UTe2 has a spin-singlet component.
In conventional Bardeen-Cooper-Schrieffer superconductors, electron-lattice coupling binds electrons into spin-singlet pairs below without involving magnetism bcs . In most unconventional superconductors, the proximity of superconductivity to static AF ordered states suggests AF spin fluctuations as a common thread that can pair electrons into spin singlets for superconductivity scalapinormp . For spin-triplet candidate heavy-fermion superconductors such as UGe2, URhGe, and UCoGe, superconductivity arises through suppression of the static FM order or coexists with static FM order Aoki2019a . In unconventional spin-singlet superconductors, the resonance is a sharp magnetic excitation near an AF ordering wavevector in the superconducting state that peaks at a well defined energy and an intensity that tracks the superconducting order parameter Eschrig ; GYu2009 . Within the weak-coupling theory of superconductivity, the resonance is a bound state inside the particle-hole continuum gap, referred to as a spin exciton, that arises from quasiparticle excitations that connect parts of the Fermi surfaces exhibiting a sign change in the superconducting order parameter [, where is the momentum()-dependent superconducting gap and is the momentum transfer connecting the two gapped Fermi surfaces] scalapinormp ; Eschrig . In this picture, the energy of the resonance is below the sum of the energies of the superconducting gaps of the two connecting Fermi surfaces, and its wavevector dependence contains signatures of the superconducting gap symmetry scalapinormp ; Eschrig .
For uranium based heavy-fermion superconductors near a FM instability Aoki2019a , although previous INS experiments have found FM spin fluctuations, there is no evidence that these fluctuations are coupled to superconductivity Huxley2003 ; Stock2011 . Similarly, although incommensurate and FM spin fluctuations were found in the spin-triplet candidate superconductor Sr2RuO4, they do not couple to superconductivity, and therefore suggest that spin fluctuations alone are not sufficient to induce spin-triplet superconductivity Kunkem2017 ; Steffens2019 . These results are consistent with nuclear magnetic resonance (NMR) Knight shift measurements that indicate that superconductivity in Sr2RuO4 cannot arise from a pure spin-triplet pairing state Pustogow2019 . Finally, for the spin-triplet superconductor candidate UPt3 Joynt2002 , superconductivity appears to couple to very weak static AF order instead of FM spin fluctuations Aeppli1988 . Therefore, there is no experimental evidence that superconductivity is coupled with FM spin fluctuations in any of these spin-triplet candidate materials Huxley2003 ; Stock2011 ; Kunkem2017 ; Steffens2019 ; Pustogow2019 ; Joynt2002 ; Aeppli1988 .
We chose to study spin excitations in UTe2 using INS because this technique can probe both FM and AF spin fluctuations and the effect of superconductivity on these excitations [Figs. 1(a,b)] Dai . UTe2 sits at the paramagnetic end of a series of FM heavy-fermion superconductors Ran2019 ; Aoki2019 , and is believed to be a spin-triplet superconductor for the following reasons: (1) Upper critical fields that exceed the Pauli limits along all crystallographic directions Ran2019b ; Knebel2019 ; (2) Muon spin relaxation/rotation measurements of coexisting FM spin fluctuations and superconductivity Sundar2019 ; (3) Scanning tunnelling microscopy evidence of chiral-triplet topological superconductivity Jiao2020 ; (4) Exclusion of spin-singlet pairing from the 125Te Knight shifts reduction below measured by NMR Nakamine2021 ; and (5) Breaking of time reversal symmetry below from a non-zero polar Kerr effect and evidence for two superconducting transitions in the specific heat Hayes2020 . Although these reasons provide circumstantial evidence for spin-triplet superconductivity, they are not conclusive proof that superconductivity in UTe2 must be in a pure spin-triplet -wave state. For example, although time-reversal symmetry breaking is seen by a non-zero Kerr effect, it is not confirmed by muon spin relaxation/rotation measurements; however, reasons why this might not have been visible have been discussed Sundar2019 ; Hayes2020 . Moreover, interpretation of the Knight shift data from NMR measurements can be ambiguous because the NMR signal only probes within a London penetration depth of the surface and therefore may not reflect bulk behavior gannon2017 .
On the other hand, there are indications that UTe2 is near an AF instability instead of an FM order Thomas2020 ; Duan2020 . In particular, our previous INS experiments within the scattering plane of UTe2 reveal spin fluctuations at the incommensurate wavevectors () not far away from the Brillouin zone boundary Duan2020 . The magnetic scattering is centered around and dispersionless along the -direction, suggesting that spin fluctuations in UTe2 are two-dimensional in the plane [Figs. 1(c,d)]. Nevertheless, there is no evidence that they are coupled to superconductivity Duan2020 .
Experimental Data
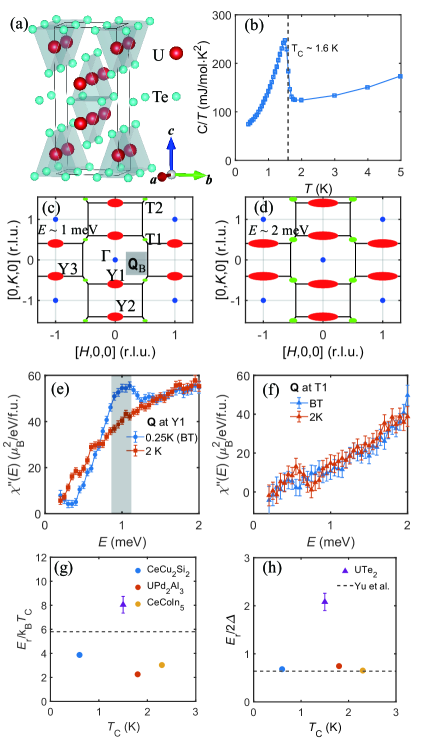
Here we use INS to map out the spin excitations in UTe2 in the plane and show that superconductivity induces a resonance near the AF wavevector at an energy (, Boltzmann’s constant) and opens a spin gap at energies below the mode, analogous to what occurs in unconventional spin-singlet superconductors mignod ; Wilson2006 ; Dai ; Sato2001 ; Bernhoeft2000 ; CStock2008 ; OStockert2011 . Figure 1(a) shows the orthorhombic unit cell of UTe2 (space group ) Ran2019 . The bulk superconductivity of our samples is confirmed by heat capacity measurements showing K [Fig. 1(b)]. Figure 1(c) shows Brillouin zones in reciprocal space within the plane, where solid red ellipses (Y1,Y2,Y3) and green dots (T1,T2) are positions of spin excitations as a function of increasing energy [Fig. 1(d)]. The blue solid dots are points and nuclear Bragg peaks are at . The energy dependence of the imaginary part of the local dynamical susceptibility near Y1, defined as within a Brillouin zone where is the excitation energy Dai , above and below reveals a clear resonance and a spin gap in the superconducting state [Fig. 1(e)]. On the other hand, near T1 shows no observable changes across [Fig. 1(f)]. Figures 1(g) and 1(h) compare the energy of the resonance mode with unconventional spin-singlet superconductors GYu2009 , indicating that the mode deviates from the current trend for these materials.
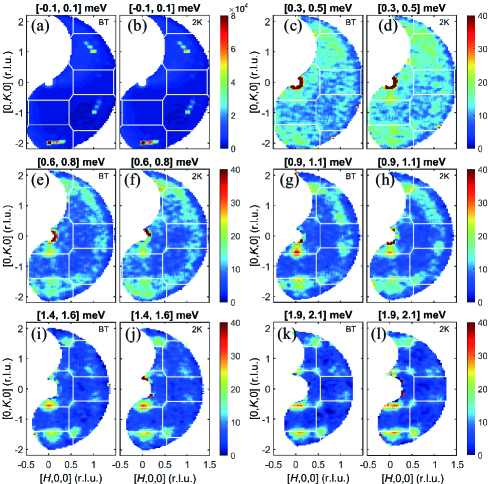
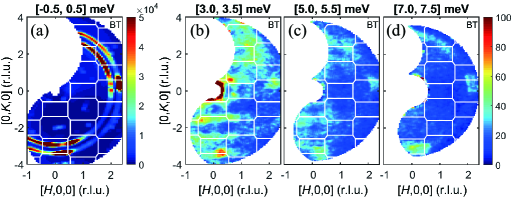
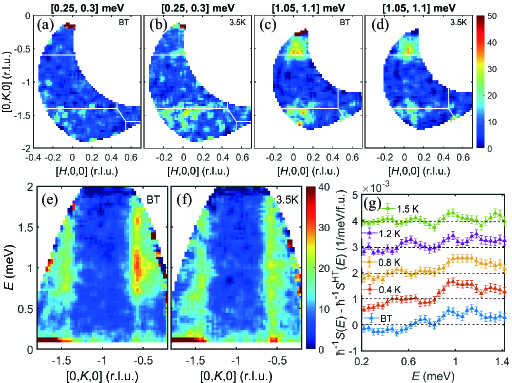
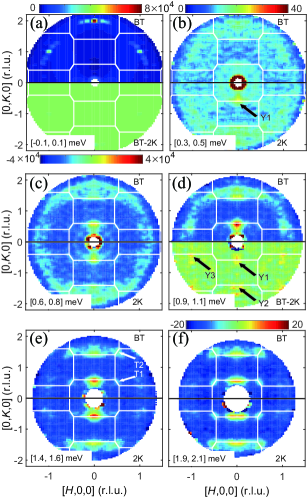
Figure 2(a-f) shows the wavevector dependence of elastic and inelastic scattering in UTe2 as a function of increasing energy at base temperature (BT K) and above ( K). In the elastic channel, we find nuclear Bragg peaks at the and positions and no evidence of magnetic order at BT [Fig. 2(a), Extended Data Fig. 4(a,b)]. On increasing energy to meV, there is clear scattering at the Brillouin zone boundary position (Y1 point) in the normal state that is suppressed at BT [Fig. 2(b)]. Upon further increasing energies to , , , meV, spin excitations are still well defined along the direction at Y points but broaden progressively along the direction [Figs. 2(c-f)]. In addition, we see clear magnetic scattering at T points of reciprocal space for energies above meV [Figs. 2(c-f)]. Although the spin excitation intensity increases below at meV for all equivalent Y points [Fig. 1(d)], they are virtually temperature independent across at Y points for energies above 1.3 meV and at T points for all energies.
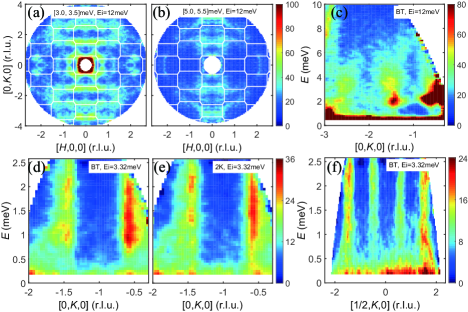
Figures 3(a) and 3(b) summarize the evolution of spin excitations for energies above meV at BT. At meV, spin excitations are still well-defined along the direction but extend to the entire Brillouin zone boundary along the direction [Fig. 3(a)]. Finally, at meV, they become weak and diffusive, but still center around the Brillouin zone boundary broadly along the direction [Fig. 3(b)]. The - map along the direction reveals clear spin excitations stemming from Y points that disappear above 7 meV [Fig. 3(c)]. The temperature dependence of the scattering along the direction across is shown in Figs. 3(d) and 3(e), where the superconductivity-induced spin gap and resonance are observed at the Y1 and Y2 points. The broad dispersive scattering from the nuclear Bragg peak is due to a temperature-independent acoustic phonon Duan2020 . Figure 3(f) shows the - map along the direction. We see clear rod-like magnetic scattering stemming from the T points in reciprocal space above meV [Fig. 3(f)], but these excitations do not respond to superconductivity (Extended Data Fig.7).
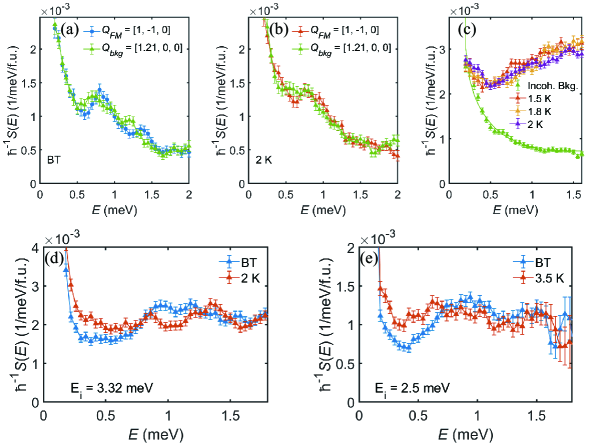
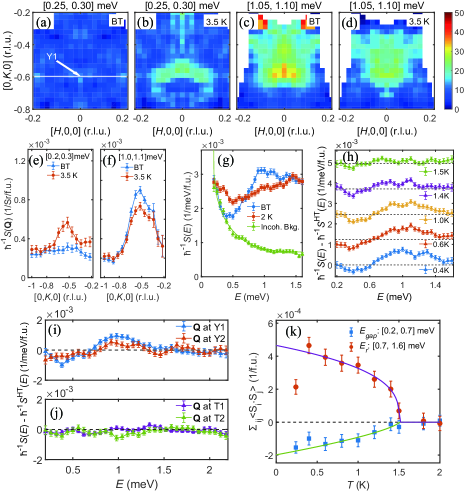
To further demonstrate that spin excitations at the Y1 position are coupled to superconductivity, we carried out high resolution measurements using an incident neutron energy of meV. The wavevector dependent scattering at meV below [Fig. 4(a)] and above [Fig. 4(b)] reveals the opening of a spin gap in the superconducting state (Extended Data Fig.6). For comparison, spin excitations at meV are clearly enhanced below at BT [Figs. 4(c,d)]. Figure 4(e) and (f) shows cuts along the direction at and meV, respectively. Although superconductivity in UTe2 induces a spin gap and a resonance, it does not change the -dependent lineshape, as seen in the resonance of CeCoIn5 Song2020 . Figure 4(g) shows energy-dependent scattering at the Y1 point together with the nuclear incoherent scattering backgrounds taken at the background wavevector position [Fig. 1(c)]. We find clear evidence of a spin gap at BT below meV and a resonance at . Figure 1(e) and 1(f) shows the temperature dependence of at the Y1 and T1 positions, respectively, in absolute units, obtained by subtracting the incoherent scattering backgrounds, correcting for the Bose population factor, and normalizing the magnetic scattering to a vanadium standard. We note that the magnitude of the magnetic scattering in UTe2 is similar to that of iron-based superconductors Dai . The temperature dependence of the spin gap and resonance is obtained by systematically subtracting the high-temperature data (the average of the and 2 K data) from those at lower temperatures [Fig. 4(h)]. At K, the temperature-difference plot shows no visible feature. On cooling further below , we find clear evidence for negative and positive scattering in the temperature-difference plots arising from the opening of a spin gap and the emergence of a resonance, similar to other unconventional spin-singlet superconductors mignod ; Wilson2006 ; Dai ; Sato2001 ; Bernhoeft2000 ; CStock2008 ; OStockert2011 . Figure 4(i) shows similar temperature difference plots between BT and 2 K obtained at Y1 and Y2 with meV, again revealing the resonance at these equivalent positions. The absence of the resonance mode at T1 and T2 is shown in the temperature difference plots of Fig. 4(j). Finally, Figure 4(k) summarizes the temperature dependence of the scattering at Y1 for energies of and meV. It is clear that the intensity gain of the resonance below occurs at the expense of opening a spin gap at energies below it.
Discussion
To summarize the INS results in Figs. 2-4, the temperature dependence of at Y1 and T1 is plotted in Figs. 1(e) and 1(f), respectively. In previous work, the energy of the resonance for unconventional spin-singlet superconductors was found to be proportional to the universal value Wilson2006 or the superconducting gap GYu2009 . The values of of spin-singlet heavy-fermion superconductors are well below the dashed line representing , whereas for UTe2 is well above the dashed line [Fig. 1(g)]. Assuming that UTe2 has a superconducting gap of meV Jiao2020 , for UTe2 is well above the expected universal dashed line of [Fig. 1(h)] GYu2009 . Because the resonance energy is believed to be a direct measure of the electron-pairing strength, arising from the spin-singlet to spin-triplet excitations for spin-singlet superconductors Eschrig , its observation in UTe2 suggests that the system might also be a spin-singlet superconductor, in contrast to previous work Ran2019 ; Aoki2019 ; Ran2019b ; Knebel2019 ; Sundar2019 ; Jiao2020 ; Nakamine2021 ; Hayes2020 . By comparing magnetic scattering intensity at the Y1, Y2, and Y3 equivalent points in reciprocal space in Figs. 2(c-f), we conclude that spin fluctuations are highly anisotropic in spin space with a large magnitude along the -axis direction, thus suggesting the presence of a large spin-orbit coupling. Three electrons of uranium in UTe2 can display a dual localized and itinerant character similar to other U-based compounds Zwicknagl2003 ; Amorese2020 , and so superconductivity can arise from some itinerant electrons, whereas magnetism comes about from other, more localized electrons. In this picture, the presence of the AF resonance in UTe2 at an energy so different from other spin-singlet superconductors could simply be a consequence of the weak coupling between itinerant and localized electrons [Figs. 1(g,h)].
Alternatively, if we assume that UTe2 is indeed a spin-triplet superconductor, our results reveal several important conclusions for the microscopic origin of spin-triplet superconductivity. First and foremost, the discovery of a resonance in UTe2 with suggests that AF spin fluctuations with large spin-orbit coupling can drive spin-triplet superconductivity, clearly different from the current understanding that FM spin fluctuations are responsible for its superconductivity Ishizuka2021 . Second, the observation of a superconductivity-induced spin gap at energies below suggests that the superconducting order parameter may have a spin-singlet component with a sign change (possibly in the state) Ishizuka2021 . Third, within a spin exciton picture of the resonance, we expect scalapinormp ; Eschrig . Because scanning tunnelling microscopy experiments reveal a superconducting gap of meV Jiao2020 , in UTe2 is much larger than found in unconventional spin-singlet superconductors [Fig. 1(h)] GYu2009 . Fourth, our experimental observation of AF spin excitations extending up to about meV in Fig. 3 suggests that the in-plane magnetic exchange coupling of UTe2 has an energy scale about ten times the superconducting pairing energy of meV, similar to copper oxide scalapinormp and iron-based superconductors Dai . A crude estimation using Figs. 1(b,e) and 3(c) suggests that the saving of magnetic exchange energy in the superconducting state in UTe2 is sufficient to account for the superconducting condensation energy determined from the heat capacity anomaly across (Extended Data Fig.2) MWang2013 . Finally, the discovery of a resonance and normal-state spin excitations in UTe2, where charged quasiparticles can also be probed by angle-resolved photoemission spectroscopy wray2020 , should open new avenues of research towards understanding the connection between spin excitations and Fermi surface topology in UTe2.
UTe2 is a multi-band/orbital system, with superconducting pairing channels classified by the point group Hayes2020 . In such multi-band/orbital superconductors, the presence of additional orbital degrees of freedom expands the pool of symmetry-allowed spin-triplet and spin-singlet pairing candidates, which, in turn, implies that quasi-degenerate pairing channels are more probable than in the typical single-band cases. As outlined in Methods, AF spin correlations of UTe2, in the probable -ground manifold Amorese2020 , allow for not only the usual spin-singlet pairing channel but also spin-triplet pairing channels. The spin-triplet pairing channels arise because the product of two ’s contains not only the spin-singlet matrix but also three spin-triplet matrices , which transform as three one-dimensional non-trivial representations. Therefore, spin-triplet pairing states are allowed by the AF correlations in the manifold of U doublets. Furthermore, in the presence of AF correlations and when the spin-orbit coupling induces strong Ising anisotropy, as is the case for UTe2 Ran2019 , the spin-triplet channel can become energetically competitive.
References
- (1) Bardeen, J., Cooper, L. N., & Schrieffer, J. R. Theory of Superconductivity. Phys. Rev. 108, 1175-1204 (1957).
- (2) Scalapino, D. J. A common thread: the pairing interaction for unconventional superconductors. Rev. Mod. Phys. 84, 1383-1417 (2012).
- (3) Mackenzie, A. P. & Maeno, Y. The superconductivity of Sr2RuO4 and the physics of spin triplet pairing. Rev. Mod. Phys. 75, 657-712 (2003).
- (4) Sato, M. & Ando, Y. Topological superconductors: a review. Rep. Prog. Phys. 80, 076501 (2017).
- (5) Kitaev, A. Y. Unpaired Majorana fermions in quantum wires. Phys. Usp. 44, 131-136 (2001).
- (6) Aoki, D., Ishida, K. & Flouquet, J. Review of U-based ferromagnetic superconductors: comparison between UGe2, URhGe, and UCoGe. J. Phys. Soc. Jpn. 88, 022001 (2019).
- (7) Ran, S. et al. Nearly ferromagnetic spin-triplet superconductivity. Science 365, 684-687 (2019).
- (8) Aoki, D. et al. Unconventional superconductivity in heavy fermion UTe2. J. Phys. Soc. Jpn. 88, 043702 (2019).
- (9) Ran, S. et al. Extreme magnetic field-boosted superconductivity. Nat. Phys. 15, 1250-1254 (2019).
- (10) Knebel, G. et al. Field-reentrant superconductivity close to a metamagnetic transition in the heavy-fermion superconductor UTe2. J. Phys. Soc. Jpn. 88, 063707 (2019).
- (11) Sundar, S. et al. Coexistence of ferromagnetic fluctuations and superconductivity in the actinide superconductor UTe2. Phys. Rev. B 100, 140502 (2019).
- (12) Jiao, L. et al. Chiral superconductivity in heavy-fermion metal UTe2. Nature 579, 523-527 (2020).
- (13) Nakamine, G. et al. Anisotropic response of spin susceptibility in the superconducting state of UTe2 probed with 125Te-NMR measurement. Phys. Rev. B 103, L100503 (2021).
- (14) Hayes, I. M. et al. Weyl Superconductivity in UTe2. Science 373, 797 (2021).
- (15) Thomas, S. M. et al. Evidence for a pressure-induced antiferromagnetic quantum critical point in intermediate-valence UTe2. Science Advances 6, eabc8709 (2020).
- (16) Duan, C. et al. Incommensurate Spin Fluctuations in the Spin-Triplet Superconductor Candidate UTe2. Phys. Rev. Lett. 125, 237003 (2020).
- (17) Rossat-Mignod, J. et al. Neutron scattering study of the YBa2Cu3O6+x system. Physica C 185, 86-92 (1991).
- (18) Wilson, S. D. et al. Resonance in the electron-doped high-transition temperature superconductor Pr0.88LaCe0.12CuO4-δ. Nature 442, 59-62 (2006).
- (19) Dai, P. C. Antiferromagnetic order and spin dynamics in iron-based superconductors, Rev. Mod. Phys. 87, 855-896 (2015).
- (20) Sato, N. K. et al. Strong coupling between local moments and superconducting ’heavy’ electrons in UPd2Al3. Nature 410, 340-343 (2001).
- (21) Bernhoeft, N. Superconductor order parameter symmetry in UPd2Al3. Eur. Phys. J. B 13, 685-694 (2000).
- (22) Stock, C., Broholm, C., Hudis, J., Kang, H. J., and Petrovic, C., Spin Resonance in the -Wave Superconductor CeCoIn5. Phys. Rev. Lett. 100, 087001 (2008).
- (23) Stockert, O. et al., Magnetically driven superconductivity in CeCu2Si2. Nat. Phys. 7, 119-124 (2011).
- (24) Kuwabara, T. & Ogata, M. Spin-Triplet Superconductivity due to Antiferromagnetic Spin-Fluctuation in Sr2RuO4. Phys. Rev. Lett. 85, 4586-4589 (2000).
- (25) M. Eschrig, The effect of collective spin-1 excitations on electronic spectra in high- superconductors, Adv. Phys. 55, 47-183 (2006).
- (26) Yu, G., Li, Y., Motoyama, E. M., and Greven, M., A universal relationship between magnetic resonance and superconducting gap in unconventional superconductors. Nat. Phys. 5, 873-875 (2009).
- (27) Huxley, A. D., Raymond, S., & Ressouche, E. Magnetic Excitations in the Ferromagentic Superconductor UGe2. Phys. Rev. Lett. 91, 207201 (2003).
- (28) Stock, C. et al. Anisotropic Critical Magnetic Fluctuations in the Ferromagnetic Superconductor UCoGe. Phys. Rev. Lett. 107, 187202 (2011).
- (29) Kunkemller, S. et al. Absence of a Large Superconductivity-Induced Gap in Magnetic Fluctuations of Sr2RuO4. Phys. Rev. Lett. 118, 147002 (2017).
- (30) Steffens, P. et al. Spin Fluctuations in Sr2RuO4 from Polarized Neutron Scattering: Implications for Superconductivity. Phys. Rev. Lett. 122, 047004 (2019).
- (31) Pustogow, A. et al. Constraints on the superconducting order parameter in Sr2RuO4 from oxygen-17 nuclear magnetic resonance. Nature 574, 72-75 (2019).
- (32) Joynt, R. & Taillefer, L. The superconducting phases of UPt3. Rev. Mod. Phys. 74, 235-294 (2002).
- (33) Aeppli, G. et al. Magnetic order and fluctuations in superconducting UPt3. Phys. Rev. Lett. 60, 615-618 (1988).
- (34) Gannon, W. J. et al. Spin susceptibility of the topological superconductor UPt3 from polarized neutron diffraction. Phys. Rev. B 96, 041111(R) (2017).
- (35) Song, Y. et al. Nature of the spin resonance mode in CeCoIn5. Communications Physics 3, 98 (2020).
- (36) Zwicknagl, G. & Fulde, P. The dual nature of electrons and the origin of heavy fermions in U compounds. J. Phys. Condens. Matter 15, S1911-S1916 (2003).
- (37) Fujimori, S. et al. Core-Level photoelectron spectroscopy study of UTe2. J. Phys. Soc. Jpn. 90, 015002 (2021).
- (38) Ishizuka, J. & Yanase, Y. Periodic Anderson model for magnetism and superconductivity in UTe2. Phys. Rev. B 103, 094504 (2021).
- (39) Wang, M. et al. Doping dependence of spin excitations and its correlations with high-temperature superconductivity in iron pnictides, Nat. Commun. 4, 2874 (2013).
- (40) Miao, L. et al. Low Energy Band Structure and Symmetries of UTe2 from Angle-Resolved Photoemission Spectroscopy. Phys. Rev. Lett. 124, 076401 (2020).
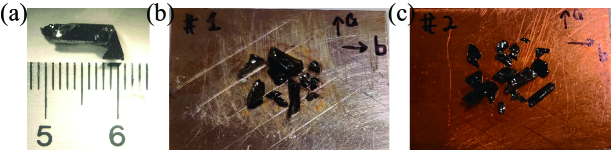
Methods Single crystal growth Single crystals of UTe2 were produced using an iodine vapor transport method similar to that described earlier Ran2019 . U (99.98% purity) and Te (99.99% purity) were combined in the ratio and sealed with iodine (3 mg/cm3, 99.999% purity) in an evacuated quartz tube with a length of 10 cm and an inner diameter of 1.4 cm. The tubes were placed in a single zone furnace with the hot end (furnace center) held at 1060∘C for four weeks. The natural temperature gradient of the furnace was adequate to promote vapor transport and to produce large single crystal specimens of the type shown in Extended Data Fig.1(a). After the heating cycle, samples were naturally cooled to room temperature, removed from the quartz tube, and rinsed in ethanol. Samples were subsequently stored under vacuum in sealed quartz ampoules.
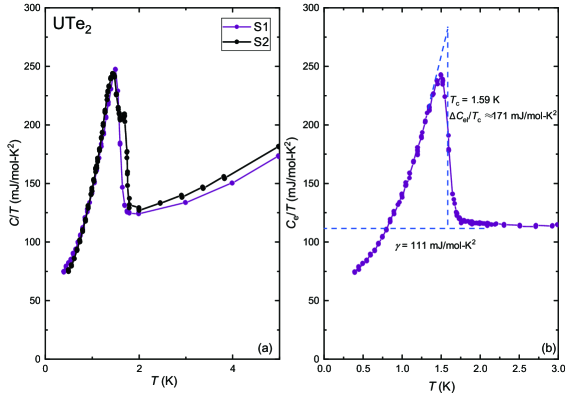
Heat capacity measurements The temperature dependent heat capacity divided by temperature for two samples is shown in Extended Data Fig.2(a). Similar to earlier reports, there is a second order phase transition near K, which marks the onset of superconductivity. All samples measured from these growth experiments show this feature but, as previously reported, some show a single transition whereas others exhibit a double transition Hayes2020 . At higher temperatures, the data follow a Fermi liquid temperature dependence , where mJ/mol-K2, consistent with earlier reports Ran2019 ; Aoki2019 . We also find that the quantity , when it is determined using an equal entropy construction [Extended Data Fig.2(b)]. In order to estimate the superconducting condensation energy, we consider the expression where is the density of states at the Fermi energy and is determined from the expression and relates the BCS superconducting energy gap to the transition temperature. From this, we estimate mJ/mol, which is consistent with trends that are seen for other strongly correlated uranium based superconductors Kim2015 (41).
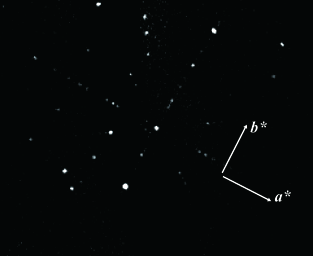
Neutron Scattering INS measurements on UTe2 were carried out using the Cold Neutron Chopper Spectrometer (CNCS) at Oak Ridge National Laboratory Ehlers2011 (42). The momentum transfer in three-dimensional reciprocal space is defined as = , where and are Miller indices and , , with = 4.16 Å, = 6.12 Å and = 13.95 Å of the orthorhombic lattice Ran2019 . The crystals are naturally cleaved along the -plane and form small flakes about 0.5-1 mm thick and up to 1 cm long. We co-aligned 27 pieces (total mass 0.9-g) of single crystals on oxygen-free Cu-plates using an X-ray Laue machine to check the orientation of each single crystal [Extended Data Fig.1(b,c) and 3]. The crystal assembly is aligned in the scattering plane as shown in Figs. 1(c,d) and mounted on a 3He-insert installed in the standard cryostat. The lowest temperature can be reached in this setup is BT K. INS data were collected with incident neutron energies set to and 2.5 meV in the Horace mode as specified in the Figure captions RAEwings (43). The sample co-alignment resulted in three assembled peaks at each Bragg positions with a 6-degree spread, as shown in Extended Data Fig.4(a,b). The strongest peak of the three contributes over 70% of the total Bragg peak intensity. The coordinates used for data analysis was based on the position of the strongest peak. The symmetrized constant energy cuts shown in Figs. 2 (a-f), Figs. 3 (a,b), and Figs. 4(a-d) are results of two reflection operations against the horizontal and vertical axes according to the space group , which do not change the positions of the strongest assembled peaks but create copies of the two smaller peaks on the opposite side. The symmetrized data were only used for constant energy cuts. All the one dimensional data shown in the main text and the SI are taken from the unsymmetrized raw data. Extended Data Figures 4, 5, and 6 show raw data obtained with , 12, and 2.5 meV, respectively, at different temperatures. Extended Data Fig.7 shows cuts around FM Bragg peak and background positions at BT and 2 K, indicating no evidence of FM spin fluctuations in UTe2 within our measurement sensitivity. We also checked possible existence of quasielastic magnetic scattering, as seen in AF ordered UPd2Al3 Bernhoeft2000 , and find no evidence in UTe2 consistent with no static magnetic order in the system. The high-flux instrument mode was used to maximize the neutron intensity with the Fermi chopper and double-disk chopper frequency at 60 Hz and 300 Hz, respectively. The neutron scattering data are normalized to absolute units using a vanadium standard, which has an accuracy of approximately 30%.
Theory In UTe2, as is typical of -electron materials, the U atomic states are split by strong spin-orbit-coupling and crystal-field effects into multiplets which transform according to the double-valued irreducible representations of the point-group. We will construct microscopic Cooper pairing candidates of well-defined symmetry from products of momentum-dependent form-factors such as -waves and matrices defined in the relevant multiplet space Nica_Si (44). The pairing matrices, which are obtained from the decomposition of the products of two multiplets, also transform as irreducible representations of the point group. This classification naturally restricts the number of symmetry-allowed pairing states by incorporating the spin-orbit-coupling and crystal-field splitting for the U levels. Furthermore, by taking into account the relevant atomic structure of the paired electrons, pairing candidates constructed from our microscopic procedure go beyond the more common Landau-Ginzburg analysis, which relies only on a symmetry classification without reference to the pairing matrix structure. Our approach also provides a natural link to the topology of the superconducting state.
In this approach, the matrix structure in orbital/spin space Nica_Yu_Si (45), or similarly in multiplet space with strong spin-orbit-coupling, provides the key to advancing new pairing states. To set the stage, we recall the approach in the previously studied case Nica_Si (44) of the prototypical heavy-fermion unconventional superconductor CeCu2Si2. In that compound, various probes Nica_Si (44) point toward a ground-state Kramers doublet of the point group which emerges from the Ce -electron via spin-orbit-coupling and crystal-field splitting. Ref. Nica_Si (44) showed that the matrix corresponding to spin-singlet pairing between two electrons transforms as the identity () irreducible representation of , which is featureless in the sense that it can be classified entirely via the symmetry of its form factor. However, the same procedure also predicted that, when paired instead with conduction electrons originating from the Cu electron states, the -electron multiplets give rise to a spin-singlet matrix that transforms as a irreducible representation; it changes signs under rotations and thus transforms non-trivially. In CeCu2Si2, this pairing matrix, together with a featureless -wave form factor, is equivalent to an unconventional pairing state consisting of intra- and inter-band -wave components Nica_Yu_Si (45), reflecting the sign-changing nature of the irreducible representation. The pairing leads to a fully gapped Bogoliubov-de Gennes spectrum at lower temperatures. This matrix pairing state proved successful in accounting for the spin resonance observed in CeCu2Si2 in inelastic neutron-scattering, as well as in fitting the experimental data on London penetration-depth and specific-heat measurements that encode a hard gap in the low-energy BdG spectrum Pang (46). A small but nonzero admixture of electrons in the ground-state, as indicated by soft x-ray absorption spectroscopy Amorese_PRB_2020 (47), provides evidence for the degrees of freedom that underlie the proposed pairing.
Although less is known about the -electron levels of UTe2 at this stage, we can still construct and classify symmetry-constrained pairing channels for this compound using the same microscopic framework. A number of available ab initio studies Duan2020 ; Shick2019 (48, 49) point toward a predominant U doublet at low energies. These results are consistent with data from core-level photoelectron spectroscopy Amorese2020 . They are also compatible with the spin size extracted in this work: By assuming that the spin excitation spectral weight determined from the meV data goes up linearly as a function of up to meV (the band top, which is determined by high data), we estimate the momentum- and energy-integrated spin spectral weight to be /U that, for close to , is compatible with a spin size . The double-valued irreducible representations of only allow for Kramers doublets Koster (50). It is then natural to identify a doublet with the U states.
We can then proceed along the lines set out in Ref. Nica_Si, 44, and determine the possible pairing matrices via a decomposition of the product of two doublets. The products decompose as follows Koster (50): . (Note that the parity of the ’s is not specified, but it does not affect the decomposition.) In the above decomposition, the first term corresponds to a spin-singlet matrix, which transforms according to the identity representation. This component captures the standard result, viz. AF correlations promote spin-singlet pairing.
What our procedure also reveals is a striking new result: The decomposition also includes three spin-triplet matrices. The latter transform according to three one-dimensional, non-trivial representations. We achieve our key results: AF correlations within the ground-state manifold of U can also lead to spin-triplet superconducting pairing. We re-iterate that, in arriving at this conclusion, it is crucial to account for the matrix structure of the pairing state.
We next turn to the energetics of the pairing states. A systematic study requires the knowledge of the both the tight-binding parametrization of the noninteracting bands and the effective interaction parameters among the multiplets. When such parameters are known, we can determine and compare the ground-state energies of the different pairing channels, in the same way as used to show that the band-mixing (matrix spin-singlet) pairing state is energetically competitive Nica_Si (44, 45). Given that the model parameters are not yet available, we resort to more general means to assess the stability of the spin-triplet pairing. A key feature is that the spin-orbit-coupling of UTe2 is such that the magnetic response is strongly Ising anisotropic Ran2019 . For antiferromagnetically correlated systems that are highly Ising anisotropic, the spin-triplet channel can be energetically competitive, as captured in the microscopic calculations of pairing correlations in well-defined Kondo systems Pixley_2015 (51) and recently discussed in the context of superconductivity observed near a magnetic-field-induced heavy-fermion quantum critical point Nguyen2021 (52).
References
- (1) Kim, J. S., Tam, G. N., & Stewart, G. R. Universal scaling law for the condensation energy across a broad range of superconductor classes. Phys. Rev. B 92, 224509 (2015).
- (2) Ehlers, G., Podlesnyak, A. A., Niedziela, J. L., Iverson, E. B., & Sokol, P. E. The New Cold Neutron Chopper Spectrometer at the Spallation Neutron Source: Design and Performance, Rev. Sci. Instrum. 82, 085108 (2011).
- (3) Ewings, R. A. et al. Horace: Software for the analysis of data from single crystal spectroscopy experiments at time-of-flight neutron instruments. Nuclear Instruments and Methods in Physics Research A 834, 132-142 (2016).
- (4) Nica, E. N. & Si, Q. Multiorbital singlet pairing and superconductivity, npj Quantum Materials 6, 2 (2021).
- (5) Nica, E. M., Yu, R., & Si, Q. Orbital-selective pairing and superconductivity in iron selenides, npj Quantum Materials 2, 24 (2017).
- (6) Pang, G. M. et al. Fully gapped -wave superconductivity in CeCu2Si2, PNAS 115, 5343-5347 (2018).
- (7) Amorese, A. et al. Possible multiorbital ground state in CeCu2Si2. Phys. Rev. B 102, 245146 (2020).
- (8) Shick, A. B. & Pickett, W. E. Spin-orbit coupling induced degeneracy in the anisotropic unconventional superconductor UTe2. Phys. Rev. B 100, 134502 (2019).
- (9) Shick, A. B., Fujimori, S. & Pickett, W. E. UTe2: A nearly insulating half-filled heavy-fermion metal. Phys. Rev. B 103, 125136 (2021).
- (10) Koster, G. F. Properties of the thirty-two point groups. (Cambridge, Mass., M.I.T. Press, 1963).
- (11) Pixley, J. H., Deng, L. L., Ingersent, K., & Si, Q. Pairing correlations near a Kondo-destruction quantum critical point. Phys. Rev. B 91, 201109(R) (2015).
- (12) Nguyen, D. H. et al. Superconductivity in an extreme strange metal. Nat. Commun. 12, 4341 (2021).
Data availability The data that support the plots within this paper and other findings of this study are available from the corresponding authors upon reasonable request.
Acknowledgements P.D. thanks Doug Natelson, W. P. Halperin, Nick Butch, and Johnpierre Paglione for helpful discussions. E. M. N. and Q. Si acknowledge useful discussions with H. Hu, S. Paschen, and J.-X. Zhu. The INS work at Rice is supported by the U.S. DOE, BES under grant no. DE-SC0012311 (P.D.). Part of the material characterization efforts at Rice is supported by the Robert A. Welch Foundation Grant Nos. C-1839 (P.D.). Work performed by R.E.B. at the National High Magnetic Field Laboratory was supported by National Science Foundation Cooperative Agreement No. DMR-1644779 and the State of Florida. Synthesis of crystalline materials and measurements by R.E.B. were supported by the Center for Actinide Science and Technology (CAST), an Energy Frontier Research Center (EFRC) funded by the U.S. DOE, BES, under grant no. DE-SC0016568. Research at UC San Diego was supported by the U.S. DOE, BES under grant no. DEFG02-04-ER46105 (single crystal growth) and U.S. NSF under Grant No. DMR-1810310 (characterization of physical properties). The theory work at Rice has primarily been supported by the U.S. DOE, BES under Award No. DE-SC0018197, with travel support provided by the Robert A. Welch Foundation Grant No. C-1411. Q.S. acknowledges the hospitality of the Aspen Center for Physics, which is supported by the NSF grant No. PHY-1607611. E.M.N. was supported by ASU startup grant. A portion of this research used resources at the Spallation Neutron Source, a DOE Office of Science User Facility operated by ORNL.
Author contributions P.D. and M.B.M. conceived the project. R.E.B. grew the single crystals and made specific heat measurements on the crystals. The single crystals of UTe2 were aligned using Laue x-ray diffraction by C.D., Y.D., C.M. and A.J.B. and characterized by means of powder x-ray diffraction by C.M., A.J.B. and Y.D. at UCSD. The INS experiments were carried out by A.P. in remote discussion with C.D. and P.D.. The data analysis was carried out by C.D. and P.D.. E.M.N. and Q.S. contributed to the theoretical idea that AF spin fluctuations may facilitate spin-triplet superconductivity. The paper was written by P.D., C.D., R.E.B., E.M.N, and Q.Si. all coauthors made comments on the paper.
Competing interests The authors declare no competing interests.
Additional information Correspondence and requests for materials should be addressed to P.D.
Extended Data