capbtabboxtable[][\FBwidth]
A network and machine learning approach to detect Value Added Tax fraud
Abstract
Value Added Tax (VAT) fraud erodes public revenue and puts legitimate businesses at a disadvantaged position thereby impacting inequality. Identifying and combating VAT fraud before it occurs is therefore important for welfare. This paper proposes flexible machine learning algorithms which detect fraudulent transactions, utilising the information provided by the complex VAT network structure of a large dimension. VAT fraud detection is implemented through a combination of a suitably constructed Laplacian matrix with classification algorithms that rely on scalable machine learning techniques. The method is implemented on the universe of Bulgarian VAT data and detects around 50 percent of the VAT fraud, outperforming well-known techniques that ignore the information provided by the network of VAT transactions. Importantly, the proposed methods are automated, and can be implemented following the taxpayers’ submission of their VAT returns. This allows tax revenue authorities to prevent large losses of tax revenues through performing early identification of fraud between business-to-business transactions within the VAT system.
Keywords: Fraud detection, Heterogeneous data sources, Big data, Machine learning, Networks
JEL Codes: H26, C49, C55, C63, C80, D85.
1 Introduction
The collection and analysis of network data plays a key role in a wide range of fields. Examples include, but are not limited to, applications in biology, computer science, sociology and economics (Newman, 2012; Kolaczyk and Csárdi, 2014). An important question, which network data and techniques can address more efficiently than traditional approaches, is the identification of anomalies in large and complicated systems such as credit card and business-to-business (B2B) transactions, health insurance claim errors, computer security, biological and genetic data sets; see, for example, Akoglu et al. (2015) for a survey.
Network anomaly detection is typically a big data problem and its complex structure requires the employment of advanced data analytical methods. The objective of the paper is to develop fraud detection algorithms for Value Added Tax (VAT), a tax base which constitutes a major source of revenue for over countries but also one that it suffers from significant fraud.111For the rise of VAT, and what has shaped its adoption, see Keen and Lockwood (2010).
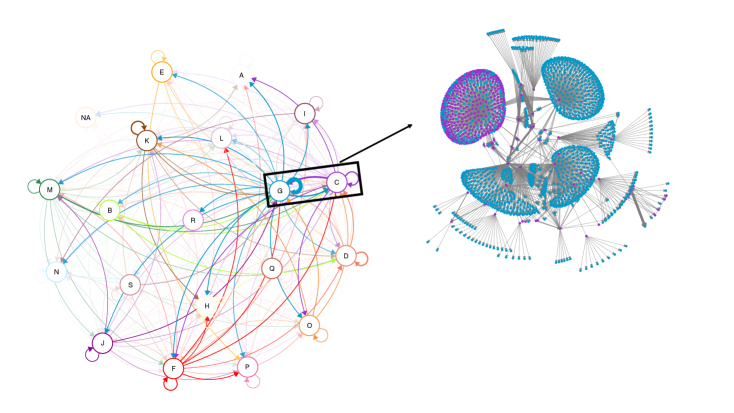
VAT is a consumption tax in the sense that the VAT collected through the supply chain is the VAT paid by the consumers when the good is consumed. Underlying VAT there is an ‘invoice-credit’ mechanism where the net tax liability of a business222Throughout trader, business, taxpayer are used interchangeably. A requirement for them to claim VAT is that they are registered for VAT with the revenue authority. is calculated by subtracting from the sales the aggregate value of VAT paid on invoices for the inputs used in production. The invoice-credit mechanism requires sellers along the production chain to provide invoices to their buyers showing the amount of VAT that was paid on a given transaction. Any fractional revenue collection on the value added that is generated at every stage of the production chain is required to be remitted to the revenue authority. The B2B transactions, and the VAT invoice-credit mechanism, create a network through which businesses are interacting within and across production sectors and over the supply chain.333Figure 1 presents a real VAT network and Figure 2 provides an illustration of the invoice-credit mechanism. We return to this shortly below and within the issue of how fraud may materialize within a VAT network.
Despite its significant rise as a tax innovation, it is universally recognised, by both policymakers and academics alike, that the current VAT system has both weaknesses and vulnerabilities; see for example Ebrill et al. (2001) and Keen and Smith (2006) for a detailed discussion. Like any tax, VAT is vulnerable to fraud through the invoice-credit mechanism which is embedded in the tax system and offers opportunities for abuse, to the extend that it has become a major concern in many countries across the globe.444Including the European Union (EU), and its Member States, as well as Africa. Even though significant steps have been taken to take measures that reduce VAT fraud, still fraud persists and is significant. In the EU, for example, the European Commission in 2016 published a communication with an action plan on VAT, setting out the pathway to the creation of a single EU VAT area, recognising that ‘[t]he current VAT system, which was intended to be a transitional system, is fragmented, complex for the growing number of businesses operating cross-border and leaves the door open to fraud…’, p. 3, COM(2016). In addition, combating VAT fraud was identified as a priority for the EU for the period 2018-2021 in its fight against organised crime. One of the measures adopted by the EU has been the establishment of the European Public Prosecutor’s Office which started operating in 2021 and whose task is to provide criminal law protection of the EU’s financial interests. For Africa, it is estimated that while consumption taxes on goods and services account for around 51.9 percent of total tax revenue, VAT alone accounts for close to 30 percent, OECD et al. (2022). In addition to distorting market competition, VAT fraud leads to significant compliance costs for legitimate VAT registered traders who are required to exercise due diligence in ensuring the legitimacy of their suppliers. There is also the risk of even face bankruptcy as a result of fraudulent actions committed by others. Consumers are of course not insulated from VAT fraud either, as this might conceivably result in higher VAT gap and therefore higher VAT rates to compensate for lost tax revenue.
There is a growing awareness that fighting VAT fraud effectively requires that tax administrations be on par with fraudsters.555There is also the issue of better technology utilization. Recently, there have been proposals, for example, for split-payment, also known as VAT withholding, which splits each (electronic) payment into a taxable amount that goes to the seller, and a VAT amount. See Ainsworth and Madzharova (2012) for a discussion on this. An interesting issue that has been recently discussed in the literature is the understanding of VAT evasion and the enforcement properties of VAT. This is an important issue for devising efficient tax structures (see, for example, Pomeranz (2015), Shah (2021), and Waseem (2023)). Notably, degl’Innocenti and Rablen (2020) emphasize the important of network centrality of taxpayers in networks for efficient tax auditing. This paper also relates to this strand of research. In fact, tax administrations across the world rely heavily on data analytics techniques to identify non-compliance and support their collection and recovery strategy.666To be more precise, they rely on risk management by ‘…systematically weighing and grouping risks and risky taxpayers in relative order, to identify their frequency, likelihood and potential consequences….’ (FISCALIS (2010), p. 31 and 110). This is in line with the compliance risk management process that delivers the systematic identification, assessment, ranking and treatment of tax compliance risk, OECD (2004). And this is the main contribution of this paper. More specifically, the objective of this paper is to develop suitably flexible fraud detection methods by constructing machine learning algorithms that utilise efficiently the large amount of information provided by the network structure of B2B transactions. Fraud detection in the VAT network is a challenging problem since the observed networks of B2B transactions are typically of high dimension and heterogeneous. Moreover, since VAT fraud is a group activity—involving multiple traders hiding behind legitimate-like businesses—identifying a single business is not sufficient for its prevention.
To deal with these challenges we develop scalable algorithms by combining machine learning techniques (extreme gradient boosting (Chen and Guestrin, 2016)) which are well-known to perform efficient classification with spectral clustering methods (Chaudhuri et al., 2012; Binkiewicz et al., 2017) that analyze the community structure of observed networks of B2B transactions. We thus build classification algorithms informed by the community structure of the observed networks and we estimate fraud probabilities for each VAT registered business. The developed fraud methodology is tested on the universe of the Bulgarian administrative data, which include output/input VAT, sales transactions across all businesses and sectors, and businesses’ individual characteristics. for the years and . Importantly, the methods developed have broader applicability, and can be applied to any fraud detection problem where network information is available.
1.1 The VAT network
The VAT system relates to a network of transactions. To see this denote the value of sector ’s inputs purchased from sector relative to the total sales of sector . A large implies that is an important contributor to . By employing the observed , a (weighted) network can be represented through its adjacency matrix where
| (1) |
The set is the edge set of the network that is, , is the set of the vertices or nodes of the network, and is the total number of nodes. The pair denotes the weighted777 is an unweighted network if network that corresponds to the adjacency matrix . If is symmetric, and so , then is called undirected otherwise whereas if is not symmetric then is called directed.
Figure 1 plots two (real) weighted and directed networks based on the data the approach developed utilizes. The network on the left-hand-side is the network of VAT amounts corresponding to transaction in sales, aggregated at the sectoral level, in Bulgaria. The network on the right-hand-side zooms into the sectoral network, and particular into a network across two sectors, C (manufacturing) and G (wholesale and retail trade; repair of motor vehicles and motorcycles). Each node corresponds to a trader and an edge between a pair of nodes indicates the existence of VAT corresponding to B2B transaction between that pair, whereas the width of the edge is proportional to the total volume of VAT in a given period of time. The complete set of networks emerging from the (observable) population-scale VAT data is heterogeneous and, of course, significantly large, consisting of hundreds of thousands of nodes.
1.2 Fraud in the network
There are many forms of VAT fraud, from fictitious trading of invoices to carousel or, more formally, the missing trader intra-community (MTIC) fraud. Two of the key characteristics of VAT fraud are the following: (i) it requires the interaction of multiple B2B traders and thus corresponds to a communal behaviour of interactions in a group of nodes, and (ii) the B2B transactions are not all real but some are fictitious. Figure 2 illustrates the MTIC fraud in its simplest form. The scheme has four ‘types’ of firms: The ‘Conduit’ (a trader that partakes in a transaction that is connected with the fraudulent evasion of VAT), the ‘MT’ (a firm that will go missing without remitting to the revenue authority any VAT collected), the ‘Buffer’ (firms that could be part of the fraud fulfilling the role of concealing the identity of the MT) and the ‘Broker’ the firm that has orchestrated the fraud.
The fraud involves the MT importing goods of value888The numbers are indicative and for illustration purposes. In a VAT fraud the value of goods going through the chain of transactions is typically in the millions of $. All these transactions are of course legal—in the sense of satisfying the legal requirements set in the VAT law—but they might be paper transactions in the sense that they may involve no physical movement of goods and services. In the example when a Buffer ‘pays’ VAT, when acquire goods, should be understood in this light. $100 and, since imports are zero-rated, collecting $20 in VAT from Buffer A. Since MT has paid no VAT on the acquired goods, the $20 in VAT collected must be paid to the revenue authority. Buffer A then sells to Buffer B the goods at $105 collecting also $21 in VAT. Buffer A, having paid $20 in VAT on the goods purchased from MT, must then subtract this amount from the $21 in VAT collected from Buffer B, therefore paying $1 to the revenue authority. The ‘invoice-refund’ mechanism continues through Buffers B and C. In the final stage of the transaction, the Broker, having purchased the goods from Buffer C and paid 20% VAT on their value (and so $24), then reexports the goods to the Conduit firm. As the goods are exported, the Broker can claim a refund of the VAT paid on the purchases, even though output VAT has not yet been collected by the revenue authority. The MT who sold the goods by charging with VAT the buyer (Buffer A) will disappear from the market to avoid remitting back the $20 in VAT collected to the government.999One can imagine this process continuing in a ‘carousel’ fashion and with the goods being re-exported and re-imported with refund claims being accumulated until the fraud is discovered. The ‘invoice-refund’ mechanism is a structural element of VAT that has been eloquently described as VAT’s Achilles heel (Keen and Smith, 2006).
Even though the example described in the processing paragraph is illustrative, it does reveal the degree of complication behind VAT fraud, which also often involves a very large number of firms operating across many sectors and countries engaging in sophisticated transactions with an attempt to confound any fraud detection attempts.101010For the network graph of a real MTIC fraud scheme identified recently in Bulgaria see Appendix A. MTIC fraud schemes, for example, involve organized criminals, missing or defaulting traders, buffer traders, broker traders, contra-traders end-customers (for acquisition fraud), freight forwarders and warehousing traders. It is thus clear that VAT fraud is a community activity not implemented simply by a single actor. Notice also that VAT fraud is not unique to cross-border B2B transactions but arises within the domestic VAT network too. The analysis and the method developed in this paper captures all elements of VAT network fraud.
The objective of this paper is twofold: First, to develop methodologies that detect taxpayers who are likely to be suspected of VAT fraud by taking into account the similarity of their transactions, and, secondly, to identify communities of taxpayers that their pattern of transactions matches those followed by traders that participate in VAT fraud. To address these issues, this paper utilises tools from the network science to conduct fraud detection informed by the community structure of the VAT fraud; the method developed in this paper takes into account the characteristic (i) discussed above and is robust with respect to characteristic (ii). As such it has an advantage over existing methods which ignore the VAT network interactions and extract only local characteristics such as the nodes degree and strength and/or the number of triangles.
More specifically, the methodological approach integrates the universe of observed B2B transactions as a network—by observing the transactions between VAT registered businesses in nodes and 111111An edge between any pair of nodes exists if the corresponding businesses have made at least one transaction recorded in their latest VAT returns.—into fraud detection techniques which rely on scalable network analytics which utilize both the connectivity structure of the constructed networks and available node-specific information. The information obtained from the network of transactions is projected into suitably constructed low-dimensional vectors which preserve the network structure properties which is then utilized within machine learning methods to determine aberrant edges, nodes and sub-networks.
The remaining of this section reviews the existing work on the problem of anomaly/fraud detection, and places our contribution within the broader literature.
1.3 Related work
The possibility of automating the detection of VAT fraud is part of a larger current international research theme seeking to utilize large scale data sets to improve tax (and social) policy (Baesens et al., 2003; Lazer et al., 2009; Athey, 2017; Lazer et al., 2020) as well as to provide a better understanding of human interactions (Jackson and Wolinsky, 1996; Margetts and Dorobantu, 2019). Early contributions to the problem of tax evasion detection, such as VAT fraud, have been made by Gupta and Nagadevara (2007) and Basta et al. (2009), where traditional statistical methods such as logistic regression and discriminant function analysis have been adopted to detect VAT evasion. Other contributions (Wu et al., 2012; González and Velásquez, 2013) have utilised data mining methods, such as clustering and decision trees, to achieve the same aim. Within this context, classification methods have been combined with dimensionality reduction techniques and, particularly, principal component analysis and singular value decomposition (Matos et al., 2015). Finally, machine learning methods have been applied to the tax fraud detection problem by Cecchini et al. (2010), Kleanthous and Chatzis (2020), Vanhoeyveld et al. (2020), Gao et al. (2021), and Savić et al. (2022).
What distinguishes VAT fraud with any other tax fraud is that VAT fraud—by the very nature of the mechanism underlying the VAT system—is typically not conducted by a single business but is a group or community activity. This necessitates that a model of detection requires the incorporation of the network structure, an element that is key to the present contribution. The last decade techniques related to anomalous detection in networks have been considered to discover fraud. In particular, Chiu et al. (2011) and Subelj et al. (2011) deal with online auction fraud and insurance fraud respectively by using social network analysis whereas Van Vlasselaer et al. (2017) utilise network information to detect fraud in social security systems. Closer to the focus of this contribution are contributions which aim to detect anomalies (not specifically fraud) in networks by using the graph embedding approach mapping a network on a vector space which preserves the network structure properties; see for example Cai et al. (2018) and Xu (2021) for recent reviews on the existing graph embedding techniques and Ma et al. (2021) for their use on network anomaly detection.
1.4 Our contribution
Leaving the technical details of the methodological contribution for the next section, the main difference between the contributions on the detection of tax fraud and the contribution of this paper is in the explicit recognition that VAT fraud is a group or community activity and thus the network structure of VAT transactions provides valuable information in the detection of fraudulent behaviour. Indeed, as discussed in Section 1.2, VAT–fraud inevitably relies on fictitious transactions and trading often involving many businesses across many sectors and countries with the purpose of concealing the fraud and go undetected. As such, fraud detection problems cannot be resolved by using standard data analytics but network information should be incorporated (if available) in the developed algorithms. This is also a point emphasized in the insightful contribution of Van Vlasselaer et al. (2017).
We thus explicitly recognise that anomalous behaviour in B2B transactions has two components: A trader/taxpayer specific one and one emerging from common behaviour, since VAT fraud requires the interaction of multiple B2B traders participating in the fraud. Therefore, our proposed methods combine both types of behaviour but they also satisfy the constraint that if the method is to be applied to a significant portion of data then the method must be not only robust but also computationally efficient, an issue which is of paramount importance for tax authorities and governments.121212It is also worth mentioning at this stage that although the discussion here is cast in terms of fraud involving cross-border B2B transactions, VAT fraud is not of course unique to such transactions but arises also within the domestic VAT network too, not least through fictitious trading whose sole purpose is to provide records of purchase/sales which have been acquired/siphoned off from/towards the black market. VAT fraud can take place through over-claim of refunds. Waseem (2023) shows, for example, that over-claim of refunds constitute 11-23 percent of the potential revenue in Pakistan and that approximately two-fifths of the over-claimed VAT refund is based on spurious invoices issued by invoice mills. The analysis and the method developed in this paper captures all elements of VAT network fraud. To determine communities whose members are likely to be suspected of VAT–fraud, the strategy is to define a corrected version of the Laplacian matrix, with the correction element utilizing the information obtained from the node-specific structure and the interaction behaviour across businesses thereby recognizing that the anatomy of fraud is a combination of individual propensity and community opportunity.
Our key point of departure is to rely on the spectral analysis of the observed networks of VAT transactions in order to map them on to a low-dimensional Euclidean vector space preserving also the original connectivity structure of their nodes. The spectral analysis of networks is a well-documented technique for classifying the nodes of large networks in distinct clusters; see for example Chung and Graham (1997) and Ng et al. (2001) for more details. Notice also that the spectral clustering methods are closely related to the so-called eigenmap technique appeared in the graph embedding approach as early as in the contribution of Belkin and Niyogi (2003). Here, we extend the spectral clustering approach by considering the eigendecomposition of a risk-corrected Laplacian that maps the observed networks, together with node-specific information related to their risk profile, on to a Euclidean vector space. Thus, in contrast with the existing network analytics methods for fraud detection—where only the so-called direct network features (for example, node degrees and number of triangles) are employed to discover fraudulent activity—we study the interactions recorded by the observed VAT networks and we include this information in scalable machine learning algorithms with the aim to classify businesses as fraudulent or not. More specifically, we update a node–specific binary vector using the singular value decomposition of the regularized Laplacian via estimated anomaly probabilities. This encapsulates using both information across nodes as well as node-specific information, resulting in a probability that a specific node is involved in fraudulent activities.
2 The methodological approach
This section presents the anomaly detection methods for VAT fraud detection. There are two main challenges in an anomaly detection problem of the type investigated here. The first refers to the classification of ‘normal’ and ‘anomalous’ behaviour, whereas the second relates to the scalability of the problem and the necessity to make the algorithm computationally efficient. The analysis deals with these challenges as follows.
VAT fraud, as already discussed, can be thought of as anomalous communal behaviour. Typically, in networks, communities are determined from their Laplacian matrix which is calculated from the (weighted) adjacency matrix (Merris, 1994). Since the anatomy of VAT fraud is a combination of individual propensity with community opportunity, the method relies on adjusting the Laplacian to capture these two types of behaviour (individual and communal). This adjustment is achieved through a global or local spectral decomposition of a corrected Laplacian. In the global approach, use will be made of the singular value decomposition of the regularized Laplacian of the whole network, consisting of hundreds of thousands of vertices, in order to update a vertex–specific binary vector through estimated anomaly probabilities. This process encapsulates the use of information a) across nodes, and b) node-specific. We thus propose a new graph-informed classifier which aims to separate anomalous nodes, such as VAT missing traders, from all the other taxpayers.
To deal with the second objective of the tax authorities (the identification of groups of VAT fraudsters), we develop a method that identifies clusters in the network of VAT transactions. In particular, we embed the constructed corrected Laplacian matrix in the hierarchical clustering technique recently developed by Li et al. (2020). In contrast with the global clustering methods, where a single partition of the network in a number of clusters is created, we construct a hierarchical tree of communities by dividing larger communities into smaller ones. The process of cluster identification is therefore conducted in a local manner facilitating the difficult task, due to the large number of non-fraudulent nodes, of identifying VAT fraudulent clusters. The developed methods provide tax authorities with two tools which can be used either separately or in combination in order to improve their capability in quickly identifying VAT missing traders fraud schemes. We show how to implement the proposed methods on a population–sized data set involving over the universe of VAT registered business in Bulgaria.
The proposed method employs the network , coupled with node-specific covariates , to estimate probabilities of suspected VAT fraud . In particular, the approach followed first estimates the probabilities of VAT fraud for each individual node , without using the network structure, and then proceeds with understanding of how our knowledge for the group structure of the network can be utilised either to enrich our initial estimates, by providing more accurate predictions of the probability of a fraudulent node, or to group together nodes with similar (and fraudulent) behaviour.
2.1 Initial detection of anomalous nodes
Our data set contains weighted interactions as well as other variables (covariates) indexed by . We collect vertex-specific covariates in the matrix , where is the number of available covariates, and also have access to the -dimensional binary vector where the -th element is if the business that corresponds to the -th vertex had fraudulent activity in the past. To classify the vertices, without initially using their network community structure, we use the covariates to implement binary classification using the scalable XGBoost method (Chen and Guestrin, 2016) and obtain predictions of node specific risk probabilities .
Let be the -th element of and the -th row of . The XGboost algorithm is a regularized version of the well-known gradient boosting method where an ensemble of decision trees is employed to construct a prediction model for a target variable of interest. Gradient boosting131313See James et al. (2013) for a detailed description of gradient boosting methods. is an iterative algorithm where the gradient descent approach is adopted in order to minimise a loss function of interest by taking into account the prediction of each data point; at each iteration the prediction is updated by employing a decision tree such that the desired loss function is minimised. More precisely, after training the XGboost algorithm we obtain node-specific predictions
| (2) |
where is the space of decision classification trees. Each corresponds to an independent tree structure with leave weights where is the number of leaves of the tree. Thus, equation (2) implies that the -th observation is classified by using the decision rules specified by and summing up the leave weights .
To determine the functions we need to minimise the objective
| (3) |
where is a regularisation term that prevents over-fitting and and are tuning parameters whereas
is a differentiable convex loss function which is typically chosen for binary classification (see for example Murphy (2012) for more details). By noting that the objective in equation (3) includes functions as parameters, and thus its minimisation cannot be achieved by using traditional methods, Chen and Guestrin (2016) suggest to perform an additive optimisation that is, add to the prediction obtained in the -th iteration of the algorithm. Therefore, in the -th iteration of the algorithm we need to minimise the objective defined by
| (4) |
A second order Taylor approximation of implies that
| (5) |
where and . Notice that for a given tree structure the minimisation of (5) is straightforward and the optimal leaf weights can be explicitly calculated. However, this calculation has to be conducted for each possible tree structure and, importantly, Chen and Guestrin (2016) achieved this in a scalable manner.141414In our real data application we have implemented the XGboost algorithm by utilizing the r-package xgboost (Chen et al., 2019) where cross validation techniques are used to determine any tuning parameters.
2.2 Incorporating network characteristics of VAT fraud
VAT fraud is predominantly a group activity. To be able to model the group structure of activities, we need to detect those groups of taxpayers that are more probable to be involved in VAT fraudulent behaviour. This can be done by fitting a group model that identifies the nodes present in any group. This fit can either be implemented under the assumption that there are true blocks in the data (see Newman (2012)) or there is a propensity of a range of nodes to behave like a grouping (as in Olhede and Wolfe (2014)). The most common method to extract community structure from a network is spectral clustering (Chung and Graham, 1997) which is based on a spectral partition from its Laplacian matrix. There is a number of possible Laplacians that can be defined both in terms of the Laplacian and the adjacency matrix; see for example Priebe et al. (2019) for a debate. Here, we choose to adopt spectral clustering relying on a doubly regularised Laplacian which we construct in a way that accounts both for the community structure of the VAT fraud and the business-specific risk of fraudulent behaviour.
In the first level of regularisation we follow Chaudhuri et al. (2012) and Qin and Rohe (2013), and we deal with the strong degree heterogeneity of the VAT networks by considering the normalised Laplacian
| (6) |
where is a symmetric matrix, is a diagonal matrix consisted of the node degrees and . The parameter introduced by Chaudhuri et al. (2012) to correct for the so-called poor concentration properties151515In the presence of nodes with very high or very low degrees the spectral analysis of the usual Laplacian is mainly affected from the nodes of the highest degree; see for example Mihail and Papadimitriou (2002) for more details. By including a suitable normalisation is achieved. caused by large heterogeneity of the nodes degrees.
To also account for the individual risk of each node to be involved in fraud we work similarly to Binkiewicz et al. (2017) and we add a second level of regularisation in by defining the Laplacian
| (7) |
where is the -dimensional vector with fraud probabilities estimated by utilising node-specific covariates as described by Section 2.1. We can see directly from equation (2.2) that if the adjacency matrix is zero, and there is no network structure in the data, then we would only cluster on the values of the vector . If, on the other hand, was chosen to be zero, then there would be no regularization when inverting the degree matrix. What this means in practice, and for the issues at hand, is that the Laplacian matrix defined in equation (2.2) accounts for the presence of many low-degree nodes that is, businesses with few B2B transactions compared with a few businesses that may have a large number of B2B transactions. In fact, it is a risk-corrected Laplacian designed to improve spectral clustering performance by taking into account the fraud probabilities .
Equipped with the risk-corrected Laplacian , we proceed by calculating eigenvalues and eigenvectors such that
| (8) |
To keep the proposed method scalable we employ the implicitly restarted Lanczos bidiagonalization algorithm (Baglama and Reichel, 2005) to compute the first eigenvalues and eigenvectors of the (significantly large) dimensional matrix (for example, in equation (8) we have that ). The algorithm requires operations to compute the top eigenvectors of , since at each iteration only a product of the form , where is an arbitrary vector, is needed to be calculated. The method becomes even more computationally efficient by noting that and thus the sparsity of and the low rank structure of is taken into account. Let now be the matrix with columns . The next section turns attention to how is used to perform network-informed classification of the nodes of in order to identify the anomalous ones which correspond to ‘high-risk’ traders.
2.3 Classification and clustering
Equipped with the network-informed feature matrix , we build two anomaly detection methods. The first proposed method relies on the global spectral decomposition of in equation (2.2) from which we obtain . Then, by using again the XGboost algorithm, we update to and we select a threshold to determine which are large enough to warrant further investigation. This is achieved by using the algorithm described in Section 2.1 and replacing the matrix with the loadings matrix consisted of elements in equations (2)-(4); see the Algorithm 1 below for the steps of the proposed technique.
The second proposed method constructs a hierarchical tree of communities by utilizing the spectral decomposition of locally in each tree as suggested recently by Li et al. (2020). This is based on recursive bi-partitioning where any given (sub)network is divided into two. A stopping rule can also accompany the algorithm in order to decide if a sub-network can be further split in two. In practice any partitioning method and stopping rule can be used; see for example Li et al. (2020) for choices on both. Here we have chosen to partition each (sub)network based on the spectral decomposition of the risk-informed Laplacian and thus on the corresponding feature matrix . More precisely, following Li et al. (2020) we start by fixing and we split the initial network in two clusters by applying the -means algorithm with on the the feature matrix . Then, we apply the same procedure on each one of the two subnetworks constructed in the first step and thus we end up with clusters after the end of the second step of the algorithm. We stop once we have identified the desired number of clusters; The Algorithm 2 below presents the steps of the proposed clustering method.
2.3.1 Anomaly detection algorithms
This section provides the algorithmic steps of the two methods developed to detect anomalies in the network constructed from the universe of VAT transactions in Bulgaria. Both of the proposed algorithms require as inputs the network structure (network adjacency matrix) of the data as well as a vertex specific set of covariates and binary indicators of vertex anomalousness. Notice also that the first steps of Algorithms 1 and 2 are exactly the same.
Algorithm 1—Network Informed Multiscale Anomaly Detector (NIMAD)—summarizes the steps of the network anomaly detection technique that we developed in order to classify the vertices of a network as anomalous or not. The output of the algorithm is consisted of a vector with estimated anomaly probabilities for each vertex and a vector of cluster memberships for the vertices.
Input: network adjacency matrix ; -dimensional vertex specific binary vector ; matrix with vertex specific covariates; tuning constant ; positive integer .
Algorithm 2—Hierarchical Anomalous Cluster Identifier (HACI)—summarizes the steps of the anomaly detection technique that we constructed in order to identify anomalous clusters in a network. Notice that although the inputs of Algorithm 2 are those required by Algorithm 1 too, the positive integer which specifies the depth of the constructed hierarchical tree of clusters can be estimated automatically by the algorithm; see for example Li et al. (2020) and Li et al. (2020). Since in the present paper we deal with a population-scale network consisted of more than vertices we choose in advance in order to keep the proposed anomaly detection technique scalable. More precisely, performing a small sensitivity analysis reveals that any integer between and does not affect the resulting identification of anomalous clusters and vertices in the presented real data application. The output of Algorithm 2 is a vector consisted of vertex specific cluster memberships.
Input: network adjacency matrix ; -dimensional vertex specific binary vector ; matrix with vertex specific covariates; tuning constant ; positive integer .
2.4 A toy example
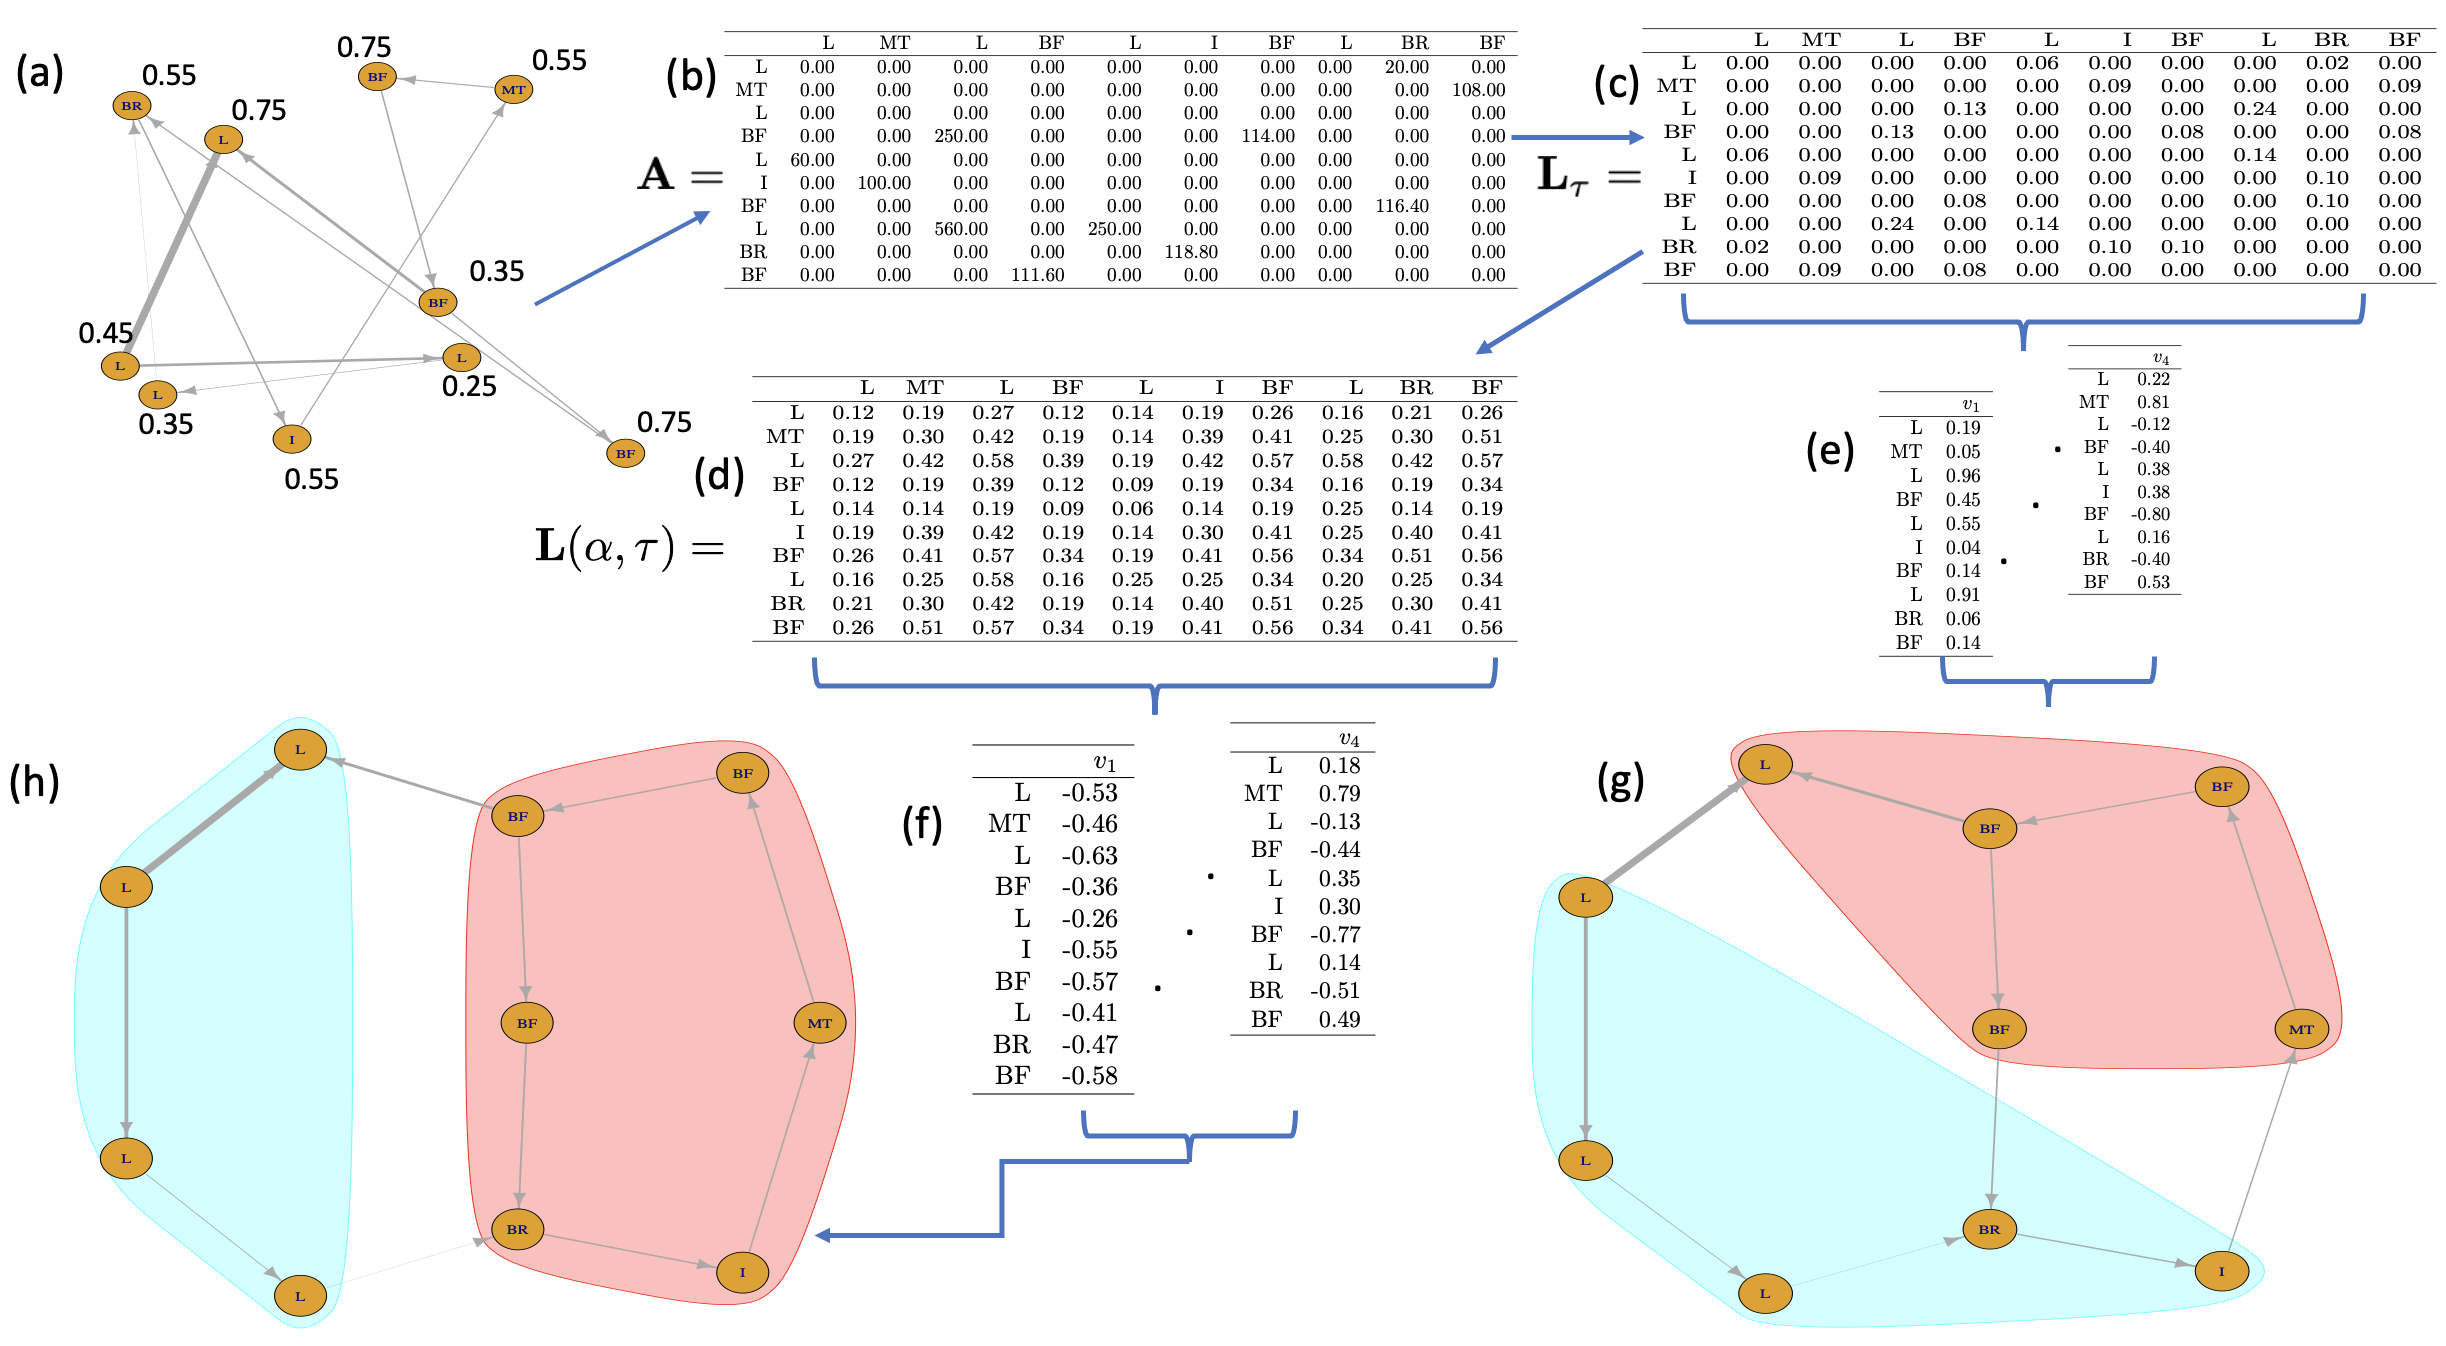
To highlight the advantages of the proposed methodology over traditional network and machine learning methods an example is developed using simulated data that mimic the simple case of MTIC fraud discussed in Section 1.2 and illustrated in Figure 2. In particular, we simulate the directed network of business invoices data (input/output VAT) presented in panel (a) of Figure 3(a) with panel presenting the adjacency matrix of this network. It is assumed that out of the VAT traders in this network have been involved in a MTIC fraud whereas the remaining vertices correspond to VAT registered traders that may have or have not transactions with traders who have engaged in fraudulent VAT transactions. To save space, it is also assumed that the initial fraud probability for each trader (see panel (a) in Figure 3) is known and so we do not need to implement the first step of the proposed methodology were initial fraud probabilities are estimated by using the XGboost algorithm.
With the simulated network and initial vertex specific fraud probabilities at hand, the traditional normalised Laplacian matrix in equation (6), as well as the proposed risk-informed Laplacian as defined by equation (2.2), are calculated with panels (c) and (d) in Figure 3 reporting their numerical values. By noting that both of the proposed fraud detection algorithms rely on the eigenvalues and the eigenvectors of the network Laplacian matrix, the eigendecomposition of both and is calculated so to compare their efficiency when using either of them. Next, we apply the -means algorithm on the first , normalised to have unit length, eigenvectors of each matrix and we separate the observed network in two sub-networks (clusters).161616The described steps correspond to the application of Algorithm 2 for in the simulated data set by calculating either or in the th step; we set and after some sensitivity analysis. The code to replicate the example is available as a supplementary material (the exact link has been removed following the blind-reviewing process of the journal. Panels (g) and (h) in Figure 3 display the identified clusters by using and , respectively.
Close inspection of the identified clusters reveals that by relying on the eigendecomposition of the proposed risk-informed Laplacian we can detect all the businesses that are involved to the simulated MTIC fraud, whereas clustering based on is not so efficient. This example, therefore, provides clear evidence that the outputs from both Algorithms 1 and 2—that is, the estimated fraud probabilities and cluster membership respectively, which rely on the eigendecomposition of —are more accurate than the outputs of the same algorithms if would be replaced by . Notice also that trying to identify the members of the MTIC scheme relying solely on the initial fraud probabilities would also result in less accurate fraud detection than the one illustrated in panel (h) of Figure 3. The implication of all this is that fraud detection based on the combination of the structure of the VAT network with risk information about the individual businesses (vertices) should be preferred compared to using only a method that utilizes only a single source of information. Section 3 provides similar evidence by conducting analysis on real data from the Bulgarian tax authorities.
3 Real data analysis
The aim of VAT fraud detection is to determine which taxpayers are suspected as being potential participants in a fraud scheme. We therefore apply the proposed algorithms, NIMAD and HACI, to the universe of VAT returns provided by the Bulgarian National Revenue Authority for the years 2016-2017. More specifically, the developed algorithms are applied on ledgers data for all VAT registered taxpayers in Bulgaria in . We conduct an out-of-sample exercise in which we train the models by constructing networks that correspond to the monthly VAT returns submitted by the taxpayers from January up to November and we aim to predict, probabilistically, the illegitimate taxpayers of December . The results will be compared with classification techniques that rely only on covariates that describe the taxpayers’ profiles without taking into account the network structure of the data. This out-of-sample exercise will demonstrate that the network information plays a key role in the efficient detection of anomalous vertices. Finally, we analyse results from our two anomaly detection methods that classify groups of fraudsters and legitimate taxpayers and identify clusters of taxpayers with characteristics similar to (known) fraudsters.
Both of the proposed algorithms rely on the prediction of probabilities of risky VAT taxpayers. This is achieved by first training the XGboost algorithm with inputs a binary response vector and the matrix consisted of the available covariates which include the number of employees, the labour cost, and other records that taxpayers declare with their VAT returns. In particular, the types of covariates that we use are a subset of the risk-based criteria which the Bulgarian National Revenue Agency employ in order to prioritize the taxpayers with respect to their riskiness of being involved in a VAT missing trader fraud. We also construct covariates by utilizing the characteristics of the 23 observed networks. We calculate for each vertex its mean (across the observed networks) degree, strength and centrality. The resulting matrix has columns. Then, we utilize the matrix consisted of the covariates that correspond to the month (December 2017) that we wish to predict risky probabilities in order to obtain the vector appearing in equation (2.2).
The input adjacency matrix , required by both of the developed anomaly detection techniques, corresponds to the adjacency matrix of a directed weighted network, constructed by the VAT returns submitted in December . In our case is an asymmetric matrix so we construct a symmetric matrix . The undirected network whose adjacency matrix is has the same edges as the original network, but directed edges have been replaced with undirected edges with a sum of the weights associated with the edge in question. Community detection methods that are based on tend to group nodes that share similar incoming and outgoing edges (Satuluri and Parthasarathy, 2011). We find this symmetrization reasonable as VAT registered traders that perform fraudulent activity, it is reasonable to assume, have common trading patterns. Finally, since both of the anomaly detection algorithms that we developed rely on the spectral decomposition of the matrix in equation (2.2) they require the determination of the tuning parameters and . We follow the approach in Qin and Rohe (2013) and set , the average degree. The value of can be determined from the eigenvectors of and . See for example the contribution by Binkiewicz et al. (2017) where the authors show how to set such that the information contained in as well as in is captured in the leading eigenspace of .
3.1 Out–of–sample detection
To test the performance of the anomaly detection algorithms we have designed an out–of–sample detection exercise. We construct a time series of networks from the 24 months of observations corresponding to the monthly data of 2016 and 2017.
The first step, for both of our methods, in classifying the 24th month of observations from the other 23 months, corresponds to a binary vector that indicates the anomalous vertices of ‘high–risk’ taxpayers, a matrix of covariates, and an adjacency matrix. The binary vector that we input is a classification of ‘high–risk’ and ‘low–risk’ taxpayers, as calculated by the Bulgarian National Revenue Agency up to the point November 2017. We note that this is an unbalanced classification problem as the proportion of fraudulent nodes is unlikely to be as large as one half (Hand and Vinciotti, 2003). This corresponds to assigning a different loss to the different types of miss-classification. To deal with this class imbalance problem we apply the method of random oversampling by randomly re-sampling the set of ‘high–risk’ taxpayers in order to construct a balanced data set. We have chosen the technique of oversampling among others in order to keep the proposed method simple without loosing any information carried on the original data; see for example Menon et al. (2013) for a comparison of the several techniques that have been developed to deal with data imbalance problems. To carry out the out–of–sample analysis we use the weighted directed network made from the VAT returns submitted in December . The value of the tuning parameter should be chosen to balance the network structure, as captured by , versus the individual probabilities of . We implemented sensitivity analysis to determine a value of for this parameter.
Finally, both of the developed anomaly detection methods rely on the calculation of the spectral decomposition of the matrix in equation (2.2) which we employed by utilizing the Lanczos bidiagonalization method (Baglama and Reichel, 2005). In the case of NIMAD, which employs the eigenvectors calculated globally from the matrix that corresponds to the whole observed network, we stopped the algorithm after computing the first eigenvalues and eigenvectors and noting that after that value the eigenvalues were quite similar (see Figure 8 in the appendix for their values). On the other hand, the implementation of HACI requires only the largest eigenvalues and eigenvectors of the matrix that corresponds to a given leaf of the hierarchical tree of communities under construction. We also note that the application of Algorithm 1 on the described data set required almost hours on a Laptop with a 1.6 GHz Dual-Core Intel Core i5 CPU running R R Core Team (2021), whereas Algorithm 2 was implemented in less than an hour.
3.2 Determining the accuracy of the proposed methods
We evaluate Algorithm 1 by trying to predict the provided list of risky taxpayers, as occurring in December . We can observe directly from the list of risky taxpayers that of the ‘high–risk’ registrations of taxpayers in December 2017 had in fact been determined as ‘high–risk’ already in November 2017. The remaining were registered for the first time as ‘high–risk’ in December 2017. We, therefore, address the two tasks of a) predicting all risky VAT registrations in and b) predicting only the new risky VAT registrations in . To determine the performance of our novel methodology we compare the receiver operating characteristic (ROC) curves (as in Hsieh et al. (1996)) produced by our method and by using XGboost classification without the network information. Figure 4 illustrates that our algorithm outperforms the simple XGboost algorithm in both the old and new taxpayers in December 2017. This provides strong evidence of the benefit from combining both individual and group patterns to detect fraud.
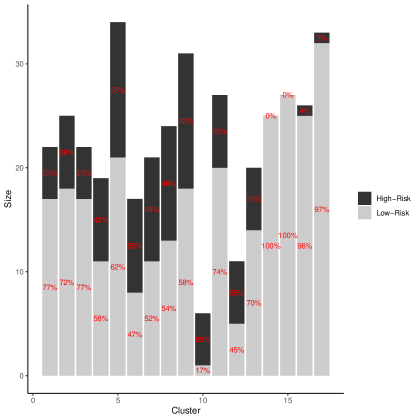
To assess the output of Algorithm 2, we focus on the identification of taxpayers included for a first time at December in the list with ‘high–risk’ registrations. We first present in Figure 5 the size of the clusters that we found to consist of more than known (up to November ) ‘high–risk’ taxpayers as well as the proportion of ‘high–’ and ‘low–risk’ taxpayers within each one of the clusters. It is evident from the visual inspection of Figure 5 that by constructing hierarchically clusters in the observed network we can identify clusters which rarely have more than members and the proportion of the target ‘high–risk’ taxpayers within the clusters ranges for the majority of them between and .

To compare the two proposed anomaly detection methods we first note that they are primarily distinguished by the output which they provide. Algorithm 1 classifies the taxpayers of as ‘high–’ and ‘low– risk’ by conducting the corresponding classification in the vertices of the observed network whereas, as a by-product of the algorithm, we can also cluster the nodes of the network by using the spectral decomposition of the Laplacian matrix in (2.2) that corresponds to the whole network. Algorithm 2, in contrast to 1, can be considered as a cluster-oriented algorithm since its main aim is the hierarchical identification of groups of taxpayers with common patterns of transactions by constructing a tree of clusters employing recursively the spectral decomposition of the Laplacian matrix in (2.2) in each leaf of the tree. We expect therefore that Algorithm 1 achieves a more accurate classification of ‘high–’ and ‘low– risk’ taxpayers than Algorithm 2 while the latter is more efficient in identifying sizeable fraudulent clusters that require their further investigation from tax authorities during the process of detecting groups of taxpayers involved in the same or different illegal activities.
Indeed, following the application of Algorithm 1, we can detect more than out of the of the taxpayers that included for first time at December in the list with ‘high–risk’ VAT taxpayers by reporting no more than taxpayers to be audited; see also Section 3.3 for the evaluation of this outcome with respect to policy gain for the tax authorities. On the other hand, the application of Algorithm 2 results in the identification of no more than ‘high-risk’ taxpayers in the reported . By noting, however, that the second aim of tax authorities is the detection of groups of taxpayers with common, fraudulent, pattern of transactions we also compare the two methods with respect to fraudulent cluster identification. As already discussed, it is clear from Figure 5 that by using the hierarchical clustering approach we detect clusters which contain a significant number of VAT taxpayers and their size allows the authorities to design targeted audits in order to identify all the taxpayers that are involved in a VAT fraud. The success of the hierarchical identification of fraudulent clusters can be emphasized by noting that the average proportion of ‘high–risk’ taxpayers is per month. Thus, the proposed hierarchical approach manages to overcome well-known (see, for example, Menon et al. (2013)) problems in classification which arise due to the imbalance in the data labels and could also harm the discovery of fraudulent clusters. On the contrary, Algorithm 1 fails to identify clusters of practical interest since the smallest clusters that contain at least or ‘high-risk’ taxpayers have more than members.
3.3 Policy evaluation of the algorithmic outputs
The benefit derived from the automated detection algorithms proposed in this paper is clear;171717Though the method is applied on data from the Bulgarian National Revenue Agency its application is, of course, broader and can be employed by other revenue authorities as well. currently Bulgarian National Revenue Agency applies risk–based rules on all the submitted tax returns and monthly prioritizes 15,000 of these returns as ‘high–risk’. By implementing further selection criteria those 15,000 are whittled down to 500, and finally via auditing 100 taxpayers are identified as having been part of VAT fraud. The methods proposed in this contribution provide fully automated mechanisms for identifying VAT fraudsters.
Automation has a number of clearly identified advantages, reducing cost, increasing transparency and reproducibility, explicitly balancing the information obtained from a single taxpayer versus that provided by the population–scale data. The out-of-sample exercise shows there is a clear benefit in identification for a fixed false positive rate. In particular, the proposed method has identified 200 taxpayers with the highest fraud probabilities, estimated by using Algorithm 1. Out of these 200, 100 of them had been identified as risky for VAT fraud for the first time in December . By automating the process, we have managed to reduce the set of 500 identified by the selection procedure of the Bulgarian National Revenue Agency that relied on a human–implemented selection procedure. Moreover, the hierarchical clustering provided by Algorithm 2 allows quick identification of relatively small groups consisted of taxpayers with similar fraudulent behavior.181818The Bulgarian National Revenue Agency, as a response to the results presented in this paper, has already begun automating and strengthening further their auditing function to fully capture the benefits from detecting more than one members of VAT fraud schemes.
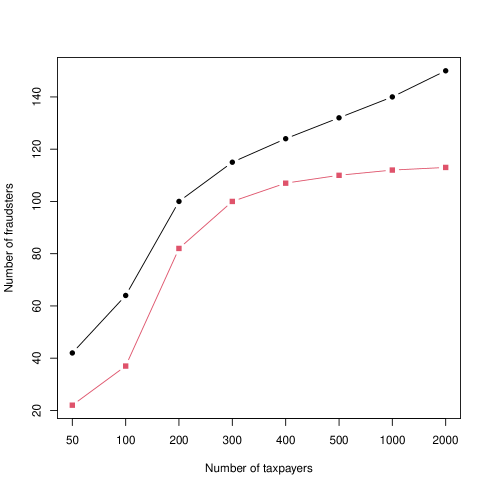
Finally, Figure 6 displays the number of new entries in the risky taxpayers list, that we can identify for a given number of taxpayers, reported as suspicious by using either Algorithm 1 or 2. The figure indicates that by reducing to reported taxpayers the false positive rate is minimised, since of them indeed entered the list of risky VAT registered taxpayers of the Bulgarian National Revenue Agency in December . Allowing for more false positives, in the sense of increasing the number from to (which is the number currently audited by the Bulgarian National Revenue Agency), we can predict more than ‘high–risk’ taxpayers. This number increases to is we report VAT registered taxpayers for auditing. Finally, Figure 6 confirms the superiority of Algorithm 1 with respect to the classification of ‘high–’ and ‘low–risk’ taxpayers compared with the classification provided by Algorithm 2.
4 Concluding remarks
This paper has contributed to an emerging literature whose objective is to develop novel and efficient tools for fraud detection. With VAT fraud in mind (a fraud with significant revenue consequences), we have developed fraud detection tools through the use of advanced quantitative, statistical and machine learning methods. The main difference between the methodology developed in this paper, and the existing fraud detection methods in the literature, is the combination of efficient machine learning techniques with tools from the network science which has allowed the combination of taxpayer specific behaviour with the behaviour of groups of taxpayers in suspicious activities.
The analysis suggests avenues for future research. Detecting anomalies in the VAT network is not, of course, a temporal problem but it has also an inter-temporal dimension. Fraudulent taxpayers learn from interacting with the revenue authority, as the revenue authority learns from identifying fraud. For this, the adjustment of the compliance strategy requires to be appropriately adjusted (Black and Baldwin, 2012). The VAT networks analysed are static in the sense that the changes in their structure through time are assumed to convey no information. For the time horizon of the data set this is not a significant omission, since the interactions between B2B are not expected to vary significant within a period of twenty three months. For longer time horizons, however, this might matter. For this, it will be interesting to extent the developed fraud detection methodology to multi-layer networks which can also account for time dimension of the observed networks. Multi-layer networks can model different relationships between businesses (such as transactions and common members in their board of directories) which are possibly changing over time and then search for communities with abnormal connectivity patterns across all the layers.191919The multi-layer networks have become recently a standard tool for the understanding of relations beyond the dyadic ones (Xu et al., 2022). We leave this issue to future research.
The analysis has refrained from analysing the issue of selection bias error. This is a well-known problem in statistical and machine learning methods applied in a variety of fields; including but not limited to economic policies (Heckman, 1990).202020And sociology. See, for example, Elwert and Winship (2014). In the context of VAT fraud detection the selection bias error is a result of the non-randomised nature of the performed audits since only taxpayers/businesses that have been selected through risk assessment are observed. Many tax authorities, however, being interested in potential revenue yield lost through randomising (and some being constrained by law) are not performing random audits, so identifying the counterfactual might be a difficult task within the present context. Nevertheless, it is an issue worth investigating further. An attempt in this direction is in Battaglini et al. (2022) who also provide an excellent and detailed discussion on this issue.
Nevertheless we hope that the results presented in this paper are instructive and there is merit in developing algorithms with a view of supporting the well functioning of economic systems.
References
- Ainsworth and Madzharova (2012) Ainsworth, R. and B. Madzharova (2012). Real time collection of value-added taxes: Some business and legal implications. Boston University School of Law Working Paper No 12-51.
- Akoglu et al. (2015) Akoglu, L., H. Tong, and D. Koutra (2015). Graph based anomaly detection and description: a survey. Data mining and knowledge discovery 29(3), 626–688.
- Athey (2017) Athey, S. (2017). Beyond prediction: Using big data for policy problems. Science 355(6324), 483–485.
- Baesens et al. (2003) Baesens, B., R. Setiono, C. Mues, and J. Vanthienen (2003). Using neural network rule extraction and decision tables for credit-risk evaluation. Management science 49(3), 312–329.
- Baglama and Reichel (2005) Baglama, J. and L. Reichel (2005). Augmented implicitly restarted lanczos bidiagonalization methods. SIAM Journal on Scientific Computing 27(1), 19–42.
- Basta et al. (2009) Basta, S., F. Fassetti, M. Guarascio, G. Manco, F. Giannotti, D. Pedreschi, L. Spinsanti, G. Papi, and S. Pisani (2009). High quality true-positive prediction for fiscal fraud detection. In 2009 IEEE International Conference on Data Mining Workshops, pp. 7–12. IEEE.
- Battaglini et al. (2022) Battaglini, M., L. Guiso, C. Lacava, D. L. Miller, and E. Patacchini (2022). Refining public policies with machine learning: The case of tax auditing. Technical report, National Bureau of Economic Research.
- Belkin and Niyogi (2003) Belkin, M. and P. Niyogi (2003). Laplacian eigenmaps for dimensionality reduction and data representation. Neural computation 15(6), 1373–1396.
- Binkiewicz et al. (2017) Binkiewicz, N., J. T. Vogelstein, and K. Rohe (2017). Covariate-assisted spectral clustering. Biometrika 104(2), 361–377.
- Black and Baldwin (2012) Black, J. and R. Baldwin (2012). When risk-based regulation aims low: A strategic framework. Regulation & Governance 6(2), 131–148.
- Cai et al. (2018) Cai, H., V. W. Zheng, and K. C.-C. Chang (2018). A comprehensive survey of graph embedding: Problems, techniques, and applications. IEEE transactions on knowledge and data engineering 30(9), 1616–1637.
- Cecchini et al. (2010) Cecchini, M., H. Aytug, G. J. Koehler, and P. Pathak (2010). Detecting management fraud in public companies. Management Science 56(7), 1146–1160.
- Chaudhuri et al. (2012) Chaudhuri, K., F. Chung, and A. Tsiatas (2012). Spectral clustering of graphs with general degrees in the extended planted partition model. In Conference on Learning Theory, pp. 35–1.
- Chen and Guestrin (2016) Chen, T. and C. Guestrin (2016). Xgboost: A scalable tree boosting system. In Proceedings of the 22nd acm sigkdd international conference on knowledge discovery and data mining, pp. 785–794.
- Chen et al. (2019) Chen, T., T. He, M. Benesty, V. Khotilovich, Y. Tang, H. Cho, K. Chen, R. Mitchell, I. Cano, T. Zhou, M. Li, J. Xie, M. Lin, Y. Geng, and Y. Li (2019). xgboost: Extreme Gradient Boosting. R package version 0.90.0.2.
- Chiu et al. (2011) Chiu, C., Y. Ku, T. Lie, and Y. Chen (2011). Internet auction fraud detection using social network analysis and classification tree approaches. International Journal of Electronic Commerce 15(3), 123–147.
- Chung and Graham (1997) Chung, F. R. and F. C. Graham (1997). Spectral graph theory. Number 92. American Mathematical Soc.
- degl’Innocenti and Rablen (2020) degl’Innocenti, D. G. and M. D. Rablen (2020). Tax evasion on a social network. Journal of Economic Behavior & Organization 169, 79–91.
- Ebrill et al. (2001) Ebrill, L. P., M. Keen, and V. P. Perry (2001). The modern VAT. International Monetary Fund.
- Elwert and Winship (2014) Elwert, F. and C. Winship (2014). Endogenous selection bias: The problem of conditioning on a collider variable. Annual review of sociology 40, 31.
- FISCALIS (2010) FISCALIS (2010). Fiscalis guide, compliance risk management guide for tax administrations.
- Gao et al. (2021) Gao, Y., B. Shi, B. Dong, Y. Wang, L. Mi, and Q. Zheng (2021). Tax evasion detection with fbne-pu algorithm based on pncgcn and pu learning. IEEE Transactions on Knowledge and Data Engineering.
- González and Velásquez (2013) González, P. C. and J. D. Velásquez (2013). Characterization and detection of taxpayers with false invoices using data mining techniques. Expert Systems with Applications 40(5), 1427–1436.
- Gupta and Nagadevara (2007) Gupta, M. and V. Nagadevara (2007). Audit selection strategy for improving tax compliance: application of data mining techniques. In Foundations of Risk-Based Audits. Proceedings of the eleventh International Conference on e-Governance, Hyderabad, India, December, pp. 28–30. Citeseer.
- Hand and Vinciotti (2003) Hand, D. J. and V. Vinciotti (2003). Choosing k for two-class nearest neighbour classifiers with unbalanced classes. Pattern recognition letters 24(9-10), 1555–1562.
- Heckman (1990) Heckman, J. (1990). Varieties of selection bias. The American Economic Review 80(2), 313–318.
- Hsieh et al. (1996) Hsieh, F., B. W. Turnbull, et al. (1996). Nonparametric and semiparametric estimation of the receiver operating characteristic curve. Annals of statistics 24(1), 25–40.
- Jackson and Wolinsky (1996) Jackson, M. O. and A. Wolinsky (1996). A strategic model of social and economic networks. Journal of economic theory 71(1), 44–74.
- James et al. (2013) James, G., D. Witten, T. Hastie, and R. Tibshirani (2013). An introduction to statistical learning, Volume 112. Springer.
- Keen and Lockwood (2010) Keen, M. and B. Lockwood (2010). The value added tax: Its causes and consequences. Journal of Development Economics 92(2), 138–151.
- Keen and Smith (2006) Keen, M. and S. Smith (2006). VAT fraud and evasion: What do we know and what can be done? National Tax Journal 51, 861–887.
- Kleanthous and Chatzis (2020) Kleanthous, C. and S. Chatzis (2020). Gated mixture variational autoencoders for value added tax audit case selection. Knowledge-Based Systems 188, 105048.
- Kolaczyk and Csárdi (2014) Kolaczyk, E. D. and G. Csárdi (2014). Statistical analysis of network data with R, Volume 65. Springer.
- Lazer et al. (2009) Lazer, D., A. S. Pentland, L. Adamic, S. Aral, A. L. Barabasi, D. Brewer, N. Christakis, N. Contractor, J. Fowler, M. Gutmann, et al. (2009). Life in the network: the coming age of computational social science. Science (New York, NY) 323(5915), 721.
- Lazer et al. (2020) Lazer, D. M., A. Pentland, D. J. Watts, S. Aral, S. Athey, N. Contractor, D. Freelon, S. Gonzalez-Bailon, G. King, H. Margetts, et al. (2020). Computational social science: Obstacles and opportunities. Science 369(6507), 1060–1062.
- Li et al. (2020) Li, T., L. Lei, S. Bhattacharyya, K. V. den Berge, P. Sarkar, P. J. Bickel, and E. Levina (2020). Hierarchical community detection by recursive partitioning. Journal of the American Statistical Association 0(0), 1–18.
- Li et al. (2020) Li, T., E. Levina, and J. Zhu (2020). Network cross-validation by edge sampling. Biometrika 107(2), 257–276.
- Ma et al. (2021) Ma, X., J. Wu, S. Xue, J. Yang, C. Zhou, Q. Z. Sheng, H. Xiong, and L. Akoglu (2021). A comprehensive survey on graph anomaly detection with deep learning. IEEE Transactions on Knowledge and Data Engineering.
- Margetts and Dorobantu (2019) Margetts, H. and C. Dorobantu (2019). Rethink government with AI.
- Matos et al. (2015) Matos, T., J. A. F. de Macedo, and J. M. Monteiro (2015). An empirical method for discovering tax fraudsters: A real case study of brazilian fiscal evasion. In Proceedings of the 19th International Database Engineering & Applications Symposium, pp. 41–48.
- Menon et al. (2013) Menon, A., H. Narasimhan, S. Agarwal, and S. Chawla (2013). On the statistical consistency of algorithms for binary classification under class imbalance. In International Conference on Machine Learning, pp. 603–611.
- Merris (1994) Merris, R. (1994). Laplacian matrices of graphs: a survey. Linear algebra and its applications 197, 143–176.
- Mihail and Papadimitriou (2002) Mihail, M. and C. Papadimitriou (2002). On the eigenvalue power law. In Randomization and Approximation Techniques in Computer Science: 6th International Workshop, RANDOM 2002 Cambridge, MA, USA, September 13–15, 2002 Proceedings 5, pp. 254–262. Springer.
- Murphy (2012) Murphy, K. P. (2012). Machine learning: a probabilistic perspective. MIT press.
- Newman (2012) Newman, M. E. (2012). Communities, modules and large-scale structure in networks. Nature physics 8(1), 25–31.
- Ng et al. (2001) Ng, A., M. Jordan, and Y. Weiss (2001). On spectral clustering: Analysis and an algorithm. Advances in neural information processing systems 14.
- OECD (2004) OECD (2004). Compliance risk management: Managing and improving tax compliance.
- OECD et al. (2022) OECD, A. T. A. Forum, and A. U. Commission (2022). Revenue Statistics in Africa 2022.
- Olhede and Wolfe (2014) Olhede, S. C. and P. J. Wolfe (2014). Network histograms and universality of blockmodel approximation. Proceedings of the National Academy of Sciences 111(41), 14722–14727.
- Pomeranz (2015) Pomeranz, D. (2015, August). No taxation without information: Deterrence and self-enforcement in the value added tax. American Economic Review 105(8), 2539–69.
- Priebe et al. (2019) Priebe, C. E., Y. Park, J. T. Vogelstein, J. M. Conroy, V. Lyzinski, M. Tang, A. Athreya, J. Cape, and E. Bridgeford (2019). On a two-truths phenomenon in spectral graph clustering. Proceedings of the National Academy of Sciences 116(13), 5995–6000.
- Qin and Rohe (2013) Qin, T. and K. Rohe (2013). Regularized spectral clustering under the degree-corrected stochastic blockmodel. In Advances in neural information processing systems, pp. 3120–3128.
- R Core Team (2021) R Core Team (2021). R: A Language and Environment for Statistical Computing. Vienna, Austria: R Foundation for Statistical Computing.
- Satuluri and Parthasarathy (2011) Satuluri, V. and S. Parthasarathy (2011). Symmetrizations for clustering directed graphs. In Proceedings of the 14th International Conference on Extending Database Technology, pp. 343–354.
- Savić et al. (2022) Savić, M., J. Atanasijević, D. Jakovetić, and N. Krejić (2022). Tax evasion risk management using a hybrid unsupervised outlier detection method. Expert Systems with Applications 193, 116409.
- Shah (2021) Shah, J. (2021). Using computerized information to enforce vat: Evidence from pakistan. Mimeo, University of Oxford.
- Subelj et al. (2011) Subelj, L., S. Furlan, and M. Bajec (2011). An expert system for detecting automobile insurance fraud using social network analysis. Expert Systems with Applications 38(1), 1039–1052.
- Van Vlasselaer et al. (2017) Van Vlasselaer, V., T. Eliassi-Rad, L. Akoglu, M. Snoeck, and B. Baesens (2017). Gotcha! network-based fraud detection for social security fraud. Management Science 63(9), 3090–3110.
- Vanhoeyveld et al. (2020) Vanhoeyveld, J., D. Martens, and B. Peeters (2020). Value-added tax fraud detection with scalable anomaly detection techniques. Applied Soft Computing 86, 105895.
- Waseem (2023) Waseem, M. (2023). Overclaimed refunds, undeclared sales, and invoice mills: Nature and extent of noncompliance in a value-added tax. Journal of Public Economics 218, 104783.
- Wu et al. (2012) Wu, R.-S., C.-S. Ou, H.-y. Lin, S.-I. Chang, and D. C. Yen (2012). Using data mining technique to enhance tax evasion detection performance. Expert Systems with Applications 39(10), 8769–8777.
- Xu (2021) Xu, M. (2021). Understanding graph embedding methods and their applications. SIAM Review 63(4), 825–853.
- Xu et al. (2022) Xu, S., Y. Zhen, and J. Wang (2022). Covariate-assisted community detection in multi-layer networks. Journal of Business & Economic Statistics (just-accepted), 1–31.
Appendices
Appendix A Real VAT fraud in Bulgaria
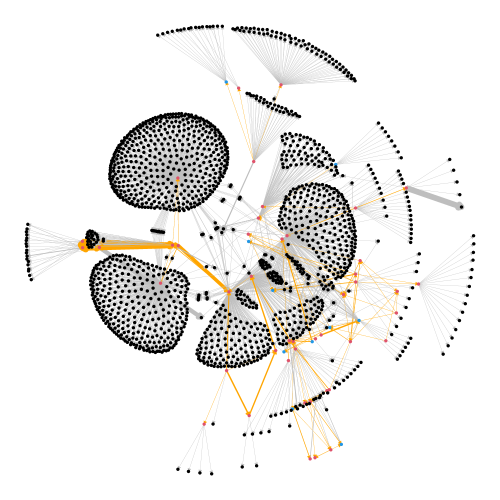
Figure 7 depicts the transactions of a real network in Bulgaria where MTIC fraud has been identified by the Bulgarian National Revenue Agency. The nodes of the displayed network correspond to VAT registered businesses and the edges indicate VAT transactions between them with the direction of the edges indicating sales and their width being proportional to the amount of the corresponding VAT. The displayed network consists of nodes and represents a small part of a complete network of transactions between over businesses in Bulgaria. Within this network there are 32 missing traders and 22 brokers212121Both missing traders and brokers are considered as fraudsters in a MTIC fraud scheme. who transact with the other businesses that are identified as legitimate. Figure 7 clearly indicates a pattern in the transactions made by the fraudsters; a few of them transact with a large number of legitimate businesses and make no transactions with other fraudsters whereas the majority of the fraudsters have no transactions with legitimate businesses. This observation is behind the motivation to study the interactions of businesses in a given network in order to extract important information for their fraudulent behavior. These interactions that are weighted and directed are methodologically incorporated into the proposed analysis, in addition to any other information on node–specific (estimated) covariates.
Appendix B Economic sectors
Table 1 displays the codes of the economic sectors in Bulgaria classified according to the Nomenclature of Economic Activities (NACE) system.
| Code | Sector |
|---|---|
| A | Agriculture, forestry and fishing |
| B | Mining and quarrying |
| C | Manufacturing |
| D | Electricity, gas, steam and air conditioning supply |
| E | Water supply; sewerage; waste management and remediation activities |
| F | Construction |
| G | Wholesale and retail trade; repair of motor vehicles and motorcycles |
| H | Transporting and storage |
| I | Accommodation and food service activities |
| J | Information and communication |
| K | Financial and insurance activities |
| L | Real estate activities |
| M | Professional, scientific and technical activities |
| N | Administrative and support service activities |
| O | Public administration and defence; compulsory social security |
| P | Education |
| Q | Human health and social work activities |
| R | Arts, entertainment and recreation |
| S | Other services activities |
| NA | Not available information of the economic activity |
Appendix C Results from the spectral decomposition
Figure 8 displays the first eigenvalues of the matrix computed by using the Lanczos bidiagonalization algorithm (Baglama and Reichel, 2005). Figure 9 presents the mean of each loading vector separately for the ‘low–risk’ taxpayers, for the ‘high–risk’ taxpayers that we used to train NIMAD and for the ‘high–risk’ taxpayers that we aimed detect. Close inspection of the figure reveals that for the ‘high–risk’ taxpayers there exists one eigenvector for which the mean of its loadings is much higher than the means of the loadings that correspond to the remaining eigenvectors. By noting that in the case of ‘low–risk’ taxpayers the mean loadings for all the eigenvectors have similar values we conclude that using, in the th step of Algorithm 1, the columns of matrix as features in a XGboost algorithm we obtain an accurate classification between ‘high-’ and ‘low–risk’ taxpayers.

