Direct determination of the zero-field splitting for Fe3+ ion in a synthetic polymorph of the oxalate mineral stepanovite NaMgFe(C2O4)9H2O: a natural MOF
Abstract
We employed inelastic neutron scattering (INS), specific heat, and magnetization analysis to study the magnetism in a synthetic polymorph of the quasi-two-dimensional natural metal-organic framework material, stepanovite NaMgFe(C2O4)9H2O. No long-range magnetic order can be observed down to 0.5 K. The INS spectra show two dispersionless excitations at energy transfer 0.028(1) and 0.050(1) meV at base temperature, which are derived from the magnetic transitions between zero-field splitting (ZFS) of ground state multiplets of Fe3+ ion. Further analysis of the INS results shows that the Fe3+ ion has an easy-axis anisotropy with axial ZFS parameter = meV and rhombic parameter = 0.0014(5) meV. The upward behavior at zero field and Schottky-like peak under magnetic field of the low-temperature magnetic specific heat further support the INS results. Our results clearly reveal the magnetic ground and excited state of this stepanovite polymorph.
I Introduction
Metal-organic frameworks (MOFs) are a recently-emerged family of porous crystalline materials, with abundant topological structures, that have broad prospects for applications in gas storage and separation, carbon sequestration, catalysis, photovoltaics, biomedicine delivery, and chemical sensing, etc Huskić et al. (2016); Kirchon et al. (2018). The oxalate-based organic minerals zhemchuzhnikovite and stepanovite, NaMgFe(C2O4)9H2O, have an open structure that is analogous to MOF materials that have been developed by several groups, making them so far rare examples of naturally-formed MOF architectures Huskić et al. (2016). Although metal oxalates are the largest family of organic minerals Echigo and Kimata (2010), natural zhemchuzhnikovite and stepanovite crystals are exceptionally rare, found only in exotic geochemical environments. Recently, however, different research groups, including ours, have shown that synthetic stepanovite crystals (structurally and morphologically identical to the natural ones) can be readily obtained in the form of millimeter-sized, light green triangular crystals Huskić et al. (2016); Piro et al. (2016). Stepanovite crystallizes in a trigonal structure (space group ) with lattice parameters Å and Å Knipovich et al. (1963); Huskić et al. (2016); Piro et al. (2016).
It was recently shown that the laboratory synthesis of stepanovite, depending on the synthetic conditions, can also lead to the formation of stepanovite II, a polymorph isostructural to the mineral zhemchuzhnkovite, which crystallizes in the trigonal space group with lattice parameters Å and Å Huskić et al. (2019). Structures of both stepanovite forms are dominated by honeycomb NaMgFe(C2O4)3 layers (see Fig. I), which stack in the ABCABC fashion in stepanovite, and in the stepanovite II adopt the ABAB arrangement. In each layer, the Fe3+ ions are in an octahedral coordination, with Fe-O bonds about 2.03 Å long.
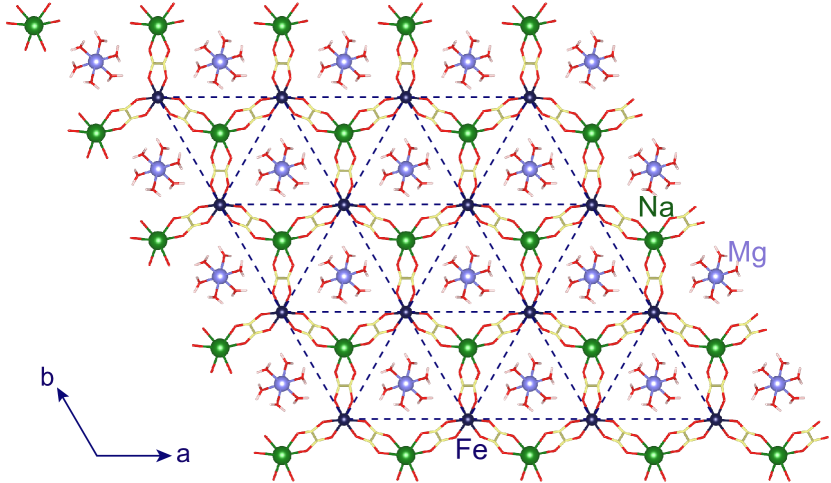
The Fe3+ ions can further form a triangular sublattice in the plane (see Fig. I). The Fe-Fe distance in plane of stepanovite is equal to the lattice parameter Å, and in stepanovite II it is 10.028 Å Huskić et al. (2019). In both structures, adjacent layers are primarily held together through hydrogen bonding to water molecules, and are 6.21 Å apart from each other along the -axis, giving rise to a quasi-two-dimensional (2D) structure.
The quasi-2D nature of its layered honeycomb crystal structure and the triangular Fe3+ sublattice make NaMgFe(C2O4)9H2O a favorable material for the display of novel magnetic properties, which led us to speculate whether the Fe3+ sublattice might have an ordered/frustrated magnetic ground state or exhibit single-ion properties. If the spin interactions between Fe3+ ions restricted by the low-dimensional structure are strong, one could expect enhanced spin fluctuations to occur Moessner and Ramirez (2006). Moreover, a geometrically frustrated system, in which the geometry of the lattice prohibits the simultaneous minimization of all interactions can demonstrate exotic phenomena such as spin ice or spin liquid phases. Recent studies of a growing number of newly synthesized 2D frustrated magnetic materials open a world of fascinating magnetic phenomena and quantum phase transitions for analysis and application Schmidt and Thalmeier (2017).
On the other hand, if the Fe-Fe magnetic interactions are negligible, single-ion anisotropy will become the crucial property. Extensive studies of mononuclear, single-molecular magnets during the last two decades have established that the electronic spin and the crystal field (CEF) splitting of individual metal ions govern the magnetic behavior of such systems Woodruff et al. (2013); Meihaus and Long (2015); Bar et al. (2016).
Given these two options, a natural question is what kind of properties and phenomena exist in stepanovite-type structures? In that context, as synthetic stepanovite and stepanovite II have been shown to exhibit considerable proton conduction properties Sadakiyo et al. (2014), it is clear that natural MOF materials might exhibit both the structures and properties of advanced laboratory designed materials. We, therefore, performed inelastic neutron scattering (INS), heat capacity, and magnetization studies on stepanovite II in order to determine the magnetic properties of such a quasi-2D MOF material.
II Results and discussion
II.1 Inelastic Neutron Scattering
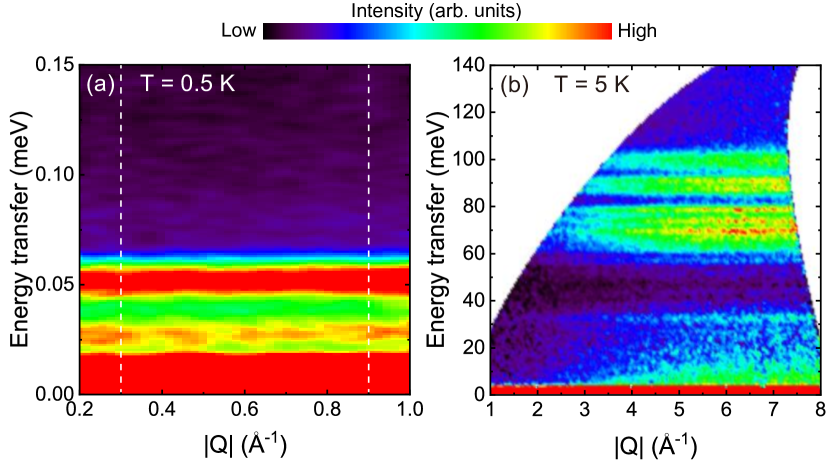
INS experiments on a sample of polycrystalline stepanovite II were performed using three time-of-flight (TOF) spectrometers at the Spallation Neutron Source (SNS) at the Oak Ridge National Laboratory, the fine-resolution Fermi chopper spectrometer (SEQUOIA) Granroth et al. (2010), the Backscattering Spectrometer (BASIS) Mamontov and Herwig (2011), and the Cold Neutron Chopper Spectrometer (CNCS) Ehlers et al. (2011, 2016) (see Appendix A for the details of INS experiments). These instruments cover a wide range of reciprocal and energy space, allowing the study of excitations with a broad energy range from sub-millielectron volt (meV) to electron volt (eV) Stone et al. (2014). In this case, data were obtained on both the energy- and temperature-dependence of the dynamical excitations in stepanovite II. After careful analysis of all the data obtained from three spectrometers, we conclude that only two dispersionless excitations at very low energy transfer, = 0.028(1) and 0.050(1) meV [see Figs. I(a), II.1, and II.1] have a magnetic origin.
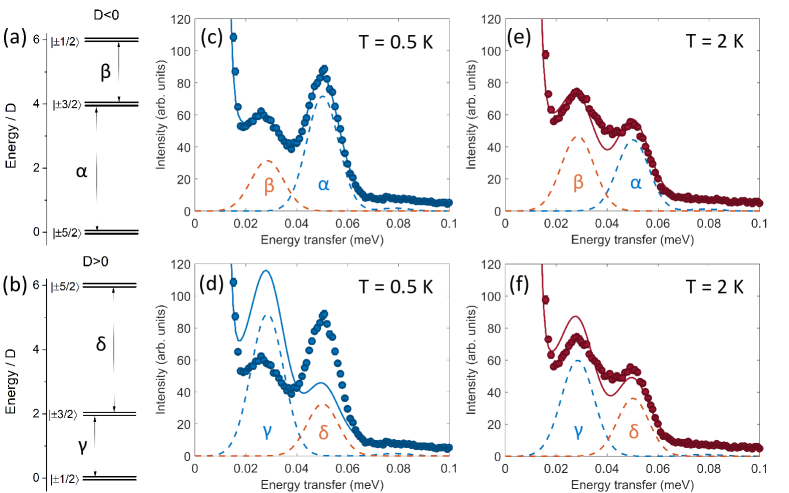
Figure I(a) shows a typical INS spectrum of the low-energy excitations obtained from the CNCS at 0.5 K. Two -independent excitation modes can be seen clearly. The stronger is around 0.05 meV and the weaker is around 0.03 meV. For the INS spectrum collected at 5 K on SEQUOIA [Fig. I(b)], we observed several peaks with intensities that increase with increasing neutron momentum transfer (Q). This is a characteristic of vibrational modes. Although the high-energy INS spectrum contains a great deal of information on translational and librational vibrations of structural water molecules, this work aims to clarify the magnetic properties of stepanovite II and, therefore, we will focus on the low energy part of the INS spectra in this paper.
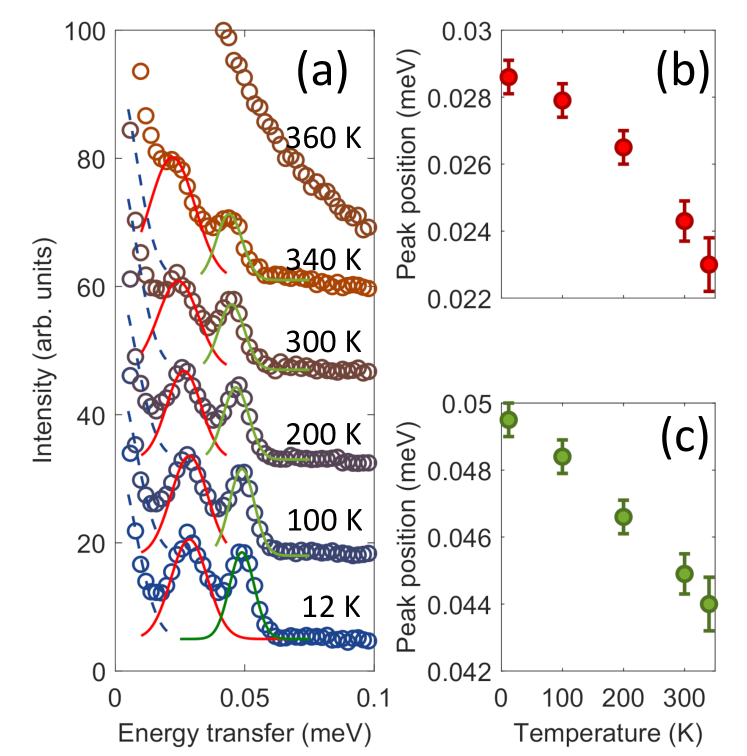
Figure II.1(a) shows the low-energy INS spectra of stepanovite II obtained from the BASIS spectrometer at several temperatures. Two inelastic peaks can be observed around = 0.028(1) and 0.050(1) meV at 12 K. The intensities of both are almost temperature independent in the range of K K. This is because the thermal population of the ground and excited states does not change significantly with temperature when , where is the energy gap between the ground and excited levels (see below). The INS peaks observed on BASIS only disappear at temperatures above the melting point K of NaMgFe(C2O4)9H2O. The results show a slight broadening and shift towards low energies of the peaks with increasing temperature. We fit the INS spectra with two Gaussian functions and extracted the evolution of the peak positions with increasing temperature [see Figs. II.1(b) and II.1(c)]. The peak shifts turn out to be about 20% and 12% for the = 0.028 and 0.050 meV excitations, respectively. We conclude that the magnetic anisotropy is decreased with increasing temperature. The line broadening is most probably caused by local structural disorder, which increases with increasing temperature. To clarify this question, further structural studies are necessary.
In stepanovite II, the Fe3+ ions with a 3 electronic configuration are in octahedral environment, which generates a singlet 6S5/2 Hund’s ground state term. The ground state has no spin-orbit splitting, since the orbital moment is zero. Therefore, the Fe3+ ion has a spin-only ground state = 5/2. The effective spin Hamiltonian can be described as
| (1) | |||||
where and are the axial and rhombic ZFS parameters, is the = 5/2 spin operator, is Bohr magneton, is the Land -factor and is the applied magnetic field Suzuki and Suzuki (2007); Mossin et al. (2002). A negative corresponds to an easy-axis anisotropy (out-of-plane anisotropy), while a positive relates to an easy-plane anisotropy Novitchi et al. (2017). In the absence of magnetic field, the = 5/2 sextet is split into three Kramers doublets, , and . In the case of zero rhombic distortion, the energy splittings between the three doublets are 2, 4 and 6 [see Figs. II.1(a) and II.1(b)] Febbraro (1987). Our experimental data shows slight deviation of the positions of the Kramers doublets from the ideal case. Besides, we observed a weak INS intensity at meV, which corresponds to the transition from the ground to second exited state (Fig. II.1). Thus, the rhombic ZFS parameter has nonzero value.
In order to determine the values of the and parameters in the Hamiltonian (1), and especially the sign of , we analyzed the results obtained at K, where thermal populations of the ground state and excited levels differ considerably, and compared the result with that at K (see Fig. II.1). Since the intensity of the transition from the ground state increases with the decreasing temperature, comparison of the relative peak intensities of the INS spectra at K and K will unambiguously show which Kramers doublet, or , is the lowest energy one. To do so, the INS spectra were simulated by calculating the energies and corresponding wave functions via exact diagonalization of the Hamiltonian (1). For experiments on polycrystalline materials, the INS intensity of the transition from level to level is proportional to the magnetic scattering function as Basler et al. (2003)
| (2) | |||||
where is the total number of spins, , is the neutron energy transfer, , and are spin eigenstates with energy , , and is the Boltzmann population factor. is the line shape of the peak centered at energy transfer , and FWHM is the full width at half maximum of each peak.
In Figs. II.1(c)-II.1(f), we present the experimental INS spectra, together with the calculated spectra for both the 0 [(c) and (e)] and 0 [(d) and (f)] cases. Transitions and correspond to excitations from the ground state to the first excited state, while transitions and are excitations between the thermally populated first excited state and the higher energy second excited state. The excitations are fitted by two Gaussian functions with corresponding energy dependent resolution Ehlers et al. (2011). One can see that the agreement between calculation and experiment is much better for the negative parameter, meaning that the Fe3+ ion has an easy-axis anisotropy with as the ground state. The best fitting for both temperatures, 0.5 and 2 K, was found using the values of meV and meV.
II.2 Heat capacity
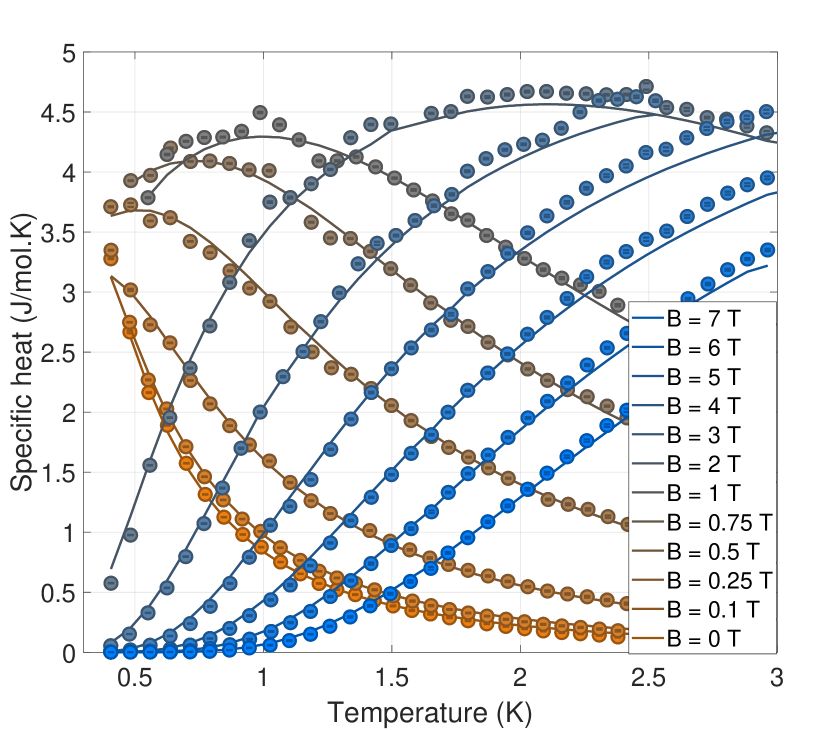
The specific heat is a useful thermodynamic probe, because it is sensitive to low-energy degrees of freedom. For instance, the specific heat of a two-level system exhibits a Schottky anomaly due to thermal population of the excited state, which can be used to precisely determine the splitting energy. For a -level system the expression for the Schottky anomaly can be rewritten as:
| (3) |
where is the universal gas constant, is a set of energy levels (), and is the partition function.
In order to characterize low-energy excitations of stepanovite II, we performed a single-crystal specific heat measurements at different magnetic fields. The results are summarized in Fig. II.2 111Note that the weak phonon contribution was modeled with and subtracted from the data.. No sign of any phase transitions can be observed down to 0.5 K with and without a field present. At zero field, the specific heat shows a strong increase with decreasing temperature. Application of magnetic field induces a broad, Schottky-like peak, which continuously evolves with the increasing field strength.
To describe the observed curves, we diagonalized the Hamiltonian (1). The resultant eigenenergies were substituted into Eq. (3) (we assumed and ). We then performed a global fitting of E and D parameters using all the data obtained. The resulting CEF parameters were found to be = meV, = 0.0013(5) meV. These values are almost identical to those deduced from the INS measurements in Sec. II.1. The calculated curves are shown as solid lines in Fig. II.2. A near perfect agreement was obtained between the calculated and experimental curves, although we had to multiply the calculated curves by a constant scaling prefactor (0.713). This maybe related to the presence of impurities in the sample. This further confirms our previous conclusions concerning the magnetic nature of the excitations around 0.03 meV and 0.05 meV in INS spectra.
II.3 Magnetization
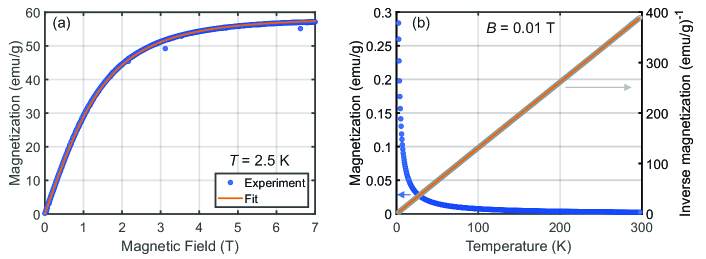
To further characterize the magnetic properties of stepanovite II, we performed measurements of static magnetization on single crystal samples. Figure II.2(a) shows the field dependence of the magnetization measured at K. The curve exhibits a Brillouin-like behavior. To quantify this result we diagonalized the Hamiltonian (1) at each field and calculated the magnetization as:
| (4) |
where and are the eigenvector and eigenvalue of the Hamiltonian, respectively 222We multiplied the calculated curve by constant prefactor to fit the experimental magnetization scale.. The calculated curve is shown in Fig. II.2(a) as a solid line. This agrees well with the experimental data. However, the experimental temperature meV meV. Therefore, the influence of the CEF term is rather weak and the simple Brillouin function for with = 0 also provides a reasonable description of the measured magnetization.
The temperature dependence of the magnetization and inverse magnetization are presented in Fig. II.2(b). The magnetization data display perfect Curie-Weiss behavior. The inverse magnetization is linear over the whole temperature range down to 2 K. Its fitting yields a very small positive Curie-Weiss temperature K, which indicates a very weak dominant ferromagnetic coupling between Fe3+ ions persistent down to low temperatures. The static magnetization, therefore, shows that stepanovite II is paramagnetic.
III Conclusion
In conclusion, we have presented INS, magnetization and heat capacity studies of Fe3+ ions in the oxalate mineral NaMgFe(C2O4)9H2O. The INS spectra show two excitation modes from magnetic transitions between ZFS of ground state multiplets of Fe3+ ions. The results reveal an easy-axis anisotropy of Fe3+ in the stepanovite II, with zero-field parameters meV and meV, which have been further confirmed by the analysis of the heat capacity results. There is no magnetic order down to 0.5 K, which makes the material a pure paramagnet. Note that MOF materials are soft porous crystals displaying large-amplitude structural deformations under external physical constraints such as pressure. Therefore, magnetically ordered ground states due to increased magnetic exchange coupling can occur under appropriate pressures. While no high-pressure studies of NaMgFe(C2O4)9H2O have been reported, we hope that our work will inspire further studies of this quasi-2D MOF material.
Acknowledgments
Work at Oak Ridge National Laboratory was supported by the U.S. Department of Energy (DOE), Office of Science, Basic Energy Sciences, Materials Science and Engineering Division. Work by LMA was supported by the U.S. Department of Energy, Office of Science, Office of Basic Energy Sciences, Chemical Sciences, Geosciences, and Biosciences Division. We would like to thank D.M. Pajerowski and I.A. Zaliznyak for stimulating discussions and J. Yan for the help with magnetic measurements. This research used resources at the Spallation Neutron Source, a DOE Office of Science User Facility operated by the Oak Ridge National Laboratory. X-ray Laue measurement was conducted at the Center for Nanophase Materials Sciences (CNMS) (CNMS2019-R18) at the Oak Ridge National Laboratory (ORNL), which is a DOE Office of Science User Facility.
This paper has been authored by UT-Battelle, LLC under Contract No. DE-AC05-00OR22725 with the U.S. Department of Energy. The United States Government retains and the publisher, by accepting the article for publication, acknowledges that the United States Government retains a non-exclusive, paid-up, irrevocable, world-wide license to publish or reproduce the published form of this manuscript, or allow others to do so, for United States Government purposes. The Department of Energy will provide public access to these results of federally sponsored research in accordance with the DOE Public Access Plan (http://energy.gov/downloads/doe-public-access-plan).
Appendix A Technical Details
Synthetic stepanovite II NaMgFe(C2O4)9H2O was obtained by reacting Fe2O3 and MgO with aqueous NaOH and oxalic acid Huskić et al. (2016). After 2 days, the solution yielded green crystals with a trigonal habit about a millimeter across.
The INS data were collected from a polycrystalline sample with a mass of around 3.0 g using the BASIS, SEQUOIA and CNCS TOF spectrometers Stone et al. (2014). The incident neutron energy for every measurement was chosen to cover the anticipated region of interest in both energy transfer and scattering-vector spaces. A low incident energy is especially important to observe excitations close to the elastic peak as the energy resolution is typically % of the incident energy. For the SEQUOIA and BASIS measurements the sample was mounted in a standard closed cycle refrigerator (CCR) with a base temperature of K. A standard Orange cryostat with 3He-refrigerator insert was used at the CNCS in order to expand the low temperature range to K. The was fixed at 800, 600, 250, 160 and 55 meV (SEQUOIA), and = 1.55 meV (CNCS). The range was 0.2 2.0 Å-1 for BASIS and 0.1 1.1 Å-1 for CNCS. Vanadium was used as a standard for the detector efficiency correction.
The thermodynamic measurements were performed using single-crystalline samples with masses of 2 4 mg and the applied magnetic field was perpendicular to the -axis. Magnetization was measured using a vibrating sample magnetometer MPMS SQUID VSM, Quantum Design in the temperature range 2 300 K. Specific-heat measurements were carried out using a commercial PPMS-6000 instrument from Quantum Design equipped with 3He insert to reach temperatures as low as 0.4 K
References
- Huskić et al. (2016) Igor Huskić, Igor V. Pekov, Sergey V. Krivovichev, and Tomislav Friščić, “Minerals with metal-organic framework structures,” Science Advances 2 (2016), 10.1126/sciadv.1600621.
- Kirchon et al. (2018) A. Kirchon, L. Feng, H. F. Drake, E. A. Joseph, and H.-C. Zhou, “From fundamentals to applications: a toolbox for robust and multifunctional MOF materials,” Chem. Soc. Rev. 47, 8611–8638 (2018).
- Echigo and Kimata (2010) T. Echigo and M. Kimata, “Crystal chemistry and genesis of organic minerals: A review of oxalate and polycyclic aromatic hydrocarbon minerals,” Can. Mineral. 48, 1329–1357 (2010).
- Piro et al. (2016) O. E. Piro, G. A. Echeverría, A. C. González-Baró, and E. J. Baran, “Crystal and molecular structure and spectroscopic behavior of isotypic synthetic analogs of the oxalate minerals stepanovite and zhemchuzhnikovite,” Phys. Chem. Miner. 43, 287–300 (2016).
- Knipovich et al. (1963) Y. N. Knipovich, A. I. Komkov, and E. I. Nefedov, “On stepanovite and the new mineral zhemchuzhnikovite,” Trudy Vses. Nauchno-Issled. Geol. Inst. (in Russian) 96, 131–135 (1963).
- Huskić et al. (2019) I. Huskić, N. Novendra, D.-W. Lim, F. Topić, H. M. Titi, I. V. Pekov, S. V. Krivovichev, A. Navrotsky, H. Kitagawa, and T. Friščić, “Functionality in metal–organic framework minerals: proton conductivity, stability and potential for polymorphism,” Chem. Sci. 10, 4923–4929 (2019).
- Moessner and Ramirez (2006) R. Moessner and A. P. Ramirez, “Geometrical frustration,” Phys. Today 59, 24–29 (2006).
- Schmidt and Thalmeier (2017) B. Schmidt and P. Thalmeier, “Frustrated two dimensional quantum magnets,” Physics Reports 703, 1 – 59 (2017).
- Woodruff et al. (2013) D. N. Woodruff, R. E. P. Winpenny, and R. A. Layfield, “Lanthanide single-molecule magnets,” Chem. Rev. 113, 5110–5148 (2013).
- Meihaus and Long (2015) K. R. Meihaus and J. R. Long, “Actinide-based single-molecule magnets,” Dalton Trans. 44, 2517–2528 (2015).
- Bar et al. (2016) A. K. Bar, C. Pichon, and J.-P. Sutter, “Magnetic anisotropy in two- to eight-coordinated transition–metal complexes: Recent developments in molecular magnetism,” Coord. Chem. Rev. 308, 346 – 380 (2016).
- Sadakiyo et al. (2014) M. Sadakiyo, T. Yamada, K. Honda, H. Matsui, and H. Kitagawa, “Control of Crystalline Proton-Conducting Pathways by Water-Induced Transformations of Hydrogen-Bonding Networks in a Metal-Organic Framework,” J. Am. Chem. Soc. 136, 7701–7707 (2014).
- Granroth et al. (2010) G. E. Granroth, A. I. Kolesnikov, T. E. Sherline, J. P. Clancy, K. A. Ross, J. P. C. Ruff, B. D. Gaulin, and S. E. Nagler, “SEQUOIA: a newly operating chopper spectrometer at the SNS,” J. Physics: Conference Series 251, 012058 (2010).
- Mamontov and Herwig (2011) E. Mamontov and K. W. Herwig, “A time-of-flight backscattering spectrometer at the Spallation Neutron Source, BASIS,” Rev. Sci. Instrum. 82, 085109 (2011).
- Ehlers et al. (2011) G. Ehlers, A. Podlesnyak, J. L. Niedziela, E. B. Iverson, and P. E. Sokol, “The new cold neutron chopper spectrometer at the spallation neutron source: design and performance,” Rev. Sci. Instrum. 82, 085108 (2011).
- Ehlers et al. (2016) G. Ehlers, A. Podlesnyak, and A. I. Kolesnikov, “The cold neutron chopper spectrometer at the Spallation Neutron Source - A review of the first 8 years of operation,” Rev. Sci. Instrum. 87, 093902 (2016).
- Stone et al. (2014) M. B. Stone, J. L. Niedziela, D. L. Abernathy, L. DeBeer-Schmitt, G. Ehlers, O. Garlea, G. E. Granroth, M. Graves-Brook, A. I. Kolesnikov, A. Podlesnyak, and B. Winn, “A comparison of four direct geometry time-of-flight spectrometers at the spallation neutron source,” Rev. Sci. Instrum. 85, 045113 (2014).
- Suzuki and Suzuki (2007) M. Suzuki and I. S. Suzuki, Lecture note on solid state physics spin hamiltonian of transition metal ions in crystal field (State University of New York at Binghamton, Binghamton New York 13902-6000, U.S.A, 2007).
- Mossin et al. (2002) S. Mossin, H. Weihe, and A.-L. Barra, “Is the Axial Zero-Field Splitting Parameter of Tetragonally Elongated High-Spin Manganese(III) Complexes Always Negative?” J. Am. Chem. Soc. 124, 8764–8765 (2002).
- Novitchi et al. (2017) G. Novitchi, S. Jiang, S. Shova, F. Rida, I. Hlavička, M. Orlita, W. Wernsdorfer, R. Hamze, C. Martins, N. Suaud, N. Guihéry, A.-L. Barra, and C. Train, “From Positive to Negative Zero-Field Splitting in a Series of Strongly Magnetically Anisotropic Mononuclear Metal Complexes,” Inorg. Chem. 56, 14809–14822 (2017).
- Febbraro (1987) S. Febbraro, “Zero-field splitting of 3d5 () ions in axial symmetry: correlation with the Racah and ligand-field parameters,” J. Phys. C: Solid State Phys. 20, 5367–5380 (1987).
- Basler et al. (2003) R. Basler, C. Boskovic, G. Chaboussant, H. U. Güdel, M. Murrie, S. T. Ochsenbein, and A. Sieber, “Molecular spin clusters: New synthetic approaches and neutron scattering studies,” ChemPhysChem 4, 910–926 (2003).
- Note (1) Note that the weak phonon contribution was modeled with and subtracted from the data.
- Note (2) We multiplied the calculated curve by constant prefactor to fit the experimental magnetization scale.
- Azuah et al. (2009) R. Azuah, L. Kneller, Y. Qiu, P. Tregenna-Piggott, C. Brown, J. Copley, and R. Dimeo, “DAVE: a comprehensive software suite for the reduction, visualization, and analysis of low energy neutron spectroscopic data,” J. Res. Natl. Inst. Stan. Technol. 114, 341 (2009).
- Arnold et al. (2014) O. Arnold, J. C. Bilheux, J. M. Borreguero, A. Buts, S. I. Campbell, L. Chapon, M. Doucet, N. Draper, R. F. Leal, M. A. Gigg, et al., “Mantid – Data analysis and visualization package for neutron scattering and SR experiments,” Nucl. Instrum. Methods Phys. Res. Sect. A 764, 156 (2014).