∎
Performance of the ReD TPC, a novel double-phase LAr detector with Silicon Photomultiplier Readout
Abstract
A double-phase argon Time Projection Chamber (TPC), with an active mass of 185 g, has been designed and constructed for the Recoil Directionality (ReD) experiment. The aim of the ReD project is to investigate the directional sensitivity of argon-based TPCs via columnar recombination to nuclear recoils in the energy range of interest (20–200 keVnr) for direct dark matter searches. The key novel feature of the ReD TPC is a readout system based on cryogenic Silicon Photomultipliers (SiPMs), which are employed and operated continuously for the first time in an argon TPC. Over the course of six months, the ReD TPC was commissioned and characterised under various operating conditions using -ray and neutron sources, demonstrating remarkable stability of the optical sensors and reproducibility of the results. The scintillation gain and ionisation amplification of the TPC were measured to be photoelectrons/photon and photoelectrons/electron, respectively. The ratio of the ionisation to scintillation signals (S2/S1), instrumental for the positive identification of a candidate directional signal induced by WIMPs, has been investigated for both nuclear and electron recoils. At a drift field of 183 V/cm, an S2/S1 dispersion of 12% was measured for nuclear recoils of approximately 60-90 keVnr, as compared to 18% for electron recoils depositing 60 keV of energy. The detector performance reported here meets the requirements needed to achieve the principal scientific goals of the ReD experiment in the search for a directional effect due to columnar recombination. A phenomenological parameterisation of the recombination probability in LAr is presented and employed for modeling the dependence of scintillation quenching and charge yield on the drift field for electron recoils between 50–500 keV and fields up to 1000 V/cm.
Keywords:
Time Projection Chamber Silicon Photomultipliers Noble liquid detectors1 Introduction
Experiments searching for weakly interacting massive particles (WIMPs) play a central role in the multifaceted effort aiming to shed light on the nature and properties of dark matter in the Universe. Of the various technologies and target materials currently used to directly detect WIMPs, liquid argon (LAr) is particularly well suited since it permits powerful background rejection via pulse shape discrimination Amaudruz:2016dq and additional background reduction via the use of low-radioactivity argon from underground sources Galbiati:2007xz ; Aalseth:2020nwt . To exploit these advantages to their maximum potential, the Global Argon Dark Matter Collaboration (GADMC) is pursuing a multi-staged program to deploy a sequence of argon-based detectors that will progressively improve sensitivity to WIMPs by several orders of magnitude and ultimately reach the “neutrino floor”, where coherent elastic neutrino interactions become a significant source of background to WIMP searches. The near-term objective of the GADMC is the DarkSide-20k experiment Aalseth:2017fik , a double-phase argon Time Projection Chamber (TPC) currently under construction at the INFN Gran Sasso National Laboratory (LNGS). DarkSide-20k will be the first large-scale experiment to employ 1) argon extracted from underground reservoirs and 2) a readout system based on Silicon Photomultipliers (SiPMs), fulfilling two key ingredients of the GADMC program. An additional asset to the GADMC program would be to demonstrate the directional sensitivity of argon-based TPC technology, since directional information provides a unique handle for discriminating against otherwise-irreducible backgrounds and is an essential requisite for correlating a candidate signal with an astrophysical phenomenon in the celestial sky Cadeddu:2017ebu . Hints of such directional sensitivity have been observed by the SCENE experiment Cao:2014gns .
Here we report on the operation and characterisation of a double-phase argon TPC developed for the Recoil Directionality (ReD) experiment, a part of the programme pursued by the DarkSide Collaboration. The main scientific goal of the ReD project is to investigate the directional sensitivity and performance of LAr TPC technology in the energy range of interest for WIMP-induced nuclear (Ar) recoils (20–200 keVnr).
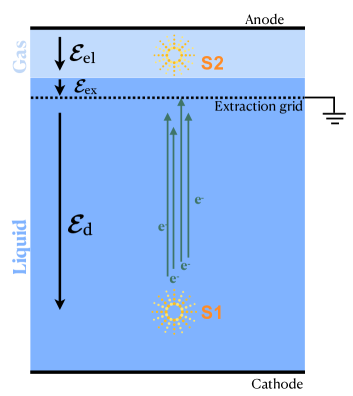
The ReD TPC, like any generic double-phase noble liquid TPC, consists of a volume filled with a liquid target, above which lies a thin layer of the same element in the gaseous phase (the “gas pocket”) in equilibrium with the layer below, as illustrated in Fig. 1. When an ionising particle deposits energy in the liquid volume, target atoms are excited and ionised, creating excitons and electron-ion pairs. The excitons emit scintillation light, as do a fraction of the electron-ion pairs that recombine; this signal is referred to as S1. The electrons surviving recombination are then drifted towards the liquid-gas boundary, extracted into the gas phase, and accelerated in the gas pocket by a suitable electric field with magnitudes (drift field), (extraction field), and (electroluminescence field), respectively. The acceleration of electrons by the electric field in the gas pocket produces a secondary signal composed of electroluminescent light Buzulutskov:2020xhd and referred to as S2, whose amplitude is proportional to the number of electrons surviving recombination and whose delay with respect to S1 is equal to the time needed for the electrons to drift through the liquid. Both S1 and S2 signals are detected by photosensors externally viewing the active volume.
The potential directional sensitivity of a double-phase TPC stems from the dependence of columnar recombination on the alignment of the recoil momentum with respect to the drift field Cataudella:2017kcf . To further investigate this process, the ReD detector was irradiated with neutrons of known energy and direction, produced via p(7Li,7Be)n by the TANDEM accelerator at the INFN LNS laboratory in Catania. Monte Carlo (MC) simulations were used to define and benchmark detector performance requirements needed to conclusively identify a directional effect with a size as reported by the SCENE collaboration. They include: scintillation gain () greater than approximately 0.2 photoelectrons/photon; ionisation amplification () greater than 15 photoelectrons/electron; and S2/S1 dispersion better than approximately 10-15% for nuclear recoils with 70 keVnr. These performance specifications are measured and evaluated with the ReD detector discussed here.
The ReD TPC shares several key characteristics of the future DarkSide-20k experiment, including some elements of the mechanical design, but on a smaller scale. The main technological advance is a readout system based entirely on SiPMs, which offer the possibility of a higher photon detection efficiency relative to typical cryogenic photomultipliers Aalseth:2017fik ; Rossi_2016 ; Aalseth:2020zdm . The ReD detector discussed here is the first double-phase argon TPC read out by SiPMs to be stably operated on the time scale of months and fully characterised with neutron and sources. In the future, the ReD TPC could also be used to characterise the response of the detector to very low-energy nuclear recoils (below a few keV), a potential signature of light WIMPs with masses of a few GeV/c2, as studied by the predecessor DarkSide-50 experiment Agnes:2015gu ; Agnes:2015ftt ; Agnes:2018ves . Measurements by ReD could be used to improve the understanding of ionisation models for future searches in such uncharted regimes.
The ReD TPC data reported here were taken at the INFN “CryoLab” at the University of Naples Federico II, while operating continuously between 7 June 2019 and 18 November 2019 (165 days). This paper is organised as follows: the ReD TPC and the experimental setup are described in Sec. 2. Sec. 3 reports on the response of the SiPMs to single photons and the corresponding calibration procedure. The performance and response of the TPC to scintillation light is described in Sec. 4, while Sec. 5 reports on the characterisation of the combined scintillation-ionisation response. The dependence of S1 and S2 on the drift field, for up to 1000 V/cm, is discussed in Sec. 6. Conclusions and a summary are presented in Sec. 7.
2 Experimental setup
The experimental setup includes the TPC and also the readout, data acquisition, cryogenic and control systems needed to operate the complete system. Here we give a detailed description of each component.
2.1 TPC
The heart of the ReD experiment is the TPC, illustrated in Fig. 2.
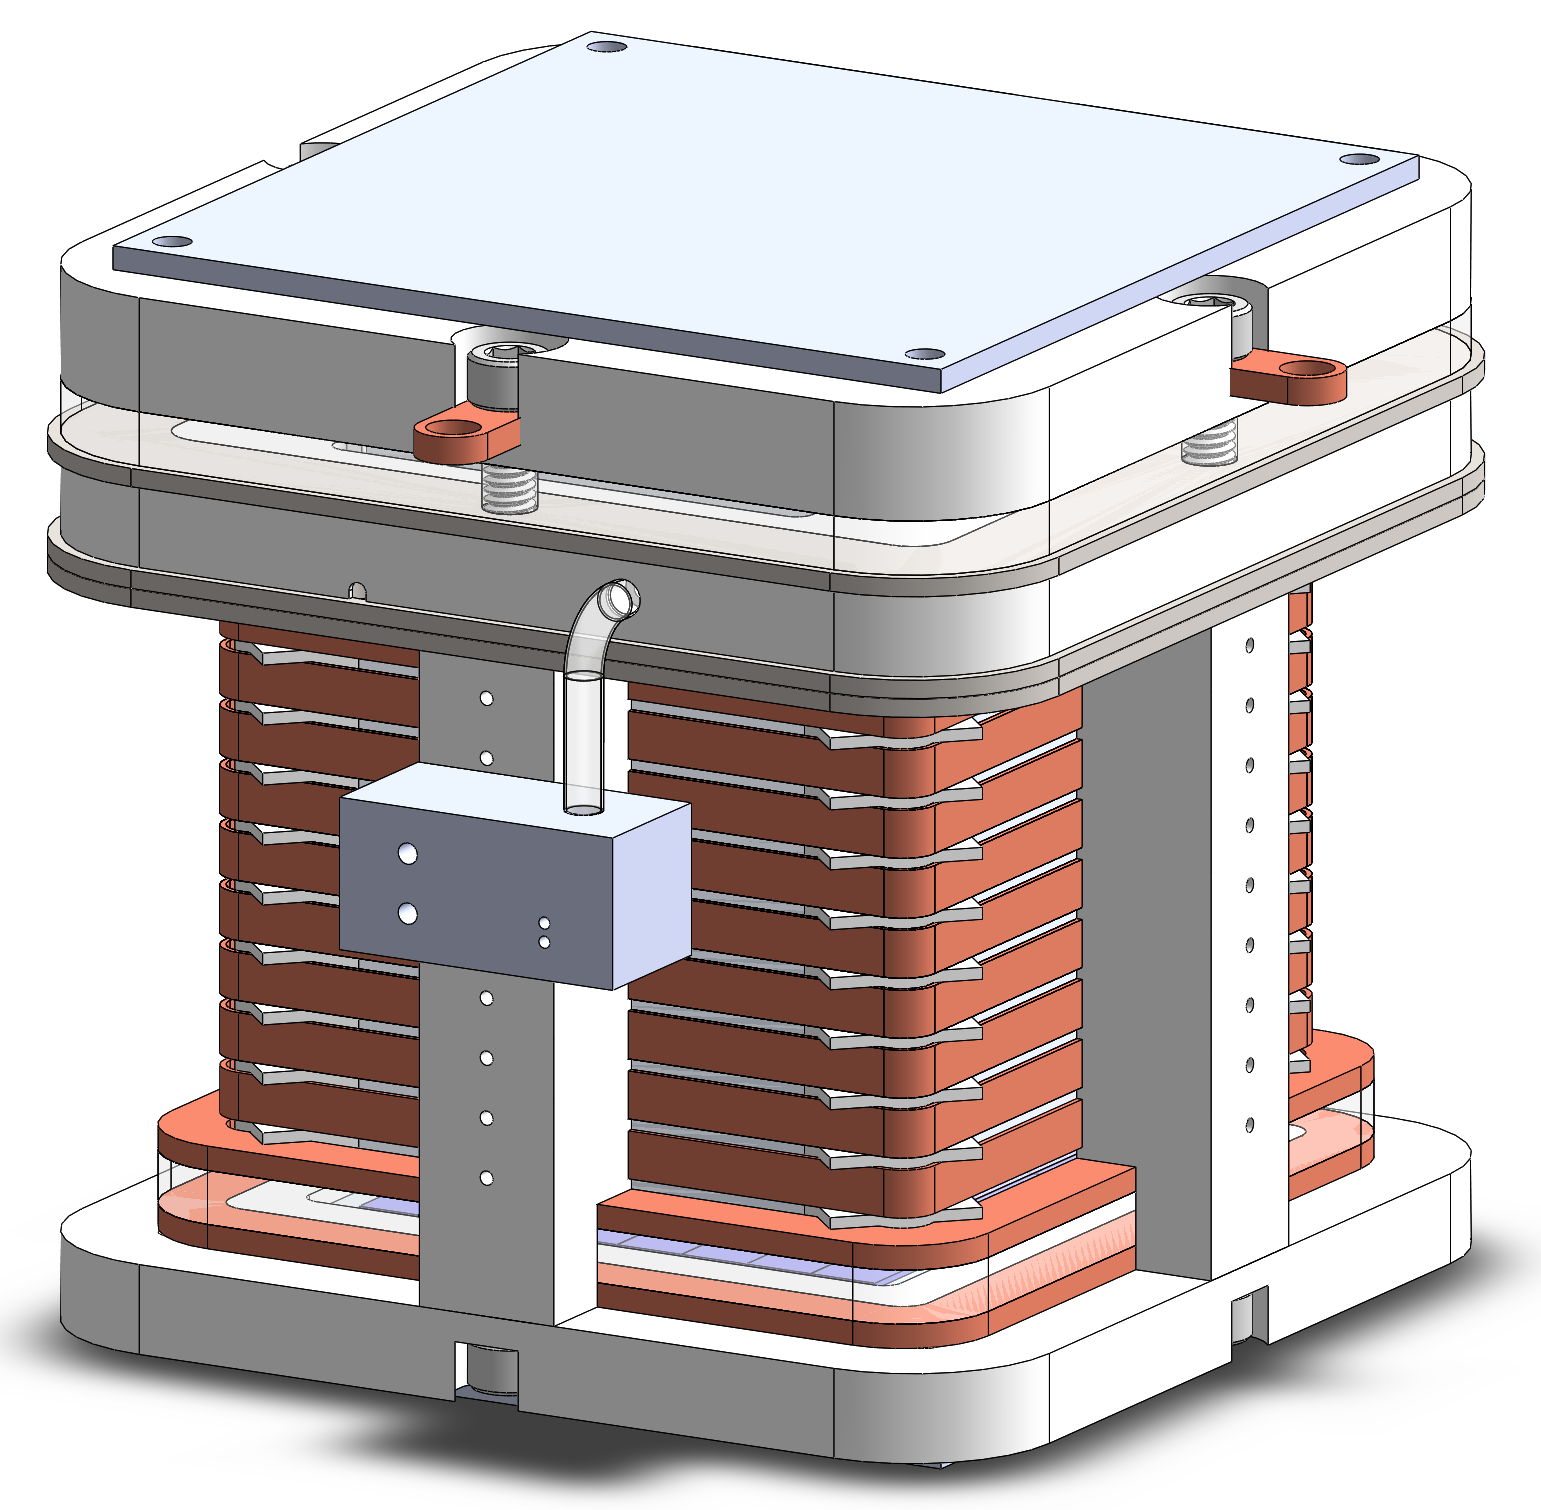
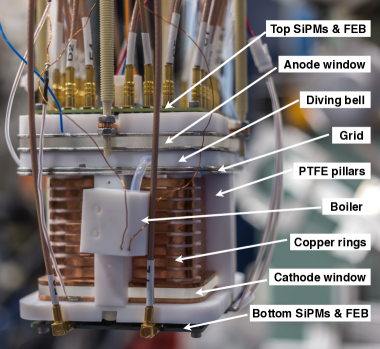
The active volume is a cuboid of 5 cm 5 cm 6 cm (l w h). It is delimited by two 4.5-mm-thick acrylic windows on top and bottom, while the side walls are composed of two 1.5-mm-thick acrylic plates, interleaved with 3M™ enhanced specular reflector foil. The top and bottom windows are covered on both sides by a 25-nm-thick transparent conductive layer of indium tin oxide (ITO), which allows the windows to serve as electrodes (anode and cathode) via the application of an electric potential. The extraction grid is made of 50-µm-thick stainless steel etched mesh, with 1.95-mm-wide hexagonal cells and an optical transparency of 95%. It is located 10 mm below the top acrylic window. All TPC parts are locked together by eight PTFE pillars and two PTFE square frames (top and bottom) that host the photosensors. A third PTFE frame for the gas pocket is inserted between the anode window and the grid. Since the photons emitted by argon scintillation have a wavelength of 128 nm, outside the sensitive region of typical photosensors, they are first converted into visible light for detection. The internal surfaces of the TPC are therefore fully covered with a () µg/cm2 layer of tetraphenyl butadiene (TPB), which acts as a wavelength shifter and re-emits photons at 420 nm, to which the photosensors have optimal sensitivity.
The TPC can be operated in single-phase mode, as a scintillation-only detector with the inner volume entirely filled with 185 g of LAr, or alternatively in double-phase mode, with the additional presence of a gas pocket. The gas pocket is created by a boiler that consists of a platinum resistance temperature sensor (Pt-1000 RTD) acting as a heater, enclosed in a PTFE box located on one of the external pillars and powered at 20 V. The height of the gas pocket is mechanically fixed at 7 mm due to a hole located in one of the side walls above the grid. When operated in double-phase mode, the TPC has a maximum drift length of 50 mm (equal to the distance between the cathode and grid), in addition to a ()-mm-thick LAr layer above the grid and a ()-mm-thick gas pocket.
The electric field within the TPC is generated by applying voltage independently to the anode and cathode using a CAEN N1470 HV power supply module, while keeping the extraction grid at ground. To improve the uniformity of the field in the drift region, the TPC walls are externally surrounded by a field cage composed of nine horizontal copper rings connected via a chain of resistors and spaced 0.5 cm apart. Voltage is applied independently to the first ring, closest to the grid. The electric field differs in magnitude between the extraction region above the grid and the gas pocket due to the different dielectric constants of liquid and gaseous argon, taken here as and Amey1964 , respectively.
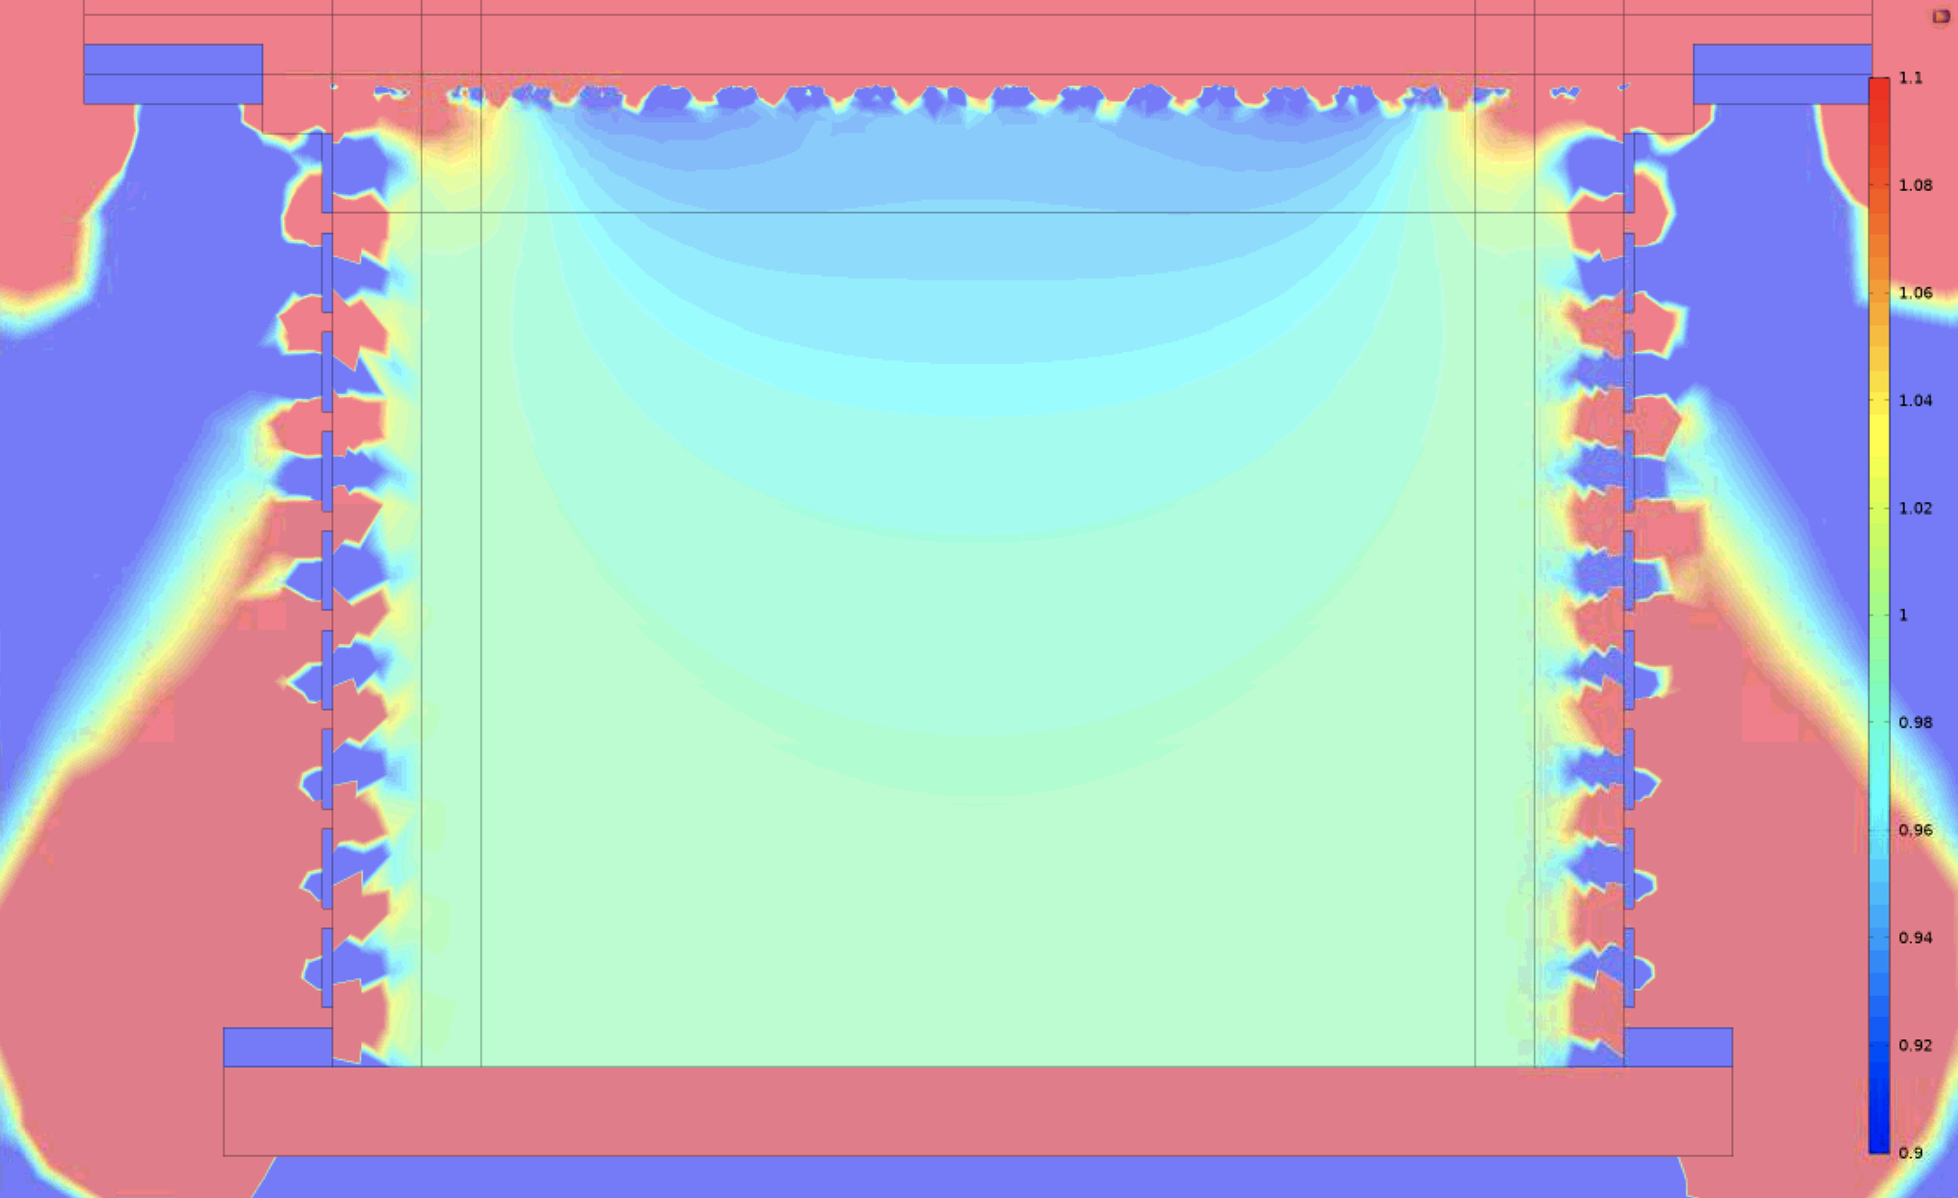
Voltage settings corresponding to V/cm were originally selected by means of a simplified simulation of the ReD TPC in COMSOL® COMSOL , while actual average field values in each of the three regions were calculated a posteriori using a fully detailed model of the detector including the three-dimensional structure of the mesh. The difference in the calculated drift field between the simplified and full simulations is negligible at high fields and becomes progressively larger for lower fields, reaching up to 20% at the lowest studied value of 100 V/cm. For the reference voltage configuration discussed in this work, V (anode), V (first ring) and V (cathode), a drift field of 200 V/cm was obtained using the simplified COMSOL simulation, while the full simulation calculated V/cm in the inner part of the TPC. Fig. 3 shows a map of the electric field within the TPC for the reference voltage configuration, relative to the average value of 183 V/cm in the drift region. Field inhomogeneities were found to be significant (up to 20%) only for low-field configurations. For all double-phase data presented here, the extraction and electroluminescence fields were calculated as ) kV/cm and kV/cm, respectively, sufficiently strong to fully extract all electrons from the liquid to gas phase Chepel:2012sj . Since and are determined mostly by the anode voltage and the thickness of the gas pocket, the difference in the calculated values between the simplified and full simulations was found to be below 3%.
2.2 Silicon photomultipliers and readout system
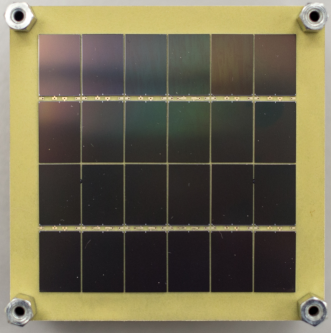
Customised NUV-HD-Cryo SiPMs Gola:2019idb , developed specifically for the DarkSide project by Fondazione Bruno Kessler (FBK), are used to detect the light signals in the ReD TPC. They have a maximum photon detection efficiency at 420 nm (% at room temperature) and a high-density distribution of Single Photon Avalanche Diodes (SPADs) sipmnuv:2017 . The ReD SiPMs are characterised by a triple doping concentration, 25-µm cell pitch and 10 M\textOmega quenching resistance at cryogenic temperature. Each SiPM measures 11.7 mm 7.9 mm and is assembled onto a 5 cm 5 cm tile with 24 devices. One tile is positioned at the top of the TPC and one tile at the bottom, behind their respective acrylic windows. Since the position of an S2 event in the gas pocket provides a reasonable estimate of the - coordinate of the corresponding interaction point in the TPC, the 24 SiPMs of the top tile are read out individually for improved spatial resolution, while those of the bottom tile are summed in groups of six.
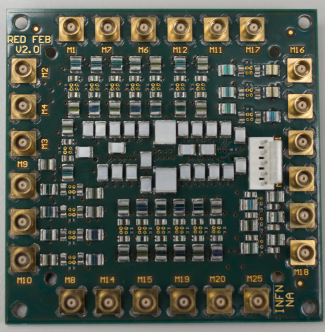
The Front-End Boards (FEBs) supply power to the photosensors and amplify the output signals at cryogenic temperature. Each SiPM is operated at a fixed bias voltage of 34 V, corresponding to 7 V of overvoltage with respect to the breakdown voltage. The FEBs employ a low-noise amplifier coldpreamp:2018 developed specifically to ensure optimal performance of the device at its normal working temperature of 87 K and whose design is based on a high-speed, ultra-low-noise operational amplifier (LMH6629SD) from Texas Instruments. Due to the differing readout schemes, the FEBs for the top and bottom tiles are distinct. The top FEB handles each SiPM independently: the common bias voltage is distributed to the 24 devices and the signals are read and amplified one-by-one. The bottom FEB operates four quadrants, each made of three branches with two SiPMs in series tile:2018 . 68 V ( V) are distributed to each of the three branches and the six SiPM signals are summed and amplified, giving a total of four output channels. Fig. 4 shows the top tile with 24 SiPMs and the corresponding 24-channel FEB.
2.3 Data acquisition
The data acquisition system for the ReD TPC is based on two CAEN V1730 Flash ADC Waveform Digitizers, for a total of 32 acquisition channels, of which 28 are used for reading out the SiPMs. Signals are digitised with 14-bit resolution at a sampling rate of 500 MHz. Upon receiving a trigger, data are saved in internal buffers, then asynchronously transferred to a Linux data acquisition server via an optical link connected to an A2818 CAEN PCI controller. The software was built upon a package developed for the PADME experiment Leonardi_2017 and is based on the CAEN Digitizer Libraries. A centralised server controls several independent readout processes, one for each board. Event building is performed offline at the event reconstruction stage. The trigger is implemented via the logic of the digitizer boards and generally consists of (at least) two independent signals from the logical OR of the two pairs of readout channels on the bottom tile. The default trigger condition requires a coincidence within 200 ns of these two trigger signals with an individual threshold set approximately at 2 photoelectrons (PE). This trigger is fully efficient for signals above 100 PE.
2.4 Cryogenic system and control infrastructure
The ReD detector has a dedicated cryogenic system designed to liquify and continuously purify evaporated argon gas from the cryostat. The cryostat is first filled with research-grade gaseous argon (N6.0), which is then cooled by means of a Cryomech PT90 cold head. After the initial cooling of the TPC and cryostat, the LAr level is monitored by means of two Pt-1000 RTDs mounted inside the cryostat. Given the thermal load of the system, the filling procedure, starting from the aperture of the Ar gas bottle to the accumulation of 30 cm of LAr takes approximately 12 hours. Once the cryostat is filled, the argon gas source is excluded and the system is switched to recirculation mode. The system then operates in a closed loop: the argon from the cryostat ullage is extracted by a dry pump, pushed through a SAES hot getter for purification and finally re-condensed back into the cryostat.
All detectors and sensors described above can be operated and read out remotely by means of a slow control system that allows a user to perform basic operations via a graphical user interface (GUI), e.g. enabling/disabling the voltage delivered by an instrument. By connecting each individual component to a NI-PXIe-8840 controller, the slow control system continuously monitors all operating parameters and stores them in a database. The slow control software is written in LabVIEW LabView , with each instrument piloted by its own stand-alone application.
3 Photosensors and single-photoelectron response
The Single photoElectron Response (SER) of the ReD TPC is studied using a Hamamatsu PLP-10 pulsed diode laser with a wavelength of 403 nm, externally triggered at 100 Hz. Pulse emissions of 50 ps are delivered to the inner volume of the TPC via optical fibres and the signal responses from each of the 28 SiPM readout channels are digitised inside an acquisition window of 20 µs. Laser calibrations were regularly performed during the 165 days of continuous operation of the system.
The charge measured by each SiPM is calculated offline by integrating the digitised waveform, following subtraction of the average baseline, over a fixed window of 4 µs starting 600 ns before the external trigger time. Data are also processed by applying a more CPU-intensive digital filtering technique that allows the counting of single photoelectrons. The filter deconvolves the response function of the SiPM and the filtered signal is then scanned for photoelectron peaks. The peak identification is performed by the find_peaks algorithm from the SciPy libraries 2020SciPy-NMeth ; SciPy ; the algorithm also estimates the peak “prominence”, defined as the height of the filtered peak. The total prominence summed over all peaks is then taken as a proxy of the number of detected photoelectrons.
The charge and prominence distributions obtained from a typical laser calibration run for a top SiPM are shown in Fig. 5. The distributions are shown in number of photoelectrons (PE), following the procedure described below. Note that the prominence method does not produce the pedestal peak at , which is by contrast visible in the charge distribution.
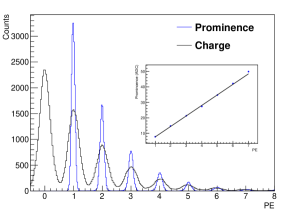
The individual spectra are fitted with a sum of Gaussian distributions to model the response to photoelectrons. A linear fit on the mean value of each peak vs. the number of photoelectrons is then performed and the SER is evaluated as the slope of this line, as shown in the inset of Fig. 5. The standard deviation of the single-photon peak is 0.16 (0.20) PE for the charge distribution of bottom (top) channels; the prominence method gives a significantly better resolution, with (0.057) PE for the bottom (top) tile.
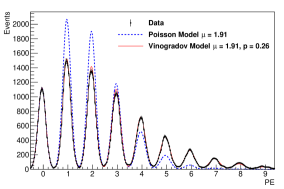
Due to the effects of afterpulsing and crosstalk, the response of a SiPM to excitation by a primary photon corresponds on average to the measurement of more than one photoelectron111In this work, photons are the quanta of energy incident on the SiPM, while photoelectrons are the quanta of energy measured by the SiPM. in the SiPM. In this respect, the probability to detect photoelectrons does not follow a Poisson distribution; it can instead be described by the Vinogradov model vinogradov2009 , which employs a compound Poisson distribution
| (1) |
where is the mean number of primary photoelectrons, is the probability for a primary photoelectron to trigger a secondary emission in the SiPM, and the coefficient is
Defining the coefficient of duplication , the value (1+) then represents the total number of photoelectrons detected for each primary photon that induces an excitation in the SiPM. The parameters and of the Vinogradov model of Eq. 1 are calculated by running a maximum likelihood fit on the amplitude distribution of the photoelectron peaks from Fig. 5. The output of the fit is shown in Fig. 6: data from a bottom channel are superimposed with a Poisson distribution (, ) and a compound Poisson distribution ( and ). Typical values of obtained for the individual channels range between 0.31 and 0.37, with statistical uncertainties from the fit of approximately 3%. The effect due to afterpulsing beyond the 4 µs integration window is evaluated to be well below the statistical uncertainty.
The relative fluctuation of the SER values, calculated from all 42 available laser calibrations, is 0.7% (1.0%) rms for bottom (top) channels. This is consistent with the level of temporal variation in the output voltage of the power supply. Variations of the SER between consecutive laser calibrations are well below 2% for all channels, except for two SiPMs of the top tile that occasionally exhibited variations up to 6–7%. The relative fluctuation on over time are 3.0% (3.6%) rms for bottom (top) channels and are the same order of magnitude as the typical statistical uncertainties of the individual fits.
The SiPM bias circuit contains series resistors that cause an effective reduction of the overvoltage applied to the SiPMs when the leakage current of the devices is high. This typically occurs when the SiPMs are exposed to a significant amount of light, e.g. due to a high interaction rate from intense radioactive sources or to large S2 signals from high multiplication in the gas. Currents recorded by the slow control system range from µA at null field (in absence of S2) up to 11 (18) µA in specific high-field configurations for the bottom (top) tile. The drop in overvoltage causes a reduction of the SiPM gain and SER, which must be properly taken into account. The correction is approximately 0.5%/µA, derived from studies of isolated photoelectrons and the dark count rate, and including also the known variation of the gain and photon detection efficiency as a function of overvoltage. At the highest field value reported here, the maximum applied correction to the overall TPC light response is below 5%.
4 Scintillation (S1) response
Measurements of the TPC response were performed by irradiating the detector with an external 241Am source, which emits monoenergetic 59.54 keV -rays. The scintillation response is studied by operating the TPC in single-phase mode, i.e. filled with liquid only, and at null field (). For each trigger, signals from the 28 SiPM readout channels are acquired for a total of 20 µs, 30% of which contains pre-trigger data used for a precise calculation of the baseline. Individual traces are then baseline subtracted, corrected for the different gains of the SiPMs, and summed. The summed waveform is scanned by a pulse-finder algorithm to search for signals. Scintillation signals from electron recoils larger than 20 PE are efficiently identified by the algorithm. Once a candidate signal is found, its associated time is taken as that corresponding to the constant fraction value of 70% of the maximum. The S1 signal is evaluated by using the total charge measured by the SiPM: the voltage signals are integrated in a 12 µs window starting 3 µs before the associated time; the longer integration gate with respect to laser calibrations is necessary to account for the scintillation light emitted by the argon triplet state, which has a time constant of approximately 1.6 µs.
As previously observed in DarkSide-50 Agnes:2017cl , the distribution of photons on the top and bottom tiles depends on the position of the primary scintillation event along the drift () axis. The top-bottom asymmetry (TBA) is defined as
| (2) |
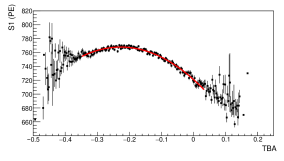
where and are the S1 signals globally detected by the top and bottom channels, respectively. The TBA is thus a measure of the asymmetry in the S1 signal collected by the top and bottom tiles and is therefore correlated with the position of the event. Fig. 7 shows the S1 scintillation signal as a function of TBA for an 241Am calibration run taken in single-phase mode at null field. Events are required to have only one scintillation signal in the entire acquisition window and an S1 signal compatible with the full absorption of the 59.54 keV photon from 241Am. As can be seen in Fig. 7, the size of the S1 signal varies with TBA. To correct for this effect, the distribution is fitted with a second-order polynomial and the measured S1 signals are scaled event-by-event according to the fit, resulting in a flat distribution.
In general, the light yield () is calculated as the number of photoelectrons detected per unit of deposited energy. To account for secondary emissions due to crosstalk and afterpulsing (see Sec. 3), the corrected light yield is calculated from the raw, measured light yield according to
| (3) |
where is the channel-averaged duplication factor.
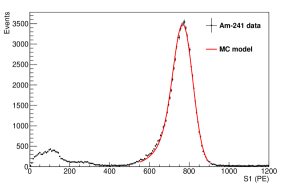
The S1 light yield () is calculated using the full-energy 241Am peak in the S1 spectrum, corresponding to 59.54 keV. The S1 distribution following the TBA correction is fitted to a template computed as the numerical convolution of the 241Am spectrum from MC, which describes the true energy deposited in the TPC, with a Gaussian smearing function to account for the detector resolution. The free parameters of the fit are the total light yield () and the standard deviation () of the smearing function. Data from a 241Am calibration run taken in single-phase mode at null field are shown in Fig. 8, along with the best fit to the smeared MC template: the uncorrected light yield and energy resolution are PE/keV and , respectively. Applying the TBA correction improves the resolution from to 6.4%. The corrected light yield is calculated from Eq. 3 as PE/keV at null field. The uncertainty on is derived from the combination of statistical and systematic uncertainties on and . For the remainder of this work, S1 signal strengths and light yields are always quoted following the TBA correction, unless otherwise noted. The time stability of the S1 response of the ReD TPC in single-phase operation is verified using four 241Am calibrations taken in equivalent conditions throughout the operational period. The position of the full-energy 241Am peak is found to be reproducible to within 2%.
Improved performance in regards to energy resolution can be achieved using the prominence approach, which allows for the identification of single photoelectrons. However, since the occupancy of each channel in ReD, defined as the number of photoelectrons per channel, is significantly greater than 1 due to the limited size of the chamber and the low number of readout channels, the pile-up of photoelectrons causes a strong reconstruction inefficiency resulting in a non-linear response. In this work, S1 and S2 signals are thus calculated using charge integration.
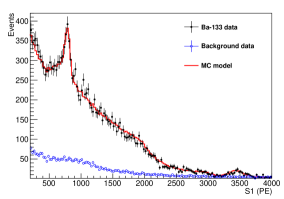
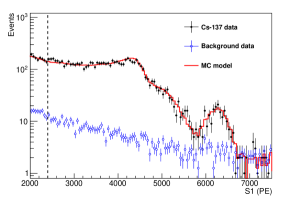
Measurements of the scintillation light response at null field were also taken with other external sources, including 133Ba and 137Cs. Similar to that for 241Am, the S1 light yield is calculated by fitting the measured S1 distribution to an MC template convoluted with a Gaussian distribution representing the detector resolution. For each source, the Compton spectrum and the photopeak (81 keV for 133Ba and 662 keV for 137Cs) are fitted with independent light yield and resolution parameters to account for their energy dependence. Fig. 9 shows the S1 distribution and the best fit for calibration runs taken with 133Ba and 137Cs in single-phase mode at null field. The measured light yields are PE/keV at 81 keV and PE/keV at 662 keV. No TBA correction has been applied to these spectra since the resulting impact on the light yield at the photopeak is negligible ().
Dedicated measurements with the 241Am source were also taken in double-phase mode (i.e. in the presence of a gas pocket) at null field. Variations at the level of only 1% were found between the measured light yields in single-phase and double-phase operation at null field, compatible with expected fluctuations over time.
5 Scintillation-ionisation (S1-S2) response
Detection of the ionisation signal (S2) requires drifting the free electrons from the interaction point to the liquid-gas interface, extracting them from the liquid to the gas, and accelerating them in the gas to produce electroluminescent light. The TPC must therefore be operated in double-phase mode, namely with a gas pocket above the liquid phase, and with the appropriate electric field in the three regions of the TPC: , and . Since the S2 signal is delayed by several tens of µs with respect to S1 due to the electron drift time, signals from the SiPMs are acquired for a total window of 100 µs, with approximately 10% of this time reserved for the pre-trigger.
5.1 Drift time distribution and drift velocity
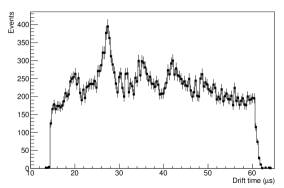
The total drift time between the onset of the prompt scintillation signal (S1) and the delayed ionisation signal (S2) gives information about the coordinate of the primary interaction. Fig. 10 shows the drift time distribution for data taken with an external 241Am source at V/cm. The distribution features a cutoff at 62 µs, corresponding to the time needed for an electron produced at the cathode to travel upwards to the electroluminescence region. The turn-on at 12 µs is due to the efficiency of the reconstruction, which is unable to fully resolve the separation between S1 and S2 signals below this time, and to the selection cuts intended to remove pile-up events. The valleys in the drift time distribution of Fig. 10 are due to the presence of the copper field-shaping rings, which absorb a portion of the -rays from the external 241Am source. This behaviour is reproduced by the MC simulation.
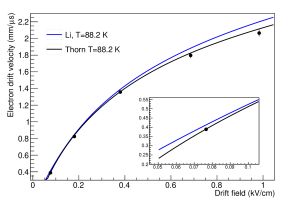
Measurements of the drift time can be used to determine the electron drift velocity in LAr as a function of and the electron mobility at the operating temperature. The temperature of the LAr here is K, calculated according to the saturation PT curve of LAr, evaluated at the average measured value of the atmospheric pressure and corrected for the additional contribution from the hydrostatic pressure of the LAr column above the TPC. Five measurements were taken at between 75 and 1000 V/cm, with and set to their standard reference values of 3.8 kV/cm and 5.7 kV/cm, respectively. The electron drift velocity in LAr is calculated using the distance between the cathode and grid, mm, taking into account the thermal contraction of PTFE at 88 K Kirby:1956 . The time for electrons to drift the distance can be estimated as , where is the cutoff of the drift time distribution, is the time needed for the electrons to drift across the liquid layer between the grid and the gas interface, and accounts for the diffusion along the drift direction, which causes the initial electrons to arrive earlier than the centroid of the ionisation cloud. The drift time cutoff () varies between 125 µs at V/cm and 25 µs at 1000 V/cm. Considering an electron velocity of mm/µs in liquid argon at kV/cm, the transit time through the extraction region, namely the -mm layer of LAr above the grid, is µs. The diffusion correction () is calculated according to the analytical parametrization from Agnes:2018hvf ; is on the order of a few µs for small , becoming negligible ( µs) above 600 V/cm.
The measured electron drift velocity in LAr is shown in Fig. 11, in comparison to two parameterisations from the literature ThornLArProperties ; Li:2016dz calculated at a LAr temperature of K. Although the parameterisation from ThornLArProperties was developed for drift fields above 300 V/cm, it is in good agreement with the ReD data at low fields (), performing considerably better than that of Li:2016dz . The drift velocity distribution was also fitted to the parameterisation of ThornLArProperties leaving the temperature as a free parameter, resulting in K, compatible with the temperature calculated above.
5.2 Electron lifetime
Electrons drifting in LAr can be captured by electronegative contaminants such as oxygen and nitrogen. The number of free electrons along the drift path () decreases exponentially relative to the initial number () as
| (4) |
where is a characteristic time determined by the LAr purity. Under normal operating conditions, this lifetime should satisfy so that the majority of electrons survive over the entire drift length and arrive to the multiplication region. For this reason, ReD operates a gas recirculation system that continuously purifies the LAr in the TPC (see Sec. 2.4). The electron lifetime is evaluated by measuring the dependence of S2/S1 on the drift time. Due to the absorption of electrons, events with a longer drift time (i.e. generated closer to the cathode) are expected to have the same S1 signal, but a smaller S2 signal, than events with a shorter drift time. The loss of S2 strength vs. drift time () is corrected event-by-event as
| (5) |
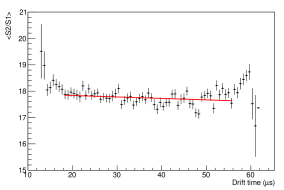
The distribution of S2/S1 as a function of drift time is shown in Fig. 12 for an 241Am calibration run taken at V/cm, following 37 days of recirculation. The red solid line is the best fit to the exponential model of Eq. 4, resulting in an electron lifetime of ms, significantly longer than the maximum drift time in the TPC. A lifetime greater than 1 ms is typically calculated for data taken at least two weeks after the initial cool-down, rendering the correction of Eq. 5 at the level of a few percent. For the remainder of this work, S2 signal strengths are always quoted following this correction and denoted simply as “S2”.
5.3 S2/S1 and ER vs. NR discrimination
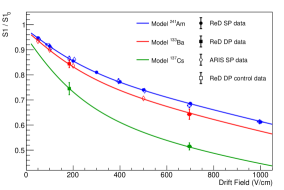
The relative ionisation to scintillation yield, or S2/S1 ratio, is a key observable for characterising the performance of a LAr TPC since it provides a handle for discriminating between nuclear recoils (NR) and electronic recoils (ER). Moreover, in view of the physics goals of ReD, achieving an excellent detector resolution on S2/S1 is essential for precise studies of recombination as a function of recoil angle relative to the axis. Here the correlations between S1, S2, and S2/S1 are studied using sources of both electron recoils (external 241Am and internal 83mKr sources) and nuclear recoils. The electric field in the TPC is always kept at the reference values: V/cm, kV/cm and kV/cm.
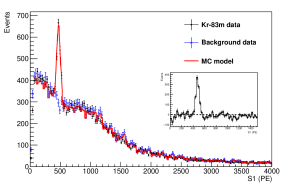
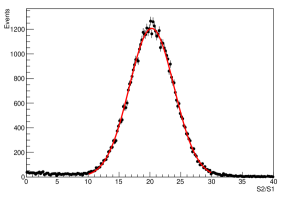
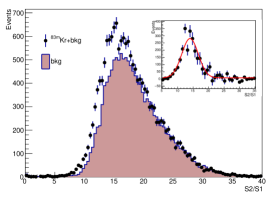
The internal 83mKr source is a short-lived ( h) progeny of 83Rb ( days); being a radioactive gas, 83mKr can be diffused uniformly within the LAr and TPC using the procedure developed in Agnes:2015gu . 83mKr decays by Isomeric Transition (IT), emitting two monoenergetic conversion electrons (9 and 32 keV) that are sometimes accompanied by associated fluorescence x-rays. Fig. 13 shows the S1 spectrum of 83mKr measured at V/cm.
The S2/S1 distributions from 241Am and 83mKr are shown in Fig. 14, superimposed with a Gaussian fit. The S2/S1 resolution, calculated as the ratio of from the fit, is % for 241Am. In the case of 83mKr, the data indicate a larger width (%), which is likely due to the signal being composed of many electrons and x-rays, producing larger fluctuations in the ionisation signal.
Nuclear recoils are very slow and have a much larger stopping power () than electron recoils, according to the Bethe formula. The higher ionisation density results in an enhanced probability of electron-ion recombination, and hence a larger S1 and smaller S2 signal. The difference in ionisation density also produces a different proportion of two excited states of the Ar dimer, that then emit scintillation light with widely different time constants (approximately 6 ns and 1.6 µs), permitting powerful ER/NR discrimination based on the time profile of the S1 signal Amaudruz:2016dq . The fraction of scintillation light emitted by the shorter-lived excimer is higher for NRs relative to ERs and is therefore often used to discriminate between the two classes of events. The parameter is defined here as the fraction of scintillation light taking place in the initial 700 ns. While the optimisation of this parameter is beyond the scope of this work, this simple definition results in a NR/ER separation better than at the lowest energy considered (50 PE), which is sufficient for the purposes of this study.
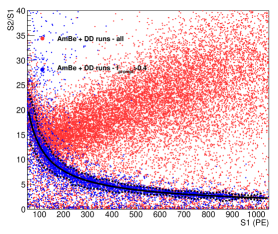
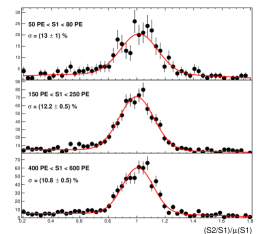
The ReD TPC was exposed to two neutron sources during the data campaign discussed here: an AmBe source and a commercial deuterium-deuterium (DD) neutron generator CHICHESTER2005753 . The AmBe source provides a broad spectrum of neutrons (up to 8 MeV), resulting in 40Ar recoils up to 800 keV. The DD neutron generator emits nearly monochromatic 2.5-MeV neutrons, which produce a NR spectrum up to 250 keV; for radiation safety, its fluence was limited to n/s over the entire solid angle. The two datasets provide consistent measurements and are combined hereafter in order to reduce statistical uncertainties. The left panel of Fig. 15 shows the S2/S1 ratio as a function of S1 for all single-scatter events with valid S1 and S2 signals, as well as for events compatible with a neutron-induced NR (). The NR band is clearly separated from the ER band above 200 PE. The mean value and width of S2/S1 are calculated in intervals of S1 with varying width between 20 and 40 PE using a model consisting of a Gaussian distribution summed with a linear function. The set of most probable values of the S2/S1 mean () is then fitted as a function of S1 using the empirical function , shown as a black solid curve in the left panel of Fig. 15. The right panel of Fig. 15 shows the distribution of (S2/S1)/ for three different energy ranges: 50–80 PE (20–30 keVnr); 150–250 PE, which includes the recoil energy used to benchmark the directional sensitivity of ReD (70 keVnr); and 400–600 PE, which includes the 241Am peak shown in Fig. 14 for comparison. The dispersion of S2/S1 for NRs is calculated as the relative standard deviation () of the Gaussian distribution and reported in Tab. 1 for the three S1 ranges considered here, along with the corresponding tail fraction, defined as the fraction of events outside the interval (i.e. the 90% quantile of a Gaussian distribution). In the highest energy range, the measured S2/S1 dispersion for NRs (11%) is considerably smaller than that observed for ERs (18%) in roughly the same S1 signal range. This difference is mostly due to a smaller amount of fluctuations in recombination for NRs than for ERs and, consequently, a better resolution in S2. The S2/S1 observable folds in the possible directional dependence of each of the samples, albeit integrated over a large angular range for the samples studied here. The measured S2/S1 dispersion in the energy range 150–200 PE is 12%, improving on previous results obtained by the SCENE collaboration Cao:2014gns , and sufficiently low to ensure that a potential directional effect with magnitude equal to that suggested by the results from SCENE would not be hidden by instrumental resolution. In this regard, the performance of the TPC reported here meets the requirements needed to accomplish the main goals of the ReD experiment in the search for a directional effect due to columnar recombination in NRs.
| S1 range (PE) | tail fraction | |
|---|---|---|
| 50–80 | 0.13(1) | 35(3)% |
| 150–250 | 0.122(5) | 27(2)% |
| 400–600 | 0.108(5) | 33(2)% |
6 Dependence of scintillation and ionisation response on the drift field
In this section, measurements of scintillation and ionisation performed as a function of the drift field () are presented and discussed.
The passage of an ionising particle in a noble liquid produces both excitons (), which give rise to scintillation light, and electron-ion pairs () Doke:2002oab ; Doke:1988dp . A fraction of these electron-ion pairs recombine, giving an additional contribution to the scintillation light, while the remaining unrecombined electrons can be drifted, multiplied and collected to form the ionisation signal. The total number of scintillation photons produced is
| (6) |
where and are the efficiencies for excitons and recombined electron-ion pairs to produce a scintillation photon, respectively. In the absence of non-radiative quenching phenomena, both and are expected to be equal to one222As in Cao:2014gns , and are defined here to not account for any internal or track-dependent quenching processes, e.g. Penning ionisation or biexcitonic Hitachi quenching Hitachi:1992gq , which instead affect and .. Defining as the ratio of excitons to electron-ion pairs (), the total S1 signal can be expressed as
| (7) |
where is the number of photoelectrons detected per scintillation photon emitted. The electrons surviving recombination contribute to the ionisation signal S2, which is expressed as
| (8) |
where is the S2 gain of the TPC, i.e. the number of photoelectrons detected for each electron extracted from the liquid. The parameters and are intrinsic properties of the detector and account for light collection efficiency and photon detection efficiency of the SiPMs.
In the limit of full recombination (), the average energy required for the production of one scintillation photon in LAr can be written Doke:2002oab as
| (9) |
where is the average energy required to produce an electron-ion pair. The values of and (max) were measured to be eV Miyajima:1974zz and eV Doke:2002oab , respectively, using 1-MeV conversion electrons from a 207Bi source. These measurements correspond to a value of .
S1 and S2 signals are expected to be anti-correlated since they originate from competing scintillation and ionisation processes. Their relative balance depends on the recombination probability (), which is affected by the presence of the drift field () in the active region of the TPC. In particular, for increasing , more electrons are swept away from the interaction site and can therefore survive recombination. The anti-correlation between S1 and S2 allows a determination of the gains and , discussed in Sec. 6.1. The reduction of the scintillation light (“quenching”) measured in ReD for increasing and the fit of these data with an empirical model for the recombination probability are presented in Sec. 6.2.
6.1 S1 and S2 correlation
The experimental gains and can be derived using the anti-correlation between S1 and S2 signals by following the procedure described in Cao:2014gns . Defining the yields and as the number of photoelectrons measured in the S1 and S2 signals, respectively, per unit of deposited energy, the anti-correlation between and can be written from Eqs. 7, 8, and 9 as
| (10) |
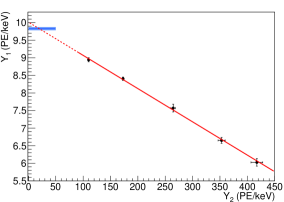
For this study the full absorption peak of the 241Am source is taken from data collected in double-phase mode at V/cm. Data collected at null field are not included here since any electrons surviving recombination, referred to as “escape electrons” Doke:2002oab , are not drifted and remain undetected. To ensure a proper comparison between measurements taken at different values of , only events localised in the central part of the detector are considered, where the drift field is expected to be more uniform. The - position of an event is approximately estimated as the centre of the SiPM in the top tile with the highest fractional S2 charge. Only events with a reconstructed - position corresponding to one of the inner eight SiPMs of the top tile are selected. The correction due to leakage current in the SiPM (see Sec. 3) is also applied to the measured S1 and S2 yields. Systematic uncertainties on and are largely dominated by the leakage current correction, with sub-leading contributions from the MC templates and other fit-related uncertainties.
The - correlation obtained for V/cm is shown in Fig. 16, along with the best fit to the linear model of Eq. 10. Assuming (max) eV for 59.54-keV 241Am -rays, the best fit parameters are PE/photon and PE/e-. The horizontal blue band in Fig 16 shows the light yield measured at null field, ) PE/keV; is not measured in this case due to the absence of a drift field. The predicted S1 yield at from extrapolating the linear fit, i.e. under the implicit assumption that all electrons recombine at null field, is () PE/keV. The ratio between and the value extrapolated to is related to the fraction of electrons escaping recombination at null field by Doke:2002oab ; Hitachi:2019nce . The value of calculated here for 59.54-keV -rays indicates that the contribution from escape electrons is limited to a few percent.
The measured gains of the ReD TPC are PE/photon and PE/e. The systematic uncertainties on and are dominated by the uncertainty on (max), which contributes 5.1%. The measured value of is in good agreement with the independent estimate based on “echo” events discussed in A. The measured value of in ReD can be compared with that from DarkSide-50, PE/photon Agnes:2017grb , and that from SCENE, PE/photon Cao:2014gns . The higher value of achieved in ReD is driven mostly by the better optical coverage of the ReD TPC and higher detection efficiency of the SiPMs with respect to photomultipliers. The S2 gain of ReD is comparable to that of DarkSide-50, PE/e- Agnes:2018ves , and significantly higher than that of SCENE, PE/e- Cao:2014gns . Based on the measured values of and , the performance of the TPC reported here satisfies the requirements needed to achieve the scientific goals of the ReD experiment.
6.2 Scintillation quenching and charge yield vs.
The S1 and S2 response of the ReD TPC was studied as a function of the drift field using a dedicated set of 241Am measurements taken at V/cm in single- and double-phase mode, together with 133Ba and 137Cs measurements taken in double-phase mode at 183 and 693 V/cm. From Eq. 7, the ratio S1/S10 between the scintillation yield at a given value of and that at null field can be expressed as
| (11) |
where the recombination probability () depends on the stopping power () and on the drift field (), is the fraction of escaping electrons at null field, and is the recombination probability at null field.
In this work, is parameterised as a function of and according to the Doke-Birks empirical recombination model Doke:2002oab ; Doke:1988dp , modified to account for the observed dependence on Agnes:2018mvl and further extended here:
| (12) |
where the constant is defined such that for highly-ionising particles () at any value of :
| (13) |
The parameterisation of Eq. 12 is valid for tracks approximating a long column of electron-ion pairs (above 50 keV). The second term represents ‘geminate’, or Onsager, recombination Doke:1988dp ; Thomas:1987ek , which occurs when an ionisation electron recombines with its parent ion, while the first term represents ‘volume’ recombination, which occurs when a wandering ionisation electron is captured by an ion other than its parent. Following Doke:2002oab , the recombination at null field () can be expressed as
| (14) |
where is as defined in Sec. 6.1. Here it is parameterised as a function of Doke:2002oab :
| (15) |
with the condition imposed in order to guarantee that both and approach unity as .
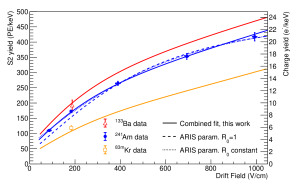
A combined fit to several input datasets is performed, including measurements of S1/S10 taken by ReD in single- or double-phase mode using 241Am, 133Ba or 137Cs sources at V/cm, as well as measurements of the S2 yield with an 241Am source at V/cm. Measurements of S1/S10 by the ARIS collaboration Agnes:2018mvl using sources and single Compton scatters are also included in the analysis. The fit implements the model described in Eqs. 8, 11, 12, 14 and 15 keeping a total of nine free parameters: , , and from the recombination probability parameterisation of Eq. 12; and from the parameterisation for the scintillation efficiency at null field of Eq. 15; the excitation to ionisation ratio (); the ionisation work function in LAr (); and the S2 gain (). The latter two parameters, and , are additionally constrained via Gaussian penalty terms to the values eV and PE/e-, respectively, taken from Miyajima:1974zz and from the independent measurement described in A. Finally, the - correlation of Eq. 10 is recast to depend on the ratio and subsequently on the combination using Eq. 9. The fit of Sec. 6.1 is then used to provide an additional constraint on PE/(eeV). The electron used in Eq. 12 is taken from the ESTAR database estar , based on ICRU37 .
Results from this combined fit are reported in Tab. 2, while data for S1/S10 and the S2 yield are shown in Figs. 17 and 18, respectively, with the fit overlaid. The vertical axis on the right-hand side of Fig. 18 shows the charge yield (), a detector-independent quantity defined as the average number of electrons released per unit of deposited energy and calculated as , using the fitted value for . The fit has 50 degrees of freedom and a (-based) p-value of 74%, once published uncertainties on the ARIS single-Compton dataset are inflated by 50%. If the original uncertainties are used instead, the fitted parameters remain stable within one standard deviation, but the p-value drops to 0.3%.
The set of ReD S1/S10 measurements taken in double-phase mode with 241Am is kept as a control sample and not used in the combined fit. The control data, shown in Fig. 17 as blue empty squares, are in excellent agreement with the model prediction. Similarly, ReD data taken using 83mKr and 133Ba sources are not used in the combined fit and instead used to cross-check model predictions of the charge yield, shown in Fig. 18 as ochre and red solid lines, respectively. The two data points are in reasonable agreement with the prediction, although the 83mKr signal is composed of low energy electrons (9 and 32 keV) and therefore outside the range of validity of Eq. 12.
The S1 gain () can also be derived by rescaling the fit of Sec. 6.1 with the newly fitted value for . These measurements have a smaller uncertainty with respect to those previously reported in Sec. 6.1 and represent the final assessment of the ReD TPC S1 and S2 gains:
| (16) |
A measurement of the escape probability at null field for electron recoils induced by 59.54-keV 241Am -rays is derived from the combined fit: . Since the variation in over the range of energies discussed here is expected to be below 3%, a fit with a constant escape probability as a function of energy () is also performed. This fit is consistent with the nominal fit for all parameters of interest and has a comparable p-value.
An alternative fit is performed using the recombination parameterisation employed by the ARIS collaboration Agnes:2018mvl , which assumes that the volume recombination term is field-independent () and that all electrons eventually recombine within the experimental observation time (). The resulting fit, shown in Fig. 18 as a dashed line, is in disagreement with the data points at low and returns a p-value below 0.1%. If the assumption is relaxed, the ARIS parameterisation gives a good description of the 241Am S2 data (see Fig. 18, dotted line), but fails to reproduce the behaviour of S1/S10 for the higher energy source data. The parameterisation of Eq. 12 is therefore better suited for describing new measurements from ReD at V/cm, as well as the combined analysis of scintillation and ionisation signals presented here.
Assuming 1) fully efficient electron extraction to the gas phase and 2) the absence of non-radiative quenching mechanisms, the combined S1 and S2 analysis can be used to constrain the total number of quanta (exciton and ion-electron pairs) and the excitation to ionisation ratio () for low energy ER events, given a value of the ionisation work function (). Using the value of from Miyajima:1974zz , the fit returns , compatible with values in the literature obtained for various energy regimes with different measurement techniques Doke:2002oab ; Doke:1988dp . This value of corresponds to a value of eV. In order to test the validity of the first assumption above, the combined fit is performed without the additional constraint on from the measurement of “echo” events, as in this case would not include possible inefficiencies in the extraction of electrons from the liquid. Removing the constraint on allows testing the impact of the second assumption, since the total number of quanta and the number of ion-electron pairs become independent variables. The results are reported in Tab. 2 and are consistent with the nominal fit within statistical uncertainties. In the latter case, the fit gives a good description of the data, but returns a slightly larger value of , eV, which is compensated by a higher escape probability (see Tab. 2).
| Data | A | C | D1 | D2 | A0 | C0 | ||
|---|---|---|---|---|---|---|---|---|
| cm/MeV | cm/kV | cm/kV | cm/MeV | PE/ | ||||
| ReD + ARIS | 0.49(5) | 0.56(2) | 1.1(1) | 5.3(7) | 0.1(1) | 0.87(9) | 0.25(5) | 20.0(0.9) |
| ReD only | 0.50(6) | 0.56(2) | 1.1(1) | 5.8(9) | 0.7(1.2) | 0.64(30) | 0.26(5) | 19.8(0.9) |
| ReD+ARIS, no constraint | 0.48(6) | 0.56(2) | 1.1(1) | 5.4(7) | 0.1(2) | 0.87(13) | 0.27(8) | 19.6(1.4) |
| ReD+ARIS, no constraint | 0.45(6) | 0.56(2) | 1.1(1) | 5.3(7) | 0.02(3) | 0.92(5) | 0.31(8) | 21.0(1.3) |
In summary, the empirical formula of Eq. 12 is able to successfully model both S1 quenching and S2 yield for ER events between 50 and 500 keV at V/cm. In addition, the combined scintillation and ionisation analysis validates the generally-accepted assumptions on and for LAr in the energy range typically relevant for dark matter physics experiments.
7 Conclusions
The ReD experiment aims to investigate the directional sensitivity of argon-based TPCs to nuclear recoils in the energy range of interest for WIMP dark matter searches. A compact double-phase argon TPC, featuring innovative readout by cryogenic SiPMs, was recently constructed for ReD and fully characterised using -ray and neutron sources. Measurements of the single-photoelectron response, single-photon resolution, S1 scintillation light yield, and duplication factor due to crosstalk and afterpulsing were periodically performed over more than five months of continuous operation and found to be reproducible to within 1–2%, demonstrating stable operation of the SiPMs at cryogenic temperature and stability of the optical properties of the TPC and wavelength-shifting (TPB) coating. The purity of the LAr, maintained by a recirculation loop, results in an electron lifetime above 2 ms, significantly longer than the maximum electron drift time in the TPC at the operational .
TPC performance criteria have been defined and evaluated in the context of the scientific goals of ReD. The scintillation and ionisation gains, and , were derived using measurements of S1 and S2 taken in single- or double-phase mode at V/cm. The measured value of is 24% higher than that measured in DarkSide-50 and almost a factor of 2 higher than in SCENE, an improvement driven mostly by better optical coverage of the ReD TPC and higher detection efficiency of the SiPMs with respect to photomultipliers. The ionisation amplification of the ReD TPC is comparable to that of DarkSide-50 and more than a factor of 6 higher than that of SCENE. The dispersion in the ratio of the ionisation to scintillation signals (S2/S1) is found to be 12-13% for nuclear recoils in the energy range 20–80 keVnr, improving on previous results obtained by SCENE. Based on the measured values of , , and the S2/S1 dispersion, the performance of the ReD TPC satisfies the requirements needed to achieve the scientific aim of the ReD experiment. Finally, a phenomenological parameterisation of the recombination probability in LAr has been applied in order to describe the scintillation and ionisation response of ReD in a consistent framework. The parametrisation provides a good description of the dependence of scintillation quenching and charge yield on the drift field for energies between 50–500 keV and fields up to 1000 V/cm.
Appendix A S3 “echo” events
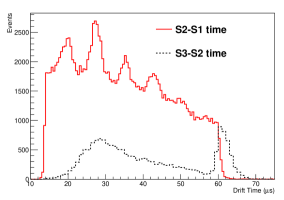
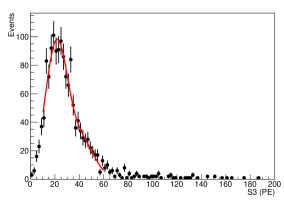
Similar to DarkSide-50 Agnes:2015ftt , S3 “echo” events are observed in ReD, produced when photons from an S2 signal hit the cathode and extract one or more additional electrons. These electrons are then transported by the drift field, extracted and eventually accelerated, producing a delayed electroluminescence signal (S3). Since they travel from the cathode, the delay with respect to S2 corresponds to , defined in Sec. 5.1. S3 signals allow an independent measurement of the S2 gain (), but since they originate from one or a few electrons, their amplitude is generally very small ( PE). Due to sub-optimal efficiency of the standard reconstruction algorithm in this regime, these data are reconstructed with a relaxed threshold.
Fig. 19 shows the drift time distribution between S1 and S2 events (red curve) and between S2 and S3 events (black curve), obtained from a set of 241Am measurements at V/cm. While the S2 S1 drift time distribution exhibits peaks and valleys caused by the presence of the copper field-shaping rings (see Sec. 5.1), the S3 S2 drift time distribution has a peak at approximately µs, thus providing evidence that these events mostly consist of “echoes” due to secondary photoionisation from the cathode. The charge spectrum of the S3 events in the time window between 58 and 66 µs following the preceding S2 pulse and detected in the inner eight SiPMs of the top tile is shown in the right panel of Fig. 19. Under the assumption that the S3 signals originate from one or two electrons, each contributing a signal of photoelectrons, the spectrum can be fitted with a sum of two Gaussian functions, with central values and and standard deviations and . The best-fit curve is shown in Fig. 19 in red and corresponds to ) PE/e-. The uncertainty due to the efficiency profile of these low-energy signals is evaluated by varying the lower bound of the fit range from 10 to 15 PE, ultimately leading to a value of ) PE/e-, consistent with the value derived using the S1-S2 correlation discussed in Sec. 6.1.
Acknowledgements.
M. Leyton is supported by funding from the European Union’s Horizon 2020 research and innovation programme under the Marie Skłodowska-Curie grant agreement No. 754496. The activity of V. Oleynikov within this project has been supported by the SSORS funds of INFN. M. Wada is supported by IRAP AstroCeNT funded by FNP from ERDF. The authors thank Fabrice Retiere (TRIUMF) and Roberto Santorelli (CIEMAT) for very useful comments on the manuscript.References
- (1) P.A. Amaudruz, et al., Astropart. Phys. 85, 1 (2016). DOI 10.1016/j.astropartphys.2016.09.002
- (2) D. Acosta-Kane, et al., Nucl. Instrum. Meth. A 587, 46 (2008). DOI 10.1016/j.nima.2007.12.032
- (3) C. Aalseth, et al., JINST 15(02), P02024 (2020). DOI 10.1088/1748-0221/15/02/P02024
- (4) C.E. Aalseth, et al., Eur. Phys. J. Plus 133, 131 (2018). DOI 10.1140/epjp/i2018-11973-4
- (5) M. Cadeddu, et al., JCAP 1901(01), 014 (2019). DOI 10.1088/1475-7516/2019/01/014
- (6) H. Cao, et al., Phys. Rev. D91, 092007 (2015). DOI 10.1103/PhysRevD.91.092007
- (7) A. Buzulutskov, Instruments 4(2), 16 (2020). DOI 10.3390/instruments4020016
- (8) V. Cataudella, A. de Candia, G.D. Filippis, S. Catalanotti, M. Cadeddu, M. Lissia, B. Rossi, C. Galbiati, G. Fiorillo, JINST 12(12), P12002 (2017). DOI 10.1088/1748-0221/12/12/P12002
- (9) B. Rossi, et al., JINST 11(02), C02041 (2016). DOI 10.1088/1748-0221/11/02/C02041
- (10) C.E. Aalseth, et al., Eur. Phys. J. C 81(2), 153 (2021). DOI 10.1140/epjc/s10052-020-08801-2
- (11) P. Agnes, et al., Phys. Lett. B 743, 456 (2015). DOI 10.1016/j.physletb.2015.03.012
- (12) P. Agnes, et al., Phys. Rev. D 93(8), 081101 (2016). DOI 10.1103/PhysRevD.93.081101
- (13) P. Agnes, et al., Phys. Rev. Lett. 121(8), 081307 (2018). DOI 10.1103/PhysRevLett.121.081307
- (14) R.L. Amey, R.H. Cole, The Journal of Chemical Physics 40(1), 146 (1964). DOI 10.1063/1.1724850
- (15) COMSOL Multiphysics®, Version 5.4, Stockholm, Sweden (2018). https://www.comsol.it
- (16) V. Chepel, H. Araujo, JINST 8, R04001 (2013). DOI 10.1088/1748-0221/8/04/R04001
- (17) A. Gola, F. Acerbi, M. Capasso, M. Marcante, A. Mazzi, G. Paternoster, C. Piemonte, V. Regazzoni, N. Zorzi, Sensors 19(2), 308 (2019). DOI 10.3390/s19020308
- (18) F. Acerbi, et al., IEEE Transactions on Electron Devices 64(2), 521 (2017). DOI 10.1109/TED.2016.2641586
- (19) M. D’Incecco, et al., IEEE Transactions on Nuclear Science 65(4), 1005 (2018)
- (20) M. D’Incecco, et al., IEEE Transactions on Nuclear Science 65(1), 591 (2018)
- (21) E. Leonardi, M. Raggi, P. Valente, Journal of Physics: Conference Series 898, 032024 (2017). DOI 10.1088/1742-6596/898/3/032024
- (22) National Instruments, LabVIEW, Austin, TX, USA (2017). https://www.ni.com/labview
- (23) P. Virtanen, et al., Nature Meth. 17, 261 (2020). DOI 10.1038/s41592-019-0686-2
-
(24)
SciPy.
Peak prominences:.
https://docs.scipy.org/doc/scipy/reference/generated/
scipy.signal.peak_prominences.html - (25) S. Vinogradov, et al., IEEE Nuclear Science Symposium Conference Records 25, 1496 (2009). DOI 10.1109/NSSMIC.2009.5402300
- (26) P. Agnes, et al., JINST 12(01), P01021 (2017). DOI 10.1088/1748-0221/12/01/P01021
- (27) R.K. Kirby, Journal of Research of the National Bureau of Standards 57, 91 (1956)
- (28) P. Agnes, et al., Nucl. Instrum. Meth. A904, 23 (2018). DOI 10.1016/j.nima.2018.06.077
- (29) C. Thorn. Catalogue of Liquid Argon properties. MicroBoone Note (2009). https://microboone-docdb.fnal.gov/cgi-bin/ShowDocument?docid=412
- (30) Y. Li, et al., Nucl. Instrum. Meth. A 816, 160 (2016). DOI 10.1016/j.nima.2016.01.094
- (31) D. Chichester, M. Lemchak, J. Simpson, Nuclear Instruments and Methods in Physics Research Section B: Beam Interactions with Materials and Atoms 241(1), 753 (2005). DOI https://doi.org/10.1016/j.nimb.2005.07.128. The Application of Accelerators in Research and Industry
- (32) T. Doke, A. Hitachi, J. Kikuchi, K. Masuda, H. Okada, E. Shibamura, Jap. J. Appl. Phys. 41, 1538 (2002). DOI 10.1143/JJAP.41.1538
- (33) T. Doke, H.J. Crawford, A. Hitachi, J. Kikuchi, P.J. Lindstrom, K. Masuda, E. Shibamura, T. Takahashi, Nucl. Instrum. Meth. A269, 291 (1988). DOI 10.1016/0168-9002(88)90892-3
- (34) A. Hitachi, J.A. LaVerne, T. Doke, Phys. Rev. B 46(1), 540 (1992). DOI 10.1103/PhysRevB.46.540
- (35) M. Miyajima, T. Takahashi, S. Konno, T. Hamada, S. Kubota, H. Shibamura, T. Doke, Phys. Rev. A9, 1438 (1974). DOI 10.1103/PhysRevA.9.1438
- (36) A. Hitachi, A. Mozumder, Properties for liquid argon scintillation for dark matter searches (2019). ArXiv:1903.05815 [physics.ins-det]
- (37) P. Agnes, et al., JINST 12(10), P10015 (2017). DOI 10.1088/1748-0221/12/10/P10015
- (38) P. Agnes, et al., Phys. Rev. D97(11), 112005 (2018). DOI 10.1103/PhysRevD.97.112005
- (39) J. Thomas, D.A. Imel, Phys. Rev. A 36(2), 614 (1987). DOI 10.1103/PhysRevA.36.614
- (40) National Institute for Standards and Technology (NIST). ESTAR: Stopping Power and Range Tables for Electrons. https://physics.nist.gov/PhysRefData/Star/Text/ESTAR.html
- (41) International Commission on Radiation Units and Measurements (ICRU). ICRU Report 37, Stopping Powers for Electrons and Positrons (1984)