11email: simondiazgar@gmail.com 22institutetext: Departamento de Astrofísica, Universidad de La Laguna, E-38205, La Laguna, Tenerife, Spain 33institutetext: Department for Physics, Engineering Physics and Astrophysics, Queen’s University, Kingston, ON K7L 3N6, Canada 44institutetext: Departamento de Física Teórica y del Cosmos, Campus de Fuentenueva, Universidad de Granada, E18071-Granada, Spain 55institutetext: Instituto Carlos I de Física Teórica y Computacional, Facultad de Ciencias, 18071 Granada, Spain 66institutetext: Observatoire de Paris, LERMA, Collège de France, CNRS, PSL University, Sorbonne University, 75014, Paris, France 77institutetext: SKA Organization, Lower Withington, Macclesfield, Cheshire SK11 9DL, UK 88institutetext: Joint ALMA Observatory, Alonso de Cordova 3107, Vitacura, Santiago 763-0355, Chile 99institutetext: Universidad Internacional de Valencia (VIU), C. del Pintor Sorolla 21, E-46002 Valencia, Spain 1010institutetext: SUPA, Institute for Astronomy, Royal Observatory, Blackford Hill, Edinburgh, EH9 3HJ, UK 1111institutetext: UK Astronomy Technology Centre, Royal Observatory, Blackford Hill, Edinburgh, EH9 3HJ, UK 1212institutetext: Instituto de Astrofísica de Andalucía (IAA-CSIC), Glorieta de la Astronomía, 18008 Granada, Spain
Molecular gas and star formation
within 12 strong galactic bars observed with IRAM-30m
††thanks:
Tabulated CO(1–0) and CO(2–1) spectra are only available at the
CDS via anonymous ftp to cdsarc.u-strasbg.fr (130.79.128.5)
or via http://cdsarc.u-strasbg.fr/viz-bin/cat/J/A+A/654/A135
Context.
While some galactic bars show recent massive star formation (SF) along them, some others do not.
Whether bars with low level of SF are a consequence of low star formation efficiency, low gas inflow rate, or dynamical effects remains a matter of debate.
Aims.
In order to study the physical conditions that enable or prevent SF, we perform a multi-wavelength analysis of 12 strongly barred galaxies
with total stellar masses ,
chosen to host different degrees of SF along the bar major axis without any prior condition on gas content.
We observe the CO(1-0) and CO(2-1) emission within bars with the IRAM-30m telescope
(beam sizes of 1.7-3.9 kpc and 0.9-2.0 kpc, respectively; 7-8 pointings per galaxy on average).
Methods.
We estimated molecular gas masses () from the CO(1-0) and CO(2-1) emissions.
SF rates (SFRs) were calculated from GALEX near-ultraviolet (UV) and WISE 12 m
images within the beam-pointings, covering the full bar extent (SFRs were also derived from far-UV and 22 m).
Results.
We detect molecular gas along the bars of all probed galaxies.
Molecular gas and SFR surface densities span the ranges
pc and
pc-1 kpc, respectively.
The star formation efficiency (SFE; i.e. SFR/) in bars varies between galaxies by up to an order of magnitude
(SFE Gyr-1). On average, SFEs are roughly constant along bars.
SFEs are not significantly different from the mean value in spiral galaxies reported in the literature ( Gyr-1),
regardless of whether we estimate from CO(1-0) or CO(2-1).
Interestingly, the higher the total stellar mass of the host galaxy, the lower the SFE within their bars.
In particular, the two galaxies in our sample with the lowest SFE and
(NGC 4548 and NGC 5850, SFE Gyr-1, yr-1 kpc-2,
) are also those hosting massive bulges and signs of past interactions with nearby companions.
Conclusions.
We present a statistical analysis of the SFE in bars for a sample of 12 galaxies.
The SFE in strong bars is not systematically inhibited (either in the central, middle, or end parts of the bar).
Both environmental and internal quenching are likely responsible for the lowest SFEs reported in this work.
Key Words.:
galaxies: star formation - galaxies: ISM - galaxies: structure - galaxies: evolution - galaxies: statistics1 Introduction
Stellar bars are frequent stellar structures (e.g. de Vaucouleurs, 1963; Knapen et al., 2000; Eskridge et al., 2000; Aguerri et al., 2009; Méndez-Abreu et al., 2012; Díaz-García et al., 2016b). The bar potential creates lanes of molecular gas and dust in disk galaxies (e.g. de Vaucouleurs & de Vaucouleurs, 1963; Combes et al., 1990; Athanassoula, 1992; Friedli & Benz, 1993; Sellwood & Wilkinson, 1993; Knapen et al., 1995, 2002; Kormendy & Kennicutt, 2004; Pérez et al., 2004; Comerón et al., 2009; Sánchez-Menguiano et al., 2015). These lanes are the loci of shocks in the gas flow (Prendergast, 1962) that can induce star formation (SF).
Different distributions of SF in bars have been found based on the detection of ionised gas, which is typically traced by H or ultraviolet (UV) emission (e.g. Fraser-McKelvie et al., 2020; Díaz-García et al., 2020, and references therein). H ii regions are detected all along the bar in some galaxies, whereas SF is only detected in the nuclear or circumnuclear regions in others (e.g. Martin & Friedli, 1997; Sheth et al., 2002; Verley et al., 2007b). With the aid of stacking techniques applied to far-UV images, Díaz-García et al. (2020) showed that massive barred galaxies (total stellar masses ) are typically characterised by a dip in the radial distribution of SF that is not seen in non-barred systems (see also James et al., 2009). These ‘SF deserts’ indeed exist in barred galaxies (James & Percival, 2016; Spinoso et al., 2017; James & Percival, 2018; Donohoe-Keyes et al., 2019).
Bar-driven central starbursts have also been proposed as the mechanism that depletes the gas, and thus induces SF quenching (e.g. Cheung et al., 2013; Gavazzi et al., 2015; Newnham et al., 2020). Specifically, simulations by Khoperskov et al. (2018) of gas-rich disk isolated galaxies show that stellar bars reduce the star formation rates (SFRs) by a factor of ten in less than 1 Gyr, right after the bar strength reaches its saturation level. This supports the important role of the Galactic bar on the star formation history of the Milky Way (e.g. Haywood et al., 2016).
What drives SF in bars? In this work our aim is to compare the molecular gas mass () with the SFR along galactic bars, quantifying star formation efficiencies (SFE; i.e. SFR/). This comparison allows us to distinguish whether the lack of SF in some bars is due to a small amount of gas (most likely caused by a low inflow rate) or rather due to a low star formation efficiency.
Here we estimated SFRs based on both Galaxy Evolution Explorer (GALEX) UV imaging and Wide-field Infrared Survey Explorer (WISE) data. The UV radiation from young massive stars is partially absorbed by interstellar dust, which gets heated and emits infrared (IR) photons (e.g. Lagache et al., 2005). The mid-IR emission in galaxies mainly comes from dust continuum associated with very small grains (VSGs) and polycyclic aromatic hydrocarbons (PAHs) (e.g. Leger & Puget, 1984; Puget & Leger, 1989), and can be used as a robust SFR indicator (e.g. Zhu et al., 2008). There is a strong correlation between the 8 m and 24 m emission of H ii regions and their H and UV counterparts (e.g. Calzetti et al., 2004). Not only can UV-based SFRs be underestimated, but also IR-based SFRs, since not all the starlight is re-processed by dust (Kennicutt et al., 2009); a hybrid combination of different tracers is advocated (e.g. Leroy et al., 2019).
Giant molecular clouds (GMCs), from which stars are formed, are mainly composed of H2, dust, and other molecules such as carbon monoxide (CO; Solomon et al., 1987; Heyer et al., 2009; Narayanan et al., 2011). GMCs can be probed from the CO emission (Dickman et al., 1986). Using the IRAM-30m radiotelescope (Sierra Nevada, Spain), we observed the and rotational transitions of CO along the strong galactic bars of 12 nearby massive spiral galaxies (). We chose bars with different degrees of SF, hosting and lacking H ii regions, as traced from ancillary H images, and with no prior information about the molecular gas content.
Since the pioneering work of Schmidt (1959), it has been a highly important endeavour to find a universal power law that relates the SFR surface density () and the molecular gas surface density (, e.g. Young et al., 1996; Kennicutt, 1998b; Kennicutt et al., 2007; Verley et al., 2010). The molecular gas mass within GMCs is indeed correlated with the SF activity in galaxies (e.g. Leroy et al., 2008). Bigiel et al. (2011) analysed the relation by exploiting CO data from the HERA CO Line Extragalactic Survey (HERACLES; Leroy et al., 2009), GALEX far-UV, and Spitzer 24 m imaging, over thousands of positions in 30 nearby disks at a resolution of 1 kpc. The authors imply a median molecular gas depletion time (SFE=/SFR; including helium) of Gyr ( dex), that is, a median SFE of 0.43 Gyr-1 (see also Bigiel et al., 2008); these values are used as a benchmark in this work. Our aim is to assess the relationship between and , known as the Kennicutt-Schmidt (KS) law, within stellar bars. The analysis of the KS law in the central regions of gas-rich simulated galaxies by Khoperskov et al. (2018) reveals a flattening of its slope in the bar region.
In general, SFEs in bars have been only studied in a few objects (e.g. Knapen & Beckman, 1996; Muraoka et al., 2016; Yajima et al., 2019). It has been shown that SF can be suppressed even in the presence of molecular gas (Maeda et al., 2020, and references therein). The SFE in the spiral arms has been shown to be higher than in the bars (e.g. Handa et al., 1991; Momose et al., 2010; Hirota et al., 2014, and references therein). In this work we search for possible gradients in SFEs along bars.
Some studies using CO indicate that the onset of SF along bars depends on the strength of shocks and shear stress (e.g. Reynaud & Downes, 1998; Zurita et al., 2004). The formation of GMCs can also be inhibited by diverging streamlines in bars (e.g. Regan & Elmegreen, 1997; Sheth et al., 2002). However, observations of H ii regions along bars have not always confirmed these hypotheses (e.g. Martin & Friedli, 1997; Zurita & Pérez, 2008). Thus, several physical processes might come into play to explain the occurrence of SF in bars; for instance, Sheth et al. (2000) suggest that the disruption of GMCs in bars can be neutralised by self-gravity. Disentangling the physical conditions that enable or prevent SF in bars remains an unsolved astrophysical problem, despite all the observational and theoretical work referred to above.
| Galaxy | Morphological | log10 | log10 | ||||||||||
| classification | (Mpc) | (∘) | () | () | (”) | (”) | (kpc) | ||||||
| (1) | (2) | (3) | (4) | (5) | (6) | (7) | (8) | (9) | (10) | (11) | (12) | (13) | (14) |
| NGC 3504 | (R’)SA(s,nl)a | 1 | 20.0 | 12.8 | 10.40 | 8.68 | 0.70 | 147.3 | 33.97 | 1.09 | 0.63 | 7 | 2.1 |
| NGC 4123 | SB(rs)a | 2 | 21.9 | 46.9 | 10.29 | 9.64 | 0.54 | 189.7 | 52.51 | 0.62 | 0.68 | 10 | 2.3 |
| NGC 4394 | (L)SB(rs,bl,nl)0/a | 0 | 16.8 | 30.4 | 10.44 | 8.73 | 1.68 | 208.0 | 45.71 | 0.55 | 0.55 | 7 | 1.8 |
| NGC 4535 | SAB(s)c | 5 | 17.0 | 25.6 | 10.69 | 9.63 | 0.78 | 487.7 | 43.08 | 0.52 | 0.65 | 6 | 1.8 |
| NGC 4548 | SB(rs,bl)b | 2 | 16.2 | 39.0 | 10.70 | 8.84 | 2.03 | 329.7 | 57.98 | 0.68 | 0.64 | 9 | 1.7 |
| NGC 4593 | (R’)SB(rs,bl)a | 1 | 33.9 | 33.4 | 10.93 | 9.31 | 1.34 | 143.9 | 52.51 | 0.81 | 0.62 | 7 | 3.6 |
| NGC 5383 | SB(r,nr)b | 1 | 37.6 | 34.7 | 10.80 | 9.88 | 0.24 | 147.3 | 50.16 | 0.81 | 0.57 | 10 | 3.9 |
| NGC 5850 | (R’)SB(r,bl,nr,nb)b | 2 | 23.1 | 36.0 | 10.77 | 9.27 | 1.44 | 198.7 | 62.76 | 0.74 | 0.65 | 11 | 2.4 |
| NGC 5921 | SB(s)b | 3 | 19.9 | 33.5 | 10.41 | 9.36 | -0.26 | 181.2 | 45.55 | 0.40 | 0.73 | 7 | 2.1 |
| NGC 6217 | (R’L)SB(rs)b | 3 | 23.9 | 23.5 | 10.45 | 9.75 | -0.17 | 134.3 | 36.76 | 0.56 | 0.74 | 7 | 2.5 |
| NGC 6951 | SAB(rs)bc | 4 | 23.5 | 39.4 | 10.90 | 9.51 | - | 189.7 | 44.01 | - | 0.54 | 7 | 2.5 |
| NGC 7723 | (R’)SB(rs)a | 3 | 27.4 | 47.8 | 10.68 | 8.95 | -0.47 | 189.7 | 19.13 | 0.38 | 0.58 | 5 | 2.9 |


This paper is organised as follows. In Sect. 2 we present the sample and the set of UV, optical, near- and mid-infrared, and millimetre data used. For the millimetre data we explain the observing strategy, data acquisition, and reduction of CO spectra; the spectra are shown in Appendix A. In Sect. 3 we describe the methodology used to infer molecular gas masses from CO(1-0) spectra (see Appendix B); profiles derived from CO(2-1) spectra are analysed in Appendix E. Section 4 describes the use of aperture photometry to compute SFRs within the same regions covered by the IRAM-30m pointings (see also Appendix C); the resulting values are tabulated in Appendix D. In Sect. 5 we analyse the distribution of and along the stellar bars. In Sect. 6 we discuss the physical properties that determine the presence or absence of star formation in galactic bars (see also Appendix F). Finally, Sect. 7 summarises the most important results of this work.
2 Sample and data
Our sample of 12 galaxies was selected from the extragalactic database HyperLeda 111http://leda.univ-lyon1.fr(Paturel et al., 2003) and met the following criteria:
-
•
they host prominent bars, according to the visual classification from ancillary optical images;
-
•
they probe both star-forming and quiescent bars, based on the perusal of archival H or mid-IR imaging;
-
•
they have morphological types spanning the range S0/a-Sc (i.e. Hubble types ;
-
•
they are nearby, with recessional velocities km s-1;
-
•
they have low disk inclinations (), enabling the study of surface densities (of SF and gas masses) and minimising the effect of dust absorption in optical and near-IR wavelengths;
-
•
they have galactic declinations -15∘, avoiding high air masses during IRAM-30m observations;
-
•
they have , where is the length of the projected major axis of a galaxy at the isophotal level 25 mag arcsec-2 in the -band, ensuring good spatial resolution.
The galaxy sample is listed in Table 1 together with some of the main galaxy properties. Their WISE 3.4 m images are shown in Fig. 1. We use the mean of the redshift-independent distances () available in the NASA/IPAC Extragalactic Database (NED)222http://ned.ipac.caltech.edu. Total stellar masses are taken from Muñoz-Mateos et al. (2015), calculated from 3.6 m imaging using the calibration of the mass-to-light ratio () by Eskew et al. (2012), which is also the applied in this work to estimate stellar densities within bars (Sect. 4), and from Harmsen et al. (2017) in the case of NGC 6951 (using the band and ; Bell & de Jong, 2001).
According to the catalogue of quasars and active galactic nuclei by Véron-Cetty & Véron (2010), NGC 4593 is classified as Seyfert 1.0, NGC 4548 is a Seyfert 3.0 or hosts a low-ionisation nuclear emission-line region (LINER), and NGC 6217 and NGC 3504 harbour nuclear H ii regions. NGC 6951 has been reported to host an active galactic nucleus (AGN) (Ho et al., 1997; Kohno et al., 1999; Pérez et al., 2000). The rest of the galaxies in our sample are not active.
Díaz-García et al. (2020) classified the distribution of massive SF in bars in the Spitzer Survey of Stellar Structure in Galaxies (S4G; Sheth et al., 2010), using continuum-subtracted H and far-UV images, based on the detection of H ii knots, clumps, or filaments along the major axis. For NGC 6951 (not in S4G) we inspected the GALEX far-UV image. One-half of our galaxies (NGC 3504, NGC 4535, NGC 4593, NGC 5383, NGC 5921, NGC 7723) harbour H ii regions along the bar major axis, whereas in the other galaxies these regions are scarce. We note that in the case of NGC 6217 the distribution of SF is asymmetric and only presents a clear SF gap in the north-eastern part of the bar.
In Table 1 we also show the morphological classification by Buta et al. (2015) (S4G) and/or NED (column 2). Eleven of the galaxies in our sample host inner features, the exception being NGC 4535. Of these, the majority have inner pseudo-rings (i.e. made of tightly wrapped spiral arms) and only NGC 5850 harbours a closed inner ring. This is relevant for our work since the presence of inner rings and the abundance of SF fuel along the bar can be closely connected (Neumann et al., 2019; Díaz-García et al., 2020, and references therein).
None of the 12 studied galaxies are currently merging. The degree of isolation of the S4G galaxies in our sample was quantified by Laine et al. (2014); Col. 8 of Table 1 lists the projected surface density of galaxies,
| (1) |
where is the projected distance to the third nearest neighbour galaxy, given in Mpc. Among the galaxies in our sample with the highest values of , NGC 4548 and NGC 5850 are known to host signs of recent interactions with a nearby companion (e.g. Higdon et al., 1998; Vollmer et al., 1999), and NGC 4394 likely belongs to the M 85 subgroup of the Virgo Cluster (e.g. Vicari et al., 2002).
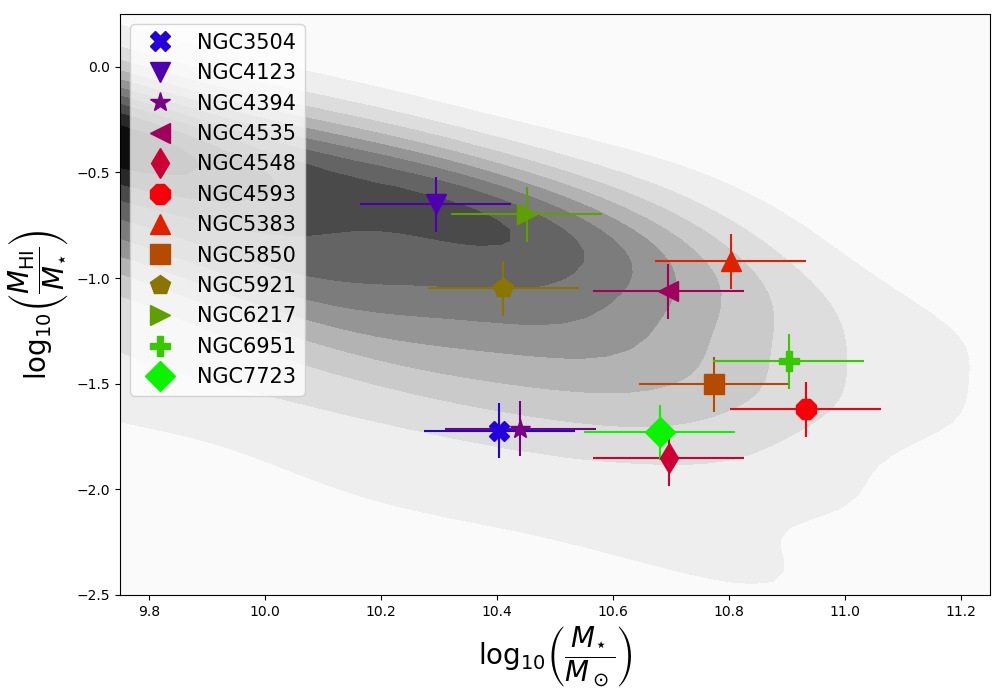
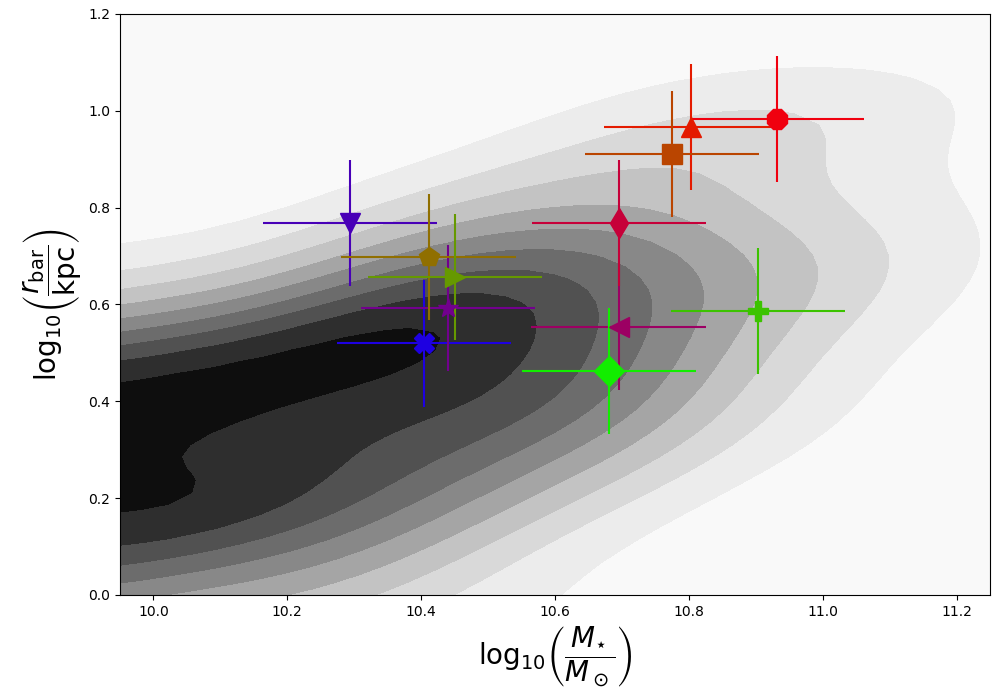
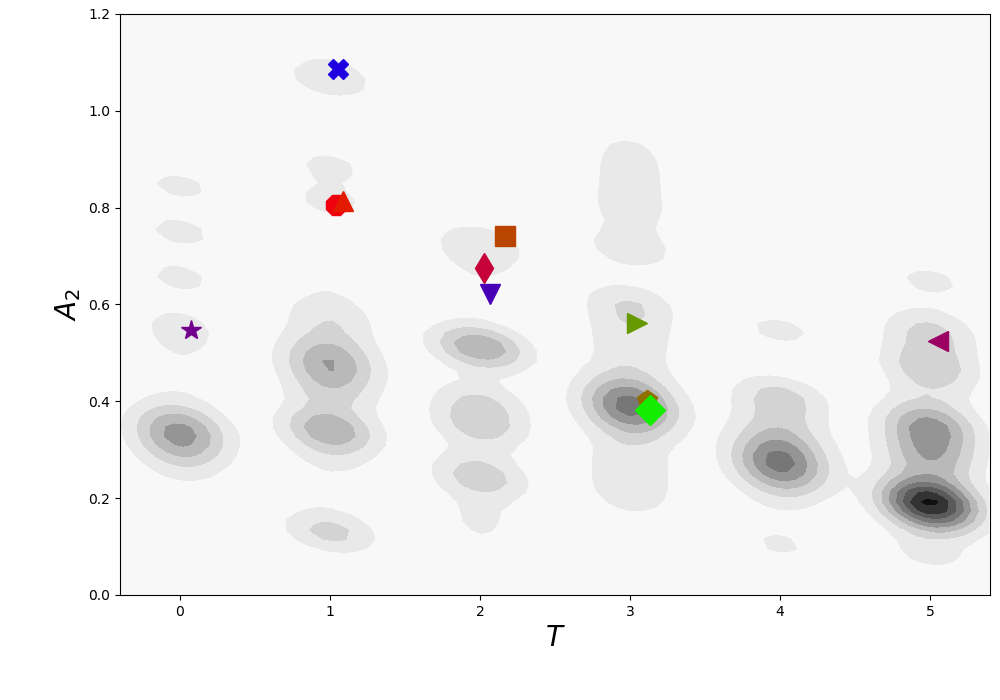
The selection of galaxies hosting high-amplitude bars biases our sample towards massive galaxies, spanning . This is shown in the upper left panel of Fig. 2, where we display the gas fraction as a function of the total stellar mass. Total atomic gas (H i) masses are estimated following Giovanelli & Haynes (1988) and Erwin (2018),
| (2) |
where is the corrected 21 cm line flux in magnitude from HyperLeda. For direct comparison with the physical properties of barred galaxies in the local Universe, in Fig. 2 we display in grey the same values for the S4G sample (Díaz-García & Knapen, 2020) after imposing an inclination cut-off of 50∘, which shows good agreement. Our galaxies have H i gas masses in the range , resulting in gas fractions () spanning 1.5 dex.
2.1 Bar structural parameters
In order to characterise the basic properties of the bars in our sample, we use structural parameters derived from S4G 3.6 m images by Herrera-Endoqui et al. (2015) (bar position angles and sizes) and Díaz-García et al. (2016b) (bar strengths). The disk orientation parameters are from Salo et al. (2015). The bar parameters were deprojected to the disk plane following the same approach as in Gadotti et al. (2007). Bar sizes and position angles were calculated from the maximum of the ellipticity profile, combined with the constancy of the position angle, at the bar region (Wozniak et al., 1995).
As for NGC 6951, which is not in the S4G, we also ran ellipse fitting using the IRAF procedure ellipse (Jedrzejewski, 1987) over the -band image from del Río & Cepa (1999). The disk inclination and position angle are taken from Buta et al. (2003): and PA (which is consistent with the optimal photometric estimation by Marquez & Moles, 1993). The bar parameters are listed in Table 1.
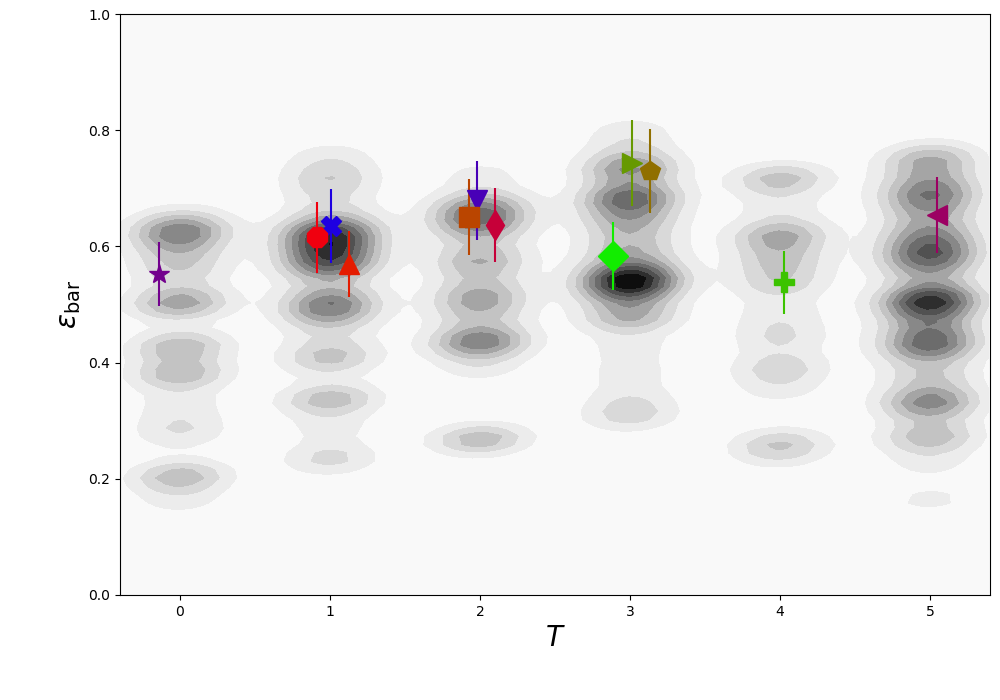
The right panels of Fig. 2 show the distribution in the Hubble sequence of the intrinsic ellipticity of the bars () and their normalised Fourier amplitude (). The grey points again correspond to the values in the S4G () reported by Díaz-García et al. (2016b) (see their Table 3). The lower left panel of Fig. 2 shows the bar radii in kiloparsecs as a function of the total stellar masses of the host galaxies. The bar parameters in our sample lie well within typical ranges for nearby disk galaxies of similar morphological types found in the literature (see also Martin, 1995; Erwin, 2005; Aguerri et al., 2009; Pérez et al., 2012). Our sample of galaxies comprises fairly strong bars, as determined from either visual (Buta et al., 2015) or quantitative (, ) measurements.
2.2 IRAM-30m CO spectra
We observed the CO(1-0) emission line (2.6 mm) along the bars of the 12 galaxies in our sample with the IRAM-30m radiotelescope at a central frequency of 115 GHz. This allowed us to obtain molecular gas mass surface density profiles (Sect. 3).
Observations were carried out between June and November 2008 using the dual polarisation receivers configuration AB with the 512 1 MHz filterbanks. We used a wobbler switching mode with a wobbler throw of 200 arcsec in azimuthal direction. The pointing was monitored on nearby quasars, Mars, or Jupiter every 60 - 90 minutes. The weather conditions were good during the observation period, with pointing accuracy better than 4 arcsec (data with poorer pointings were excluded). The average system temperature was 300 K at 115 GHz on the scale. For the data reduction only observations of good quality were chosen (suitable weather conditions and showing a flat baseline). The spectra were summed over the individual positions and the baseline was then subtracted.
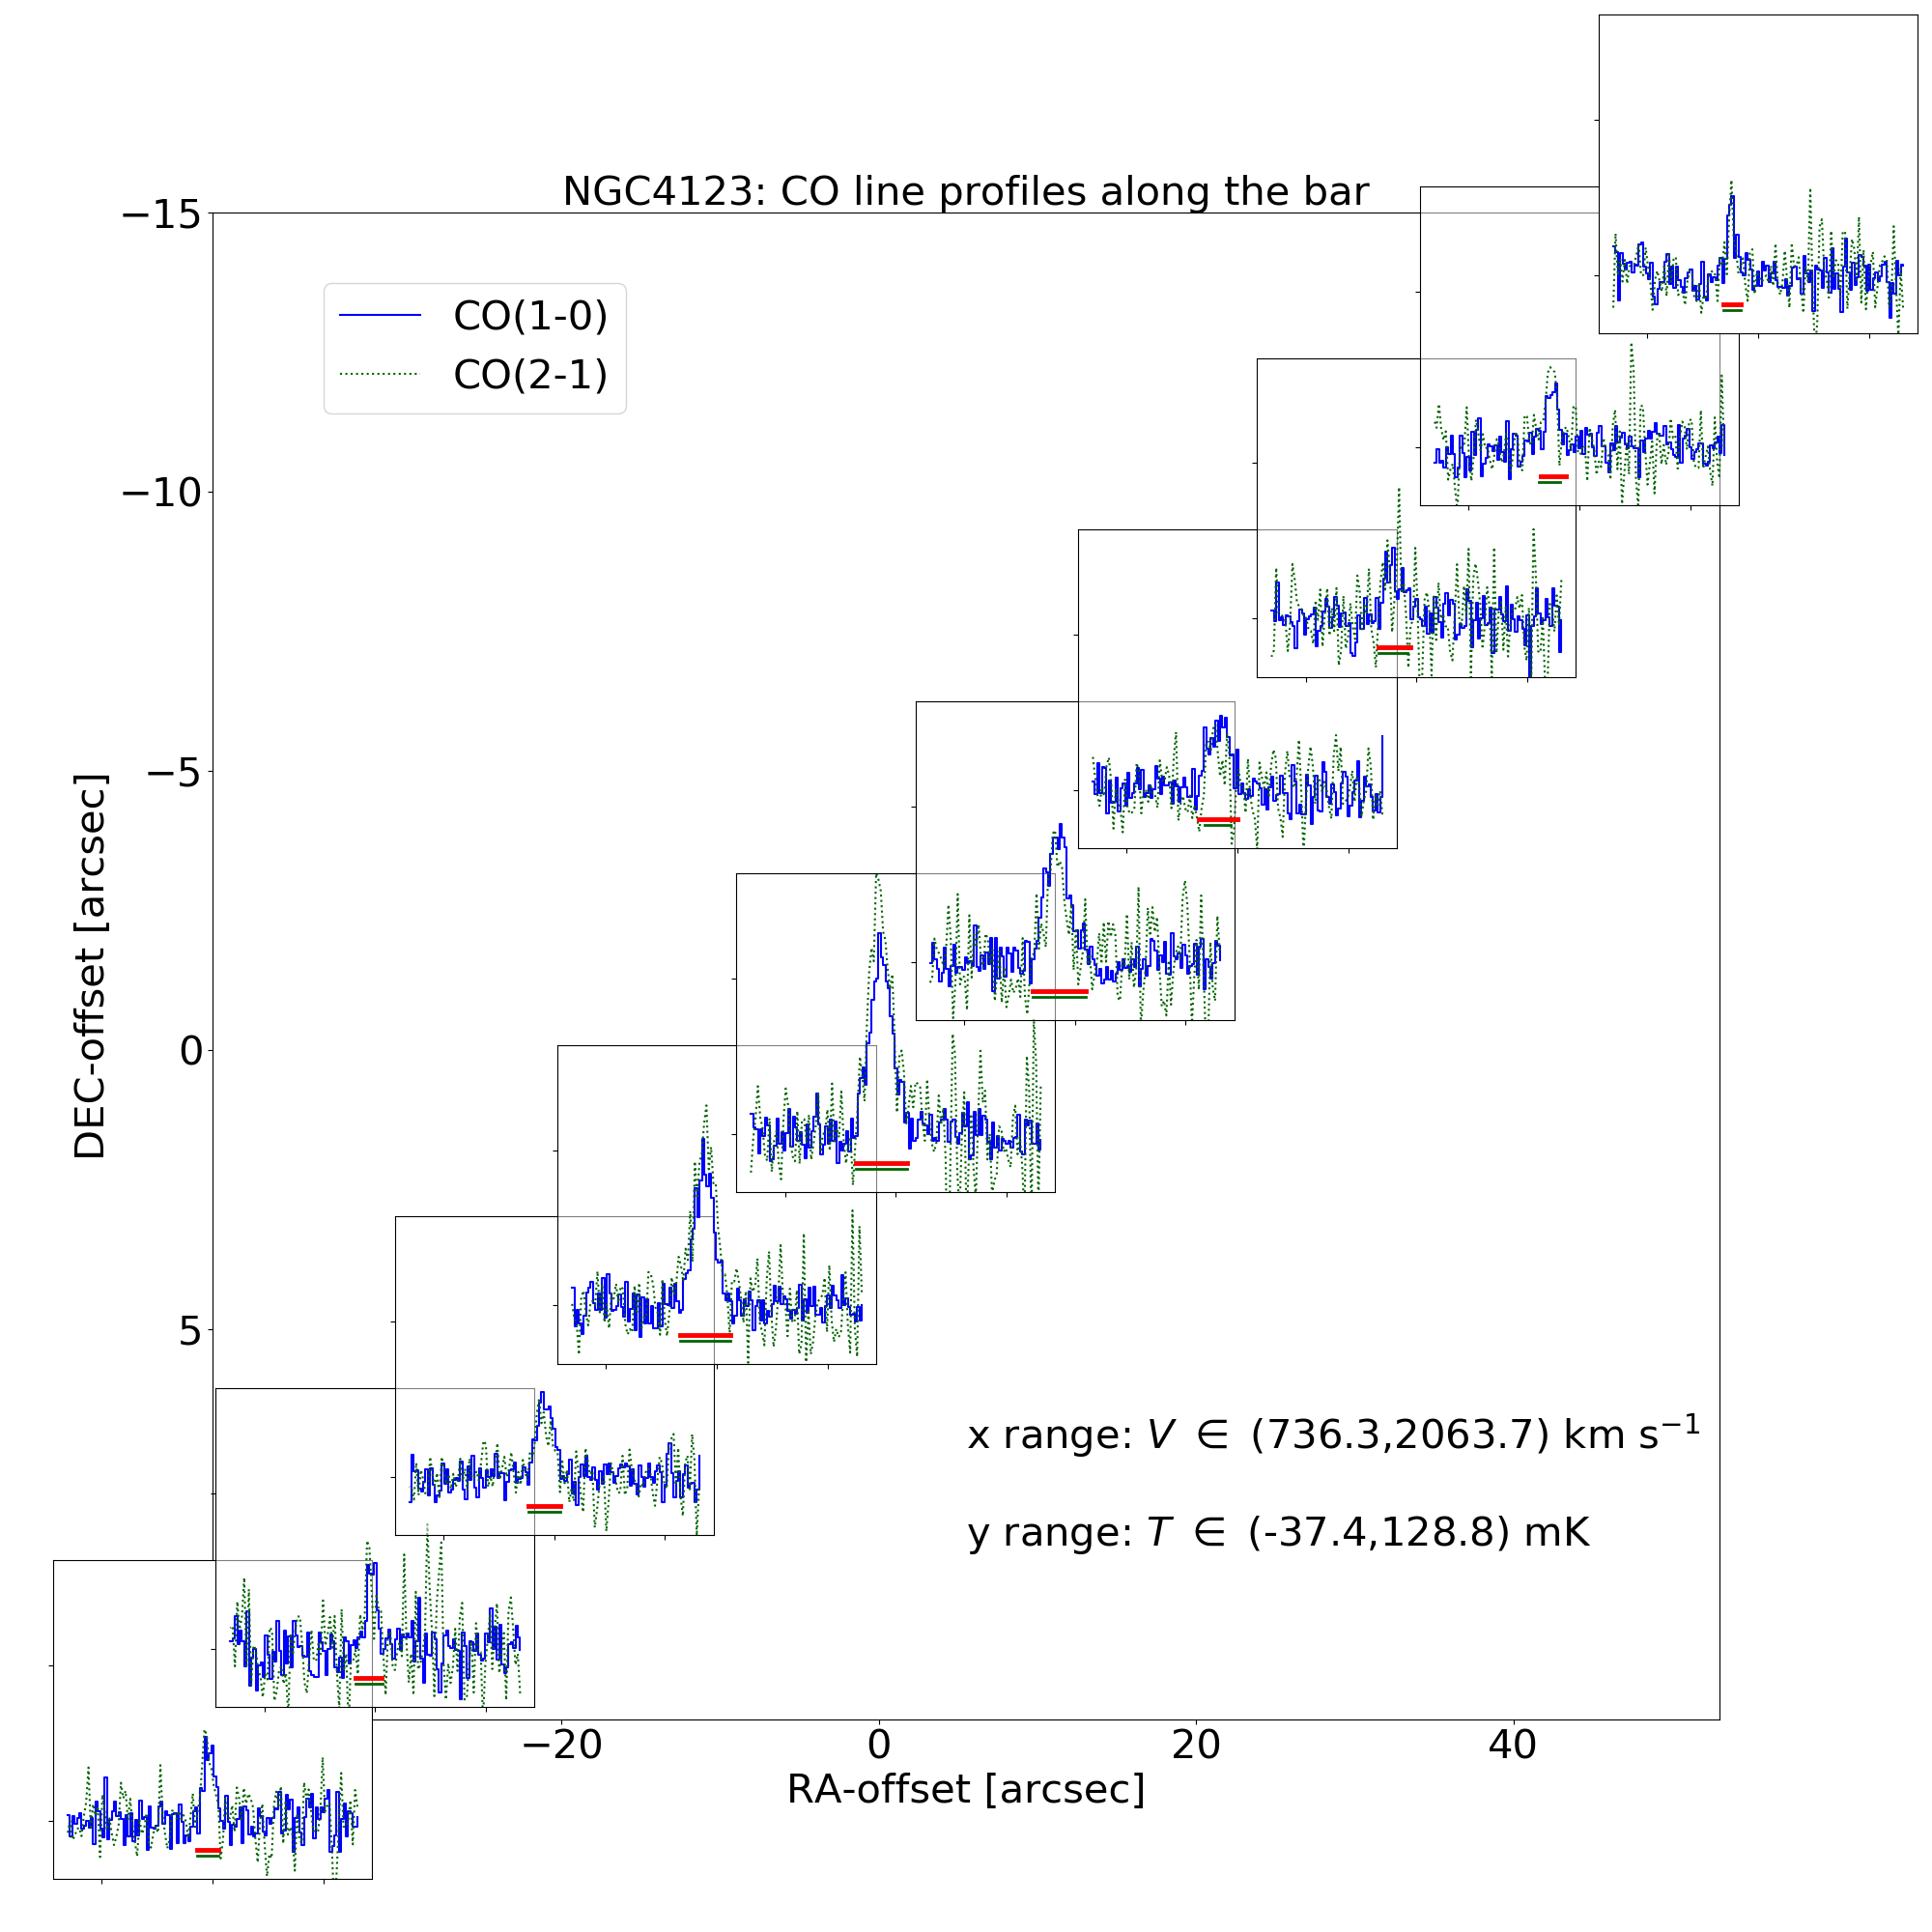
We carried out several pointings (depending on the bar length, see Table 1) separated by 11 arcsec and aligned with the bar major axis. The full width at half maximum (FWHM) is 21.5″ at the frequency of our observations, resolving 1-4 kpc depending on the galaxy (see column 13 in Table 1). The spatial distribution of the regions where the CO was measured is displayed in the upper panels of Fig. 3 for NGC 4123 (the same plots can be found in Appendix A for all the galaxies in our sample), based on the visual measurement of the bar size and position angle. We show the WISE 1 and far-UV images, with the CO pointings and the bar ellipse superimposed. The integration times per pointing ranged between 10 and 115 min and was divided into individual observing scans of 4-6 min duration. The resulting CO(1-0) spectra are presented in the lower panel of Fig. 3 and in Appendix A. The - and -axes show the offset of the pointings (in RA and DEC) with respect to the centre of the galaxy.
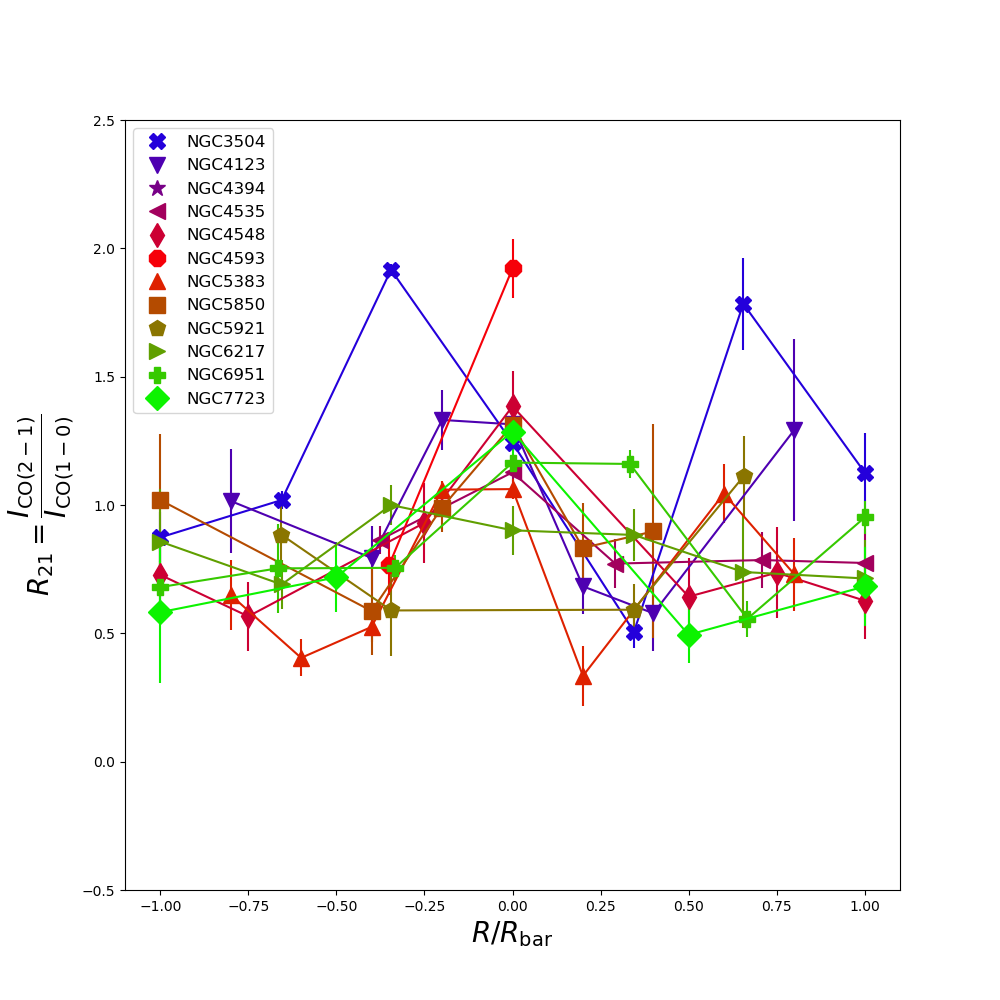
The CO spectra and intensities are expressed on the main beam temperature scale (), which is computed from the forward and beam efficiency: = (at 115 GHz, = 0.95, and = 0.75 for the IRAM-30m). The velocity resolution varies between 10.4 and 10.5 km s-1, which is adequate for our purposes because it is similar to the typical velocity dispersion of molecular clouds (e.g. Stark, 1984). We simultaneously observed CO(2-1) (230 GHz); these data are suitable for studying the gas excitation (see Appendix F) and molecular gas masses within a beam of size 0.9-2.0 kpc (″), which is two times better resolution than CO(1-0). The obtained CO(1-0) and CO(2-1) spectra are available online at the CDS associated with this publication.
In addition to the statistical error of the velocity-integrated line intensities, a typical flux calibration error has to be taken into account. We adopt the errors determined in Lisenfeld et al. (2019), for CO(1-0) and for CO(2-1), derived from observations of several sources on different days. Despite the higher resolution achieved using CO(2-1), here we opt to use CO(1-0) to estimate molecular gas masses, given the higher calibration error and poorer quality of the CO(2-1) spectra. Even so, in Appendix E we show that the results in this paper are consistently similar when CO(2-1)-based estimates are used, confirming that the resolution is not a big issue (on kiloparsec scales) in the statistical trends presented in this paper.
The current availability of homogeneous and state-of-the-art UV and IR datasets (Sects. 2.3 and 2.4) makes the exploitation of these CO(1-0) data especially timely, as it allows accurate measurements of star formation efficiencies (Sect. 5). While the use of interferometric data would maximise the spatial resolution (which is a caveat of this work), single-dish observations guarantee the recovery of all the CO flux along the bar major-axis.
2.3 GALEX ultraviolet imaging
We use the sky-subtracted and masked images from the GALEX/S4G UV-IR catalogue by Bouquin et al. (2018), that had been gathered from the GALEX GR6/7 Data Release333 http://galex.stsci.edu/GR6/ and reduced following Gil de Paz et al. (2007). Specifically, we use near-UV (NUV; ) and far-UV (FUV; ) photometry. Following Gil de Paz et al. (2007), we adopt a calibration error (0.15 mag) for both the FUV and NUV bands, but we note that Morrissey et al. (2007) give smaller errors ( and for FUV and NUV, respectively).
For NGC 6951 (not in S4G) we obtained and processed the GALEX NUV GR6/7 image ourselves; to our knowledge no usable FUV image exists for this galaxy. Emission at FUV wavelengths trace recent SF, of the order of several tens to Myr, while NUV traces 300 Myr populations (Kennicutt, 1998a; Boquien et al., 2014).
Unless stated otherwise, we hereafter use NUV as the ultraviolet SF tracer for the sake of maximising the sample coverage. In Appendix C we show that FUV and NUV yield similar results; this is also discussed in the following sections.
2.4 WISE IR data
Dust re-radiates the absorbed UV in mid-IR wavelengths. In order to trace the dust-enshrouded SF (Sect. 4) we use data from the Wide-field Infrared Survey Explorer (Wright et al., 2010) in the WISE 3 ( m) and WISE 4 ( m) passbands, that exist for all the spiral galaxies in our sample (Jarrett et al., 2011). Stellar masses () within the CO pointings are likewise computed using WISE 1 ( m), while WISE 2 ( m) and WISE 3 are used to calculate IR colours and get a hint of non-stellar emission and AGN activity. Hereafter, we refer to the WISE passbands with the letter ‘W’.
The WISE images were downloaded from the NASA/IPAC Infrared Science archive444 https://irsa.ipac.caltech.edu/applications/wise/ . We subtracted the global background using the Python package photutils. In this process, we masked emission that was above 2 for at least five connected pixels as belonging to the source. Both the mask making and the background subtraction use sigma-clipped statistics to calculate the median and mean values. After subtracting the global background, the WISE maps were converted from digital numbers into janskys (Jy) using the photometric zero points given in Table 1 of the Explanatory Supplement to the WISE All-Sky Data Release Products555 https://wise2.ipac.caltech.edu/docs/release/allsky/expsup/sec23f.html .
Following Jarrett et al. (2013, see their Sect. 3.5), we performed three corrections for extended source photometry. First, we applied an aperture correction that accounts for the point spread function (PSF) profile fitting used in the WISE absolute photometric calibration. The corrections are 0.034, 0.041, 0.030, and 0.029 mag for the W1, W2, W3, and W4 bands, respectively, and the uncertainty is 1%. The second correction is a colour correction that accounts for the spectral signature of the source convolved with the WISE relative system response. The colour correction is given in Wright et al. (2010) and in the WISE Explanatory Supplement 21, Section IV.4.h. For bands W1, W2, and W4 this corrections is always very small, 1%, and we neglect it, but for W3 it can be as large as . The third correction, related to a discrepancy in the calibration between the WISE photometric standard blue stars and red galaxies, only applies to the W4 images and accounts for a factor of 0.92 (Jarrett et al., 2011) for non-bulge dominated objects (W2-W3 ¿ 1.3 mag, which is the case for our objects). The calibration accuracy of the WISE maps is 2.4%, 2.8%, 4.5%, and 5.7% for the W1, W2, W3, and W4 images, respectively (Jarrett et al., 2011).
3 Integrated CO spectra and molecular gas mass
From the CO(1-0) spectra measured along the bars (Sect. 2.2), we obtain the velocity-integrated intensities (in K km s-1)
| (3) |
by summing the spectra over the visually determined zero-level velocity width, using the Python SciPy package for the Simpson’s rule (i.e. approximating each part of the line with parabolas to perform the numerical integration). We estimate the uncertainty as
| (4) |
where is the channel width (10.45 km s-1), is the total line width, and is the root mean square (rms) noise of the spectrum, calculated outside the line emission. We checked that increasing by and results in a median difference in of and , respectively, which is lower than the median error () on (Eq. 4). We also confirmed that the velocity-integrated intensities determined within the line width agree well with those obtained from Gaussian fits, the difference being (consistent with Alatalo et al., 2016). We hence conclude that the measurement procedure is not a source of major uncertainty in the estimates.
In the event of no detection (which is only the case for four spectra of the outermost pointings of NGC 4593 and NGC 5383) we calculated the upper limit as
| (5) |
For CO(1-0) we adopted a value of km s-1, which is the median line width of CO(1-0) in this work. These pointings are shown as arrows in the plots. For CO(2-1) we followed the same steps as in the case of CO(1-0). We adopted (CO(1-0)) if CO(1-0) was detected, and km s-1 otherwise.
We calculate the molecular gas mass () from the CO(1-0) luminosity () following Solomon et al. (1997),
| (6) |
where is the CO line flux (in Jy km s-1), is the distance in Mpc, the redshift, and is the rest frequency of the line in GHz, and then
| (7) |
We adopt the Galactic value (K km s-1 pc-2)-1 (Bolatto et al., 2013). This conversion factor corresponds to (Dickman et al., 1986; Bigiel et al., 2011). The factor includes the mass of helium and heavy metals (as in e.g. Bigiel et al., 2011; Bolatto et al., 2013). Molecular gas surface density profiles (, in units of M⊙ pc-2) are obtained as
| (8) |
where corresponds to the disk inclination. Inclination corrections (see also Eqs. 12 and 13) are performed following Leroy et al. (2008) and Leroy et al. (2019), among others. We do not take into account the 3D geometry of the bar or bulge; this parametrisation is beyond the scope of this paper.
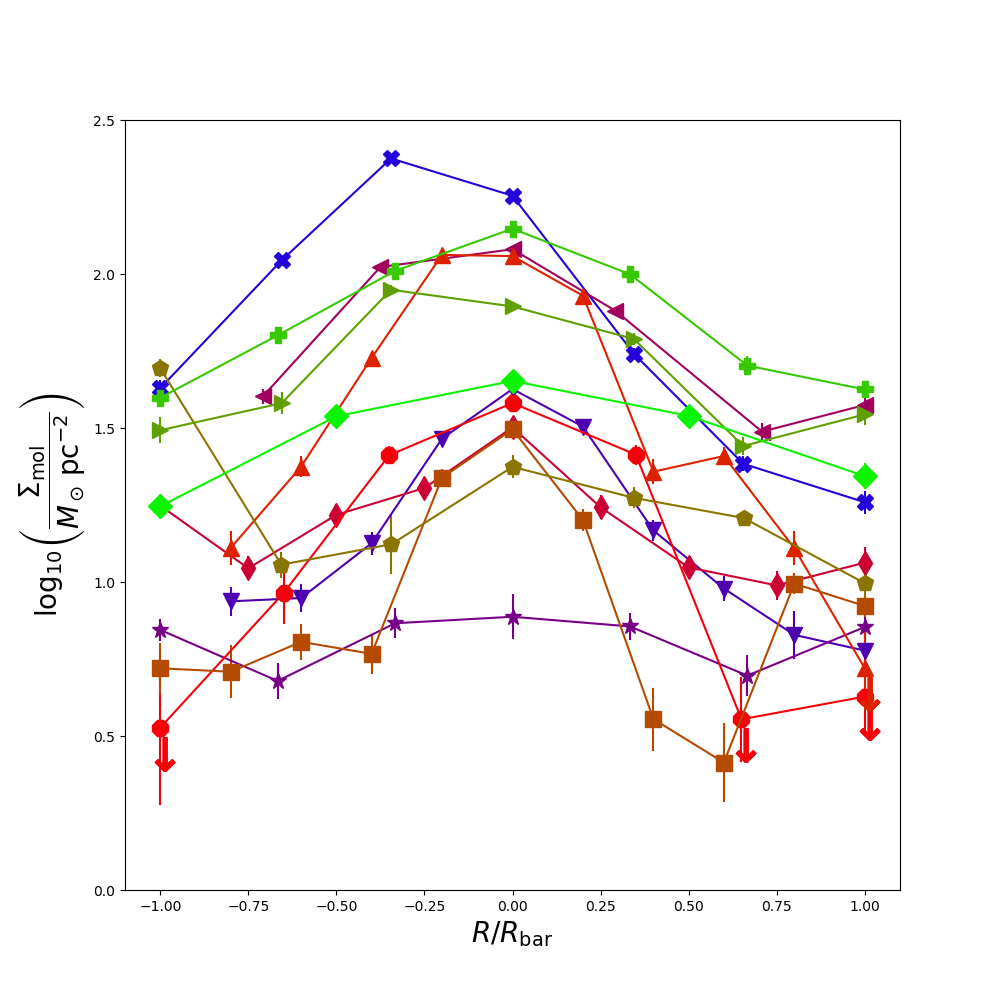
The profiles along the bar major axes are shown in the upper panel of Fig. 4. The molecular gas is typically concentrated in the centre of galaxies, and in some cases we detect peaks at one or both edges of the bars (e.g. NGC 4394, NGC 5850, NGC 4548, NGC 5921). In a few cases (e.g. NGC 3504 or NGC 5921) the profiles are rather asymmetric, while in NGC 7723 it is shallower than in the rest of the sample. In Appendix B we list, for each of the pointings, the corresponding J2000 equatorial coordinates, velocity-integrated intensities, molecular gas masses, and surface densities.
We report values that are consistent with those in the literature. Bigiel et al. (2008) find average values of for disks of local non-barred spiral galaxies of 10-15 pc-2. At the bar region, is typically in the range 20-90 pc-2 (Reynaud & Downes, 1998; Regan et al., 1999; Kuno et al., 2007; Muraoka et al., 2016; Maeda et al., 2018; Yajima et al., 2019; Maeda et al., 2020), under the assumption of a common (K km s-1 pc-2)-1, as used here. Our use of a bigger sample reveals a somewhat larger range: varies by orders of magnitude between the probed galaxies. All apertures along the bar of NGC 4394 have pc-2. The central peaks of NGC 4535, NGC 5383, and NGC 6951 are larger than 50 pc-2 (see Fig. 4); in the case of NGC 3504 goes beyond 100 pc-2 and is rather asymmetric, which is likely explained by the efficiency of these strong bars in sweeping the disk gas and enhancing its central concentration (e.g. Sellwood & Wilkinson, 1993, and references therein).
4 Star formation rates and stellar masses

In order to calculate the SFR and within each IRAM pointing, we perform aperture photometry over the GALEX FUV and NUV and WISE 1-2-3-4 images with the aid of Python’s photutils and astropy packages. We proceed in the following way. We multiply the corresponding background-subtracted GALEXand WISE images, , with the IRAM beam pattern (approximated as a normalised Gaussian beam) placed at the position where the CO beam was pointed during the IRAM-30m CO(1-0) observations (:
| (9) |
The Gaussian standard deviation () is related to the FWHM as = FWHM/ = FWHM/2.35. From the resulting maps, , we then measure the total fluxes (in Jy). The resulting values are listed in Appendix D, together with the errors, taken as the quadratical sum of the calibration error (which is dominant) and the photometric error. We then compute the luminosities (in erg s-1 Hz and (in erg s-1).
We compute dust attenuation-corrected SFRs combining GALEX NUV emission-line and WISE infrared continuum measurements at 12 m (W3) and 22 m (W4). We use the linear ‘hybrid’ SFR calibrations from the GALEX-SDSS-WISE Legacy Catalog (Salim et al., 2016, 2018), as reported by Leroy et al. (2019, see their Table. 7):
| (10) |
| (11) |
W3 and W4 are robust mid-IR SF tracers used to trace dust-enshrouded SF (e.g. Cluver et al., 2017; Hall et al., 2018). The W3 images are an order of magnitude more sensitive to SF than the W4 (e.g. Leroy et al., 2019). Nevertheless, Leroy et al. (2019) argue that W3 suffers from larger systematic uncertainties and report variations in the W3-to-W4 ratio due to PAHs (Engelbracht et al., 2005). The centre of the W3 band is indeed close to the 11.3 m PAH emission, but is still dominated by continuum because of its relatively large bandwidth (see discussion in Cluver et al., 2017). PAH abundances are high in regions of active SF and are likely produced in molecular clouds (Sandstrom et al., 2010); PAHs can be destroyed near stars and/or AGNs where the radiation field is very intense.
In order to make sure that our analysis is not biased by the choice of the SF tracer, we tested different SF recipes (see Appendix C), including estimates from NUV, FUV, and W3-4, and different hybrid combinations. We checked and confirmed that the trends presented in this paper are qualitatively the same when FUV is used instead of NUV, but we found that the SFEs and the scatter of the KS law are somewhat sensitive to wavelength (see discussion in Sect. 5). Interestingly enough, the bulk of the SFRs in our galaxies are traced by WISE (Fig. 23). Therefore, whether we use NUV or FUV as a SF tracer does not make a big difference in the results presented in the next sections as long as they are combined with W3 or W4 (see Fig. 22). Unless stated otherwise, we estimate SFRs from NUV and W3 combined.
The star formation rate surface density (), corrected for inclination (i), in each aperture is calculated as
| (12) |
where the denominator corresponds to the 2D integral of a Gaussian beam, which we take as the FWHM (21.5″) of the IRAM beam (in units of pc) at the distance of the object, FWHMpc. This expression, together with Eq. 9, means that we calculate the weighted mean value of the SFR with the IRAM beam, where the weighting function is the IRAM beam shape.
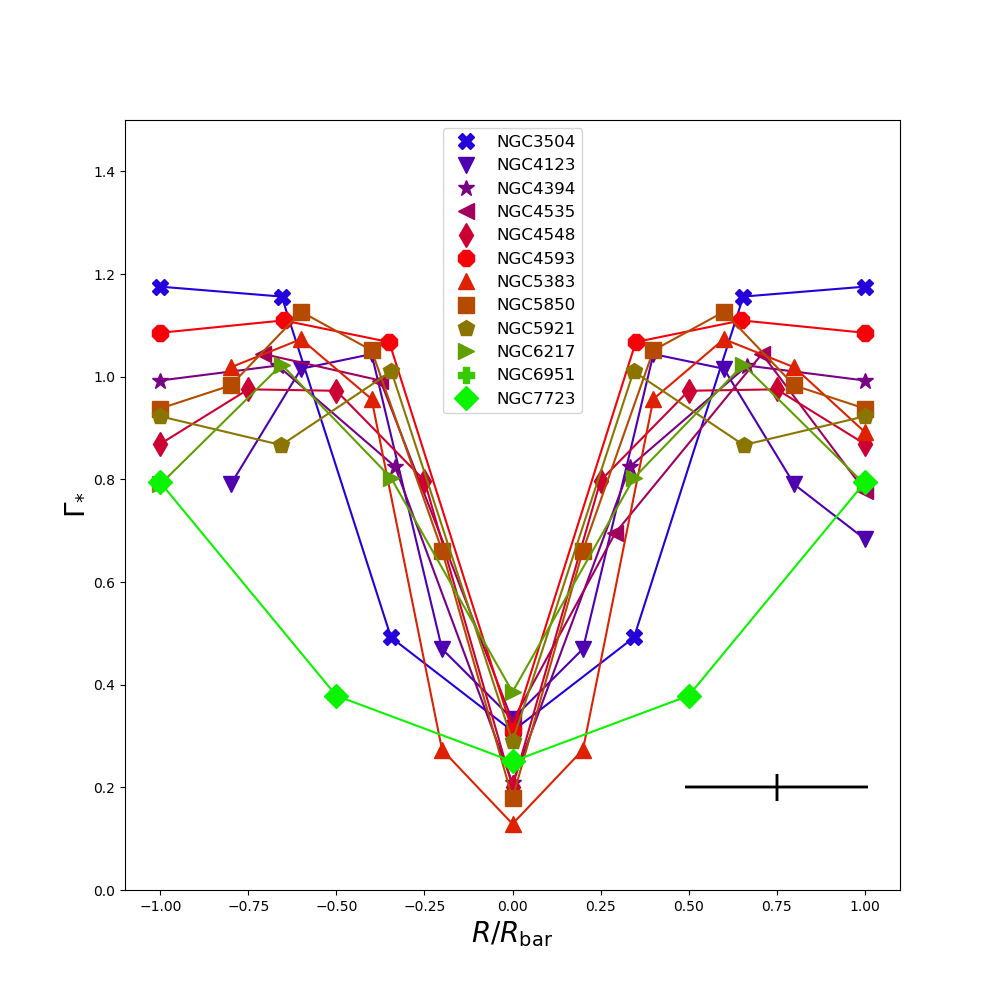
We calculate the stellar mass from the W1 fluxes within each IRAM pointing () adopting a constant mass-to-light ratio (in solar units at m, Eskew et al., 2012) and neglecting the small difference between 3.6 m (the Spitzer-IRAC 1 central wavelength) and 3.4 m (the W1 central wavelength), as done in Leroy et al. (2019), among others. With this we derive the inclination-corrected stellar mass surface density as
| (13) |
| log | ——¡1/4 | 1/4¡——¡1/2 | 1/2¡——¡3/4 | 3/4¡—— |
|---|---|---|---|---|
| NUV+W3 | -0.41 (=0.30) [=18] | -0.29 (=0.28) [=20] | -0.33 (=0.25) [=19] | -0.39 (=0.23) [=24] |
| NUV+W4 | -0.39 (=0.45) [=18] | -0.21 (=0.33) [=20] | -0.25 (=0.34) [=19] | -0.41 (=0.30) [=24] |
| FUV+W3 | -0.44 (=0.29) [=17] | -0.32 (=0.29) [=18] | -0.38 (=0.24) [=17] | -0.44 (=0.22) [=22] |
| FUV+W4 | -0.45 (=0.46) [=17] | -0.26 (=0.36) [=18] | -0.32 (=0.34) [=17] | -0.49 (=0.31) [=22] |
where is the luminosity at 3.4 m in units of solar luminosity at 3.6 m ( erg s-1, Cook et al., 2014). W1-based stellar masses are likewise utilised to normalise SFRs and obtain specific star formation rates (sSFRs) across bars. We opted not to estimate from WISE 1 and 2 colours (Zucker et al., 2016); the resulting profiles were not reliable (e.g. minima of in the centre of NGC 4593), quite possibly because of non-stellar contaminants such as hot dust and PAHs (see e.g. Zibetti & Groves, 2011; Meidt et al., 2012).
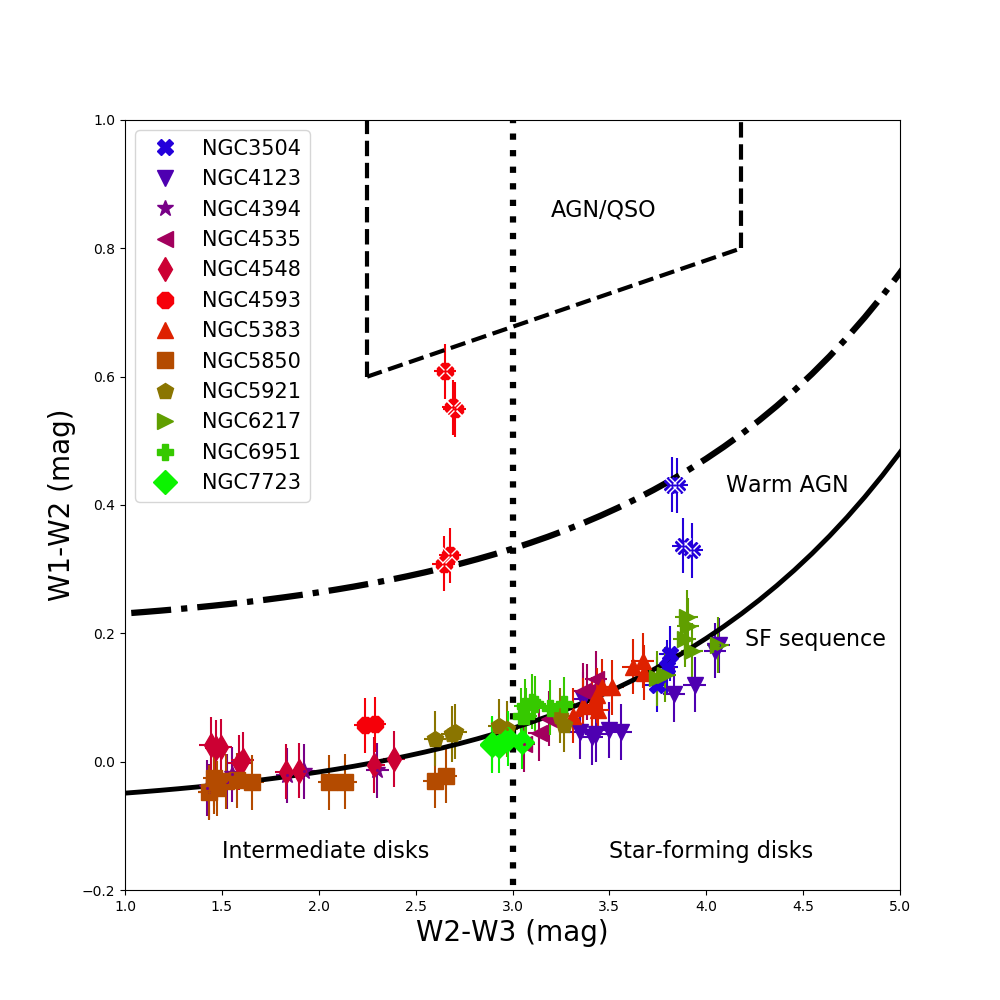
In order to assess whether AGNs might have a contribution to the computed WISE fluxes, we construct WISE colour-colour magnitude diagrams (W1-W2 versus W3-W2) for all galaxies and within each aperture (Fig. 5) and include the classifications of Jarrett et al. (2017), presented in Jarrett et al. (2019, see their Fig. 10) into star-forming galaxies and AGNs or quasars (QSOs). The majority of the sampled regions in our bars belong to the SF sequence; roughly half belong to the ‘intermediate galaxy’ class (W2-W3¡3, mostly quiescent bars as reported by Díaz-García et al., 2020) and the other half to active star-forming disks (W2-W3¿3). There are, however, a few points that lie above this SF sequence, corresponding to the central regions of NGC 4593 and NGC 3504. NGC 4593 is classified a Seyfert 1 by Véron-Cetty & Véron (2010) which can explain the elevated W1-W2 values that bring it close to the AGN–QSO region. The inferred SFRs and stellar masses within those apertures are thus less reliable. Véron-Cetty & Véron (2010) report nuclear H ii regions in NGC 3504, which show high W2-W3 and W1-W2 values. Interestingly, the WISE colours of NGC 4548, which is classified as a LINER (Véron-Cetty & Véron, 2010), are not affected by this nuclear activity and are entirely compatible with the SF sequence. This is also the case of the active galaxy NGC 6951 (Ho et al., 1997; Pérez et al., 2000). We note that in some cases the identification of AGN footprints may be hindered by the large size of the beams used. In Fig. 5 and the following figures we use x symbols to indicate pointings whose elevated W2-W1 colours are suggestive of the presence of AGNs.
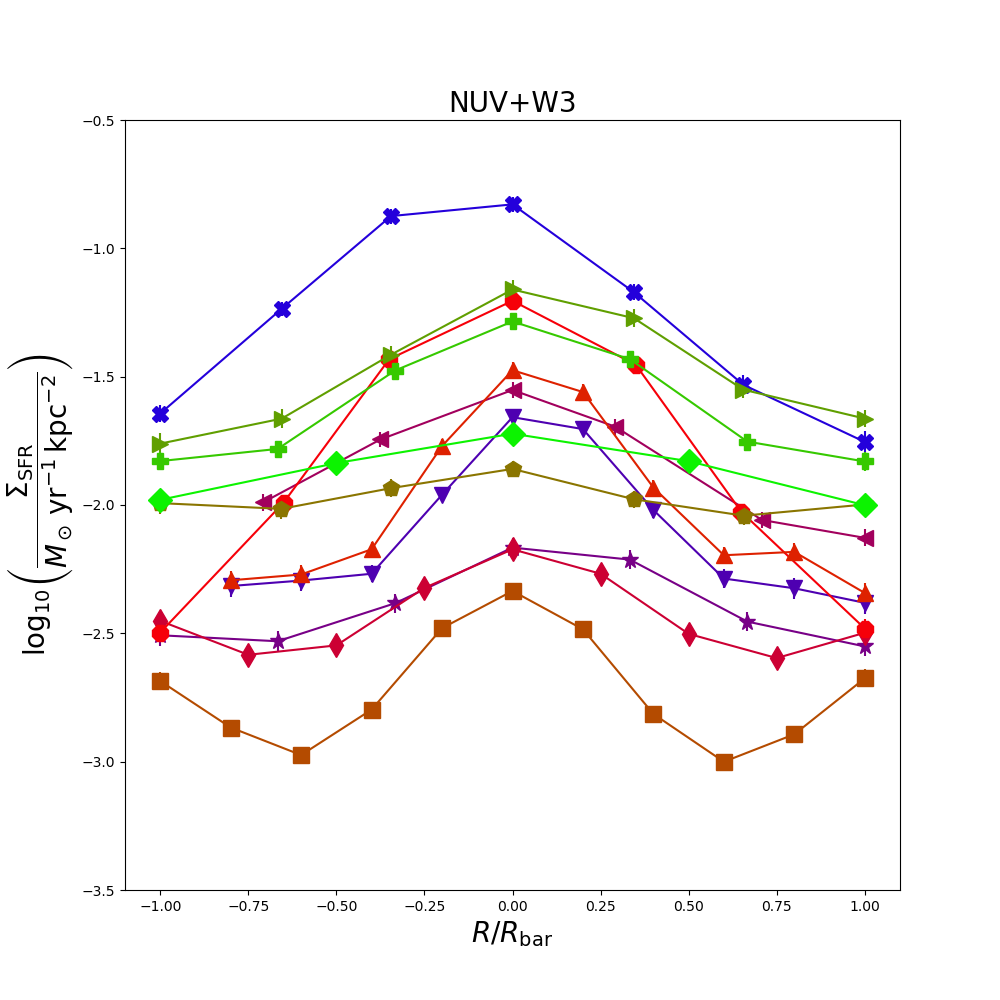
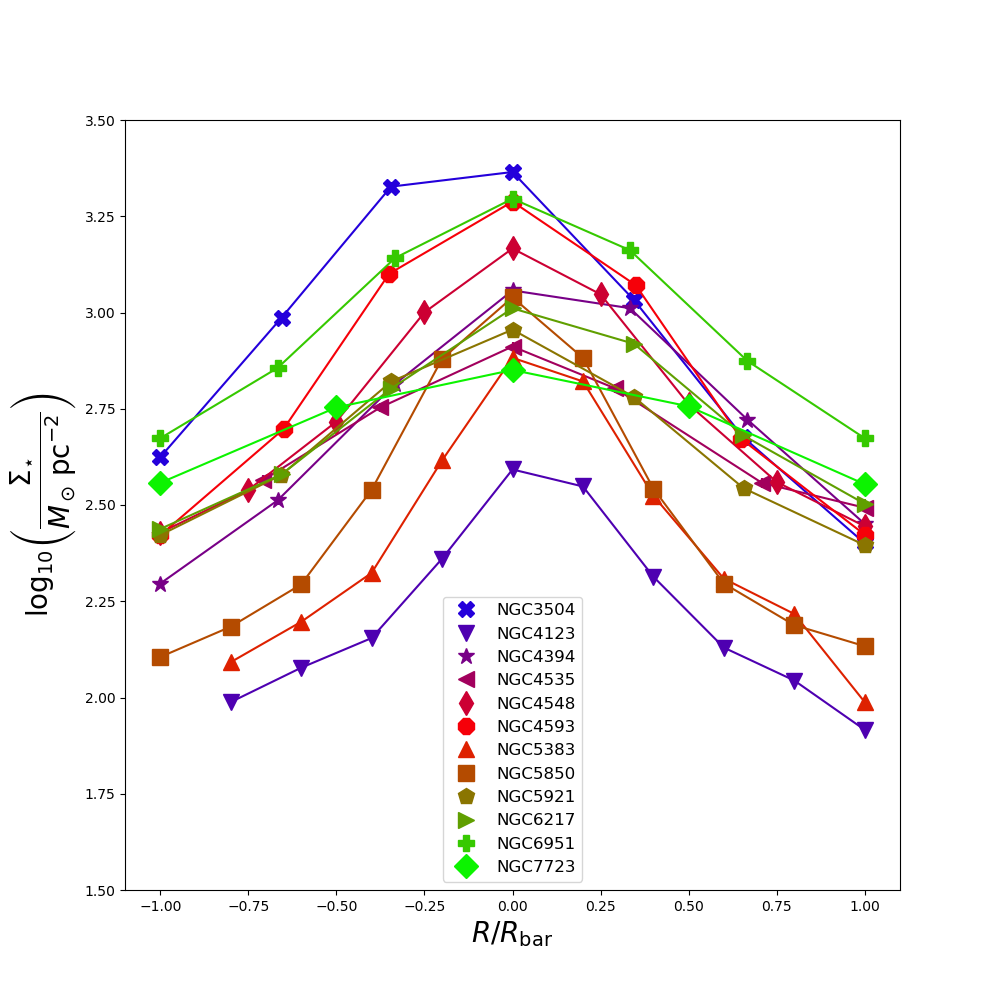
The profiles along bars of star formation rate surface density and stellar surface density are shown in the central and lower panels of Fig. 4, respectively. Their shapes are quite similar to those of molecular gas surface density, shown in the upper panel. All profiles are centrally peaked; some of these peaks are associated with the presence of nuclear rings (e.g. NGC 5383 and NGC 5850), including the case of NGC 6951 (e.g. Kohno et al., 1999). A few galaxies (e.g. NGC and NGC show humps at the bar ends. In general, three galaxies in our sample (NGC 4394, NGC 4548, and NGC 5850) show low levels of SF along the bar major-axis. The visual inspection of the FUV images of NGC 4123, NGC 6951, and NGC 6217 (only in the north-east) also reveal SF gaps along the bar (see e.g. Díaz-García et al., 2020); these gaps are typically smaller than the IRAM-30m pointings and cannot be resolved. The values directly obtained from FUV in this work (Appendix C) for S0/a-Sc galaxies are consistent with the average profiles along bars presented by Díaz-García et al. (2020) for . They report a standard deviation of mag of the FUV emission in the inner parts of galaxies with log.
None of the profiles show enhancements at the bar ends. This is not surprising as these galaxies do not have ansae structures (stellar blobs at the end of the bars; Danby, 1965) even though most ansae are detected in early-type spiral galaxies, like some of the ones probed in this work (e.g. Martinez-Valpuesta et al., 2007; Laurikainen et al., 2007). Our galaxies are characterised by large central mass concentrations. At least four galaxies (NGC 4394, NGC 4548, NGC 4593, and NGC 5850) host barlenses (which are lens-like stellar structures embedded in bars postulated to be the face-on counterparts of boxy or peanut bulges; e.g. Laurikainen et al., 2014; Athanassoula et al., 2015), nuclear rings and bars (NGC 5850), or nuclear lenses (NGC 3504 and NGC 4394), according to Buta et al. (2015) and/or the NED, as shown in Table 1.
The resulting values of and are tabulated in Appendix D. The relationship between the values of SFRs and , presented here, and molecular gas masses is analysed in the next section.
5 Star formation efficiency along bars
Here we study the relationship between and in bars, so that we can determine whether the SF activity is mainly controlled by the H2 mass (i.e. GMCs and diffuse molecular gas) or by distinct physical conditions in bars. We quantify the link between star formation and molecular gas by measuring the star formation efficiency SFE = . SFE is the inverse of the gas depletion time (), which is the time needed to use up the existing gas reservoirs at a given SFR.
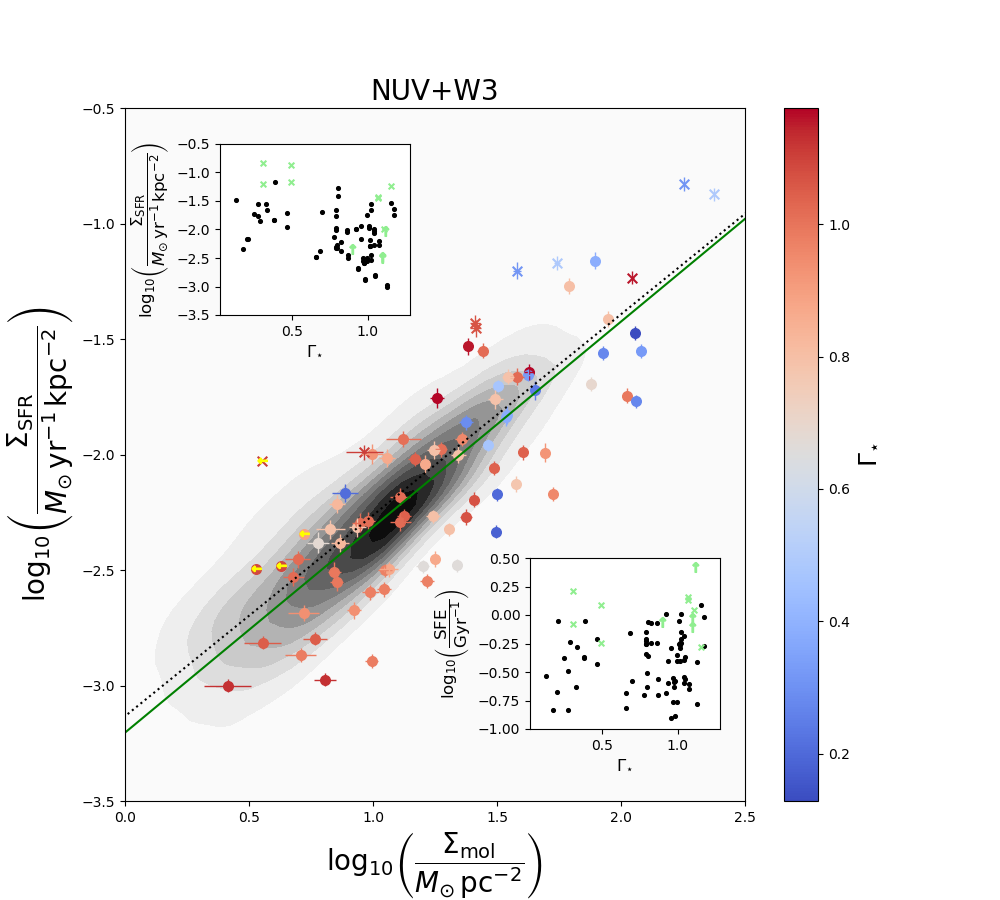
The SFEs are calculated within each of the pointings sampling the bars in our sample. and are correlated even within bars (see Fig. 6). This means that, on average, the presence of ionised regions in strong bars is to a large extent controlled by the availability of H2 gas, even though the timescales for SF might well be larger than those of the inflow of GMCs along the bars (see e.g. the models by Pérez & Freeman, 2006). The local KS law depends on the spatial resolution of the data; for example, a higher slope of the scaling relation has been found for a coarser spatial resolution (e.g. Verley et al., 2010). Therefore it is instructive to compare these results to those obtained from CO(2-1) which has a two times higher angular resolution. In Appendix E we show that the reported - relation is similar when CO(2-1) spectra (beam size of kpc) are used to compute (see Fig. 25) instead of CO(1-0). On the other hand, our pointings are sufficiently large to probe physical areas ( pc) where the molecular gas mass and the star formation rates are tightly correlated, as increasing resolution can eventually wash out the scaling reported on large scales and the KS law breaks down (Schruba et al., 2010; Kruijssen & Longmore, 2014) (for a similar discussion based on the analysis of the spatially resolved star-forming main sequence, see Hall et al., 2018, and references therein).
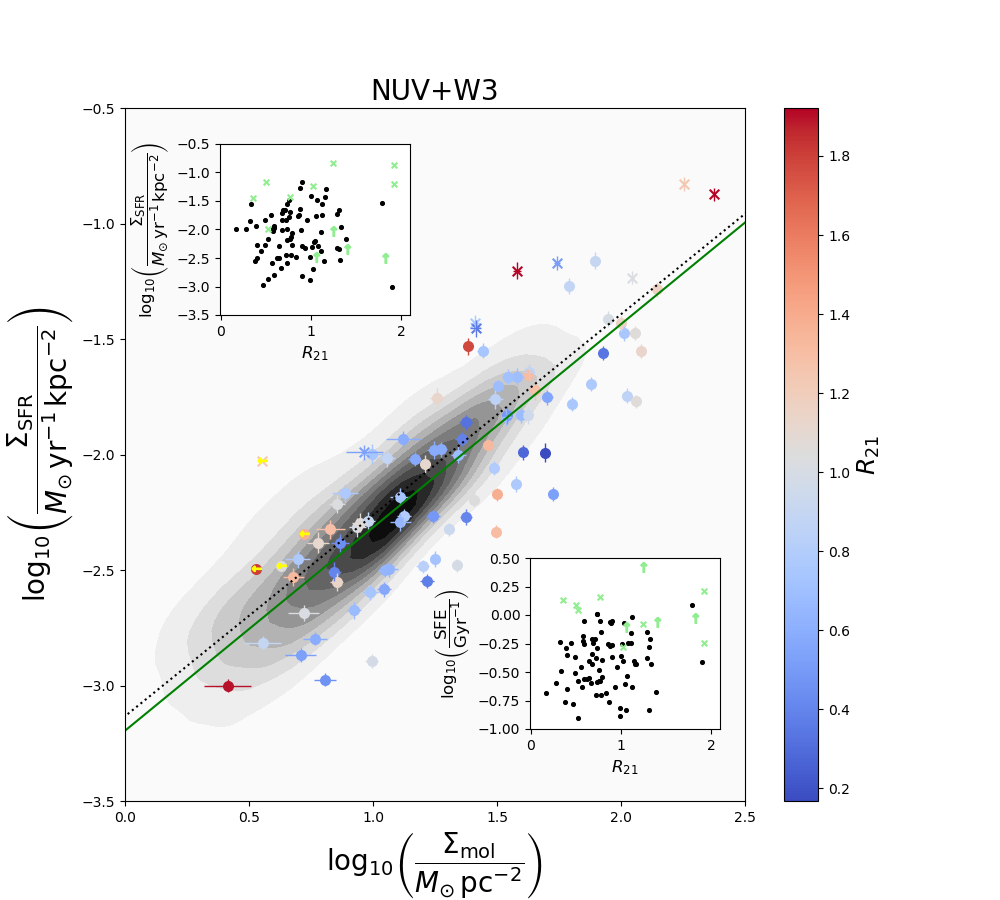
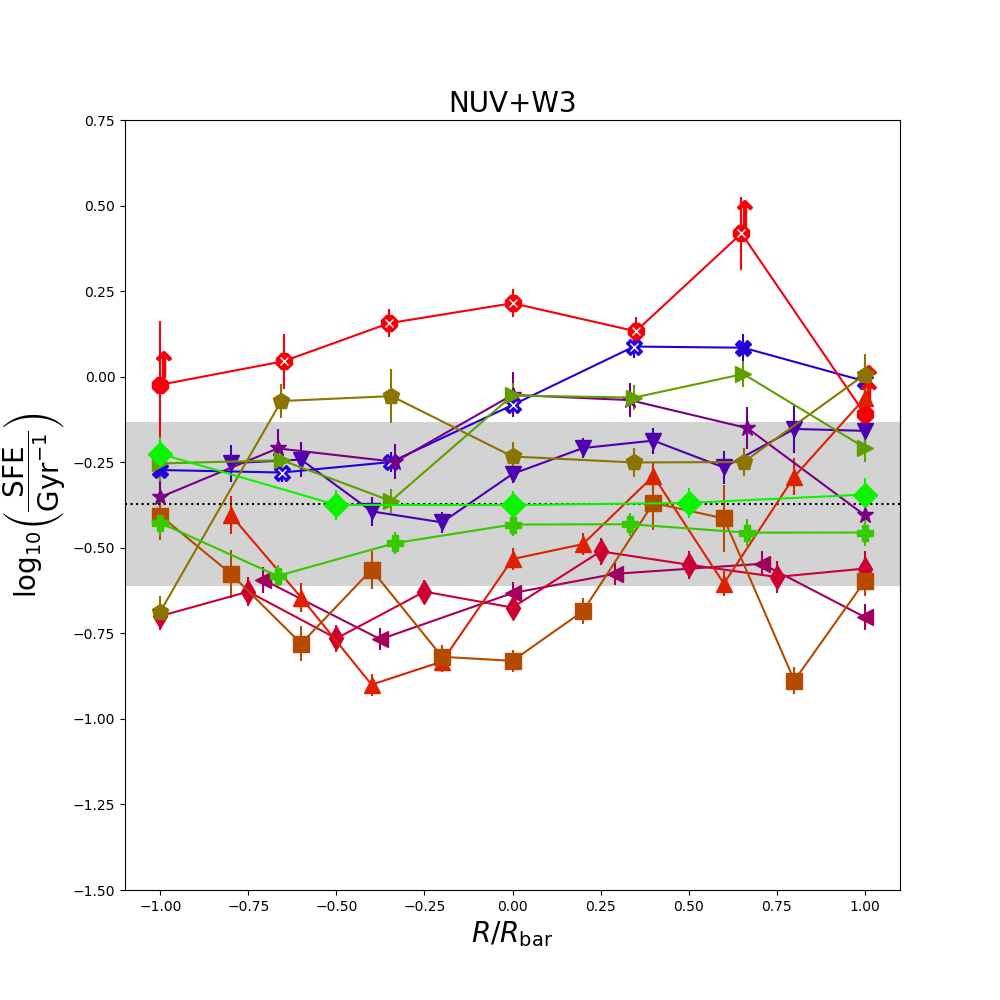
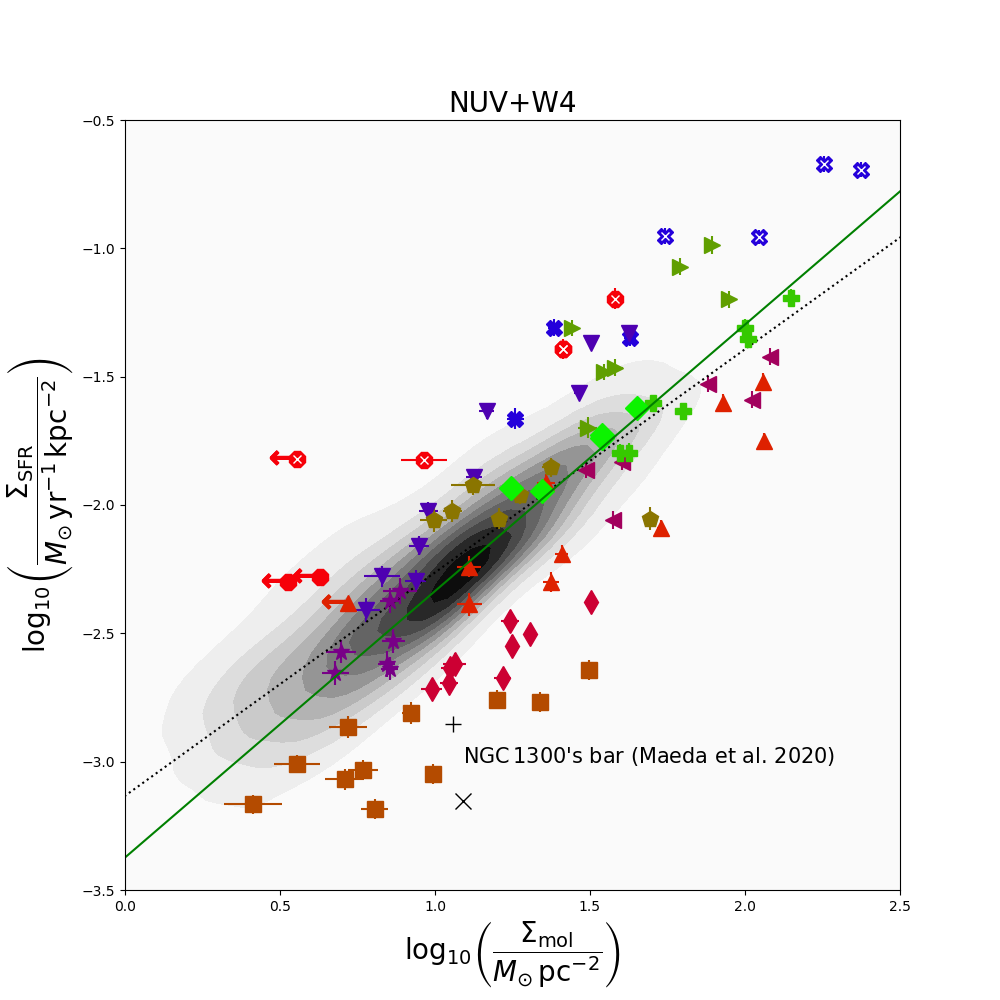
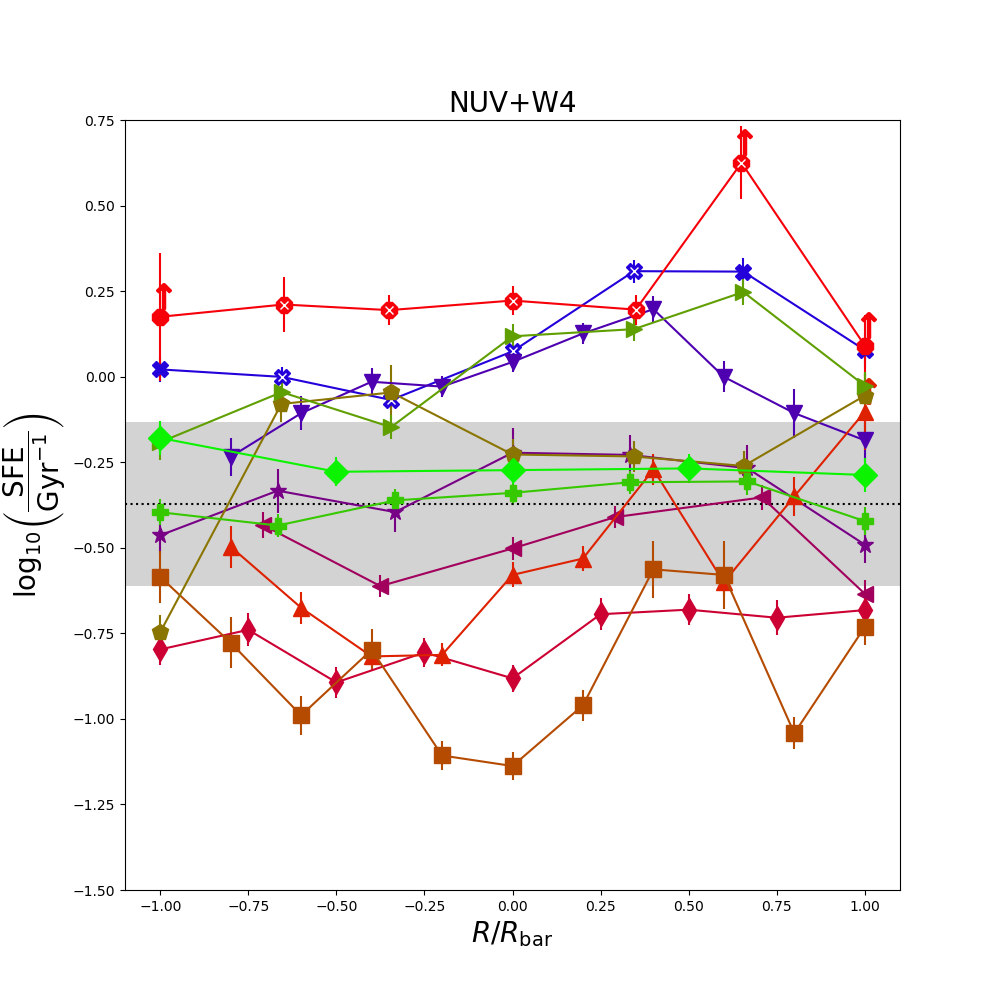
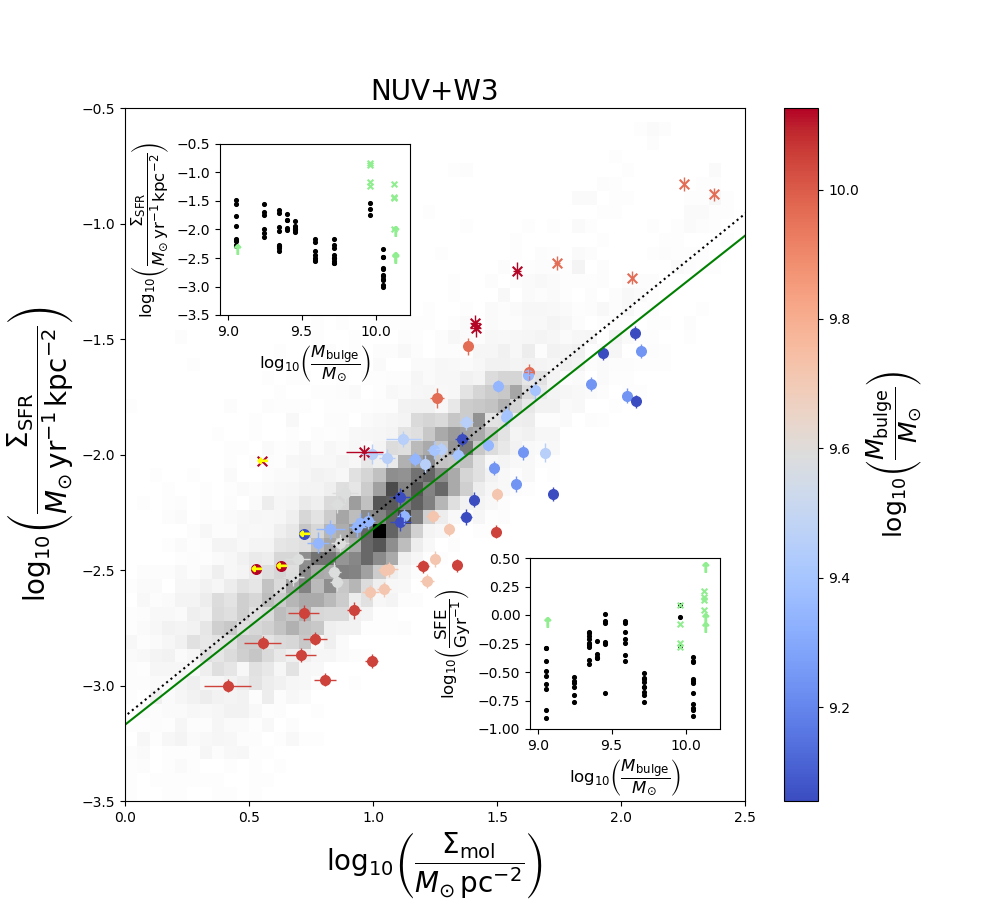
The SFEs vary between different galaxies by up to an order of magnitude (Fig. 6), ranging for SFE/Gyr-1 when is estimated from the combination NUV and W3. For a given galaxy there is no systematic trend in SFE along the bar major axis (right panel of Fig. 6). In Table. 2 we show the mean and dispersion of SFE as a function of for the different hybrid SF recipes used in this work (Sect. 4). The mean SFE in the central region (¡1/4) and bar-ends () is Gyr-1, which is roughly 0.1 dex larger than the average in the mid-part of the bar (). However, this difference is smaller than the dispersion of SFE across bars ( dex) and SFE gradients are not obvious in individual galaxies; we thus conclude that SFEs in the bar are not remarkably different than those in the central regions. While the SFE depends on the adopted SF tracer and recipe to some extent (depending on the choice the mean integrated SFE within bars varies by a maximum of 0.08 dex; Table 2), the discussed radial trends versus radius are qualitatively the same.
We note that a smaller scatter in the relation is obtained when FUV or NUV are combined with W3, instead of W4, to account for the dust (Fig. 6 and Appendix C). This is in agreement with Cluver et al. (2017), who analysed the relation between the luminosity at W3 and W4 passbands and the SF estimated from the total infrared luminosity: they conclude that the W3 SFR relation has a 1 scatter of 0.15, while the W4 SFR relation shows more scatter (0.18 dex). In this work we obtain a 1 scatter of 0.27 dex in the KS law when using SFRNUV,W3; the scatter increases to 0.37 dex for SFRNUV,W4. In addition, the 24 m diffuse emission within the IRAM-30m pointing may not be related to SFR, but rather to the circumstellar dusty envelopes of AGB stars (e.g. Verley et al., 2009); this can be another physical reason for the above-mentioned scatter when using W4.
On average, our SFE within bars are consistent with median values SFEs obtained in the literature for spiral galaxies. In particular, we compare our measurements with those reported by Bigiel et al. (2011) (median SFE 0.43 Gyr-1, dex, under the assumption of the same applied in this work), shown in black and grey in the left panels of Fig. 6 (see also Figs. 23 and 22). There is good agreement between the linear fits of the KS law in this work and that of Bigiel et al. (2011) for SFRNUV,W3, shown with solid green and black dotted lines in Fig. 6, respectively. We again report differences between W3 and W4: the slope of the KS law is larger for SFRNUV,W4 than for SFRNUV,W3 (see Table 4 in Appendix C).
The SFEs are almost a factor of 2 lower than the average in a few of our galaxies, such as NGC 5850 (¡SFE¿ Gyr-1) and NGC 4548 (¡SFE¿ Gyr-1); the resulting SFEs are even lower (by a factor of ) when using SFRNUV,W4. This is also the case of NGC 4535 (¡SFE¿ Gyr-1), which hosts H ii regions in the mid-parts of the bars. NGC 3504 and NGC 4593 are the galaxies in the sample with the highest SFE values (even larger than 1 Gyr-1); we note, however, that the measurement in the central pointings may be affected to some extent by AGN contamination (x symbols in Figs. 6 and 7), as discussed in Sect. 4.
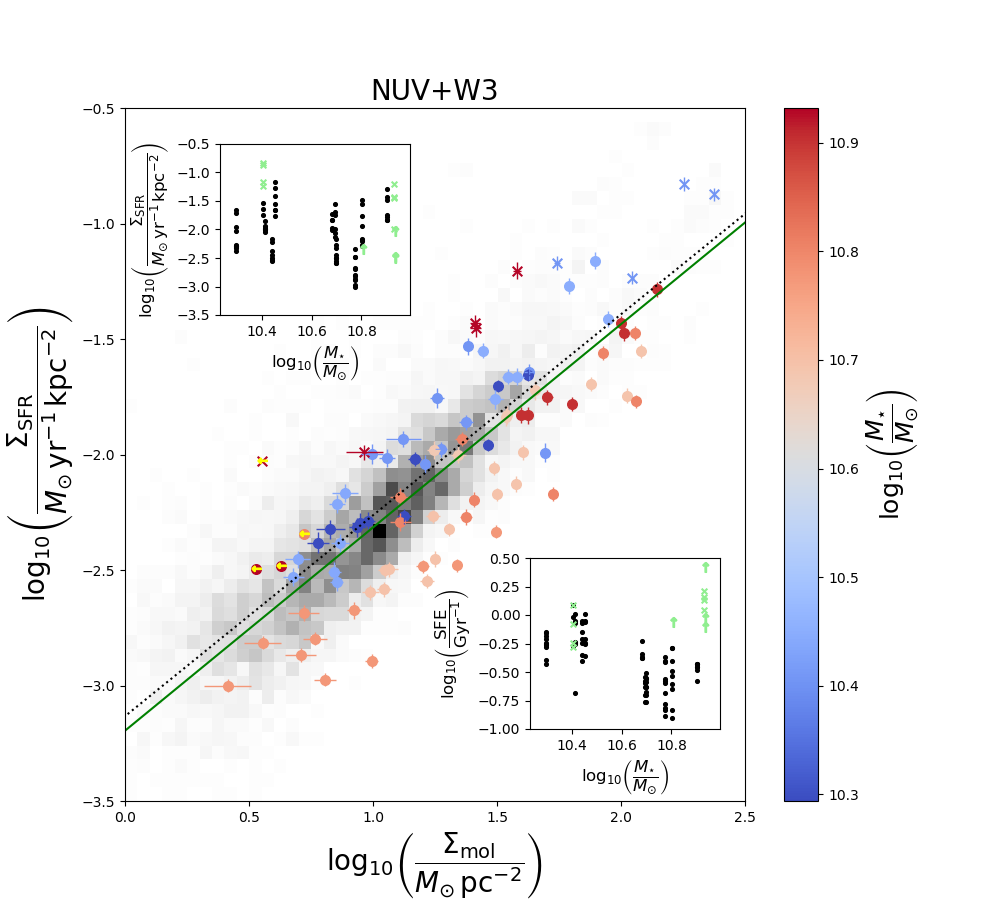
It is not trivial to explain the differences in SFE between different galaxies as they are all grand design hosting high-amplitude bars. Interestingly enough, we find a segregation as a function of the total stellar mass of the host galaxy (Fig. 7): the massive galaxies in our sample () have lower SFEs than their fainter counterparts (). In Fig. 7 we also show that the bars with the lowest and sSFR values cohabit with massive bulges, according to 2D photometric decompositions by Salo et al. (2015), and higher (Table 1, Sect. 2). Naturally, these statistical trends may imply that environmental and internal effects control the global gas availability and KS law, in the bars and elsewhere in the disk. These trends are also clear when we use FUV or WISE 4 for the SFR estimates (Fig. 24). This is further discussed in Sect. 6.2.
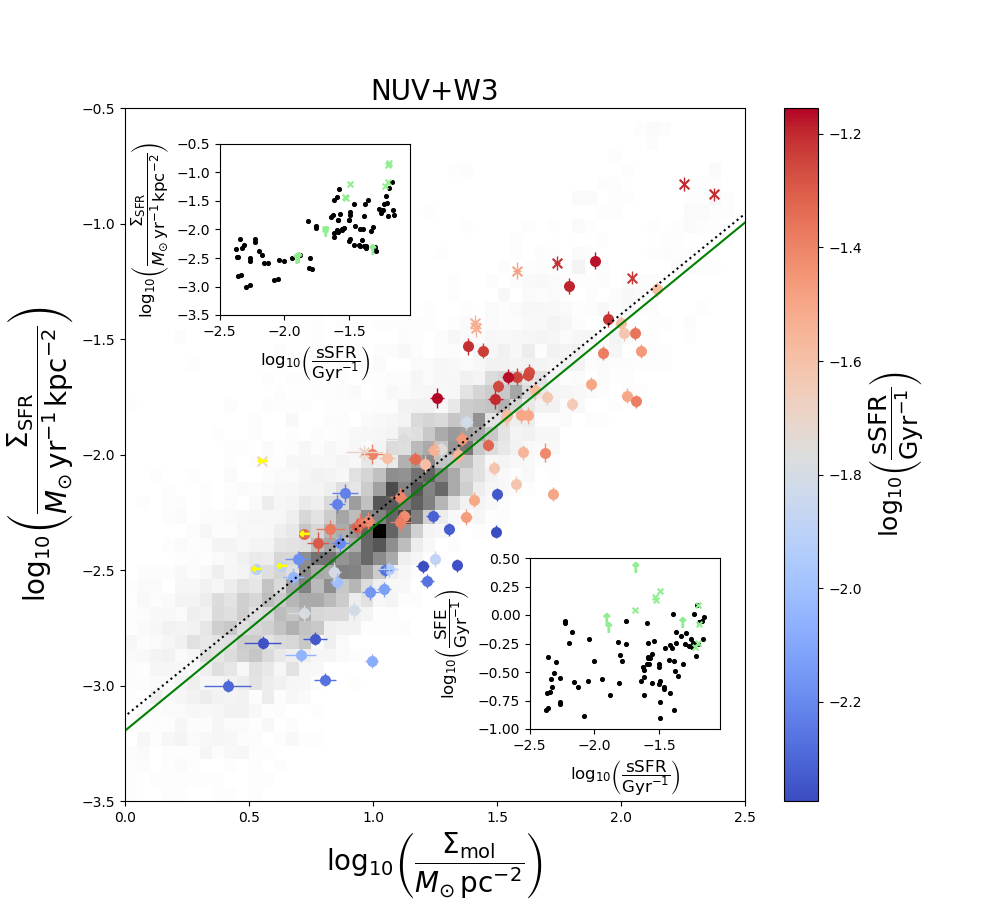
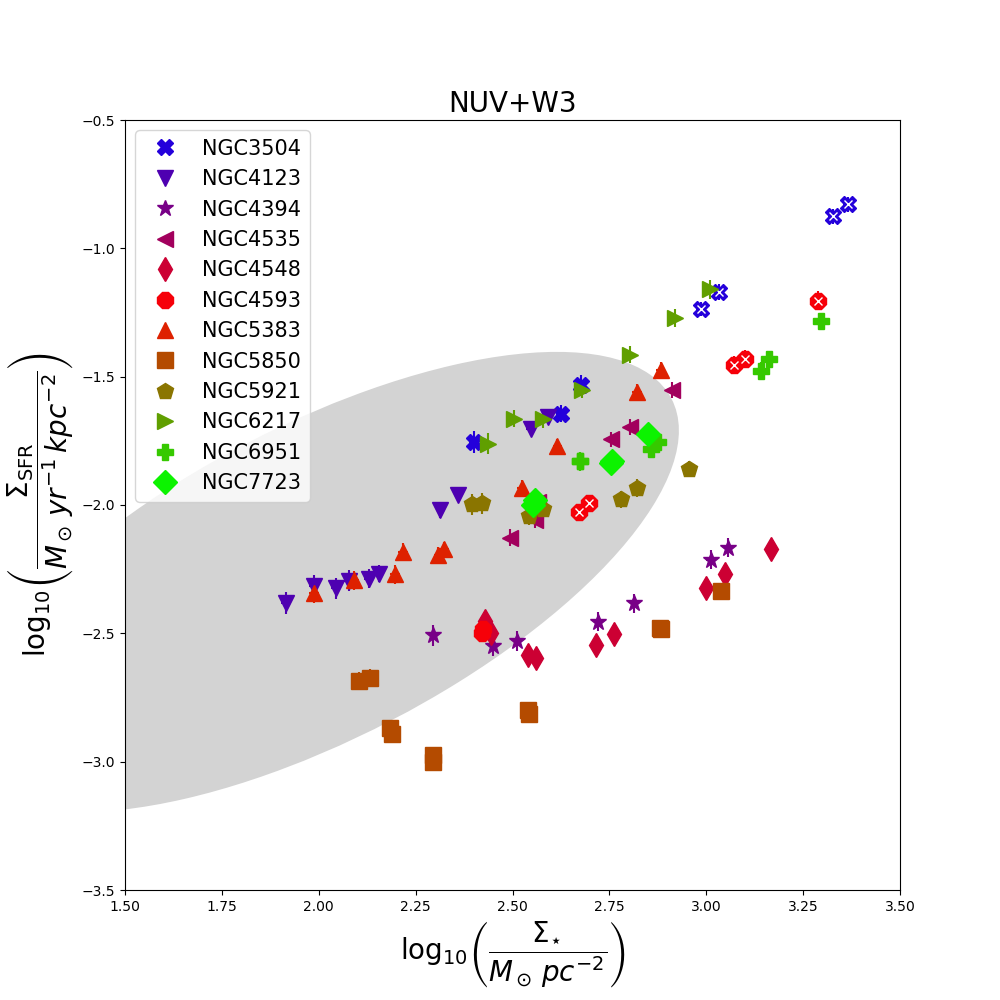
One possible source of uncertainty in our analysis of SFEs in bars is the assumption of a constant CO-to-H2 conversion factor, using the same value as found in our Galaxy (Bolatto et al., 2013). It is well accepted that can vary in different types of galaxies, and within galaxies (e.g. Sandstrom et al., 2013; Blanc et al., 2013), mainly due to its dependence on metallicity and star formation activity (see Bolatto et al., 2013, and references therein). In particular, can be considerably higher for low-metallicity galaxies (below 12 + log(O/H) 8.4, e.g. Leroy et al., 2011; Bolatto et al., 2013; Hunt et al., 2015) and lower by a factor of in extreme starbursts, as in ultraluminous infrared galaxies (ULIRGs) (Downes & Solomon, 1998, 2003). Our sample does not contain any low-metallicity galaxies nor does it contain extreme starburst galaxies, as we can see from Fig. 8 (left panel) showing that all our pointings follow the spatially resolved star-forming main sequence (Ellison et al., 2018, see their Fig. 4) or lie below it (interestingly in the case of NGC 4394, NGC 4548, and NGC 5850, which lack H ii knots and clumps in the mid-part of the bar; Díaz-García et al., 2020). This means that we do not expect large variations in due to a low metallicity or a high SFR within our sample.
A lower CO-to-H2 conversion factor in the bar region than in the rest of the disk has been suggested in previous observational work (e.g. the case of NGC 3627, studied by Morokuma-Matsui et al., 2015), but remains a matter of debate (see also Watanabe et al., 2011). Sorai et al. (2012) argues that SFEs in the bar of Maffei 2 can be underestimated by a factor of 0.5-0.8 by assuming a constant , which is linked to the presence of diffuse, non-bound, and non-optically thick molecular gas (see also the analysis of NGC 1300 by Maeda et al., 2020). We cannot entirely exclude this possibility based on our data, and we thus acknowledge that part of the dispersion of SFE along bars might be a consequence of the uncertainty. However, even if were lower, we can still conclude that SFE is not systematically low along the bars probed in this work. We also note that the central pointings of AGN hosts can have more uncertain (Papadopoulos & Seaquist, 1999; Bolatto et al., 2013). Improving the calibration is beyond the scope of this paper and is not within reach with the data presented here.
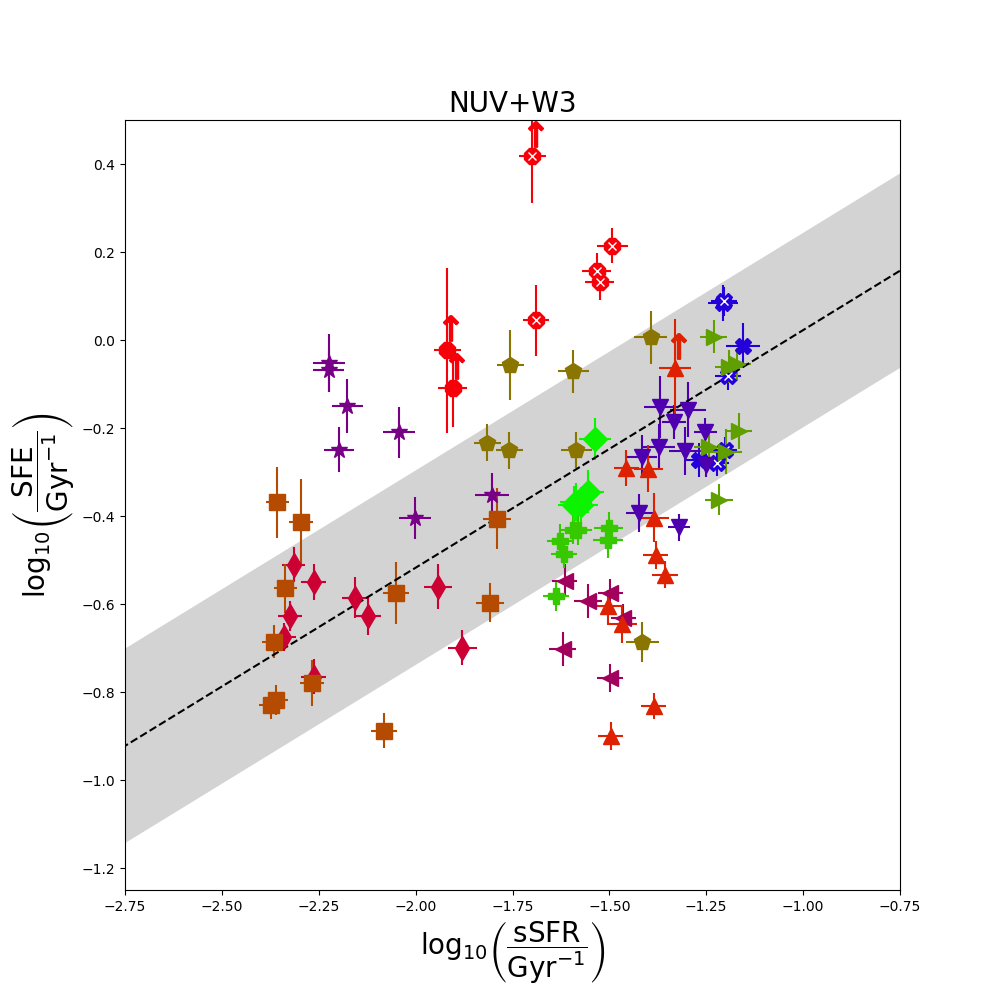
Finally, in order to illustrate the consistency of our results with COLD GASS (Saintonge et al., 2011), in the right panel of Fig. 8 we show the star formation efficiency versus specific star formation rate within bars. The grey area corresponds to the best fit () reported in COLD GASS based on global integrated measurements of the CO(1-0) line from IRAM-30m for 222 galaxies (with and without bars); the authors show the consistency in their reported H2 depletion times with integrated and resolved measurements in HERACLES (Leroy et al., 2009). Altogether, the slope of the relationship in this work coincides with the best fit reported by Saintonge et al. (2011).
5.1 Link between gravitational torques, shear, and star formation
The shear () in a galaxy is expected to be correlated with the star formation rate (Seigar, 2005). The value of can be estimated from the slope of the rotation curves (),
| (14) |
where is the angular velocity (e.g. Fujii et al., 2018) at a given radius , and in the flat regime. However, cannot be directly estimated for the galaxies in our sample as we lack ancillary high-resolution rotation curves or 2D integral field unit (IFU) or Fabry-Pérot (FP) dynamics. However we have at our disposal the stellar component (bulge+disk) of the circular velocity, from which we here calculate the shear (). Specifically, Díaz-García et al. (2016b) estimated the radial force field () by applying the NIR-QB code (Salo et al., 1999; Laurikainen & Salo, 2002) to 3.6 m S4G images, and calculated the stellar contribution to the circular velocity as
| (15) |
where is the galactocentric radius, corresponds to the radial force obtained for =1, and is the mass-to-light ratio at 3.6 m obtained by Eskew et al. (2012), which is assumed to be constant throughout the disk. Here we evaluate in the same radial ranges where the IRAM-30m dish was pointed. The value of is a lower bound of as it does not include the contribution of dark matter and gas components to the potential well, nor the contribution of non-circular motions, and thus the conclusions in this section on the -SFR connection are not definitive.
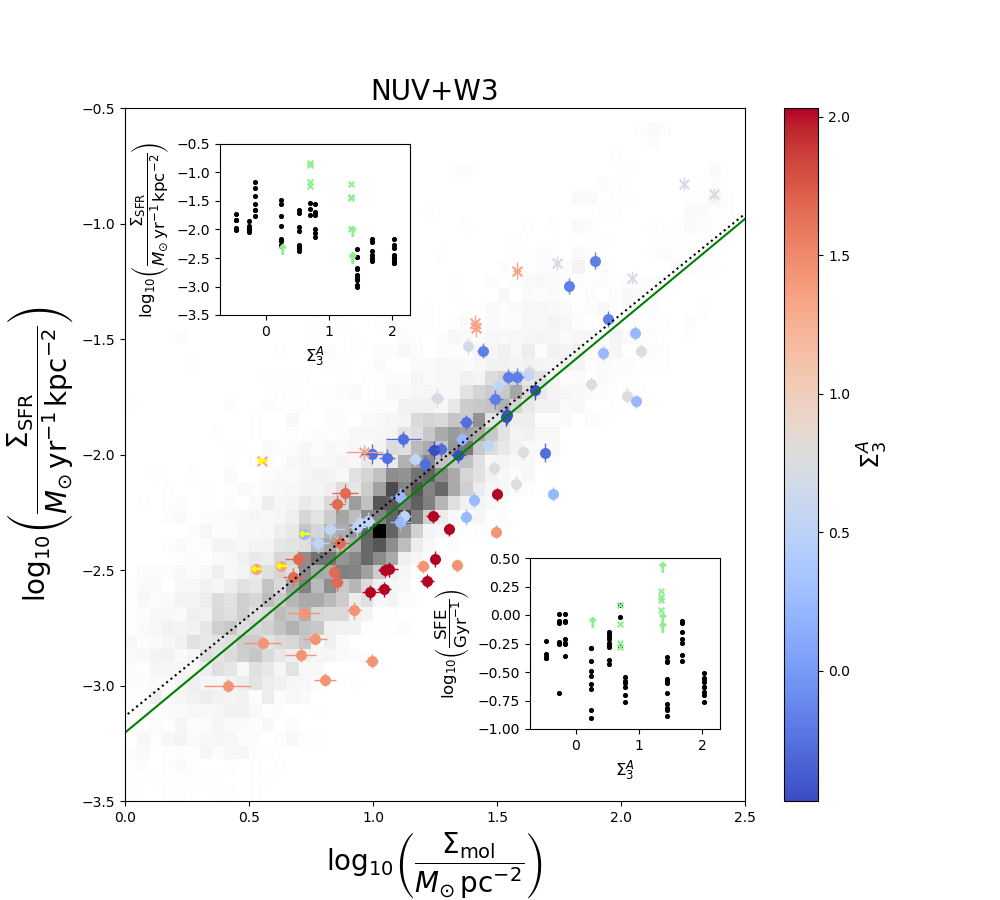
As expected, the shear rate parameter is lowest in the central regions of the galaxies (Fig. 9, upper panel) where the inner slope of the rotation curve is highest. We find that the SFR surface density is highest in the pointings with lowest shear rates (blue points in the lower panel of Fig. 9). The implications of the connection between and SFR are addressed in Sect. 6.2. Having characterised the SFEs, SFRs, and molecular gas masses within bars, we next discuss the results in light of galaxy evolution.
6 Discussion: Physical mechanisms that drive star formation in galactic bars
Bars in galaxies have been studied intensively during the last decades (e.g. Athanassoula, 2013; Kormendy, 2013; Buta, 2013, and references therein), mainly with the motivation to investigate their role in the transport of material towards the central regions of galaxies (e.g. Kormendy & Kennicutt, 2004; Bureau & Athanassoula, 2005; Pérez et al., 2009; Seidel et al., 2015; Zurita et al., 2021). The fraction of dense gas measured by HCN emission, for example, can be enhanced in bars (such as in NGC 2903; Leon et al., 2008). In some cases the funnelled gas is known to enable episodes of SF and nuclear activity (e.g. Knapen et al., 2000; Ellison et al., 2011; Oh et al., 2012; Cisternas et al., 2013; Emsellem et al., 2015; Florido et al., 2015; Vera et al., 2016; Catalán-Torrecilla et al., 2017; Lin et al., 2020) and can increase the central stellar mass (e.g. Díaz-García et al., 2016a).
The relation between H2 and SF within bars has so far received much less attention, and is not well understood yet. This is of particular interest given the extreme physical conditions of bars as places with strong shear, shocks, and non-circular velocities (e.g. Pence & Blackman, 1984; Zurita et al., 2004) or significant magnetic field strengths (e.g. Beck et al., 2002). These make them ideal testing rooms for exploring the parameters that trigger or inhibit SF since there are no obvious differences between the H ii regions in bars and those in the outer disks (e.g. Martin & Friedli, 1999). We traced the molecular gas (Sect. 3) and SF (Sect. 4) along the bars of 12 spiral galaxies (Sect. 2). These galaxies host bars with different degrees of SF, with no prior selection on gas content. We took a different approach in comparison to previous studies that either observed individual objects or a small set of galaxies (see e.g. Muraoka et al., 2016; Yajima et al., 2019), often reporting a low SFE in bars (see Maeda et al., 2020, and references therein). Instead, we used a fairly large sample of 12 galaxies and show that, on average, the SFE is not remarkably diminished in bars relative to the typical values found in spiral galaxies (for further details, see Sect. 6.2).
6.1 Spatial distribution of SF in bars
Different spatial distributions for the recent SF in bars, as traced by the H emission, have been reported (e.g. Sheth et al., 2002; Zurita & Pérez, 2008; Neumann et al., 2019; Fraser-McKelvie et al., 2020; Díaz-García et al., 2020). When any H is detected in the bar it seems to come (1) from H ii regions distributed along the bar, (2) from the nuclear or circumnuclear region with little or no emission from the bar, or (3) from the bar and the nuclear region (i.e. an intermediate case between 1 and 2) (Martin & Friedli, 1997; Verley et al., 2007a). All of the strongly barred galaxies studied in this work have prominent circumnuclear SF relative to the underlying disk, and show different degrees of SF at the mid-part of the bar (Sect. 4).
The different H bar morphologies are interpreted as stages of an evolutionary sequence of the bar by Verley et al. (2007a) based on the AMIGA project (Verdes-Montenegro et al., 2005) (see also earlier work by Martin & Friedli, 1997). The sequence starts with SF distributed along the bar. The gas is then progressively depopulated from the bar through gas inflow towards the centre of the galaxy until H emission is only seen in the nuclear or circumnuclear region. The later stage would occupy most of the bar life times, given the observed frequency. In this scenario the absence of SF in many barred galaxies is explained by the lack of gas. Furthermore, Díaz-García et al. (2020) show that strongly barred early-type spiral galaxies are characterised by a 0.5 mag brighter central UV emission (i.e. larger ), compared to their weakly barred counterparts. This scenario can indeed be explained by the efficiency of a strong bar potential at inducing central gas concentration and starbursts. Many of the barred galaxies in our sample have central values that are substantially larger than those in Bigiel et al. (2011) (Fig. 6) or Ellison et al. (2018, based on MaNGA DR13 datacubes) (Fig. 8), and those correspond to places with high specific SFRs (Fig. 7).
In addition, Díaz-García et al. (2020) showed that, on average, inner-ringed galaxies are characterised by a UV and H deficit in the central parts (see also Neumann et al., 2019, and references therein) in both barred and non-barred systems. This picture can be partially explained by gas being trapped at the 1/4 ultraharmonic resonance (Schwarz, 1984; Buta & Combes, 1996), where inner rings tend to form (e.g. Sellwood & Wilkinson, 1993; Rautiainen & Salo, 2000; Díaz-García et al., 2019a), slowing down its migration to the nuclear regions (e.g. Neumann et al., 2019). In this work the almost ubiquitous presence of inner pseudo-rings in our sample (, see Sect. 2 and Table 1) does not systematically imply a lack of molecular gas and SF along the bars. This suggests that either gas is not irreversibly caught at the 1/4 ultraharmonic resonance or that only closed, well-defined rings have a strong effect in trapping the gas particles, unlike pseudo-rings. The only galaxy in our sample with a closed ring, NGC 5850, is indeed characterised by a low-amplitude centrally peaked profile that drops along the bar showing very little SF (Fig. 4), and gets enhanced again at one of the bar ends, at the ring radius.
Distinct distributions of massive SF within bars in galaxies of different morphological types have been reported by Díaz-García et al. (2020) using both stacking techniques (NUV and FUV) and visual classifications (in both H and FUV). They also find differences in the statistical distributions of star-forming and quiescent bars as a function of physical properties, such as cold gas fraction and tangential-to-radial force ratios; for a segregation in the SFR- plane in the Mapping Nearby Galaxies at APO (MaNGA; Bundy et al., 2015), see Fraser-McKelvie et al. (2020). S0 galaxies tend to host SF exclusively in the circumnuclear regions, but are not studied in this work. Star-forming bars are most common among late-type galaxies (); Díaz-García et al. (2020) argue that this is a consequence of low shear given their lower central masses, which in turn may favour the gravitational collapse of GMCs and the formation of stars (e.g. Seigar, 2005) (see next Sect. 6.2).
Star formation at the bar ends, but scant along the bar, is typical for early- and intermediate-type spirals (Díaz-García et al., 2020). This most likely results from the interplay of gas flow, shocks, and enhanced shear in centrally concentrated galaxies with large bar amplitudes. Even so, the authors identify quite a few galaxies () with and H ii regions along bars, and a key parameter missing from their analysis is the fuel for SF. In the present paper, that purposely targets star-forming as well as quiescent bars hosted by S0/a-Sc galaxies, we show that the degree of SF in bars correlates with the mass surface density of molecular gas, in agreement with the KS law reported for disks as a whole. We detect H2 along the bars of all probed galaxies, regardless of their -type, very clearly in the circumnuclear regions (Fig. 4) and at the bar ends in some objects. The value of varies by almost 2 orders of magnitude between the probed galaxies.
Bar stacks by Díaz-García et al. (2020) show that the average FUV emission in the mid- and outer part of strong bars hosted by more than S0/a-Sc galaxies is mag arcsec-2, which corresponds to (see their Fig. 3). This value is consistent with the mean of the 12 galaxies probed in this work, as shown in the upper panel of Fig. 23; in the case of NGC 4548 and NGC 5850 , as traced from FUV, is 0.5-1 orders of magnitude lower. The quiescent bars in our sample (NGC 4394, NGC 4548, and NGC 5850), all having yr-1 kpc-2 when NUV is combined with W4 or W3, show low . Interestingly, these three bars clearly cluster below the main sequence (Fig. 8) and are also characterised by low specific SFRs (see lower panel of Fig. 7). Their atomic gas content is likely to be low as well (e.g. this is clear from the inspection of the VIVA H i map for NGC in Chung et al., 2009), but the analysis of H i is beyond the scope of this paper. Differences in SFEs between galaxies are discussed next.
6.2 The SFE is not always diminished in bars
In general, the SFEs in the bars of our galaxy sample (Fig. 6) are similar to those reported by Bigiel et al. (2011) (0.43 Gyr-1) from the analysis of 30 nearby disks at a resolution of 1 kpc (see also Bigiel et al., 2008). Of the three quiescent bars that we resolve in this work, with , NGC 4548 and NGC 5850 have a factor of 2 lower SFEs, while NGC 4394 (¡SFE¿ Gyr-1) does not. On the other hand, NGC 4535, which hosts SF along the bar, has a fairly low SFE (¡SFE¿ Gyr-1).
Combining data from the Nobeyama 45m and ALMA 12m (with no sensitivity to diffuse gas), Maeda et al. (2020) study the star formation activity in NGC 1300 and report a lower SFE at the bar region than in the bar-end or spiral arms (see their Fig. A.2). They find values of SFE at the bar region that are much lower than those in Bigiel et al. (2011). They argue that molecular gas exists in strong bars with no clear H ii regions (Maeda et al., 2018). Likewise, based on single-dish CO observations of NGC 2903 and NGC 4303, Muraoka et al. (2016) and Yajima et al. (2019) conclude that the H2 gas density in the bar regions is lower than that in the arms. Here, SFEs in the central regions are not systematically different than those in outer parts of the bar and at the beginning of the arms or rings. Maeda et al. (2020) argue that the presence of a large amount of diffuse molecular gas across bars makes the SFE low in appearance. However, they conclude that the bar SFE remains low even when diffuse gas is excluded, and thus other mechanisms might explain this trend. In addition, Maeda et al. (2020) find a tight correlation between the SFE and . is a proxy of the gas excitation (e.g. Koda et al., 2012), which Maeda et al. (2020) report to be low in the bar region of NGC 1300. We do not confirm these trends in the bars in our sample (Fig. 27; see Appendix F for further discussion).
An explanation for the presence or absence of SF are the local conditions of the gas in bars. Cloud-cloud collisions, inner-cloud turbulence, or the bar tidal field, can tear apart GMCs (e.g. Hüttemeister et al., 2000; Yajima et al., 2019) and enhance the fraction of diffuse gas. In addition, as discussed by Regan & Elmegreen (1997) and Sheth et al. (2002), GMCs can be disrupted, or their formation inhibited, by diverging streamlines on the trailing side of the bar dust lanes. Sheth et al. (2000) argue, however, that this effect can be neutralised by self-gravity. Recent models by Khoperskov et al. (2018) show that SF is less efficient in the turbulent interstellar medium, and point to the effect of bars quenching SF without needing to deplete the gas. One possible explanation for the low SFE in their galaxy (or in galaxies like NGC 4548 and NGC 5850 here) is indeed that GMCs in bars are gravitationally unbound (e.g. Meidt et al., 2013; Nimori et al., 2013), but we argue that this is not the general picture for all strong bars.
Evidence exists for the inhibition of SF based on CO observations (e.g. Reynaud & Downes, 1998). Fluid dynamic simulations of bars (e.g. Athanassoula, 1992, 2000) predict that the highest gas density loci are also the loci of strong shocks and high shear within strong bars. Observations of H velocity gradients suggest that shear makes SF drop, whereas shocks enhance it in general (Zurita et al., 2004). In Sect. 5.1 we showed that the pointings having the highest are indeed those with the lowest shear rate parameters, calculated from the stellar contribution to the circular velocity (from Díaz-García et al., 2016b). In this paper we use a lower limit of the true shear since we neglect the contribution of dark matter, gas, and non-circular motions.
The occurrence of SF at the bar ends is witnessed in simulations as well (e.g. Renaud et al., 2015). It may result from a combination of kiloparsec-scale dynamics (gas flows) and parsec-scale turbulence and clouds collisions, under a low shear, as discussed in Fraser-McKelvie et al. (2020). The same physics explain why H ii regions are preferentially located on the leading side of the bars (e.g. Athanassoula, 1992; Rozas et al., 2000; Sheth et al., 2002; Popping et al., 2010; Neumann et al., 2019; Díaz-García et al., 2020; Fraser-McKelvie et al., 2020): it is likely a consequence of shear and turbulence forces inhibiting SF everywhere but on the bar leading side (Emsellem et al., 2015; Renaud et al., 2015; Fraser-McKelvie et al., 2020) and at the bar ends.
A possible connection between bar strength and the occurrence of SF has been discussed in the past (e.g. Jogee et al., 2002), given the expectation that weaker bars have weaker shocks and shear (Athanassoula, 1992). However, to our knowledge this is not supported by any recent observational work with large unbiased samples. In some galaxies H ii regions are indeed found in bars where strong shocks and shear are also detected (e.g. Martin & Friedli, 1997; Sheth et al., 2002; Zurita et al., 2004; Zurita & Pérez, 2008). We searched for the existence of correlations of the SFE with various structural parameters, such as bar-to-total and bulge-to-total flux ratios (from Kim et al., 2014; Salo et al., 2015), bar strength (e.g. normalised Fourier amplitude or ellipticity, from Díaz-García et al., 2016b), or even tangential-to-radial forces evaluated locally (e.g. Díaz-García et al., 2019b) within the area covered by the IRAM-30m pointings; we found no evidence of any correlations (plots not shown here). This implies that either the range of bar parameters covered is too narrow (our sample only contains strong bars, Fig. 2) or that other, more fundamental, global dynamical and/or neutral gas properties can explain the differences in SFE.
We find an interesting segregation as a function of the total stellar mass of the host galaxy (Fig. 7): galaxies with highest tend to host bars with low SFE. Even though we have used the largest sample to date for the stated scientific goals, the robustness of the analysis is still limited by sample size. Thus, we encourage this result to be verified elsewhere with larger surveys, such as EDGE-CALIFA (Bolatto et al., 2017; Sánchez et al., 2021) or Physics at High Angular Resolution in Nearby GalaxieS (PHANGS; e.g. Rosolowsky et al., 2021; Anand et al., 2021; Lee et al., 2021). The analysis of SF scaling relations at 100 pc from PHANGS was released by Pessa et al. (2021) during the review process of this paper and will be analysed elsewhere.
Verley et al. (2010) conclude that for M 33 the stellar disk, which is gravitationally dominant with respect to the gaseous disk, plays a major role in driving the SFR, and the usual phase shift between gas and stellar components may also play a role to explain the aforementioned tendency. Whether the segregation of the KS law as a function of hints at the SF suppression by large-amplitude bars (typically hosted by massive galaxies; Díaz-García et al., 2016a) or points to more fundamental dynamical differences remains to be confirmed. We note that Leroy et al. (2013, see their Sect. 4.1.2) already discussed a weak correlation relating gas depletion times to galaxy masses and average surface densities (see their Fig. 7; see also Saintonge et al., 2011, 2012).
To sum up, H and far- and near-UV maps of disk galaxies show a massive SF along some bars, whereas there is a lack of SF in others. Among early- and intermediate-type galaxies, lack H ii regions along the bar, but do not (Díaz-García et al., 2020). We argue, for S0/a-Sc galaxies, that the degree of SF in bars is not primarily controlled by the SFE. Similarly, George et al. (2020) recently presented a multi- analysis of bars in NGC 3351, NGC 4579, and NGC 4725, and concludes that bars that are devoid of SF (as traced from UV) are also devoid of molecular and neutral hydrogen. Our observations are not easy to reconcile with the theoretical expectation of a lower SFE in the central parts of gas-rich barred galaxies, compared to their unbarred counterparts, or a flattening of the slope of the KS relation in the bar region (Khoperskov et al., 2018); we note, however, that our sample is not limited to gas-rich galaxies (Sect. 2). We conclude that gas depletion times are not always high along strong bars, either in the central, mid-, or end parts. Strong bars with lowest SFEs are typically hosted by massive galaxies ().
6.3 Environmental versus internal quenching
We have shown that NGC 4394, NGC 4548, and NGC 5850 host bars with remarkably low values of and sSFR. What physical mechanisms, other than those discussed so far, could have caused the quenching of SF in their bars?
Given their high values (lower right panel of Fig. 7), environmental effects are likely responsible for the low level of star formation in these systems. NGC 5850 is perturbed, as shown by Higdon et al. (1998), due to the encounter with the nearby massive elliptical NGC 5846. Using interferometric IRAM observations, Leon et al. (2000) report CO emission from the nuclear ring, whose distribution is asymmetric due to the interaction. Likewise, NGC 4394 and NGC 4548 belong to the Virgo cluster. NGC 4548 shows signatures of a past interaction, such as an inner polar ring (Sil’chenko, 2002), and is perturbed and warped (Vollmer et al., 1999).
On the other hand, other internal mechanisms, besides those discussed in Sect. 6.2, may account for the low SFE in NGC 4548 or NGC 5850. According to numerical models by Martig et al. (2009), given that SF occurs in gravitationally unstable gas disks, massive bulges can morphologically quench SF in galaxies. The stellar mass of the bulges hosted by NGC 4548 and NGC 5850 are and , respectively. This means that they are indeed two of the galaxies with the largest bulges in our sample (see the lower left panel of Figs. 7 and 24); however, we have checked that no correlation exists between the residuals of the KS law and bulge-to-total flux ratios. We conclude that both morphological and environmental quenching are likely responsible for the low and SFE in NGC 4548 and NGC 5850.
7 Summary and conclusions
The principal aim of this work was to study the processes that enhance or inhibit star formation within strong stellar bars of spiral galaxies. Bars are excellent laboratories for conducting exploratory research on SF as they are characterised by extreme physical conditions, such as strong shear, shocks, non-circular motions, and magnetic fields. We selected a sample of 12 nearby, practically face-on, strongly barred galaxies with total stellar masses , Hubble types , and different degrees of star formation in bars.
In order to trace the distribution of molecular gas within bars we obtained CO(1-0) spectra (21.5 FWHM) and CO(2-1) spectra (10.75 FWHM) with the IRAM-30m radiotelescope, performing several pointings along their major axes. At the distance to our galaxies ( Mpc), the resolution elements associated with the IRAM pointings were in the range kpc for CO(1-0) and kpc for CO(2-1). The CO spectra are made available in electronic form at the CDS linked to this publication. CO emission was detected in the full set of galaxies. We computed the molecular gas surface density () from the velocity-integrated line intensity of the CO(1-0) spectra. A remarkable central enhancement of was observed in the whole sample, while four galaxies show secondary peaks at the bar ends.
To trace the star formation (SF), we used GALEX near- and far-UV and WISE 12 and 22 m photometry. We performed aperture photometry centred on the CO pointings and computed the SFRs. We find similar distributions of the surface density of SF rate () in bars; the 12 galaxies host central starbursts, which is not surprising as strong bar torques are known to actively funnel the gas towards the central regions (e.g. Sellwood & Wilkinson, 1993). Three quiescent bars in our sample (NGC 4394, NGC 4548, and NGC 5850) have yr-1 kpc-2 as quantified from the combination of NUV and WISE 3 and WISE 4 emission along the bar major axis; interestingly, these are the galaxies in the densest environments (highest surface density to the third-nearest neighbour galaxy).
and are tightly correlated within bars. This means that the SF activity in bars of strongly barred galaxies is primarily controlled by the content of molecular gas. We calculated the star formation efficiencies (SFE = ). The SFEs within bars vary between different galaxies by up to an order of magnitude, spanning SFE/Gyr-1 when measured from NUV and WISE 3 combined, but are roughly constant along the bar major axes.
The derived SFRs and SFEs follow the typical values found in disks of spirals galaxies (e.g. Bigiel et al., 2011). We do not find remarkable differences in the KS law in the central regions of barred and non-barred galaxies, as predicted from numerical models by Khoperskov et al. (2018) for gas-rich galaxies. However, in some galaxies the SFE within bars can be a factor of lower than the average in spirals. Interestingly, the two with lowest SFE and (NGC 4548 and NGC 5850) are also those hosting massive stellar bulges, while having signatures of recent interactions; both environmental and internal quenching are plausible explanations for their low level of star formation.
In general, whether or not a strong bar hosts star-forming regions is not only determined by the degree of SFE, as has been previously claimed, and thus other physical factors must also come into play. Interestingly, the higher the total stellar mass of the galaxies, the lower the SFE within their bars. The latter needs to be verified with larger samples that include faint systems as well as weak bars as it might link the SF suppression to large-amplitude bars (typically hosted by massive galaxies, e.g. Díaz-García et al., 2016a).
The novelty of this work is that it presents a blind study of the molecular gas in bars for galaxies with different star formation distributions and properties, with the aid of multi- data. In most previous works the emphasis was placed on objects for which molecular gas was present, or objects harbouring a lot of star formation in their bars. We have shown that the star formation efficiency is not uniformly inhibited in strong bars using a fairly large sample of 12 galaxies.
Acknowledgements.
We thank the anonymous referee for a constructive and detailed report. This project has received funding from the European Union’s Horizon 2020 research and innovation programme under the Marie Skodowska-Curie grant agreement No 893673. We acknowledge financial support from the European Union’s Horizon 2020 research and innovation programme under Marie Skodowska-Curie grant agreement No 721463 to the SUNDIAL ITN network, from the State Research Agency (AEI-MCINN) of the Spanish Ministry of Science and Innovation under the grant ”The structure and evolution of galaxies and their central regions” with reference PID2019-105602GB-I00/10.13039/501100011033, and from IAC project P/300724, financed by the Ministry of Science and Innovation, through the State Budget and by the Canary Islands Department of Economy, Knowledge and Employment, through the Regional Budget of the Autonomous Community. SDG acknowledges support from the Spanish Public Employment Service (SEPE). Furthermore, we acknowledge support by the research project AYA2017-84897-P from the Spanish Ministerio de Economía y Competitividad, from the European Regional Development Funds (FEDER) and the Junta de Andalucía (Spain) grants FQM108. DE acknowledges support from a Beatriz Galindo senior fellowship (BG20/00224) from the Ministry of Science and Innovation. LVM acknowledges financial support from the grants AYA2015-65973-C3-1-R and RTI2018-096228- B-C31 (MINECO/FEDER, UE), as well as from the State Agency for Research of the Spanish MCIU through the Center of Excellence Severo Ochoa award to the Instituto de Astrofísica de Andalucía (SEV-2017-0709). This research makes use of python (http://www.python.org), Matplotlib (Hunter, 2007), and Astropy (Astropy Collaboration et al., 2013, 2018). We acknowledge the usage of the HyperLeda database (http://leda.univ-lyon1.fr). We thank Alexandre Bouquin for providing us with the GALEX FUV and NUV images used in this work. We thank Stéphane Courteau, Estrella Florido, Raúl Infante-Sainz, Tom Jarrett, Johan H. Knapen, Heikki Salo, and Miguel Querejeta for useful discussions. We thank Sébastien Comerón and Facundo D. Moyano for valuable comments on the manuscript. Facilities: GALEX, WISE, Spitzer (IRAC).References
- Aguerri et al. (2009) Aguerri, J. A. L., Méndez-Abreu, J., & Corsini, E. M. 2009, A&A, 495, 491
- Alatalo et al. (2016) Alatalo, K., Lisenfeld, U., Lanz, L., et al. 2016, ApJ, 827, 106
- Anand et al. (2021) Anand, G. S., Lee, J. C., Van Dyk, S. D., et al. 2021, MNRAS, 501, 3621
- Astropy Collaboration et al. (2018) Astropy Collaboration, Price-Whelan, A. M., Sipőcz, B. M., et al. 2018, AJ, 156, 123
- Astropy Collaboration et al. (2013) Astropy Collaboration, Robitaille, T. P., Tollerud, E. J., et al. 2013, A&A, 558, A33
- Athanassoula (1992) Athanassoula, E. 1992, MNRAS, 259, 345
- Athanassoula (2000) Athanassoula, E. 2000, in Astronomical Society of the Pacific Conference Series, Vol. 221, Stars, Gas and Dust in Galaxies: Exploring the Links, ed. D. Alloin, K. Olsen, & G. Galaz, 243
- Athanassoula (2013) Athanassoula, E. 2013, Bars and secular evolution in disk galaxies: Theoretical input, ed. J. Falcón-Barroso & J. H. Knapen, 305
- Athanassoula et al. (2015) Athanassoula, E., Laurikainen, E., Salo, H., & Bosma, A. 2015, MNRAS, 454, 3843
- Beck et al. (2002) Beck, R., Shoutenkov, V., Ehle, M., et al. 2002, A&A, 391, 83
- Bell & de Jong (2001) Bell, E. F. & de Jong, R. S. 2001, ApJ, 550, 212
- Bigiel et al. (2008) Bigiel, F., Leroy, A., Walter, F., et al. 2008, AJ, 136, 2846
- Bigiel et al. (2011) Bigiel, F., Leroy, A. K., Walter, F., et al. 2011, ApJ, 730, L13
- Blanc et al. (2013) Blanc, G. A., Schruba, A., Evans, Neal J., I., et al. 2013, ApJ, 764, 117
- Bolatto et al. (2013) Bolatto, A. D., Wolfire, M., & Leroy, A. K. 2013, ARA&A, 51, 207
- Bolatto et al. (2017) Bolatto, A. D., Wong, T., Utomo, D., et al. 2017, ApJ, 846, 159
- Boquien et al. (2014) Boquien, M., Buat, V., & Perret, V. 2014, A&A, 571, A72
- Bouquin et al. (2018) Bouquin, A. Y. K., Gil de Paz, A., Muñoz-Mateos, J. C., et al. 2018, ApJS, 234, 18
- Braine et al. (1993) Braine, J., Combes, F., Casoli, F., et al. 1993, A&AS, 97, 887
- Bundy et al. (2015) Bundy, K., Bershady, M. A., Law, D. R., et al. 2015, ApJ, 798, 7
- Bureau & Athanassoula (2005) Bureau, M. & Athanassoula, E. 2005, ApJ, 626, 159
- Buta et al. (2003) Buta, R., Block, D. L., & Knapen, J. H. 2003, AJ, 126, 1148
- Buta & Combes (1996) Buta, R. & Combes, F. 1996, Fundamentals of Cosmic Physics, 17, 95
- Buta (2013) Buta, R. J. 2013, Galaxy Morphology, ed. J. Falcón-Barroso & J. H. Knapen, 155
- Buta et al. (2015) Buta, R. J., Sheth, K., Athanassoula, E., et al. 2015, ApJS, 217, 32
- Calzetti et al. (2004) Calzetti, D., Kennicutt, R. C., Meyer, M., et al. 2004, in Bulletin of the American Astronomical Society, Vol. 36, American Astronomical Society Meeting Abstracts, 1442
- Casasola et al. (2015) Casasola, V., Hunt, L., Combes, F., & García-Burillo, S. 2015, A&A, 577, A135
- Catalán-Torrecilla et al. (2017) Catalán-Torrecilla, C., Gil de Paz, A., Castillo-Morales, A., et al. 2017, ApJ, 848, 87
- Cheung et al. (2013) Cheung, E., Athanassoula, E., Masters, K. L., et al. 2013, ApJ, 779, 162
- Chung et al. (2009) Chung, A., van Gorkom, J. H., Kenney, J. D. P., Crowl, H., & Vollmer, B. 2009, AJ, 138, 1741
- Cisternas et al. (2013) Cisternas, M., Gadotti, D. A., Knapen, J. H., et al. 2013, ApJ, 776, 50
- Cluver et al. (2017) Cluver, M. E., Jarrett, T. H., Dale, D. A., et al. 2017, ApJ, 850, 68
- Combes et al. (1990) Combes, F., Debbasch, F., Friedli, D., & Pfenniger, D. 1990, A&A, 233, 82
- Comerón et al. (2009) Comerón, S., Martínez-Valpuesta, I., Knapen, J. H., & Beckman, J. E. 2009, ApJ, 706, L256
- Cook et al. (2014) Cook, D. O., Dale, D. A., Johnson, B. D., et al. 2014, MNRAS, 445, 881
- Danby (1965) Danby, J. M. A. 1965, AJ, 70, 501
- de Vaucouleurs (1963) de Vaucouleurs, G. 1963, ApJS, 8, 31
- de Vaucouleurs & de Vaucouleurs (1963) de Vaucouleurs, G. & de Vaucouleurs, A. 1963, AJ, 68, 278
- del Río & Cepa (1999) del Río, M. S. & Cepa, J. 1999, A&AS, 134, 333
- Díaz-García et al. (2019a) Díaz-García, S., Díaz-Suárez, S., Knapen, J. H., & Salo, H. 2019a, A&A, 625, A146
- Díaz-García & Knapen (2020) Díaz-García, S. & Knapen, J. H. 2020, A&A, 635, A197
- Díaz-García et al. (2020) Díaz-García, S., Moyano, F. D., Comerón, S., et al. 2020, A&A, 644, A38
- Díaz-García et al. (2019b) Díaz-García, S., Salo, H., Knapen, J. H., & Herrera-Endoqui, M. 2019b, A&A, 631, A94
- Díaz-García et al. (2016a) Díaz-García, S., Salo, H., & Laurikainen, E. 2016a, A&A, 596, A84
- Díaz-García et al. (2016b) Díaz-García, S., Salo, H., Laurikainen, E., & Herrera-Endoqui, M. 2016b, A&A, 587, A160
- Dickman et al. (1986) Dickman, R. L., Snell, R. L., & Schloerb, F. P. 1986, ApJ, 309, 326
- Donohoe-Keyes et al. (2019) Donohoe-Keyes, C. E., Martig, M., James, P. A., & Kraljic, K. 2019, MNRAS, 489, 4992
- Downes & Solomon (1998) Downes, D. & Solomon, P. M. 1998, ApJ, 507, 615
- Downes & Solomon (2003) Downes, D. & Solomon, P. M. 2003, ApJ, 582, 37
- Ellison et al. (2011) Ellison, S. L., Nair, P., Patton, D. R., et al. 2011, MNRAS, 416, 2182
- Ellison et al. (2018) Ellison, S. L., Sánchez, S. F., Ibarra-Medel, H., et al. 2018, MNRAS, 474, 2039
- Emsellem et al. (2015) Emsellem, E., Renaud, F., Bournaud, F., et al. 2015, MNRAS, 446, 2468
- Engelbracht et al. (2005) Engelbracht, C. W., Gordon, K. D., Rieke, G. H., et al. 2005, ApJ, 628, L29
- Erwin (2005) Erwin, P. 2005, MNRAS, 364, 283
- Erwin (2018) Erwin, P. 2018, MNRAS, 474, 5372
- Erwin & Sparke (2003) Erwin, P. & Sparke, L. S. 2003, ApJS, 146, 299
- Eskew et al. (2012) Eskew, M., Zaritsky, D., & Meidt, S. 2012, AJ, 143, 139
- Eskridge et al. (2000) Eskridge, P. B., Frogel, J. A., Pogge, R. W., et al. 2000, AJ, 119, 536
- Florido et al. (2015) Florido, E., Zurita, A., Pérez, I., et al. 2015, A&A, 584, A88
- Fraser-McKelvie et al. (2020) Fraser-McKelvie, A., Aragón-Salamanca, A., Merrifield, M., et al. 2020, MNRAS, 495, 4158
- Friedli & Benz (1993) Friedli, D. & Benz, W. 1993, A&A, 268, 65
- Fujii et al. (2018) Fujii, M. S., Bédorf, J., Baba, J., & Portegies Zwart, S. 2018, MNRAS, 477, 1451
- Gadotti et al. (2007) Gadotti, D. A., Athanassoula, E., Carrasco, L., et al. 2007, MNRAS, 381, 943
- Gavazzi et al. (2015) Gavazzi, G., Consolandi, G., Dotti, M., et al. 2015, A&A, 580, A116
- George et al. (2020) George, K., Joseph, P., Mondal, C., et al. 2020, A&A, 644, A79
- Gil de Paz et al. (2007) Gil de Paz, A., Boissier, S., Madore, B. F., et al. 2007, ApJS, 173, 185
- Giovanelli & Haynes (1988) Giovanelli, R. & Haynes, M. P. 1988, Extragalactic neutral hydrogen., ed. K. I. Kellermann & G. L. Verschuur, 522–562
- Hall et al. (2018) Hall, C., Courteau, S., Jarrett, T., et al. 2018, ApJ, 865, 154
- Handa et al. (1991) Handa, T., Sofue, Y., & Nakai, N. 1991, in Dynamics of Galaxies and Their Molecular Cloud Distributions, ed. F. Combes & F. Casoli, Vol. 146, 156
- Harmsen et al. (2017) Harmsen, B., Monachesi, A., Bell, E. F., et al. 2017, MNRAS, 466, 1491
- Haywood et al. (2016) Haywood, M., Lehnert, M. D., Di Matteo, P., et al. 2016, A&A, 589, A66
- Herrera-Endoqui et al. (2015) Herrera-Endoqui, M., Díaz-García, S., Laurikainen, E., & Salo, H. 2015, A&A, 582, A86
- Heyer et al. (2009) Heyer, M., Krawczyk, C., Duval, J., & Jackson, J. M. 2009, ApJ, 699, 1092
- Higdon et al. (1998) Higdon, J. L., Buta, R. J., & Purcell, G. B. 1998, AJ, 115, 80
- Hirota et al. (2014) Hirota, A., Kuno, N., Baba, J., et al. 2014, PASJ, 66, 46
- Ho et al. (1997) Ho, L. C., Filippenko, A. V., Sargent, W. L. W., & Peng, C. Y. 1997, ApJS, 112, 391
- Hunt et al. (2015) Hunt, L. K., García-Burillo, S., Casasola, V., et al. 2015, A&A, 583, A114
- Hunter (2007) Hunter, J. D. 2007, Institute of Electrical and Electronic Engineers, 9, 90
- Hüttemeister et al. (2000) Hüttemeister, S., Aalto, S., Das, M., & Wall, W. F. 2000, A&A, 363, 93
- James et al. (2009) James, P. A., Bretherton, C. F., & Knapen, J. H. 2009, A&A, 501, 207
- James & Percival (2016) James, P. A. & Percival, S. M. 2016, MNRAS, 457, 917
- James & Percival (2018) James, P. A. & Percival, S. M. 2018, MNRAS, 474, 3101
- Jarrett et al. (2019) Jarrett, T. H., Cluver, M. E., Brown, M. J. I., et al. 2019, ApJS, 245, 25
- Jarrett et al. (2017) Jarrett, T. H., Cluver, M. E., Magoulas, C., et al. 2017, ApJ, 836, 182
- Jarrett et al. (2011) Jarrett, T. H., Cohen, M., Masci, F., et al. 2011, ApJ, 735, 112
- Jarrett et al. (2013) Jarrett, T. H., Masci, F., Tsai, C. W., et al. 2013, AJ, 145, 6
- Jedrzejewski (1987) Jedrzejewski, R. I. 1987, MNRAS, 226, 747
- Jogee et al. (2002) Jogee, S., Knapen, J. H., Laine, S., et al. 2002, ApJ, 570, L55
- Kennicutt (1998a) Kennicutt, Robert C., J. 1998a, ARA&A, 36, 189
- Kennicutt (1998b) Kennicutt, Robert C., J. 1998b, ApJ, 498, 541
- Kennicutt et al. (2007) Kennicutt, Jr., R. C., Calzetti, D., Walter, F., et al. 2007, ApJ, 671, 333
- Kennicutt et al. (2009) Kennicutt, Jr., R. C., Hao, C.-N., Calzetti, D., et al. 2009, ApJ, 703, 1672
- Khoperskov et al. (2018) Khoperskov, S., Haywood, M., Di Matteo, P., Lehnert, M. D., & Combes, F. 2018, A&A, 609, A60
- Kim et al. (2014) Kim, T., Gadotti, D. A., Sheth, K., et al. 2014, ApJ, 782, 64
- Knapen & Beckman (1996) Knapen, J. H. & Beckman, J. E. 1996, MNRAS, 283, 251
- Knapen et al. (1995) Knapen, J. H., Beckman, J. E., Heller, C. H., Shlosman, I., & de Jong, R. S. 1995, ApJ, 454, 623
- Knapen et al. (2002) Knapen, J. H., Pérez-Ramírez, D., & Laine, S. 2002, MNRAS, 337, 808
- Knapen et al. (2000) Knapen, J. H., Shlosman, I., & Peletier, R. F. 2000, ApJ, 529, 93
- Koda et al. (2012) Koda, J., Scoville, N., Hasegawa, T., et al. 2012, ApJ, 761, 41
- Kohno et al. (1999) Kohno, K., Kawabe, R., & Vila-Vilaró, B. 1999, ApJ, 511, 157
- Kormendy (2013) Kormendy, J. 2013, Secular Evolution in Disk Galaxies, ed. J. Falcón-Barroso & J. H. Knapen, 1
- Kormendy & Kennicutt (2004) Kormendy, J. & Kennicutt, Jr., R. C. 2004, ARA&A, 42, 603
- Kruijssen & Longmore (2014) Kruijssen, J. M. D. & Longmore, S. N. 2014, MNRAS, 439, 3239
- Kuno et al. (2007) Kuno, N., Sato, N., Nakanishi, H., et al. 2007, PASJ, 59, 117
- Lagache et al. (2005) Lagache, G., Puget, J.-L., & Dole, H. 2005, ARA&A, 43, 727
- Laine et al. (2014) Laine, J., Laurikainen, E., Salo, H., et al. 2014, MNRAS, 441, 1992
- Laurikainen & Salo (2002) Laurikainen, E. & Salo, H. 2002, MNRAS, 337, 1118
- Laurikainen et al. (2014) Laurikainen, E., Salo, H., Athanassoula, E., Bosma, A., & Herrera-Endoqui, M. 2014, MNRAS, 444, L80
- Laurikainen et al. (2007) Laurikainen, E., Salo, H., Buta, R., & Knapen, J. H. 2007, MNRAS, 381, 401
- Lee et al. (2021) Lee, J. C., Whitmore, B. C., Thilker, D. A., et al. 2021, arXiv e-prints, arXiv:2101.02855
- Leger & Puget (1984) Leger, A. & Puget, J. L. 1984, A&A, 137, L5
- Leon et al. (2000) Leon, S., Combes, F., & Friedli, D. 2000, in Astronomical Society of the Pacific Conference Series, Vol. 197, Dynamics of Galaxies: from the Early Universe to the Present, ed. F. Combes, G. A. Mamon, & V. Charmandaris, 61
- Leon et al. (2008) Leon, S., Jeyakumar, S., Pérez-Ramírez, D., et al. 2008, A&A, 491, 703
- Leroy et al. (2011) Leroy, A. K., Bolatto, A., Gordon, K., et al. 2011, ApJ, 737, 12
- Leroy et al. (2019) Leroy, A. K., Sandstrom, K. M., Lang, D., et al. 2019, ApJS, 244, 24
- Leroy et al. (2009) Leroy, A. K., Walter, F., Bigiel, F., et al. 2009, AJ, 137, 4670
- Leroy et al. (2008) Leroy, A. K., Walter, F., Brinks, E., et al. 2008, AJ, 136, 2782
- Leroy et al. (2013) Leroy, A. K., Walter, F., Sandstrom, K., et al. 2013, AJ, 146, 19
- Lin et al. (2020) Lin, L., Li, C., Du, C., et al. 2020, MNRAS, 499, 1406
- Lisenfeld et al. (2019) Lisenfeld, U., Xu, C. K., Gao, Y., et al. 2019, A&A, 627, A107
- Maeda et al. (2018) Maeda, F., Ohta, K., Fujimoto, Y., Habe, A., & Baba, J. 2018, PASJ, 70, 37
- Maeda et al. (2020) Maeda, F., Ohta, K., Fujimoto, Y., Habe, A., & Ushio, K. 2020, MNRAS, 495, 3840
- Marquez & Moles (1993) Marquez, I. & Moles, M. 1993, AJ, 105, 2090
- Martig et al. (2009) Martig, M., Bournaud, F., Teyssier, R., & Dekel, A. 2009, ApJ, 707, 250
- Martin (1995) Martin, P. 1995, AJ, 109, 2428
- Martin & Friedli (1997) Martin, P. & Friedli, D. 1997, A&A, 326, 449
- Martin & Friedli (1999) Martin, P. & Friedli, D. 1999, A&A, 346, 769
- Martinez-Valpuesta et al. (2007) Martinez-Valpuesta, I., Knapen, J. H., & Buta, R. 2007, AJ, 134, 1863
- Meidt et al. (2013) Meidt, S. E., Schinnerer, E., García-Burillo, S., et al. 2013, ApJ, 779, 45
- Meidt et al. (2012) Meidt, S. E., Schinnerer, E., Knapen, J. H., et al. 2012, ApJ, 744, 17
- Méndez-Abreu et al. (2012) Méndez-Abreu, J., Sánchez-Janssen, R., Aguerri, J. A. L., Corsini, E. M., & Zarattini, S. 2012, ApJ, 761, L6
- Michel-Dansac & Wozniak (2006) Michel-Dansac, L. & Wozniak, H. 2006, A&A, 452, 97
- Momose et al. (2010) Momose, R., Okumura, S. K., Koda, J., & Sawada, T. 2010, ApJ, 721, 383
- Morokuma-Matsui et al. (2015) Morokuma-Matsui, K., Sorai, K., Watanabe, Y., & Kuno, N. 2015, PASJ, 67, 2
- Morrissey et al. (2007) Morrissey, P., Conrow, T., Barlow, T. A., et al. 2007, ApJS, 173, 682
- Muñoz-Mateos et al. (2015) Muñoz-Mateos, J. C., Sheth, K., Regan, M., et al. 2015, ApJS, 219, 3
- Muraoka et al. (2016) Muraoka, K., Sorai, K., Kuno, N., et al. 2016, PASJ, 68, 89
- Narayanan et al. (2011) Narayanan, D., Krumholz, M., Ostriker, E. C., & Hernquist, L. 2011, MNRAS, 418, 664
- Neumann et al. (2019) Neumann, J., Gadotti, D. A., Wisotzki, L., et al. 2019, A&A, 627, A26
- Newnham et al. (2020) Newnham, L., Hess, K. M., Masters, K. L., et al. 2020, MNRAS, 492, 4697
- Nimori et al. (2013) Nimori, M., Habe, A., Sorai, K., et al. 2013, MNRAS, 429, 2175
- Oh et al. (2012) Oh, S., Oh, K., & Yi, S. K. 2012, ApJS, 198, 4
- Papadopoulos & Seaquist (1999) Papadopoulos, P. P. & Seaquist, E. R. 1999, ApJ, 516, 114
- Paturel et al. (2003) Paturel, G., Petit, C., Prugniel, P., et al. 2003, A&A, 412, 45
- Pence & Blackman (1984) Pence, W. D. & Blackman, C. P. 1984, MNRAS, 207, 9
- Pérez et al. (2000) Pérez, E., Márquez, I., Marrero, I., et al. 2000, A&A, 353, 893
- Pérez et al. (2012) Pérez, I., Aguerri, J. A. L., & Méndez-Abreu, J. 2012, A&A, 540, A103
- Pérez & Freeman (2006) Pérez, I. & Freeman, K. 2006, A&A, 454, 165
- Pérez et al. (2004) Pérez, I., Fux, R., & Freeman, K. 2004, A&A, 424, 799
- Pérez et al. (2009) Pérez, I., Sánchez-Blázquez, P., & Zurita, A. 2009, A&A, 495, 775
- Pessa et al. (2021) Pessa, I., Schinnerer, E., Belfiore, F., et al. 2021, arXiv e-prints, arXiv:2104.09536
- Popping et al. (2010) Popping, G., Pérez, I., & Zurita, A. 2010, A&A, 521, A8
- Prendergast (1962) Prendergast, K. H. 1962, in The Distribution and Motion of Interstellar Matter in Galaxies, ed. L. Woltjer, 217
- Puget & Leger (1989) Puget, J. L. & Leger, A. 1989, ARA&A, 27, 161
- Rautiainen & Salo (2000) Rautiainen, P. & Salo, H. 2000, A&A, 362, 465
- Regan & Elmegreen (1997) Regan, M. W. & Elmegreen, D. M. 1997, AJ, 114, 965
- Regan et al. (1999) Regan, M. W., Sheth, K., & Vogel, S. N. 1999, ApJ, 526, 97
- Renaud et al. (2015) Renaud, F., Bournaud, F., Emsellem, E., et al. 2015, MNRAS, 454, 3299
- Reynaud & Downes (1998) Reynaud, D. & Downes, D. 1998, A&A, 337, 671
- Rosado-Belza et al. (2019) Rosado-Belza, D., Lisenfeld, U., Hibbard, J., et al. 2019, A&A, 623, A154
- Rosolowsky et al. (2021) Rosolowsky, E., Hughes, A., Leroy, A. K., et al. 2021, MNRAS, 502, 1218
- Rozas et al. (2000) Rozas, M., Zurita, A., & Beckman, J. E. 2000, A&A, 354, 823
- Saintonge et al. (2011) Saintonge, A., Kauffmann, G., Wang, J., et al. 2011, MNRAS, 415, 61
- Saintonge et al. (2012) Saintonge, A., Tacconi, L. J., Fabello, S., et al. 2012, ApJ, 758, 73
- Salim et al. (2018) Salim, S., Boquien, M., & Lee, J. C. 2018, ApJ, 859, 11
- Salim et al. (2016) Salim, S., Lee, J. C., Janowiecki, S., et al. 2016, ApJS, 227, 2
- Salo et al. (2015) Salo, H., Laurikainen, E., Laine, J., et al. 2015, ApJS, 219, 4
- Salo et al. (1999) Salo, H., Rautiainen, P., Buta, R., et al. 1999, AJ, 117, 792
- Sánchez et al. (2021) Sánchez, S. F., Barrera-Ballesteros, J. K., Colombo, D., et al. 2021, MNRAS, 503, 1615
- Sánchez-Menguiano et al. (2015) Sánchez-Menguiano, L., Pérez, I., Zurita, A., et al. 2015, MNRAS, 450, 2670
- Sandstrom et al. (2010) Sandstrom, K. M., Bolatto, A. D., Draine, B. T., Bot, C., & Stanimirović, S. 2010, ApJ, 715, 701
- Sandstrom et al. (2013) Sandstrom, K. M., Leroy, A. K., Walter, F., et al. 2013, ApJ, 777, 5
- Schmidt (1959) Schmidt, M. 1959, ApJ, 129, 243
- Schruba et al. (2010) Schruba, A., Leroy, A. K., Walter, F., Sandstrom, K., & Rosolowsky, E. 2010, ApJ, 722, 1699
- Schwarz (1984) Schwarz, M. P. 1984, MNRAS, 209, 93
- Seidel et al. (2015) Seidel, M. K., Falcón-Barroso, J., Martínez-Valpuesta, I., et al. 2015, MNRAS, 451, 936
- Seigar (2005) Seigar, M. S. 2005, MNRAS, 361, L20
- Sellwood & Wilkinson (1993) Sellwood, J. A. & Wilkinson, A. 1993, Reports on Progress in Physics, 56, 173
- Sheth et al. (2010) Sheth, K., Regan, M., Hinz, J. L., et al. 2010, PASP, 122, 1397
- Sheth et al. (2000) Sheth, K., Regan, M. W., Vogel, S. N., & Teuben, P. J. 2000, ApJ, 532, 221
- Sheth et al. (2002) Sheth, K., Vogel, S. N., Regan, M. W., et al. 2002, AJ, 124, 2581
- Sil’chenko (2002) Sil’chenko, O. K. 2002, Astronomy Letters, 28, 207
- Solomon et al. (1997) Solomon, P. M., Downes, D., Radford, S. J. E., & Barrett, J. W. 1997, ApJ, 478, 144
- Solomon et al. (1987) Solomon, P. M., Rivolo, A. R., Barrett, J., & Yahil, A. 1987, ApJ, 319, 730
- Sorai et al. (2012) Sorai, K., Kuno, N., Nishiyama, K., et al. 2012, PASJ, 64, 51
- Spinoso et al. (2017) Spinoso, D., Bonoli, S., Dotti, M., et al. 2017, MNRAS, 465, 3729
- Stark (1984) Stark, A. A. 1984, ApJ, 281, 624
- Vera et al. (2016) Vera, M., Alonso, S., & Coldwell, G. 2016, A&A, 595, A63
- Verdes-Montenegro et al. (2005) Verdes-Montenegro, L., Sulentic, J., Lisenfeld, U., et al. 2005, A&A, 436, 443
- Verley et al. (2007a) Verley, S., Combes, F., Verdes-Montenegro, L., Bergond, G., & Leon, S. 2007a, A&A, 474, 43
- Verley et al. (2009) Verley, S., Corbelli, E., Giovanardi, C., & Hunt, L. K. 2009, A&A, 493, 453
- Verley et al. (2010) Verley, S., Corbelli, E., Giovanardi, C., & Hunt, L. K. 2010, A&A, 510, A64
- Verley et al. (2007b) Verley, S., Leon, S., Verdes-Montenegro, L., et al. 2007b, A&A, 472, 121
- Véron-Cetty & Véron (2010) Véron-Cetty, M.-P. & Véron, P. 2010, A&A, 518, A10
- Vicari et al. (2002) Vicari, A., Battinelli, P., Capuzzo-Dolcetta, R., Wyder, T. K., & Arrabito, G. 2002, A&A, 384, 24
- Vollmer et al. (1999) Vollmer, B., Cayatte, V., Boselli, A., Balkowski, C., & Duschl, W. J. 1999, A&A, 349, 411
- Watanabe et al. (2011) Watanabe, Y., Sorai, K., Kuno, N., & Habe, A. 2011, MNRAS, 411, 1409
- Wozniak et al. (1995) Wozniak, H., Friedli, D., Martinet, L., Martin, P., & Bratschi, P. 1995, A&AS, 111, 115
- Wozniak & Pierce (1991) Wozniak, H. & Pierce, M. J. 1991, A&AS, 88, 325
- Wright et al. (2010) Wright, E. L., Eisenhardt, P. R. M., Mainzer, A. K., et al. 2010, AJ, 140, 1868
- Yajima et al. (2019) Yajima, Y., Sorai, K., Kuno, N., et al. 2019, PASJ, 71, S13
- Yao et al. (2020) Yao, H. F. M., Jarrett, T. H., Cluver, M. E., et al. 2020, ApJ, 903, 91
- Young et al. (1996) Young, J. S., Allen, L., Kenney, J. D. P., Lesser, A., & Rownd, B. 1996, AJ, 112, 1903
- Zhu et al. (2008) Zhu, Y.-N., Wu, H., Cao, C., & Li, H.-N. 2008, ApJ, 686, 155
- Zibetti & Groves (2011) Zibetti, S. & Groves, B. 2011, MNRAS, 417, 812
- Zou et al. (2014) Zou, Y., Shen, J., & Li, Z.-Y. 2014, ApJ, 791, 11
- Zucker et al. (2016) Zucker, C., Walker, L. M., Johnson, K., et al. 2016, ApJ, 821, 113
- Zurita et al. (2021) Zurita, A., Florido, E., Bresolin, F., Pérez, I., & Pérez-Montero, E. 2021, MNRAS, 500, 2380
- Zurita & Pérez (2008) Zurita, A. & Pérez, I. 2008, A&A, 485, 5
- Zurita et al. (2004) Zurita, A., Relaño, M., Beckman, J. E., & Knapen, J. H. 2004, A&A, 413, 73
Appendix A IRAM-30m pointings and CO spectra
We present the CO(1-0) and CO(2-1) spectra used in this work for the 12 galaxies in our sample (Figs. 10-21). The upper and central panels correspond to the WISE 1 and GALEX NUV images. The bottom panel shows the spectra in every beam along bars, with every subplot located according to the RA and DEC offsets of the pointings. Velocity and intensity ranges are indicated in the lower right corner of the plots. In the images we show in blue the regions where the CO spectra were taken, which were chosen based on the visual estimate of the bar length and position angle. These are in good agreement with the values reported by Díaz-García et al. (2016b).
We also show, with a red ellipse, the bar isophote measured by Herrera-Endoqui et al. (2015) via ellipse fitting (see Sect. 2), which is known to slightly underestimate the true size of bars (Wozniak & Pierce 1991; Laurikainen & Salo 2002; Erwin & Sparke 2003; Michel-Dansac & Wozniak 2006; Díaz-García et al. 2016b). Visual analysis and ellipse fitting yield similar measurements, the only exception being NGC 5383 (Fig 16) where the presence of H ii regions in the spiral arms at the bar end make the ellipse fitting output less reliable. Uncertainties on bar sizes are not a big issue for the current analysis, given fairly large FWHM (21.5″) of the apertures where spectra were taken.
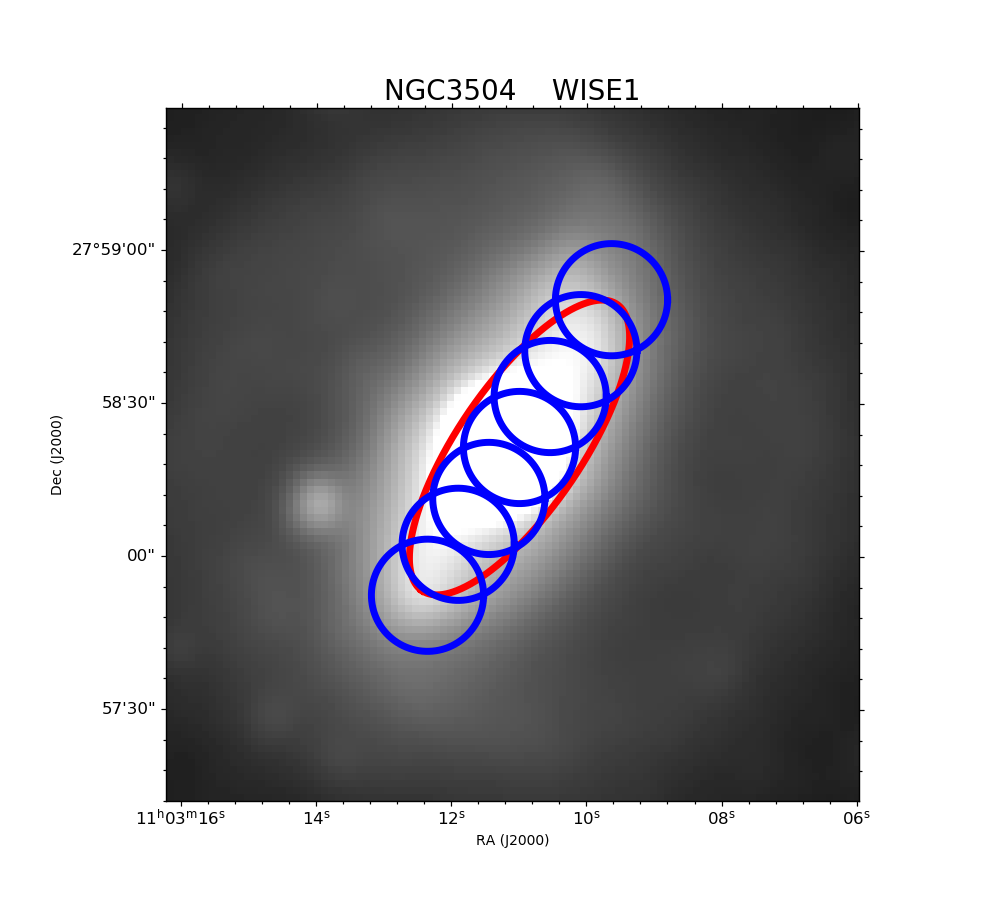
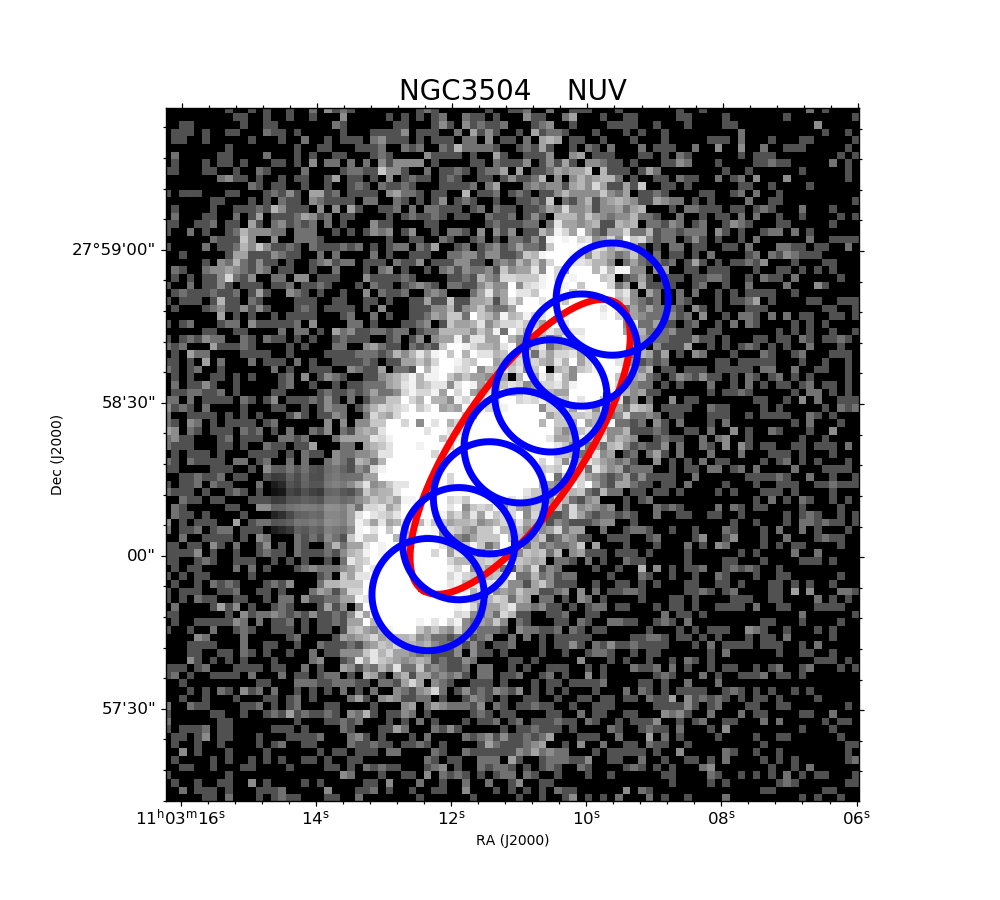
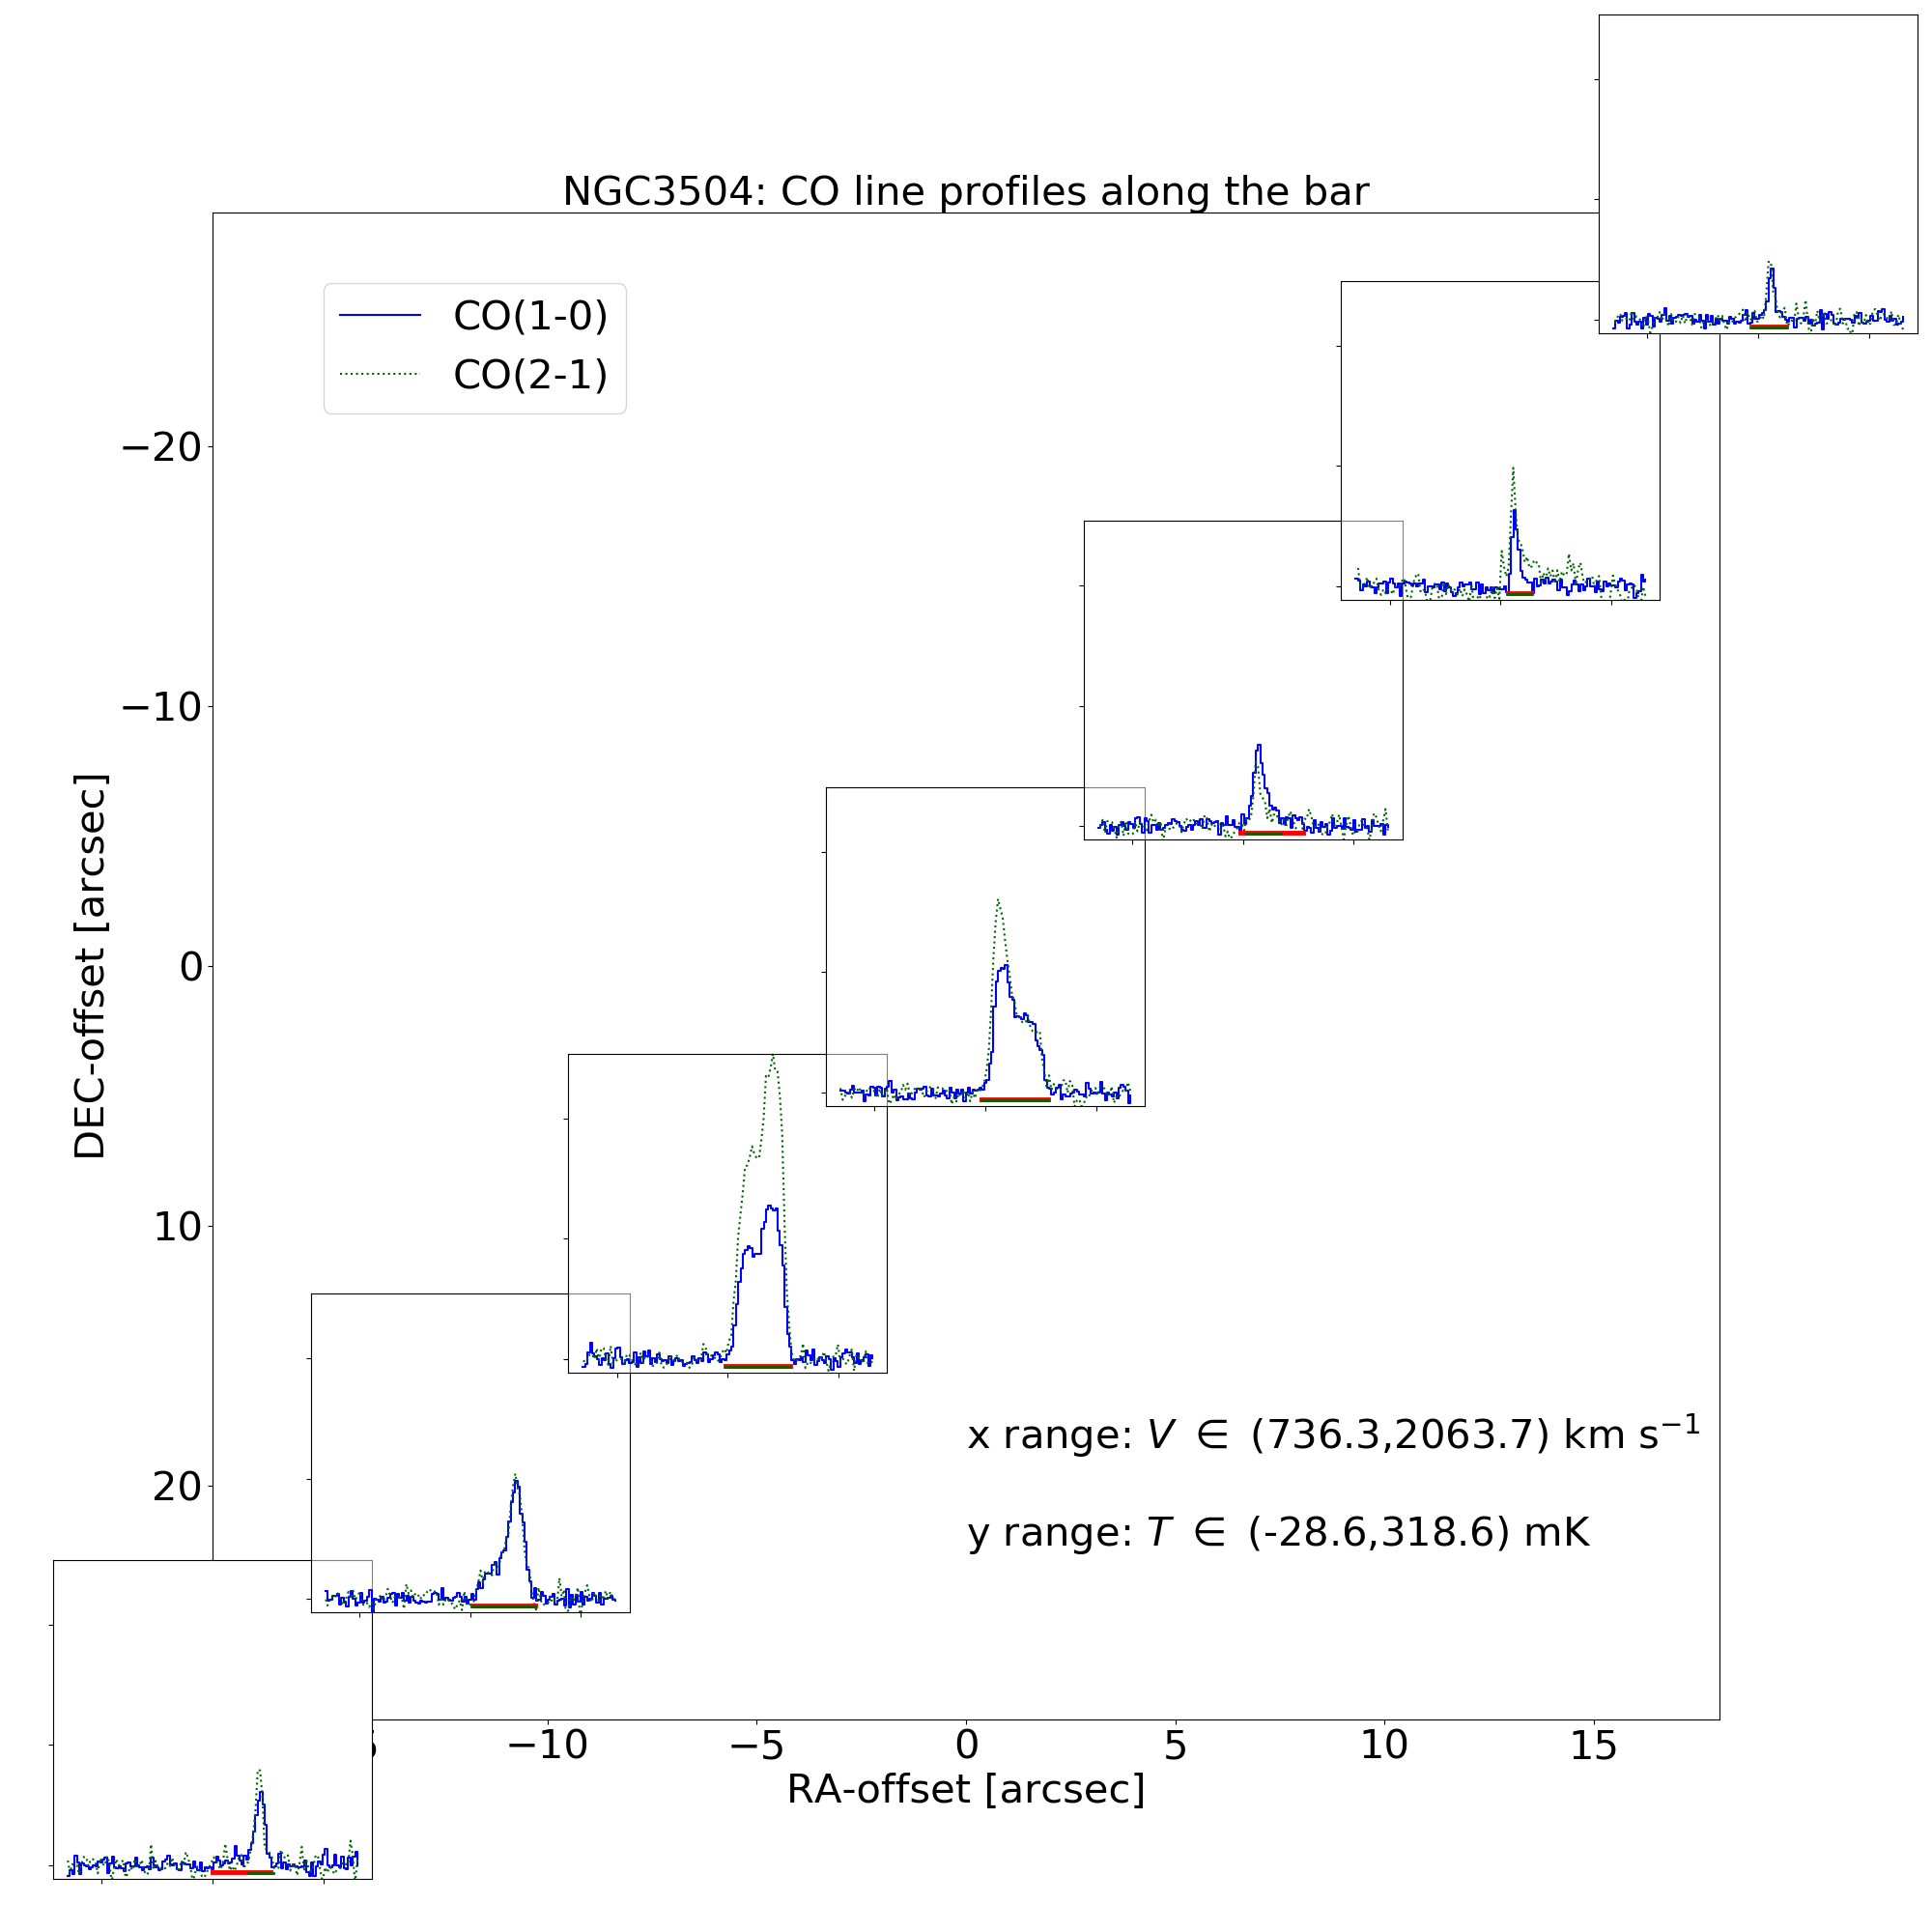
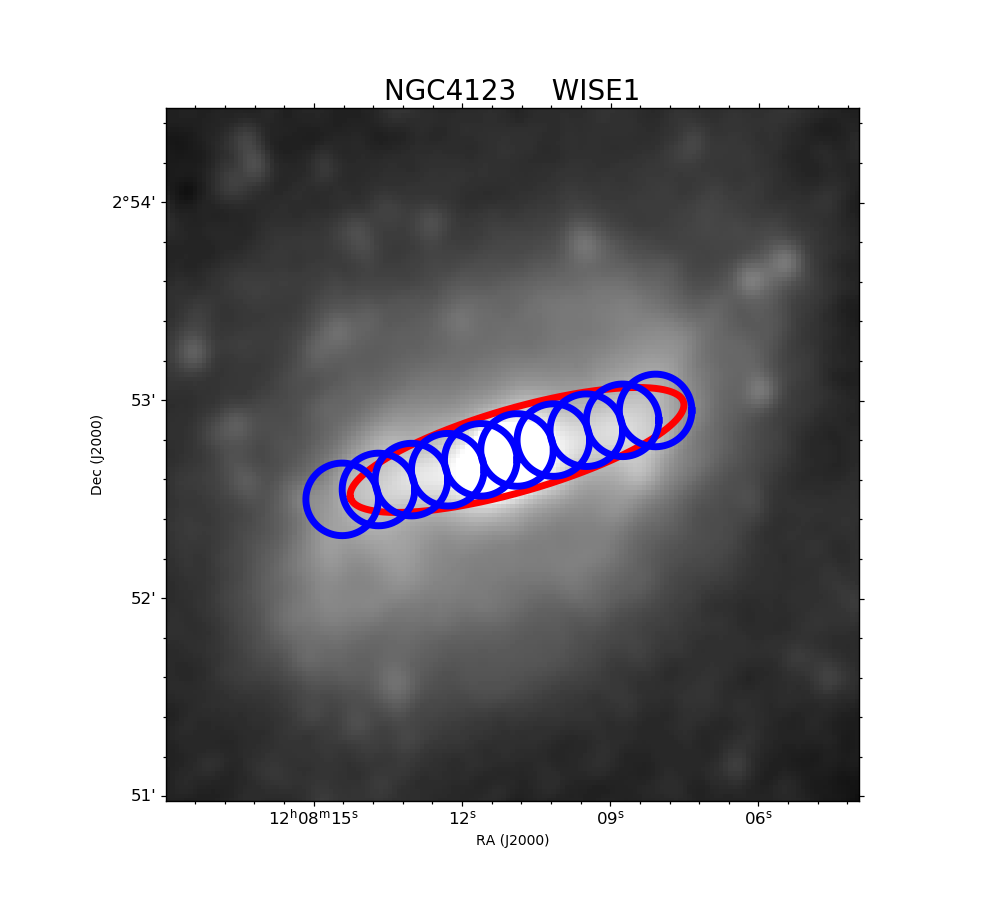
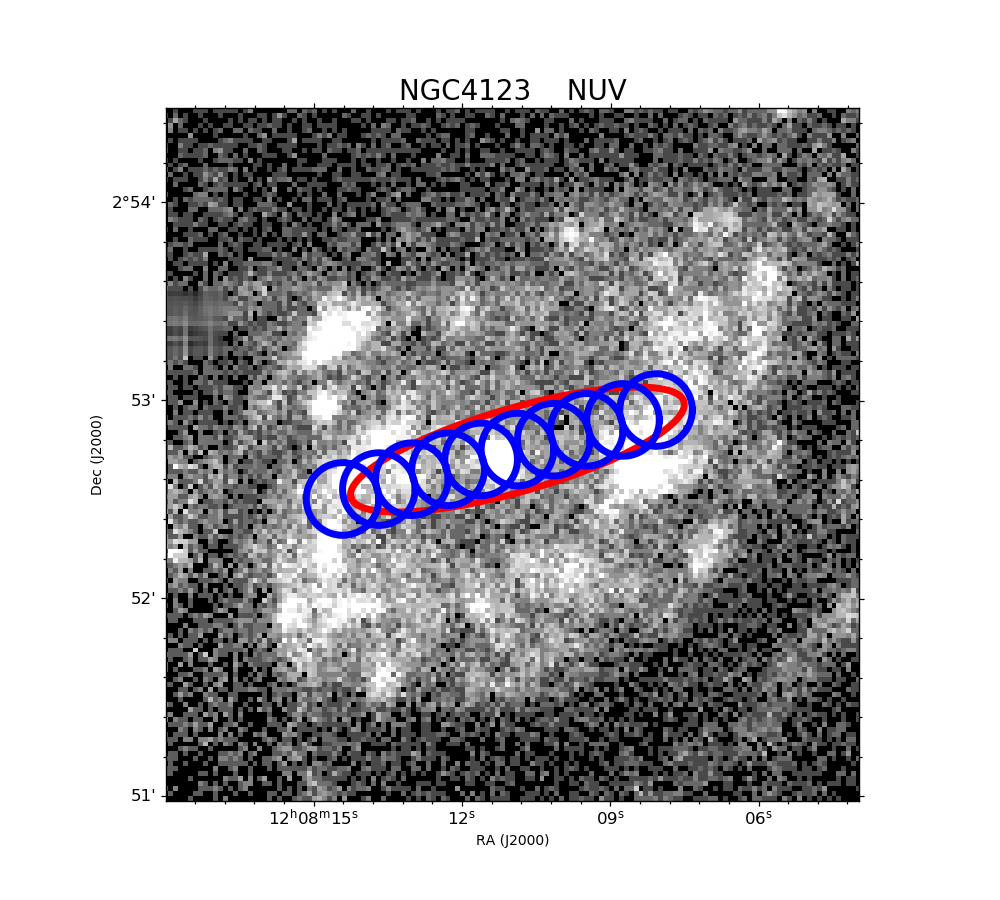

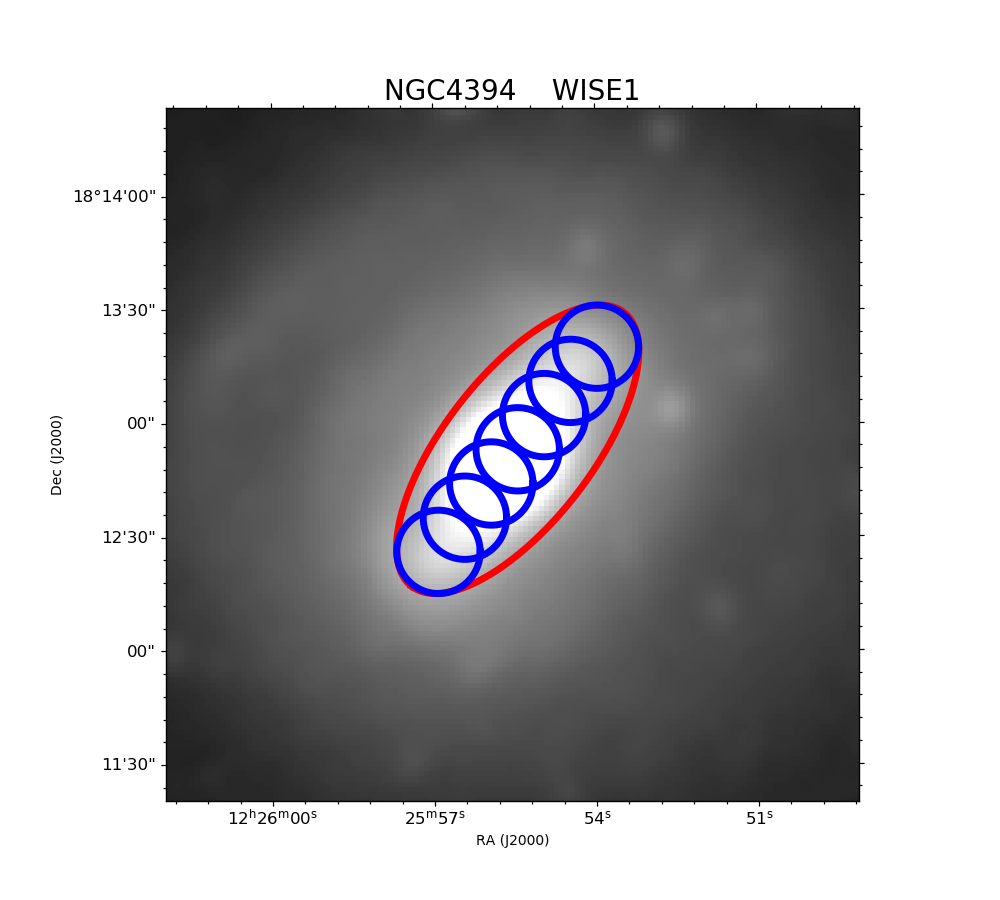
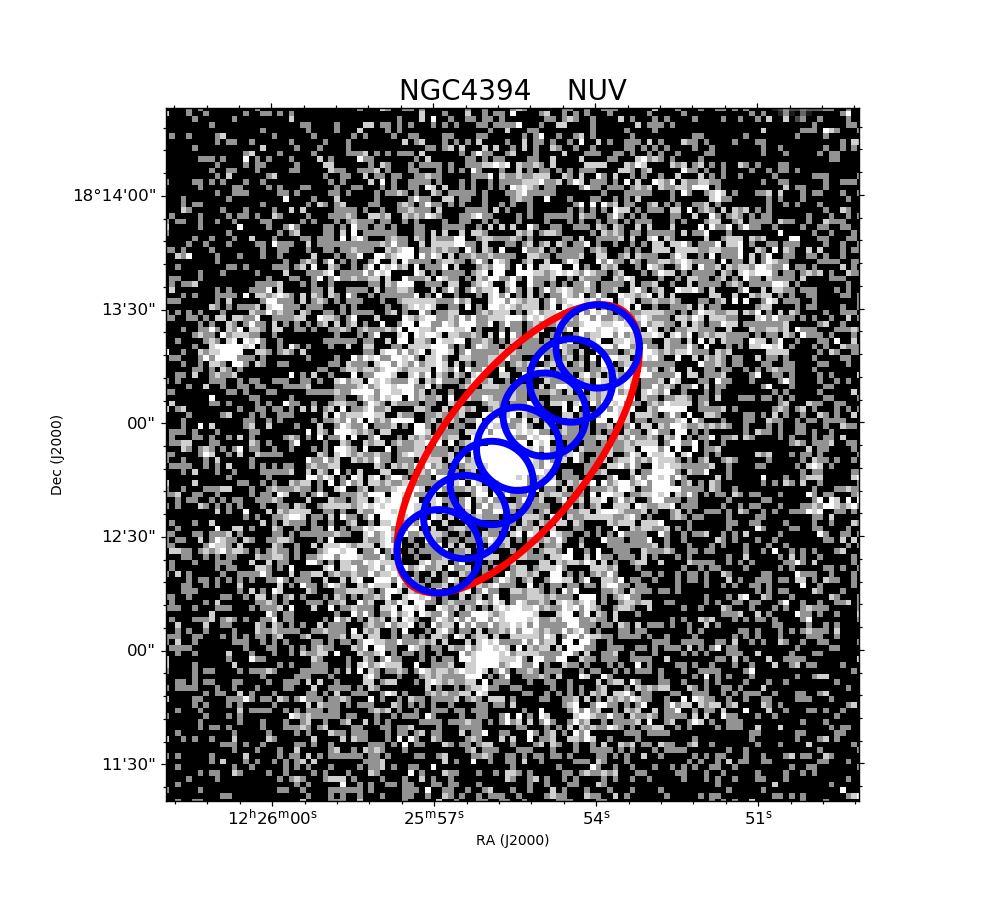
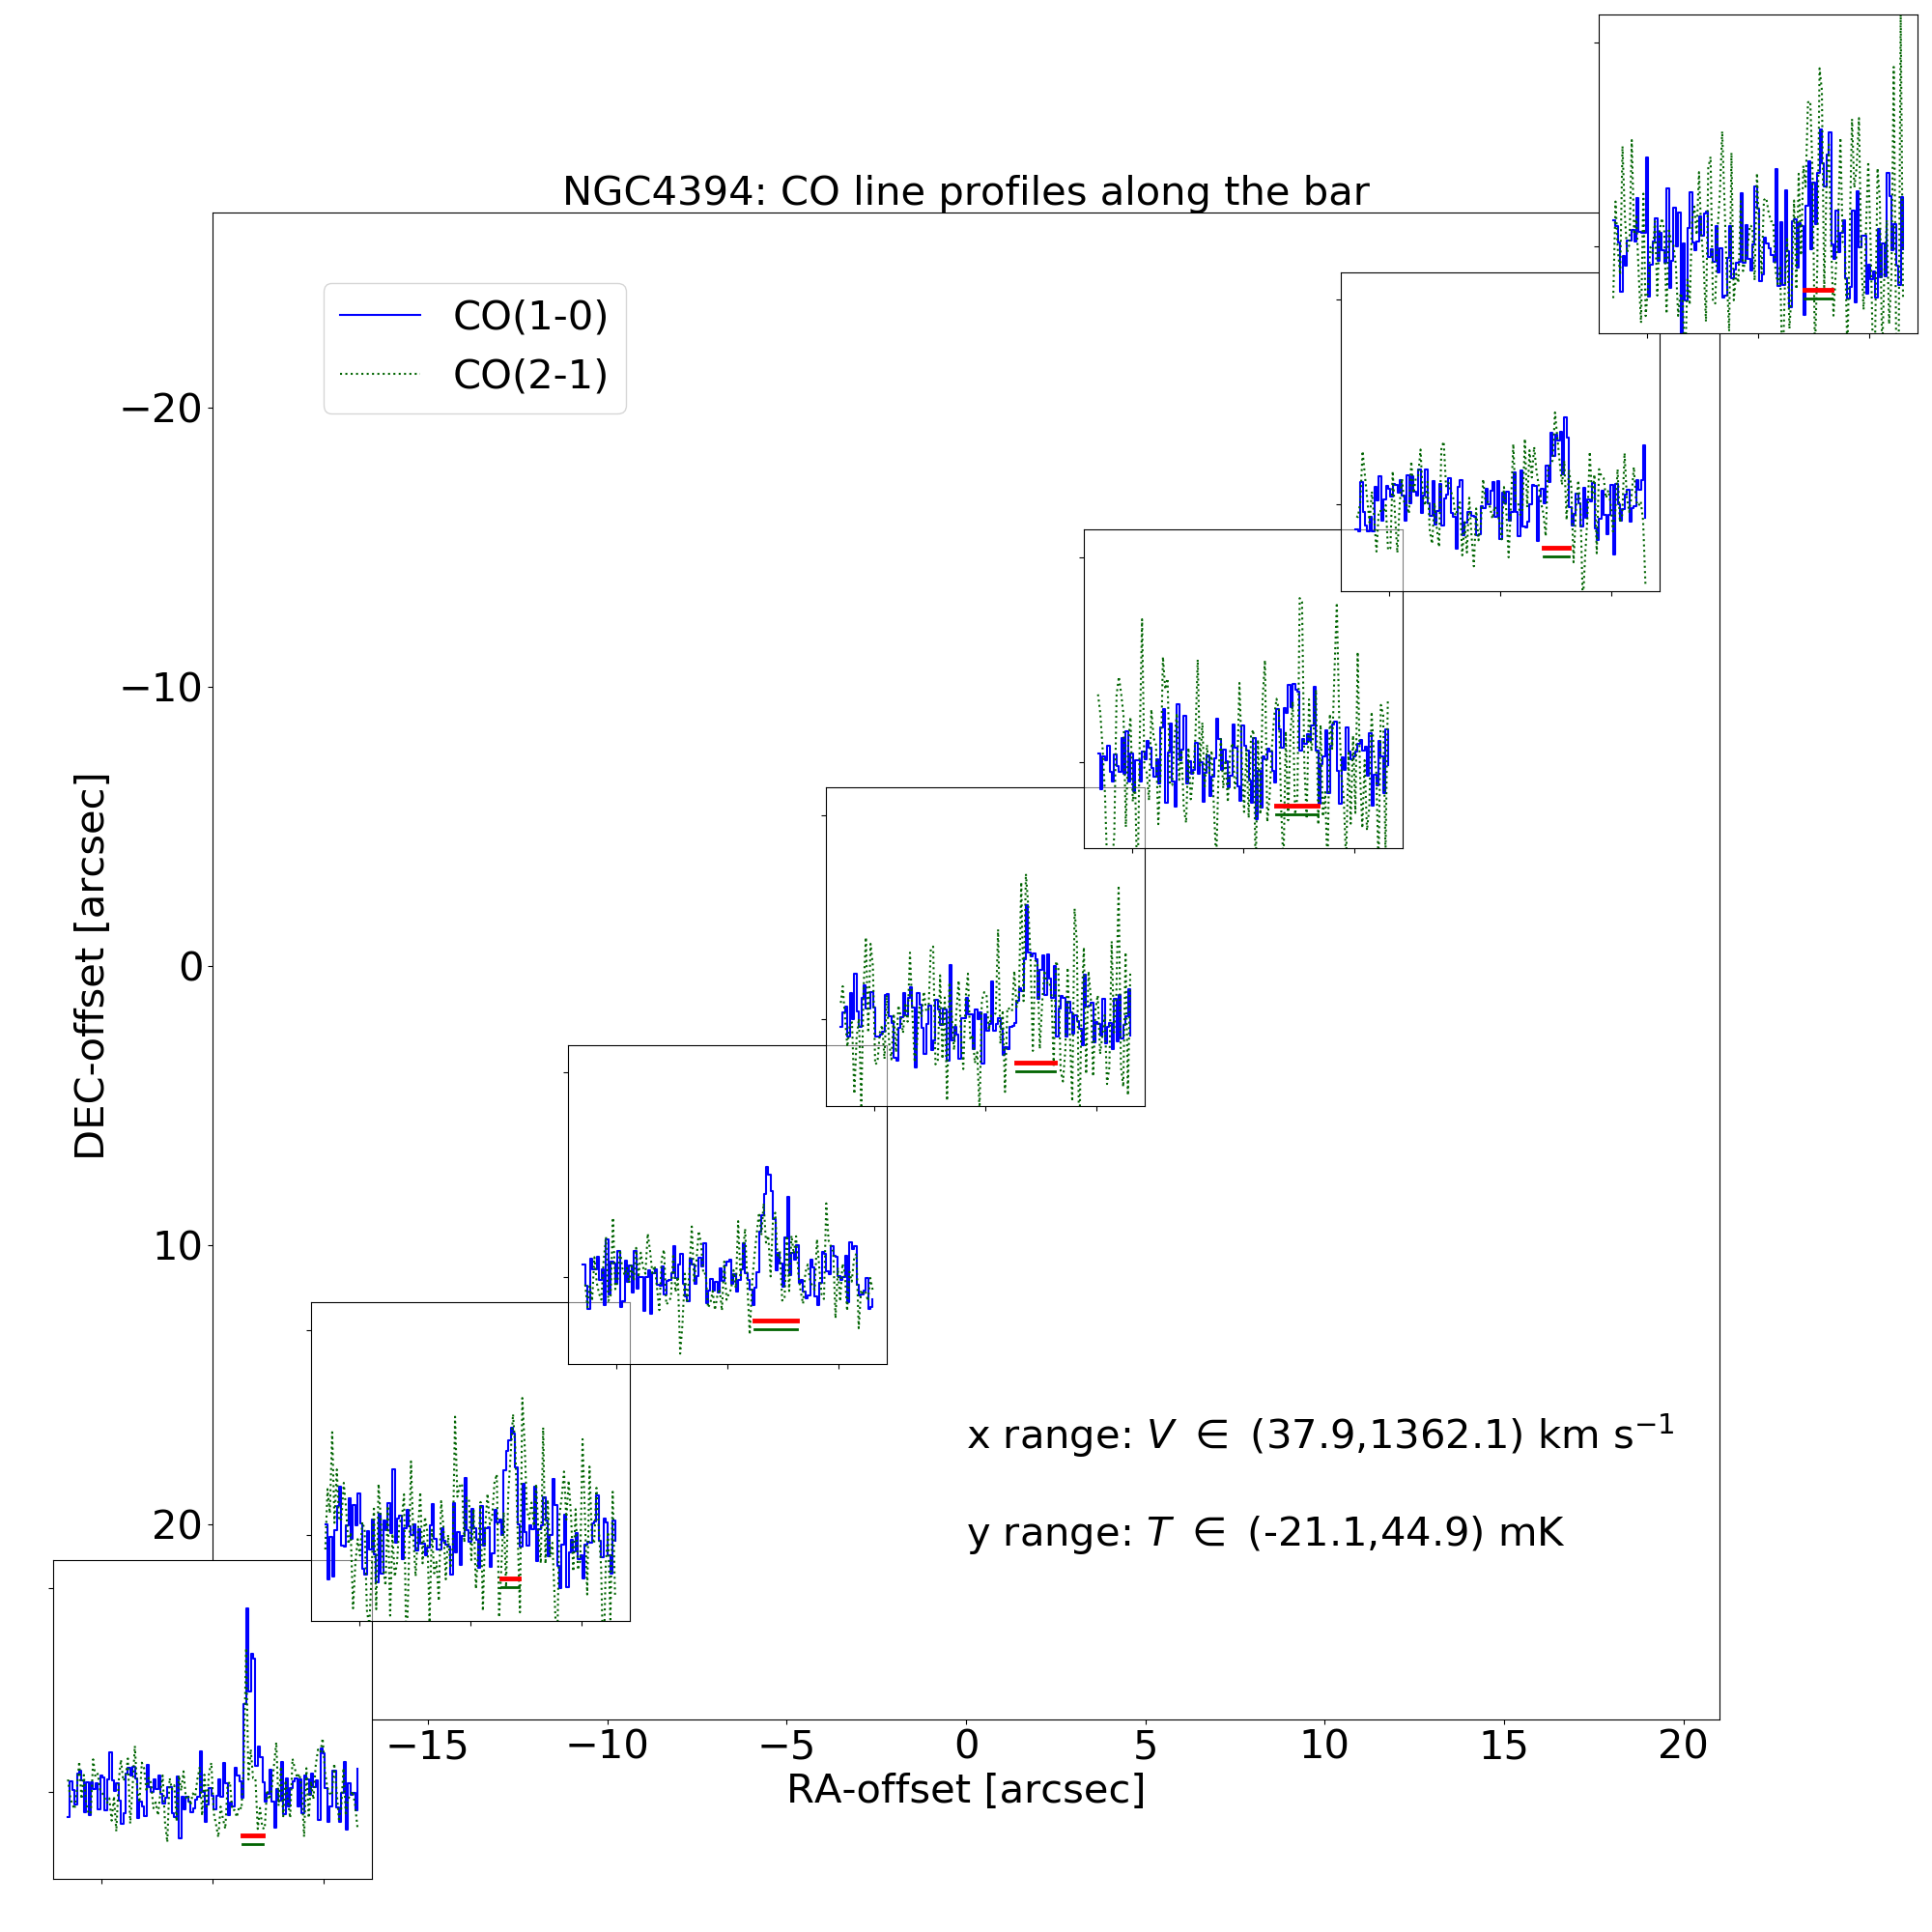
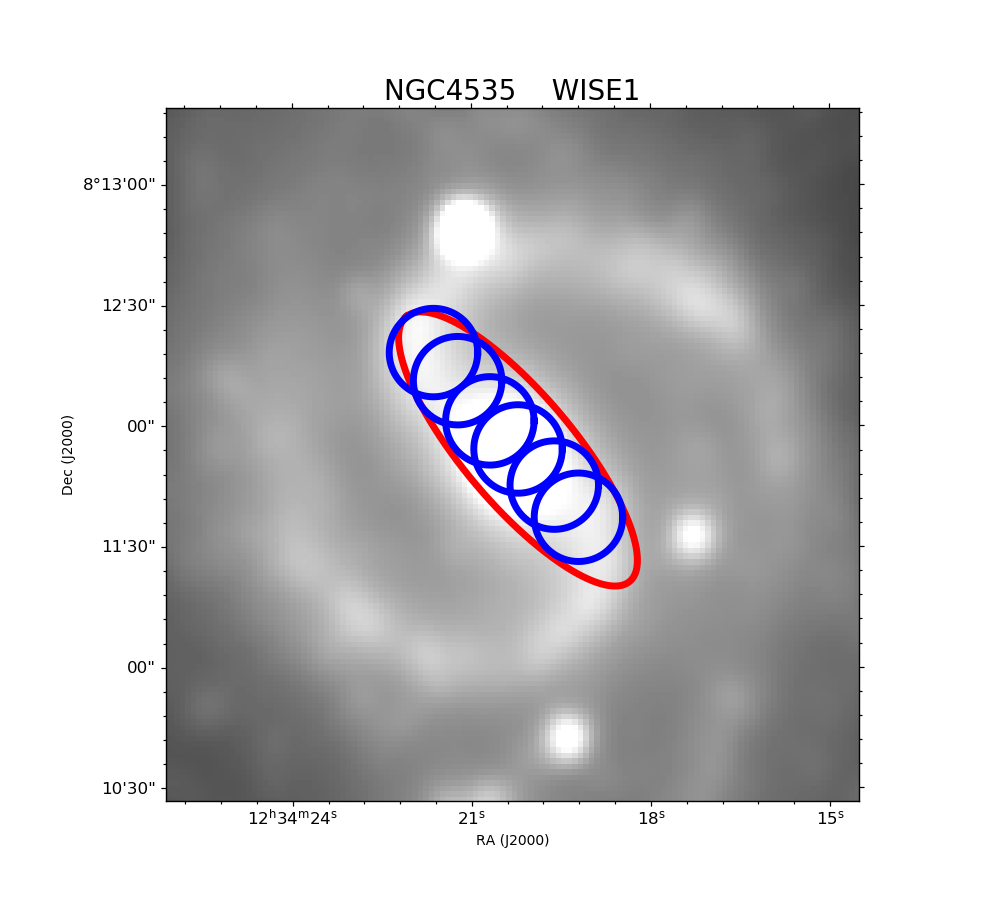
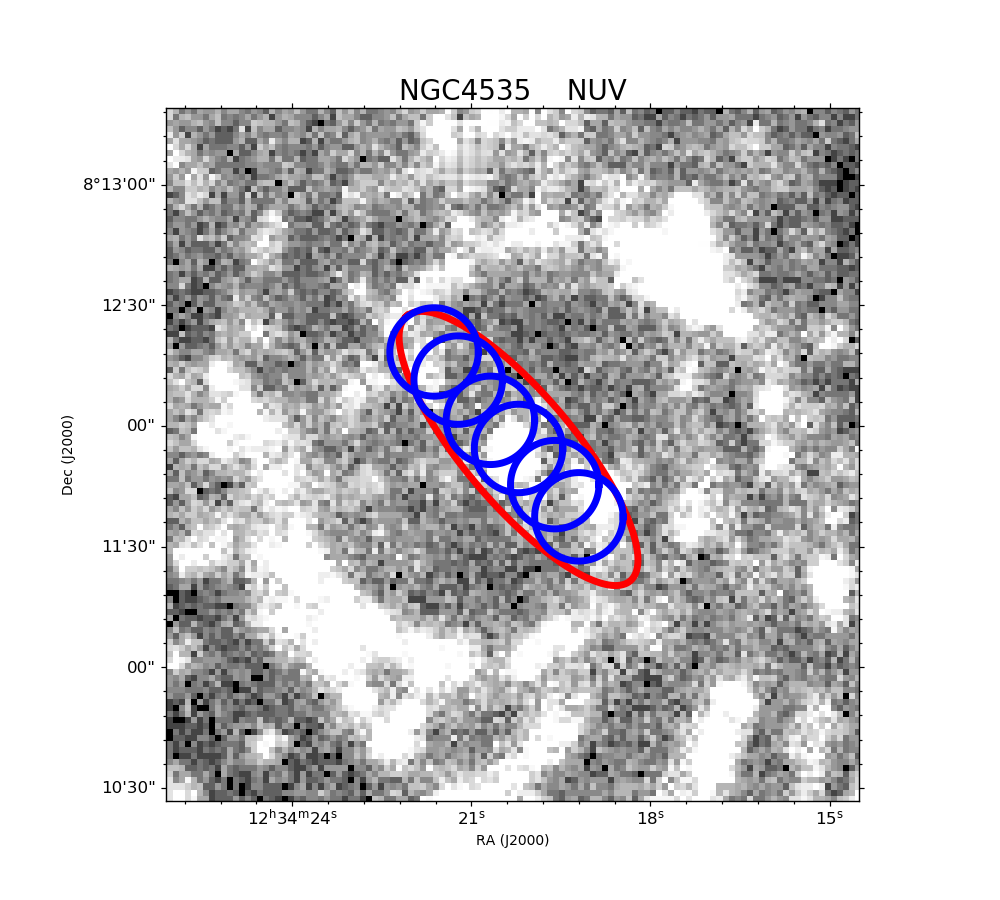
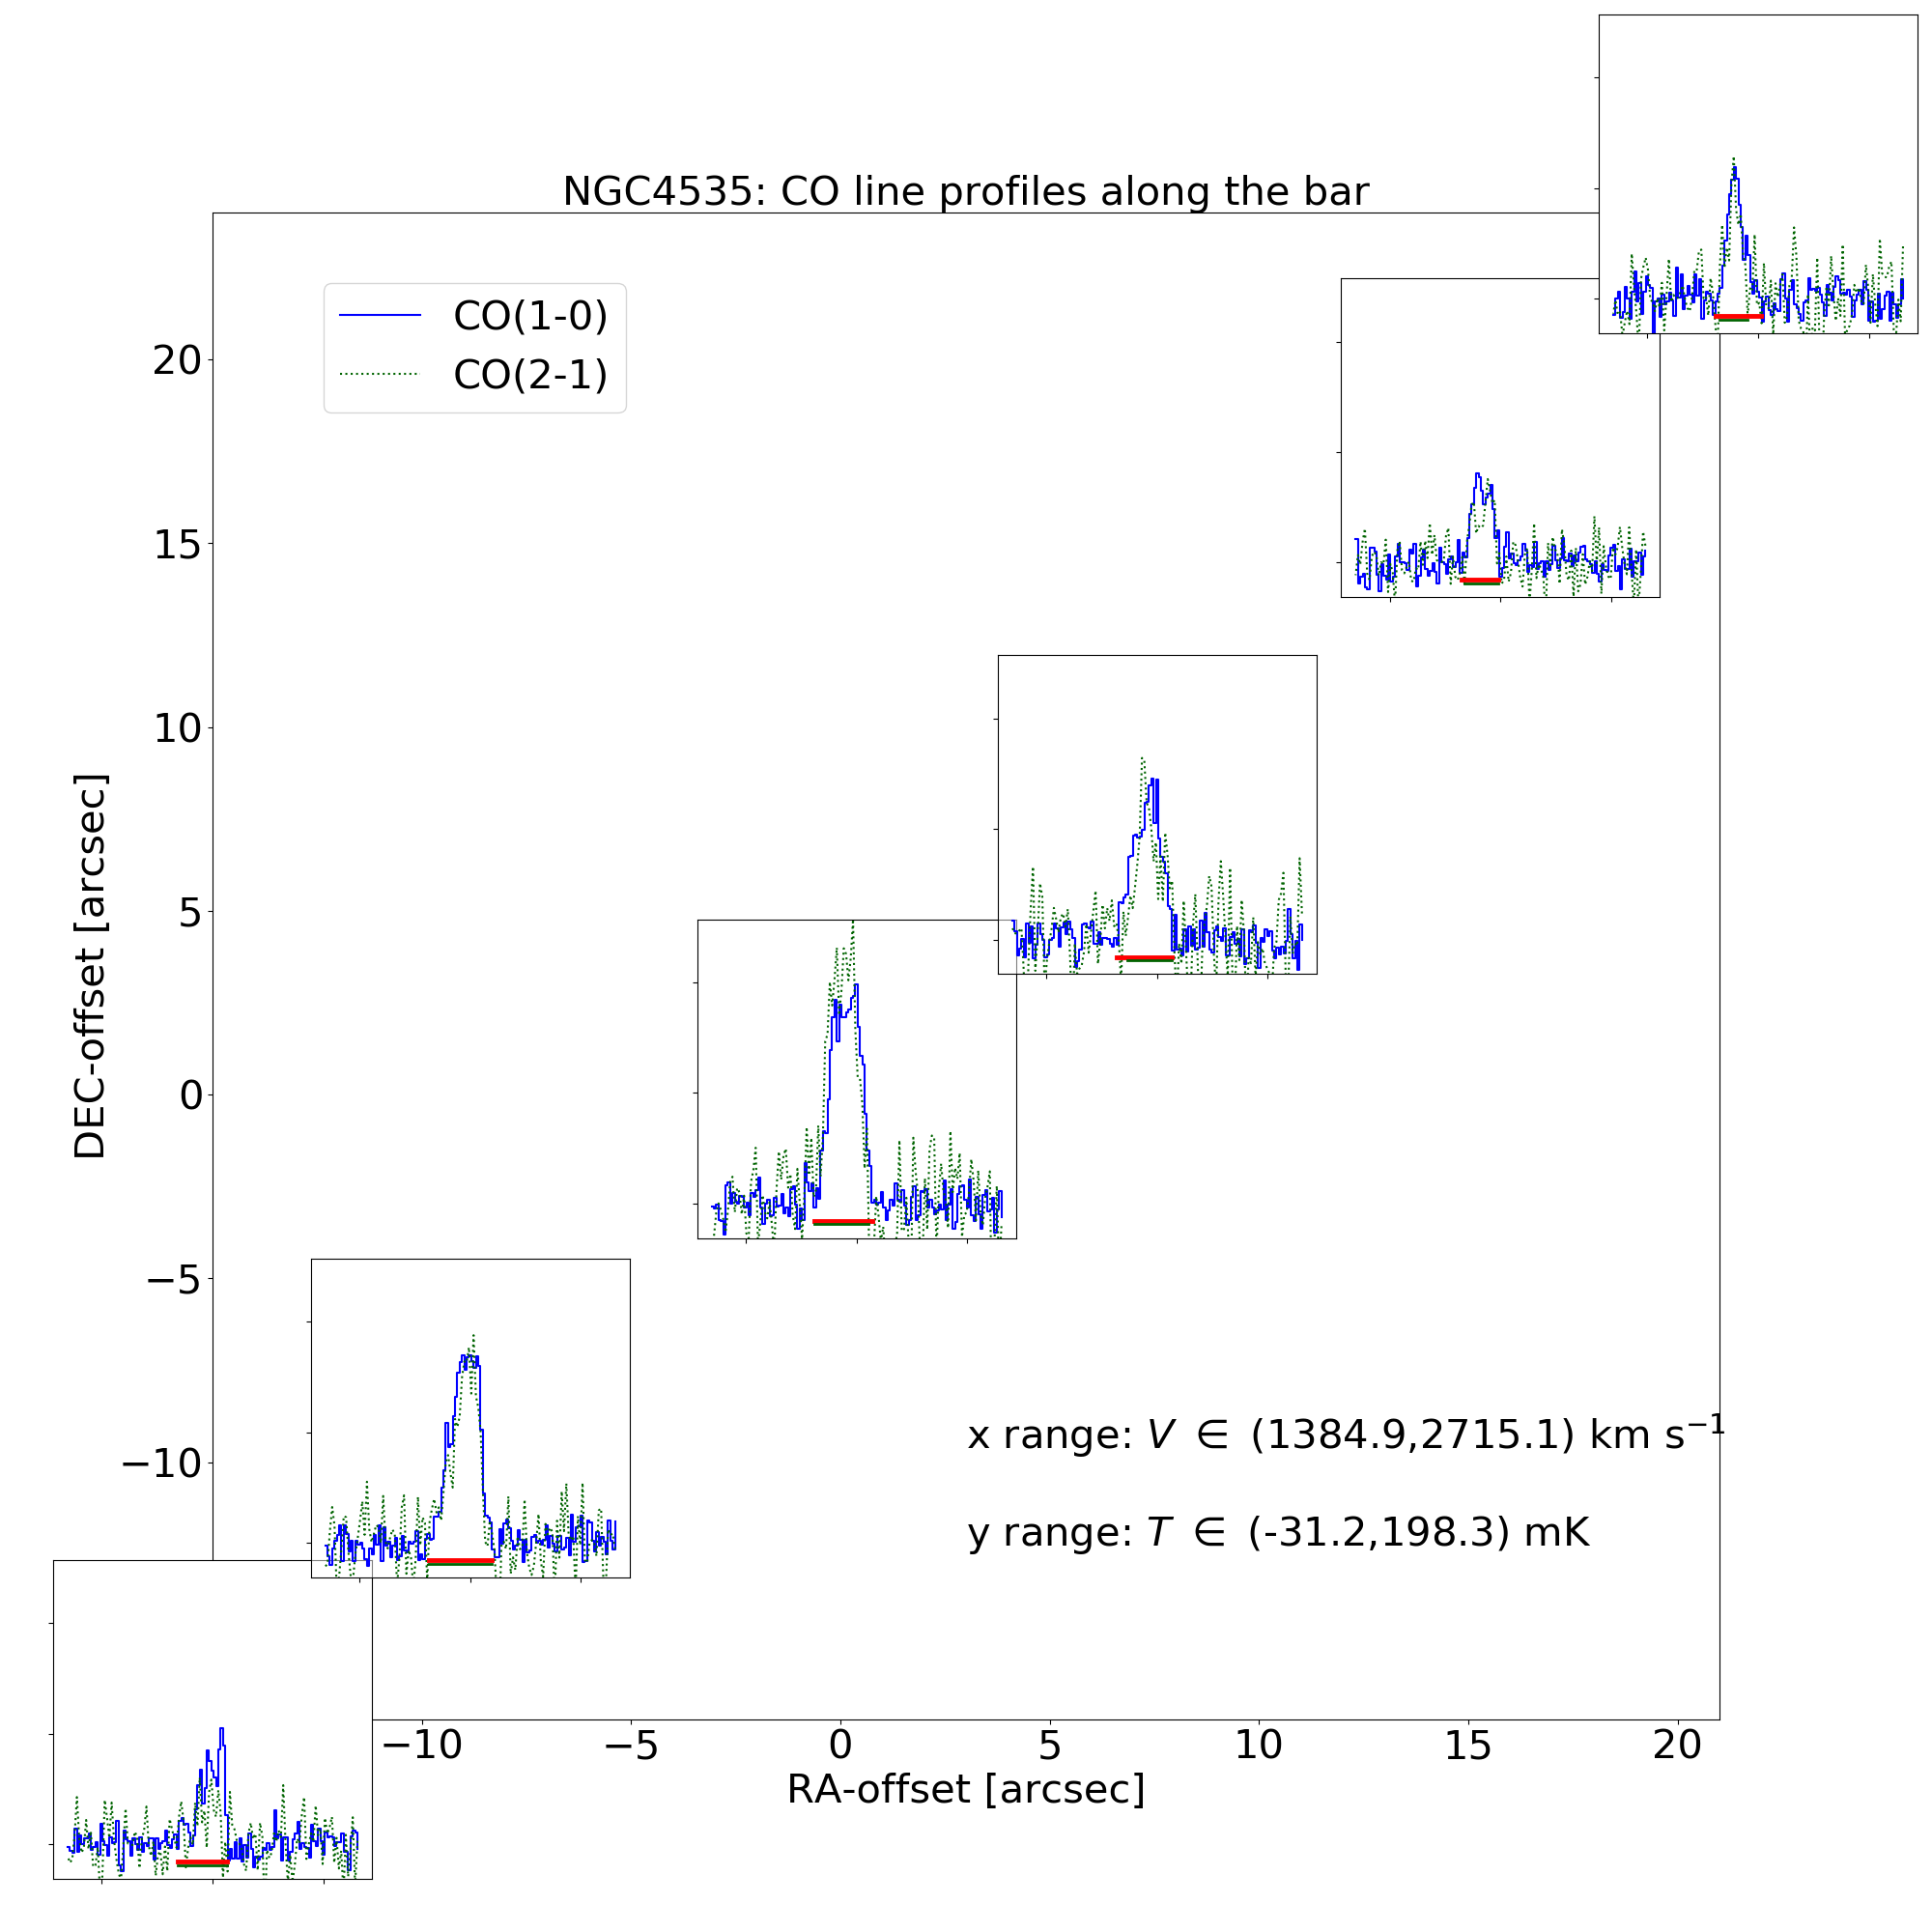
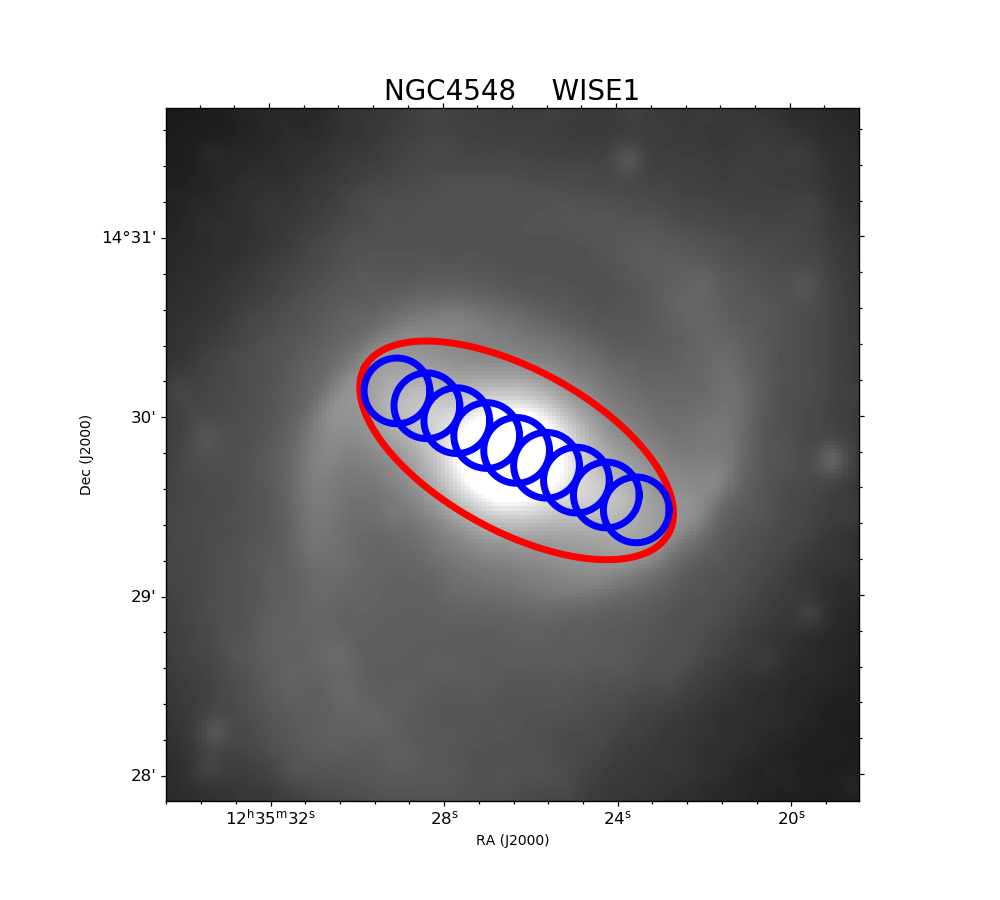
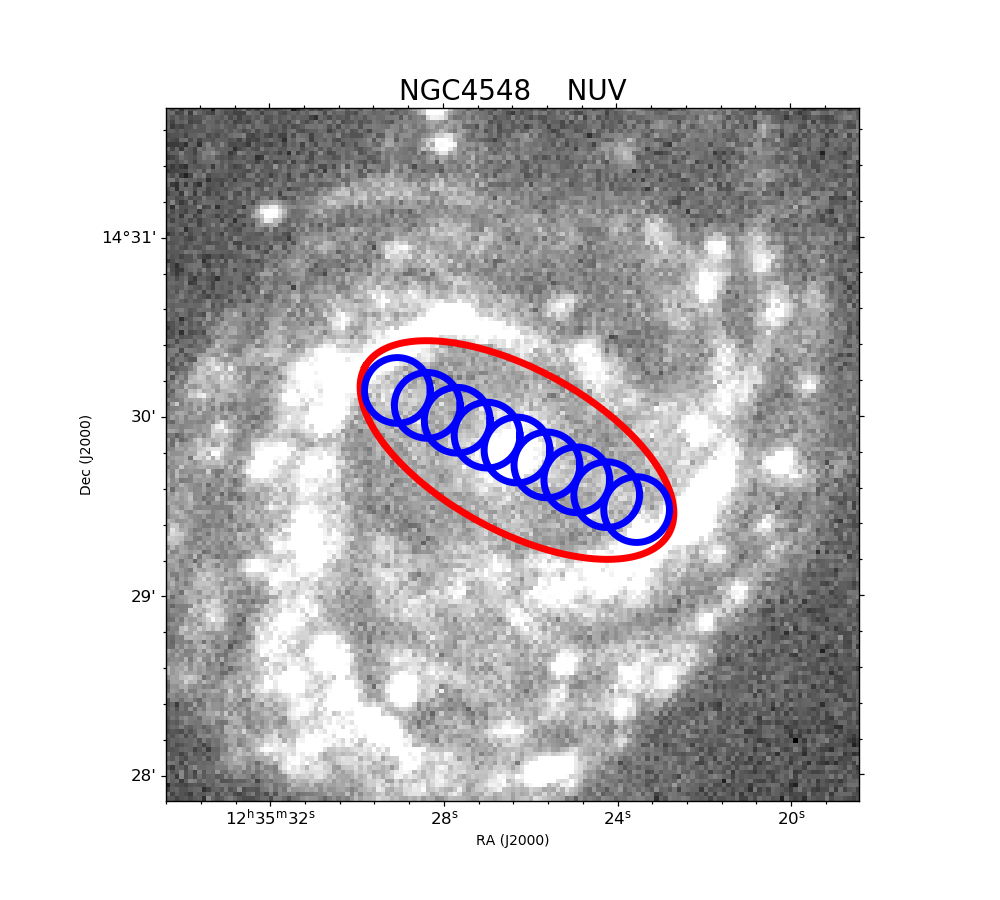
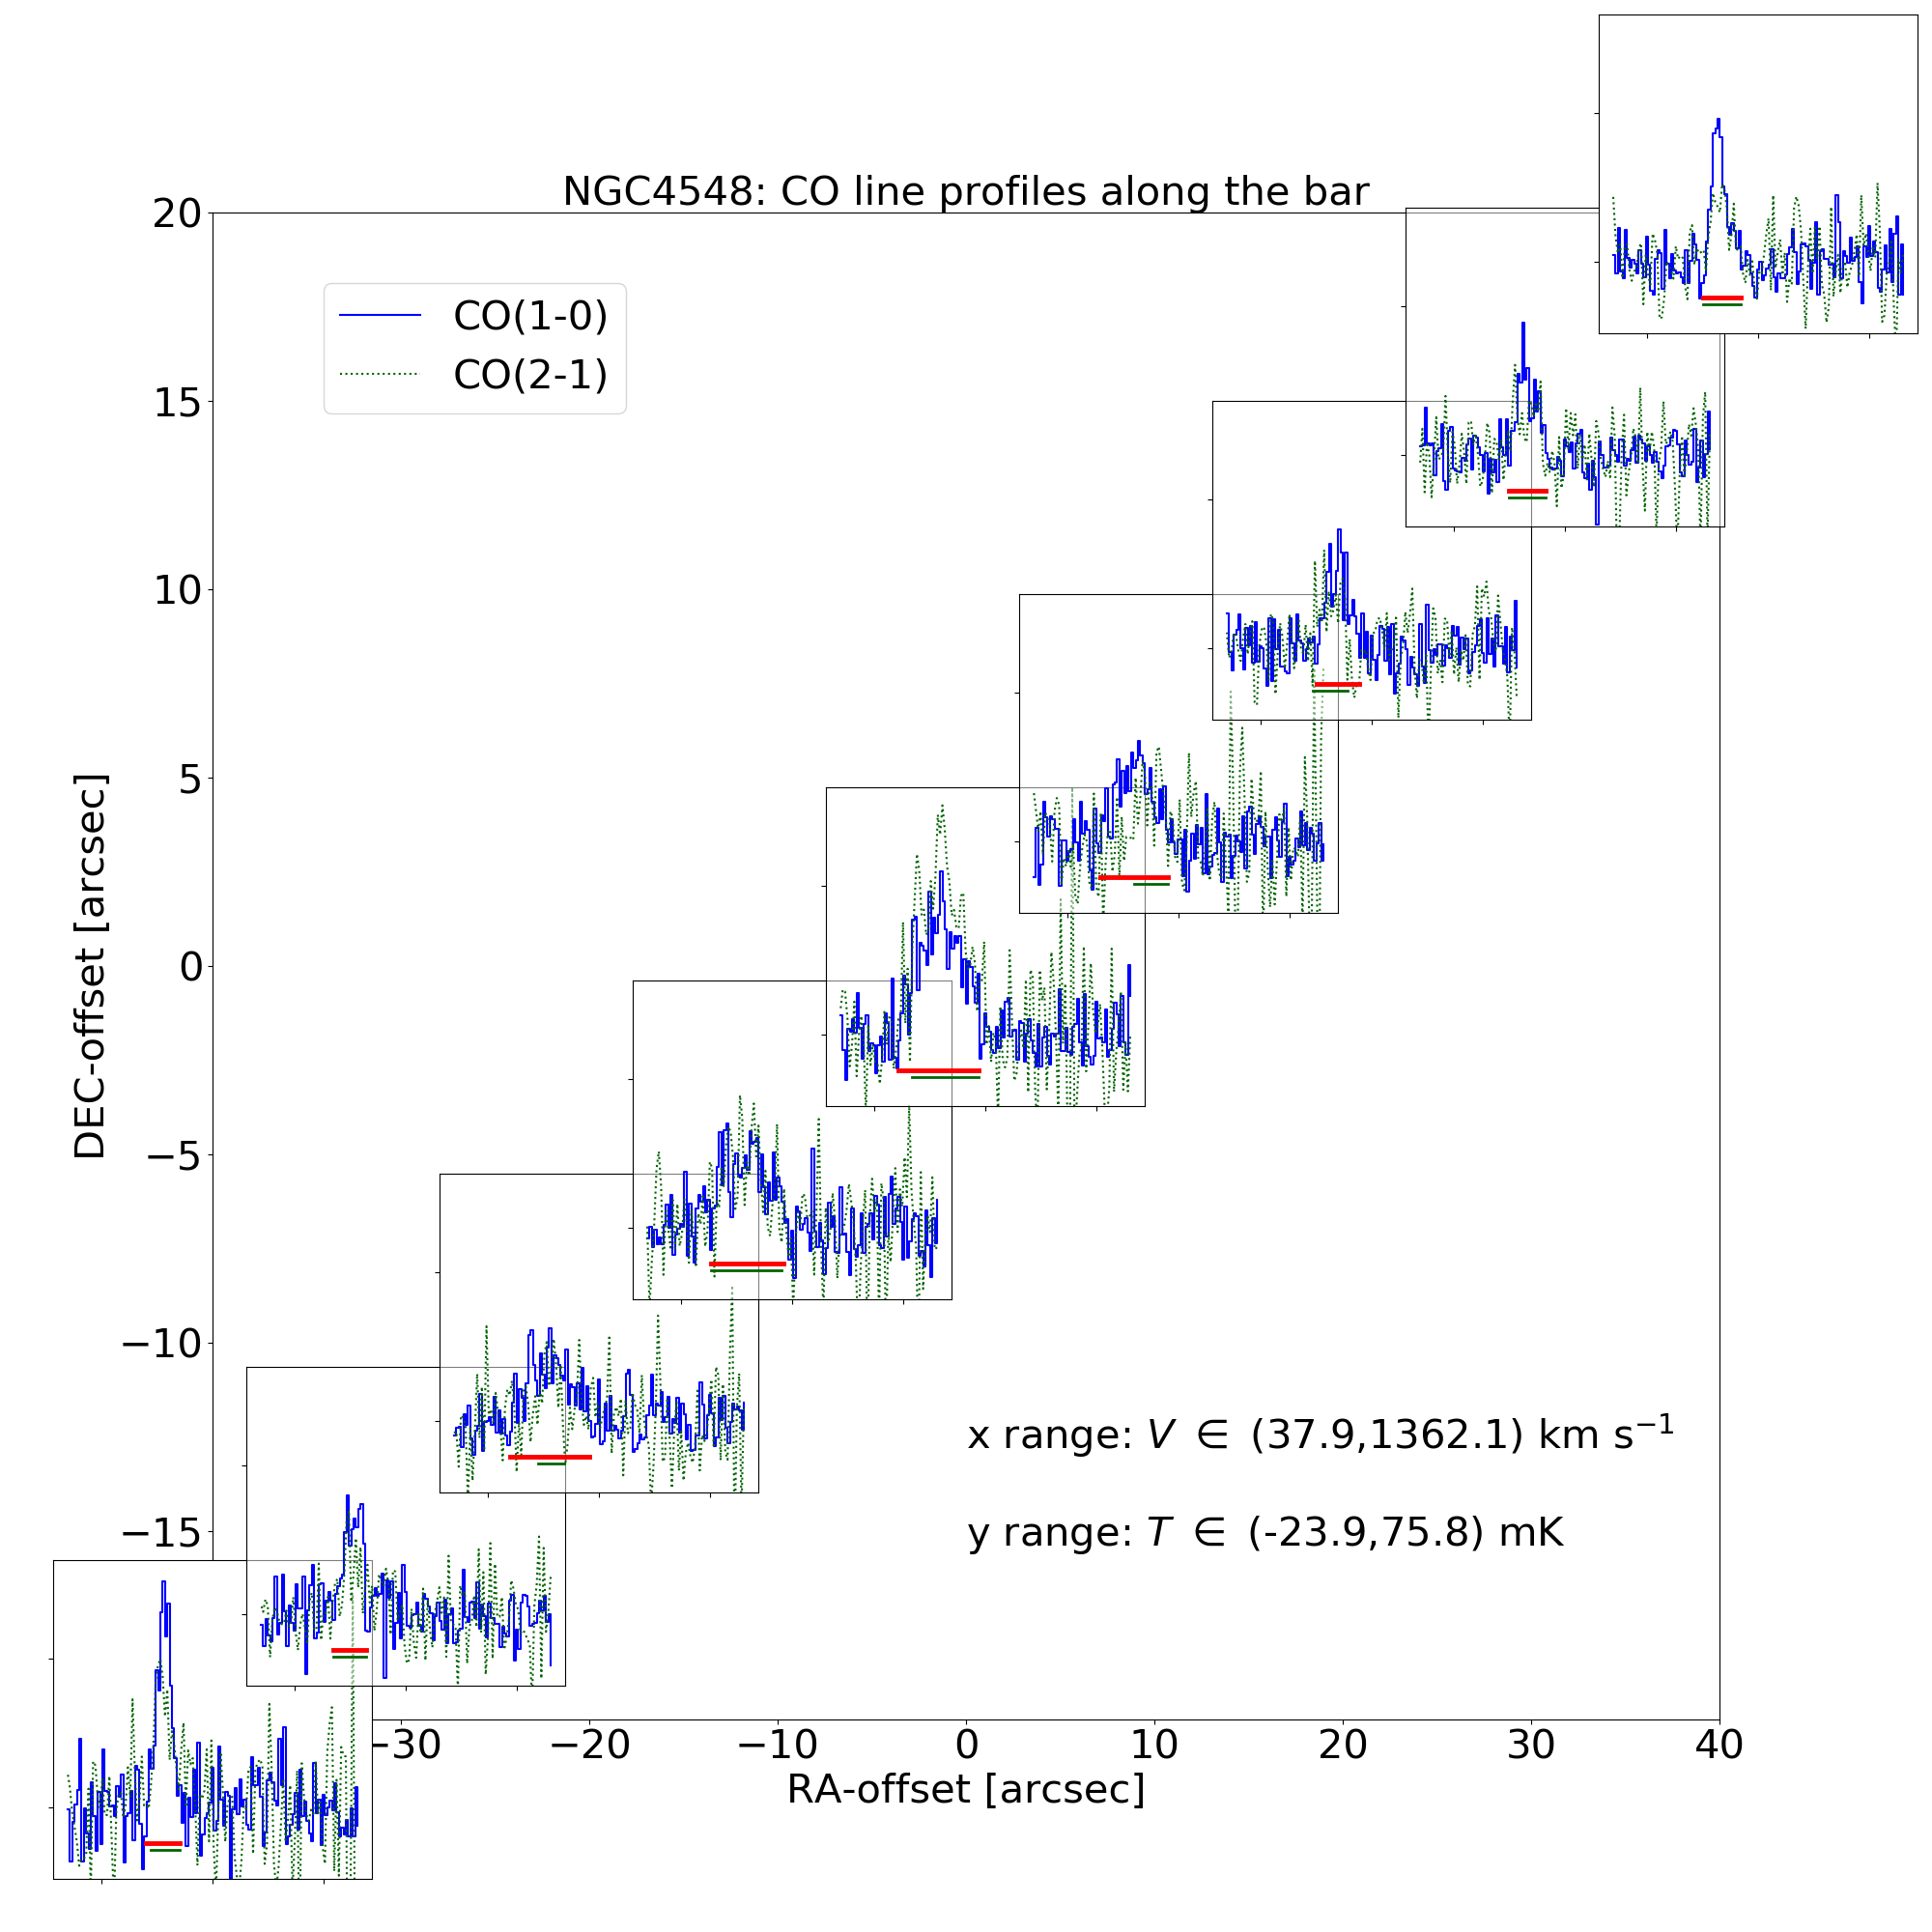
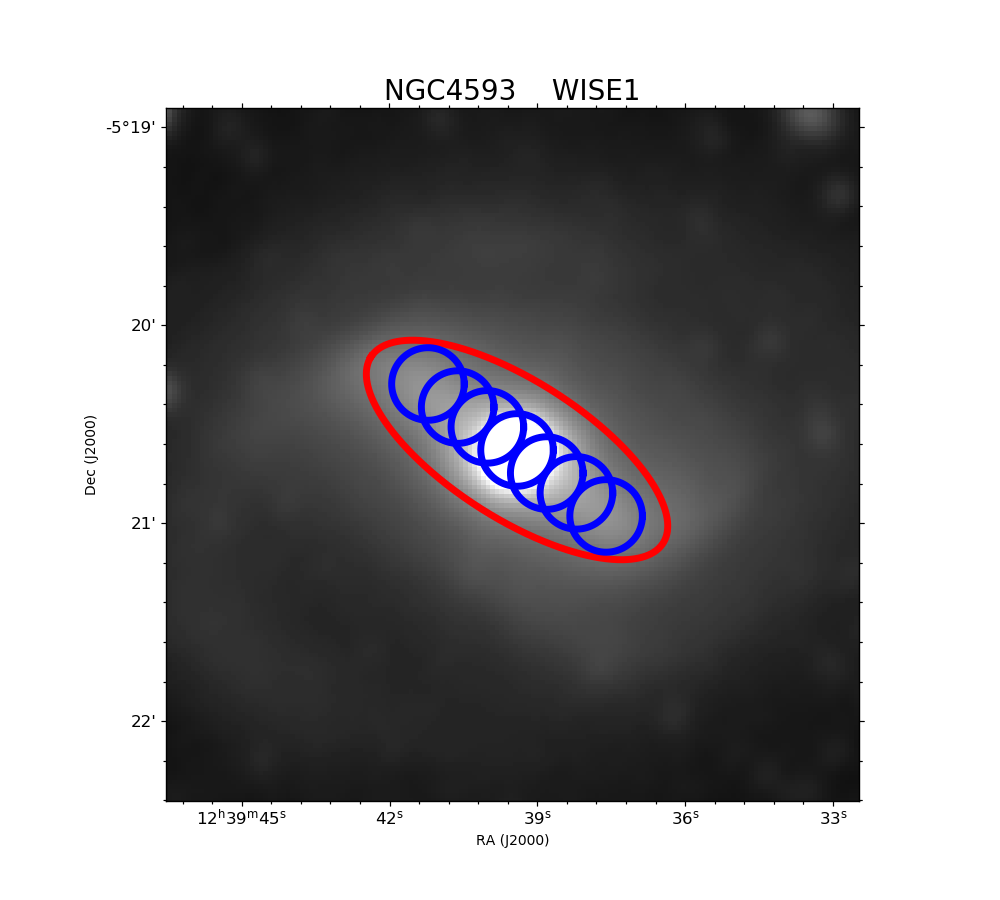
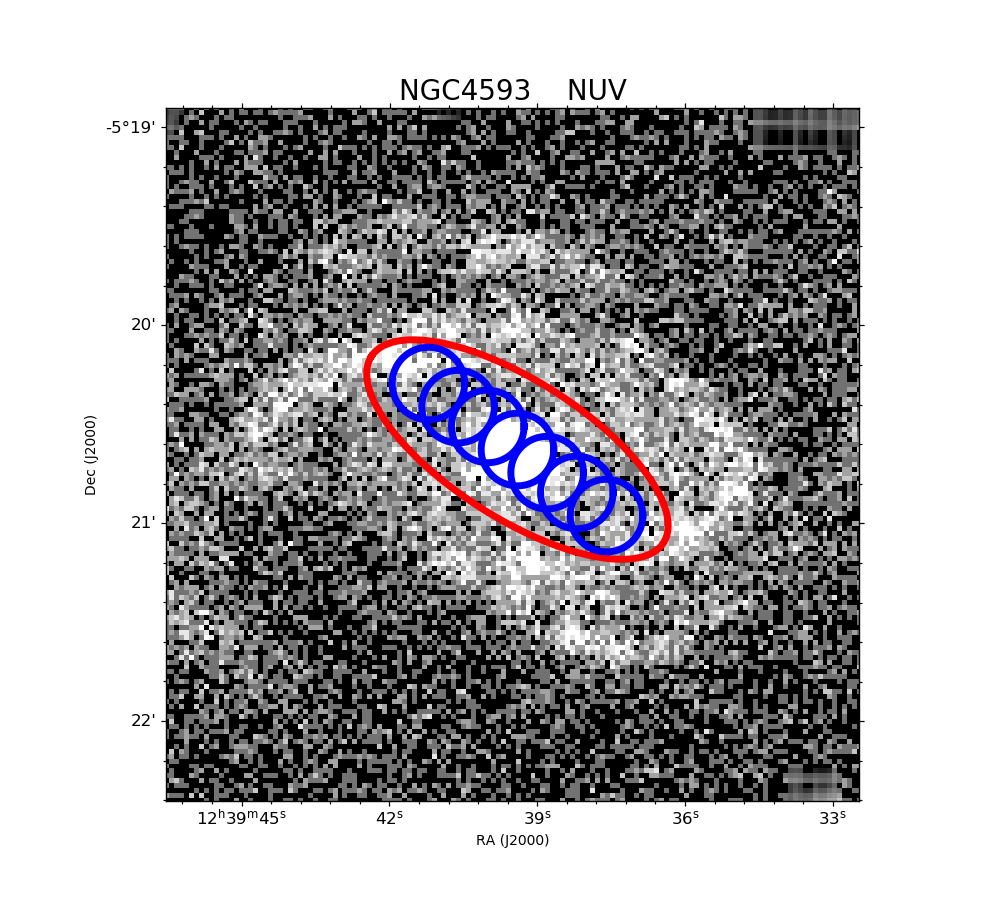
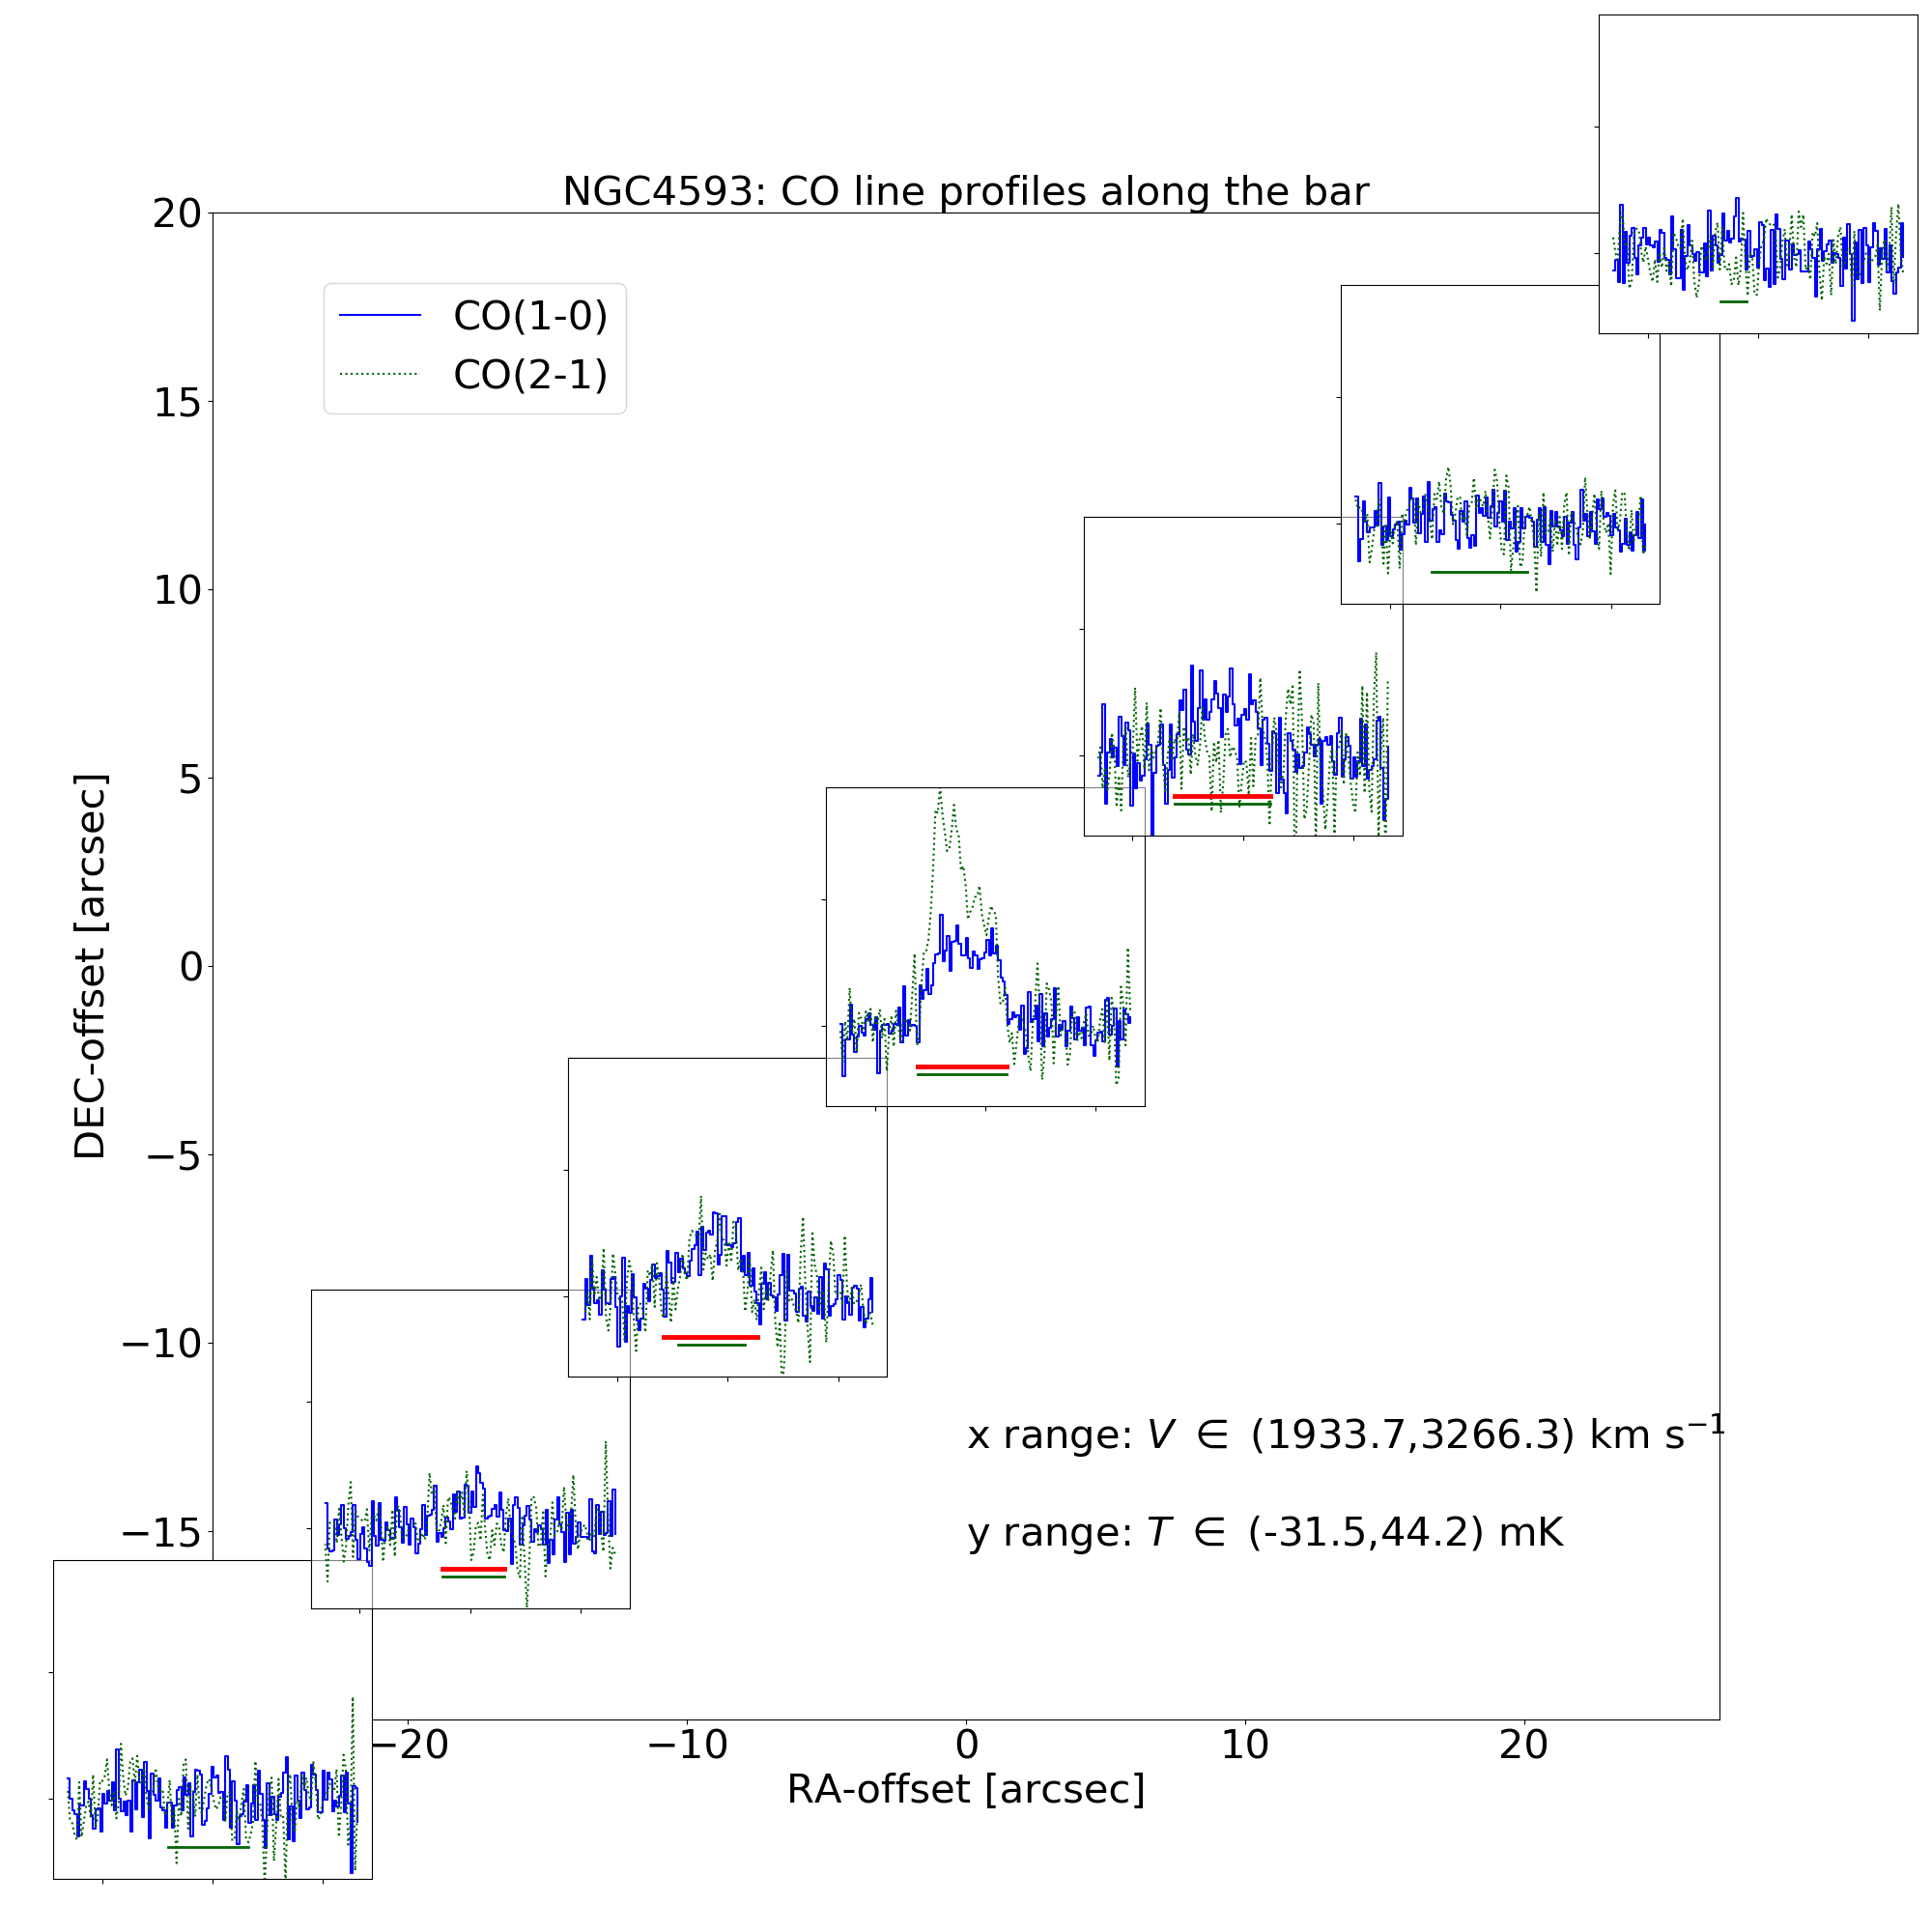
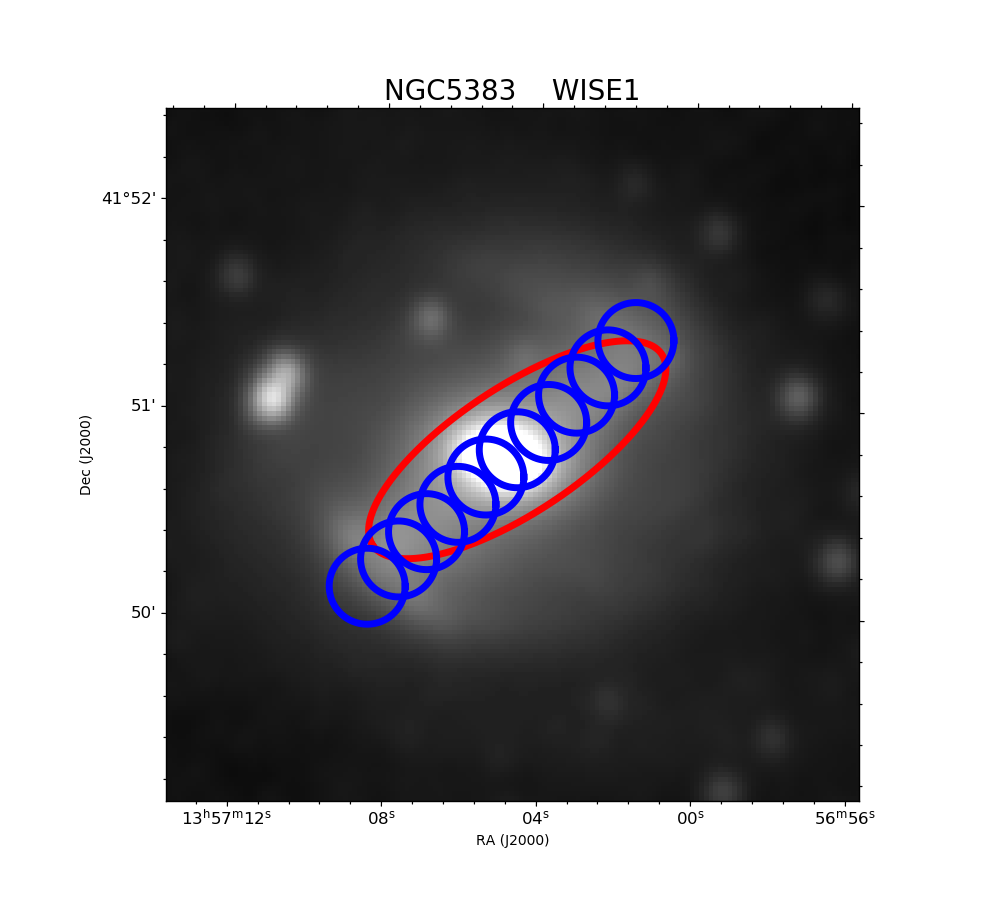
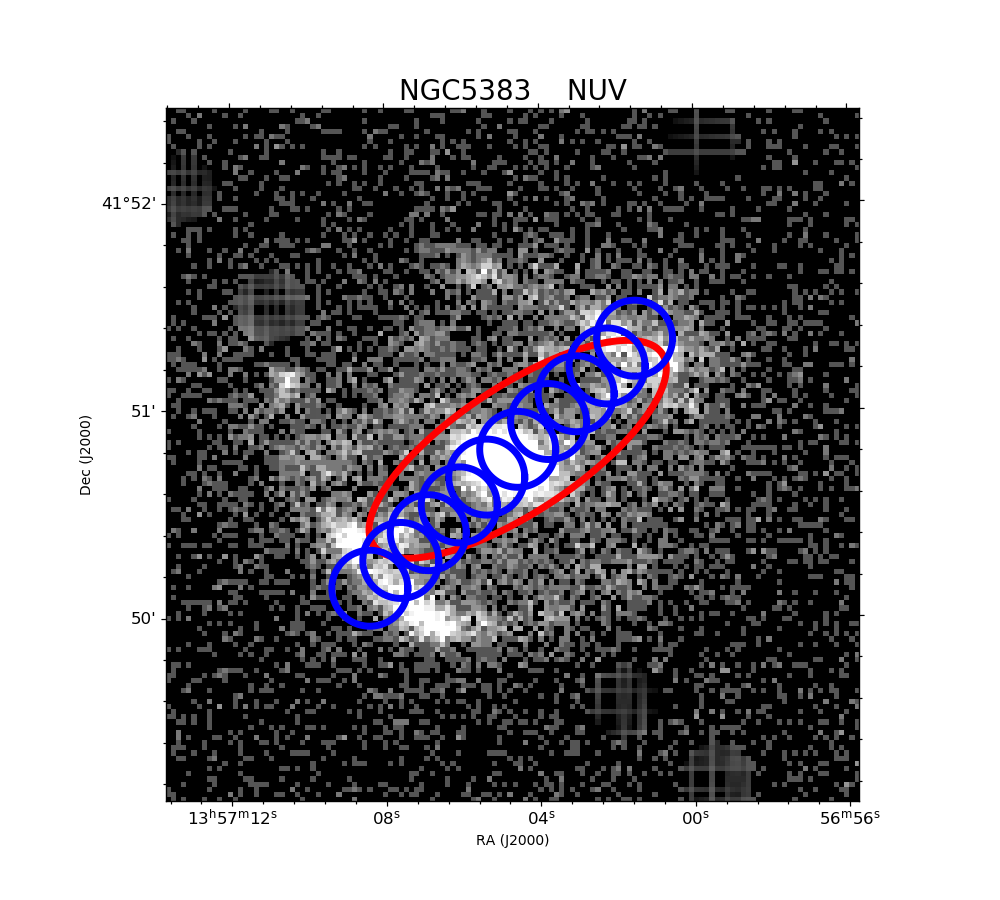
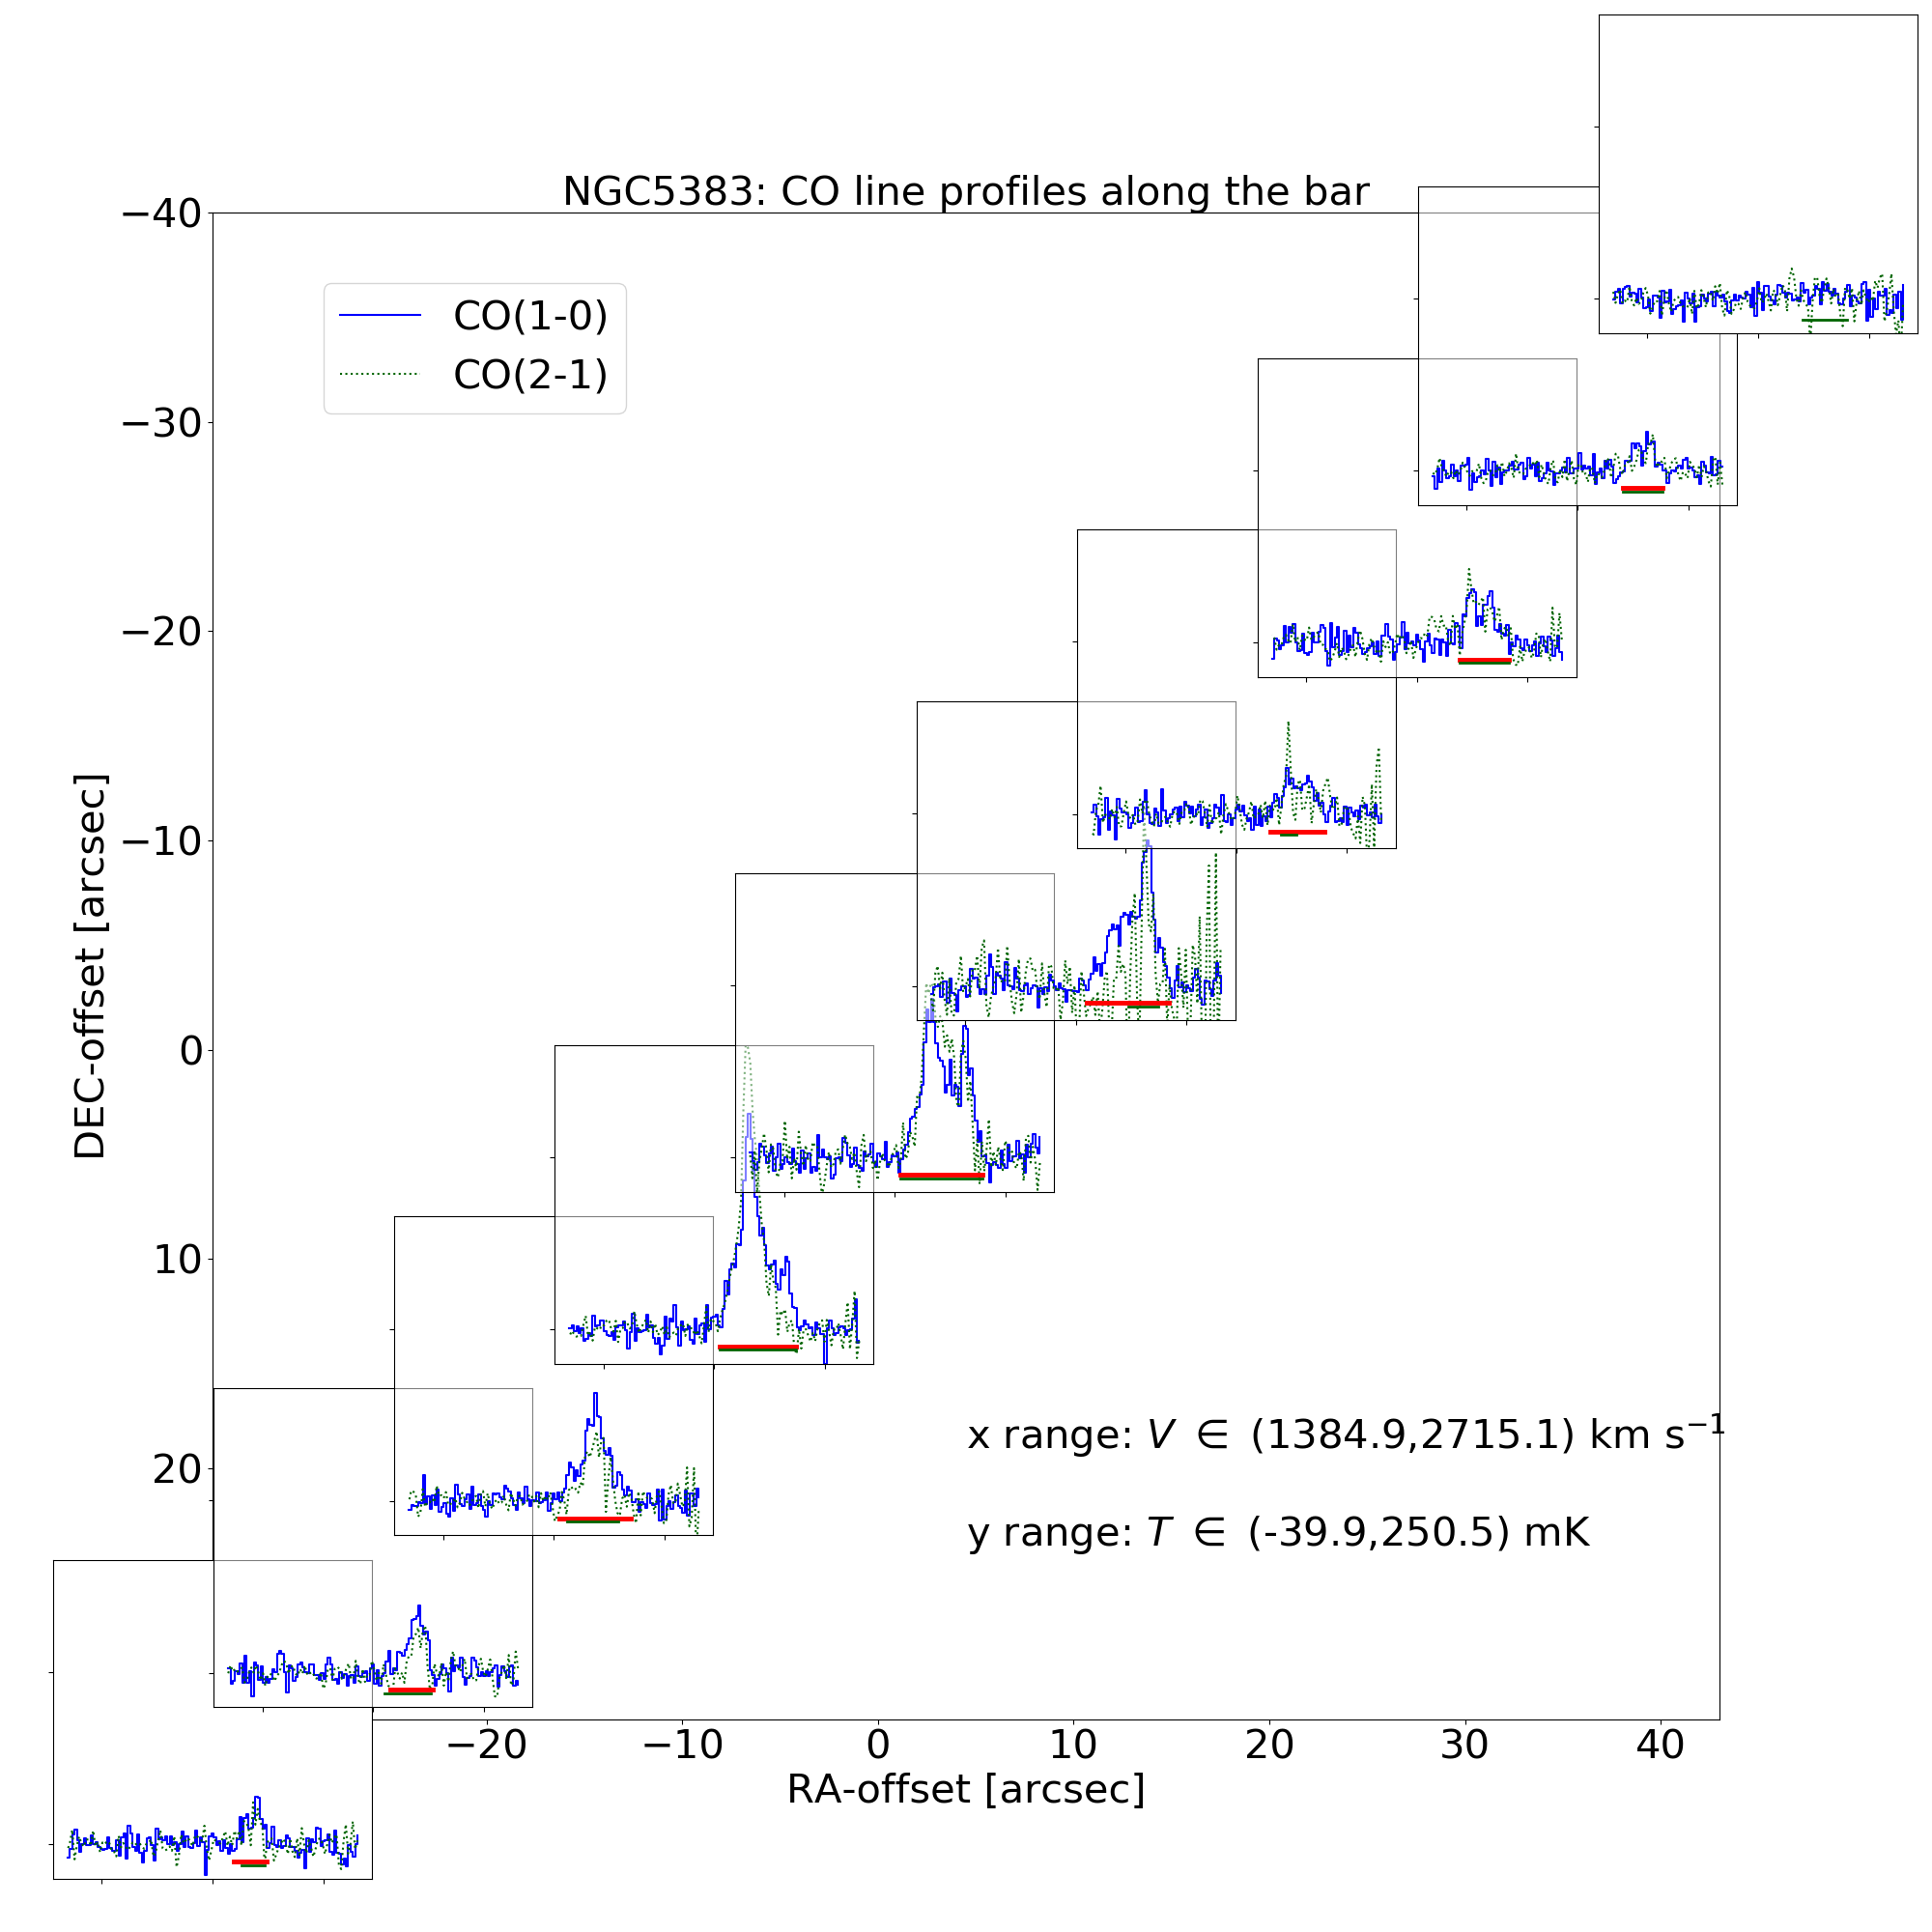
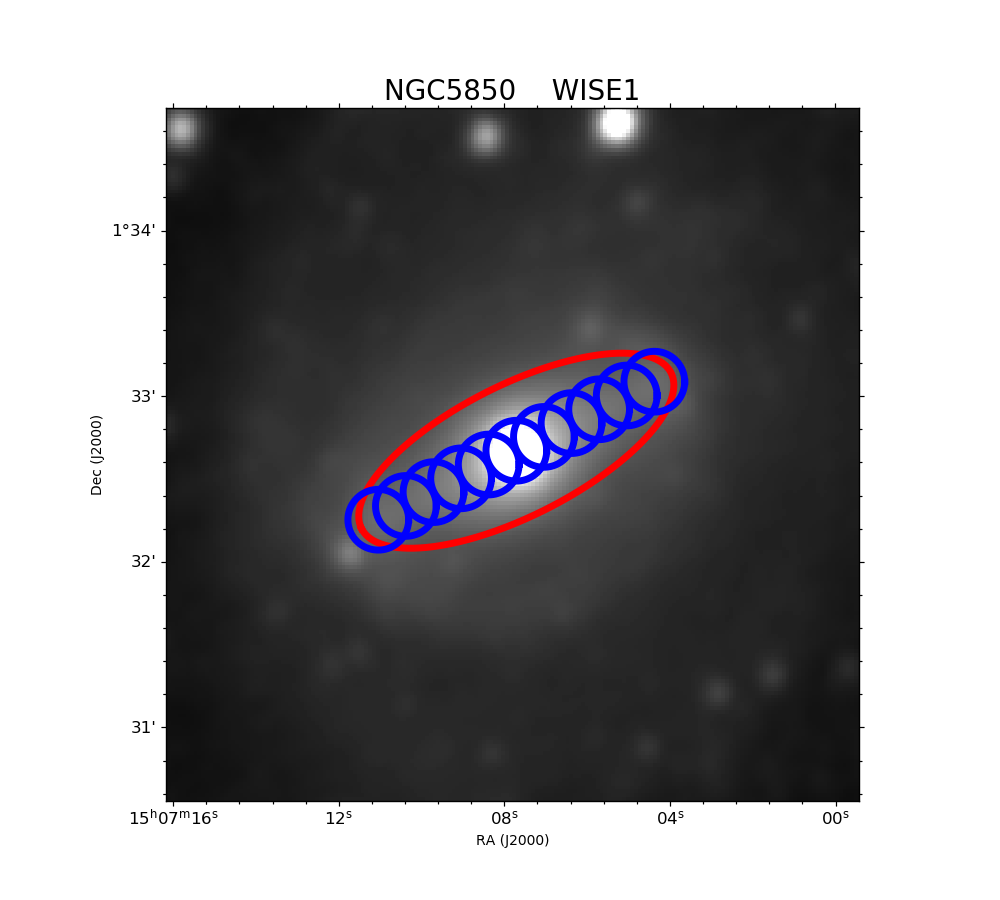
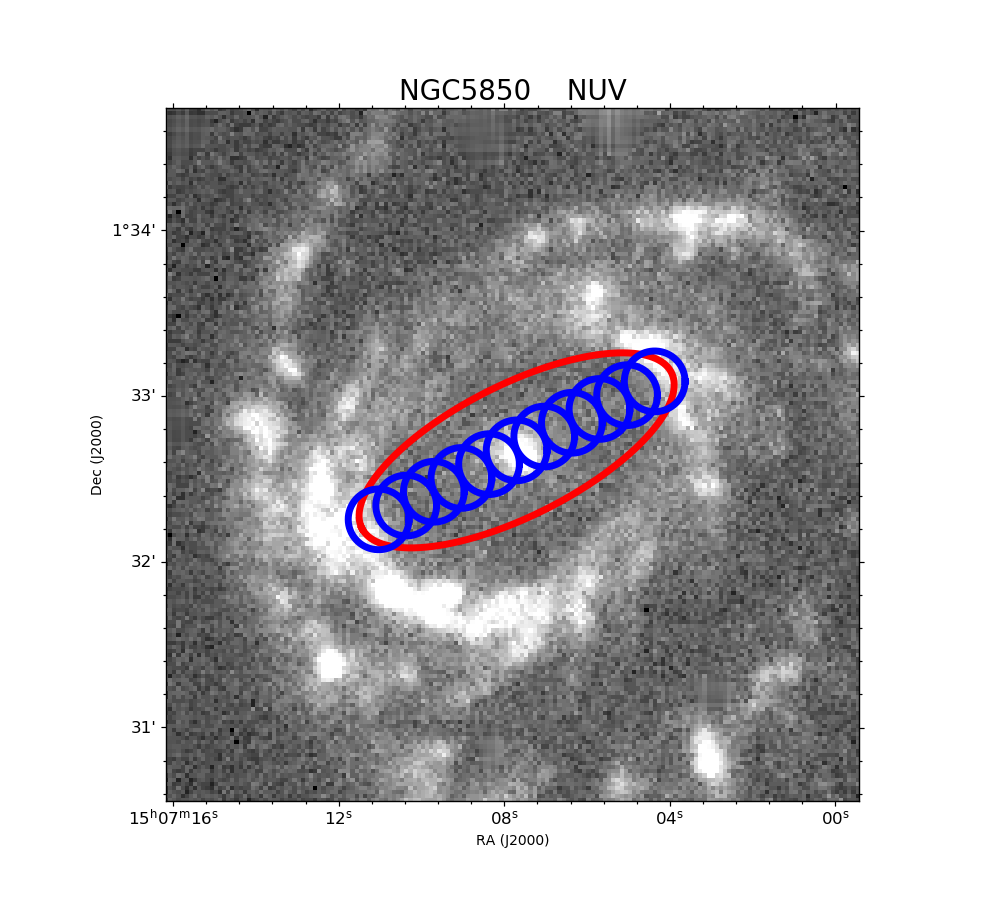
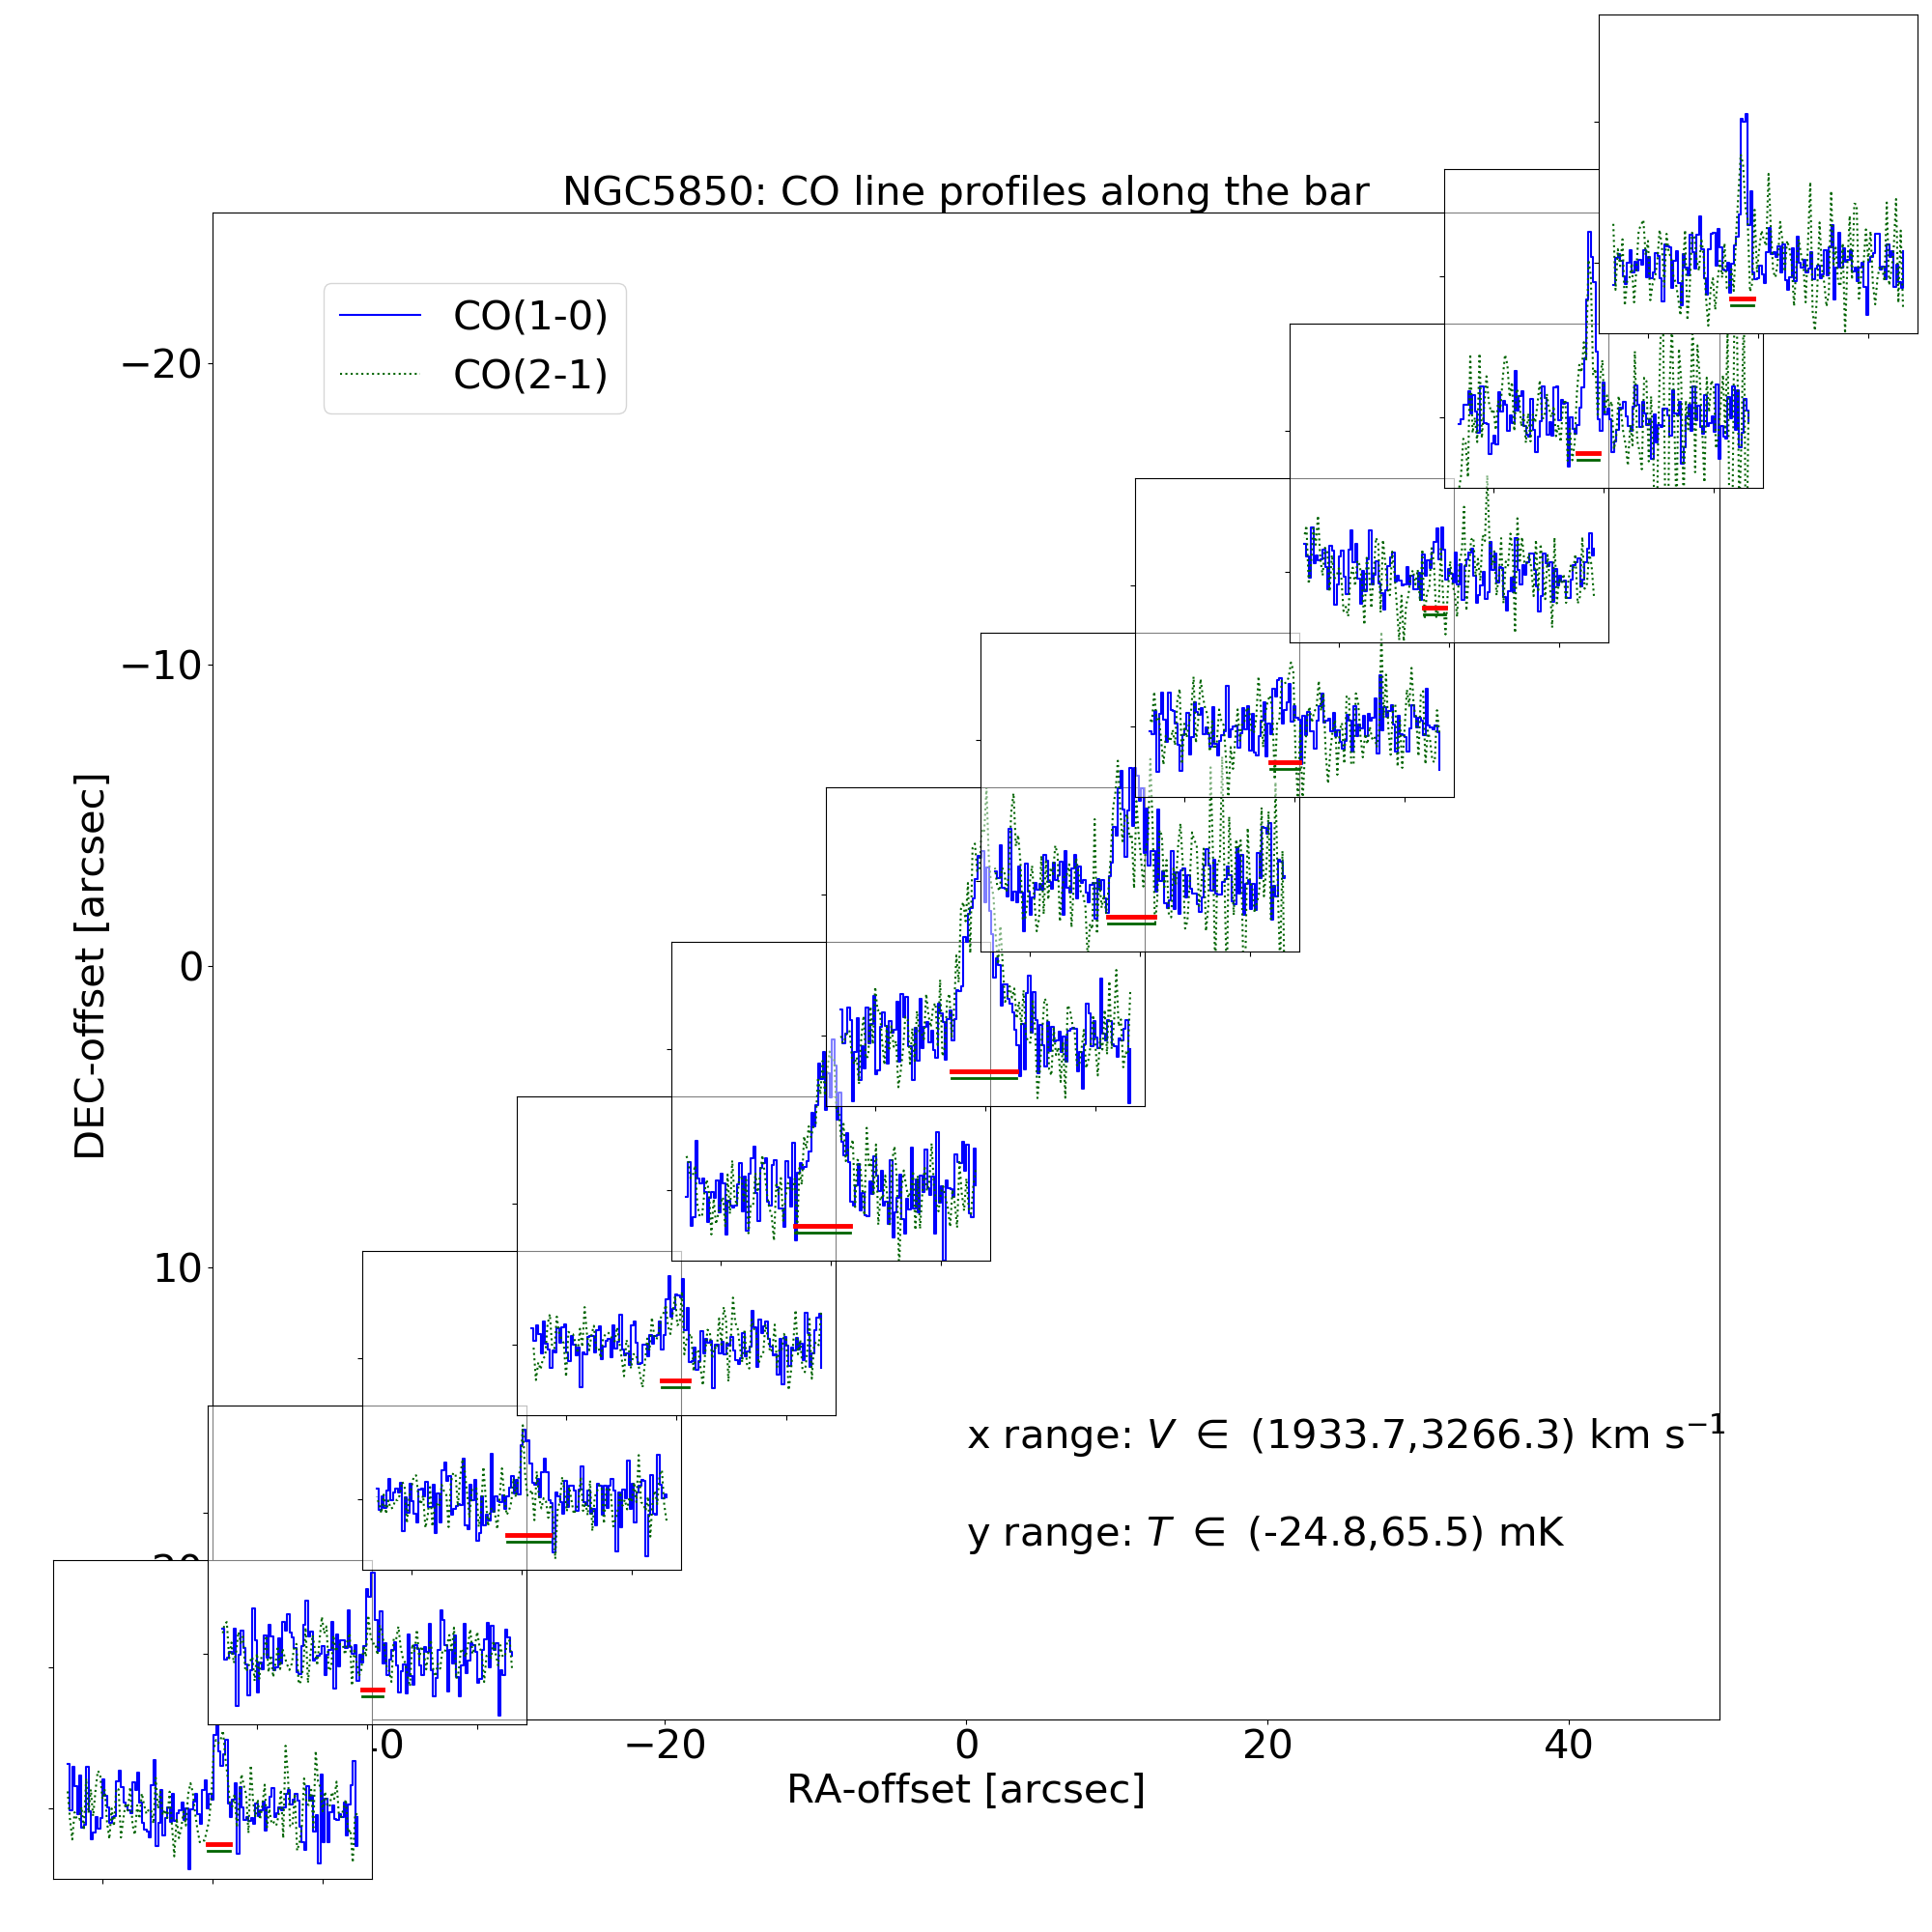
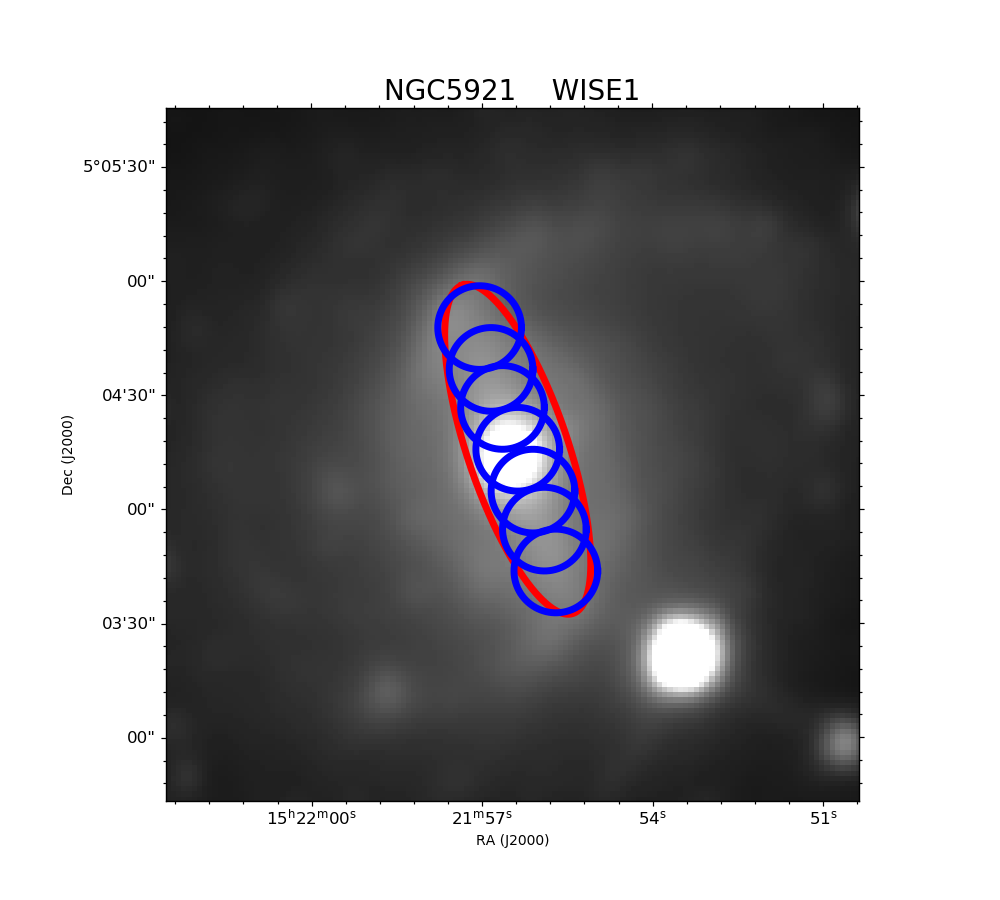
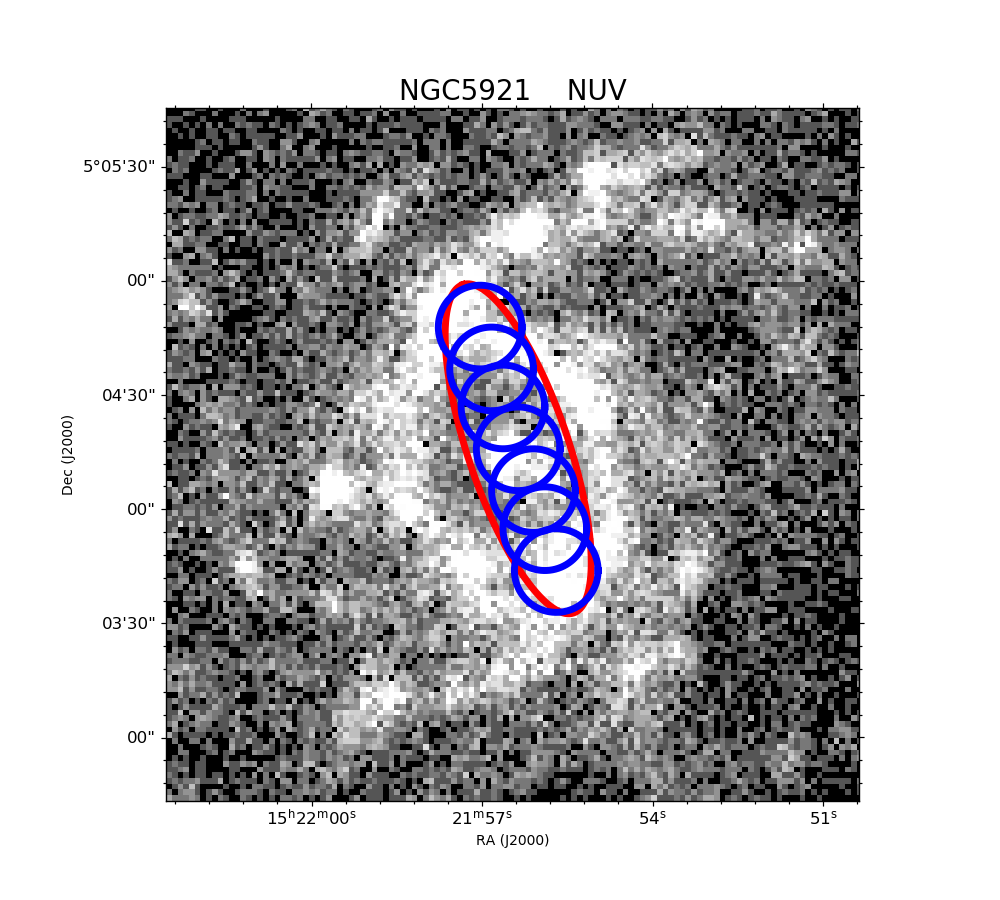
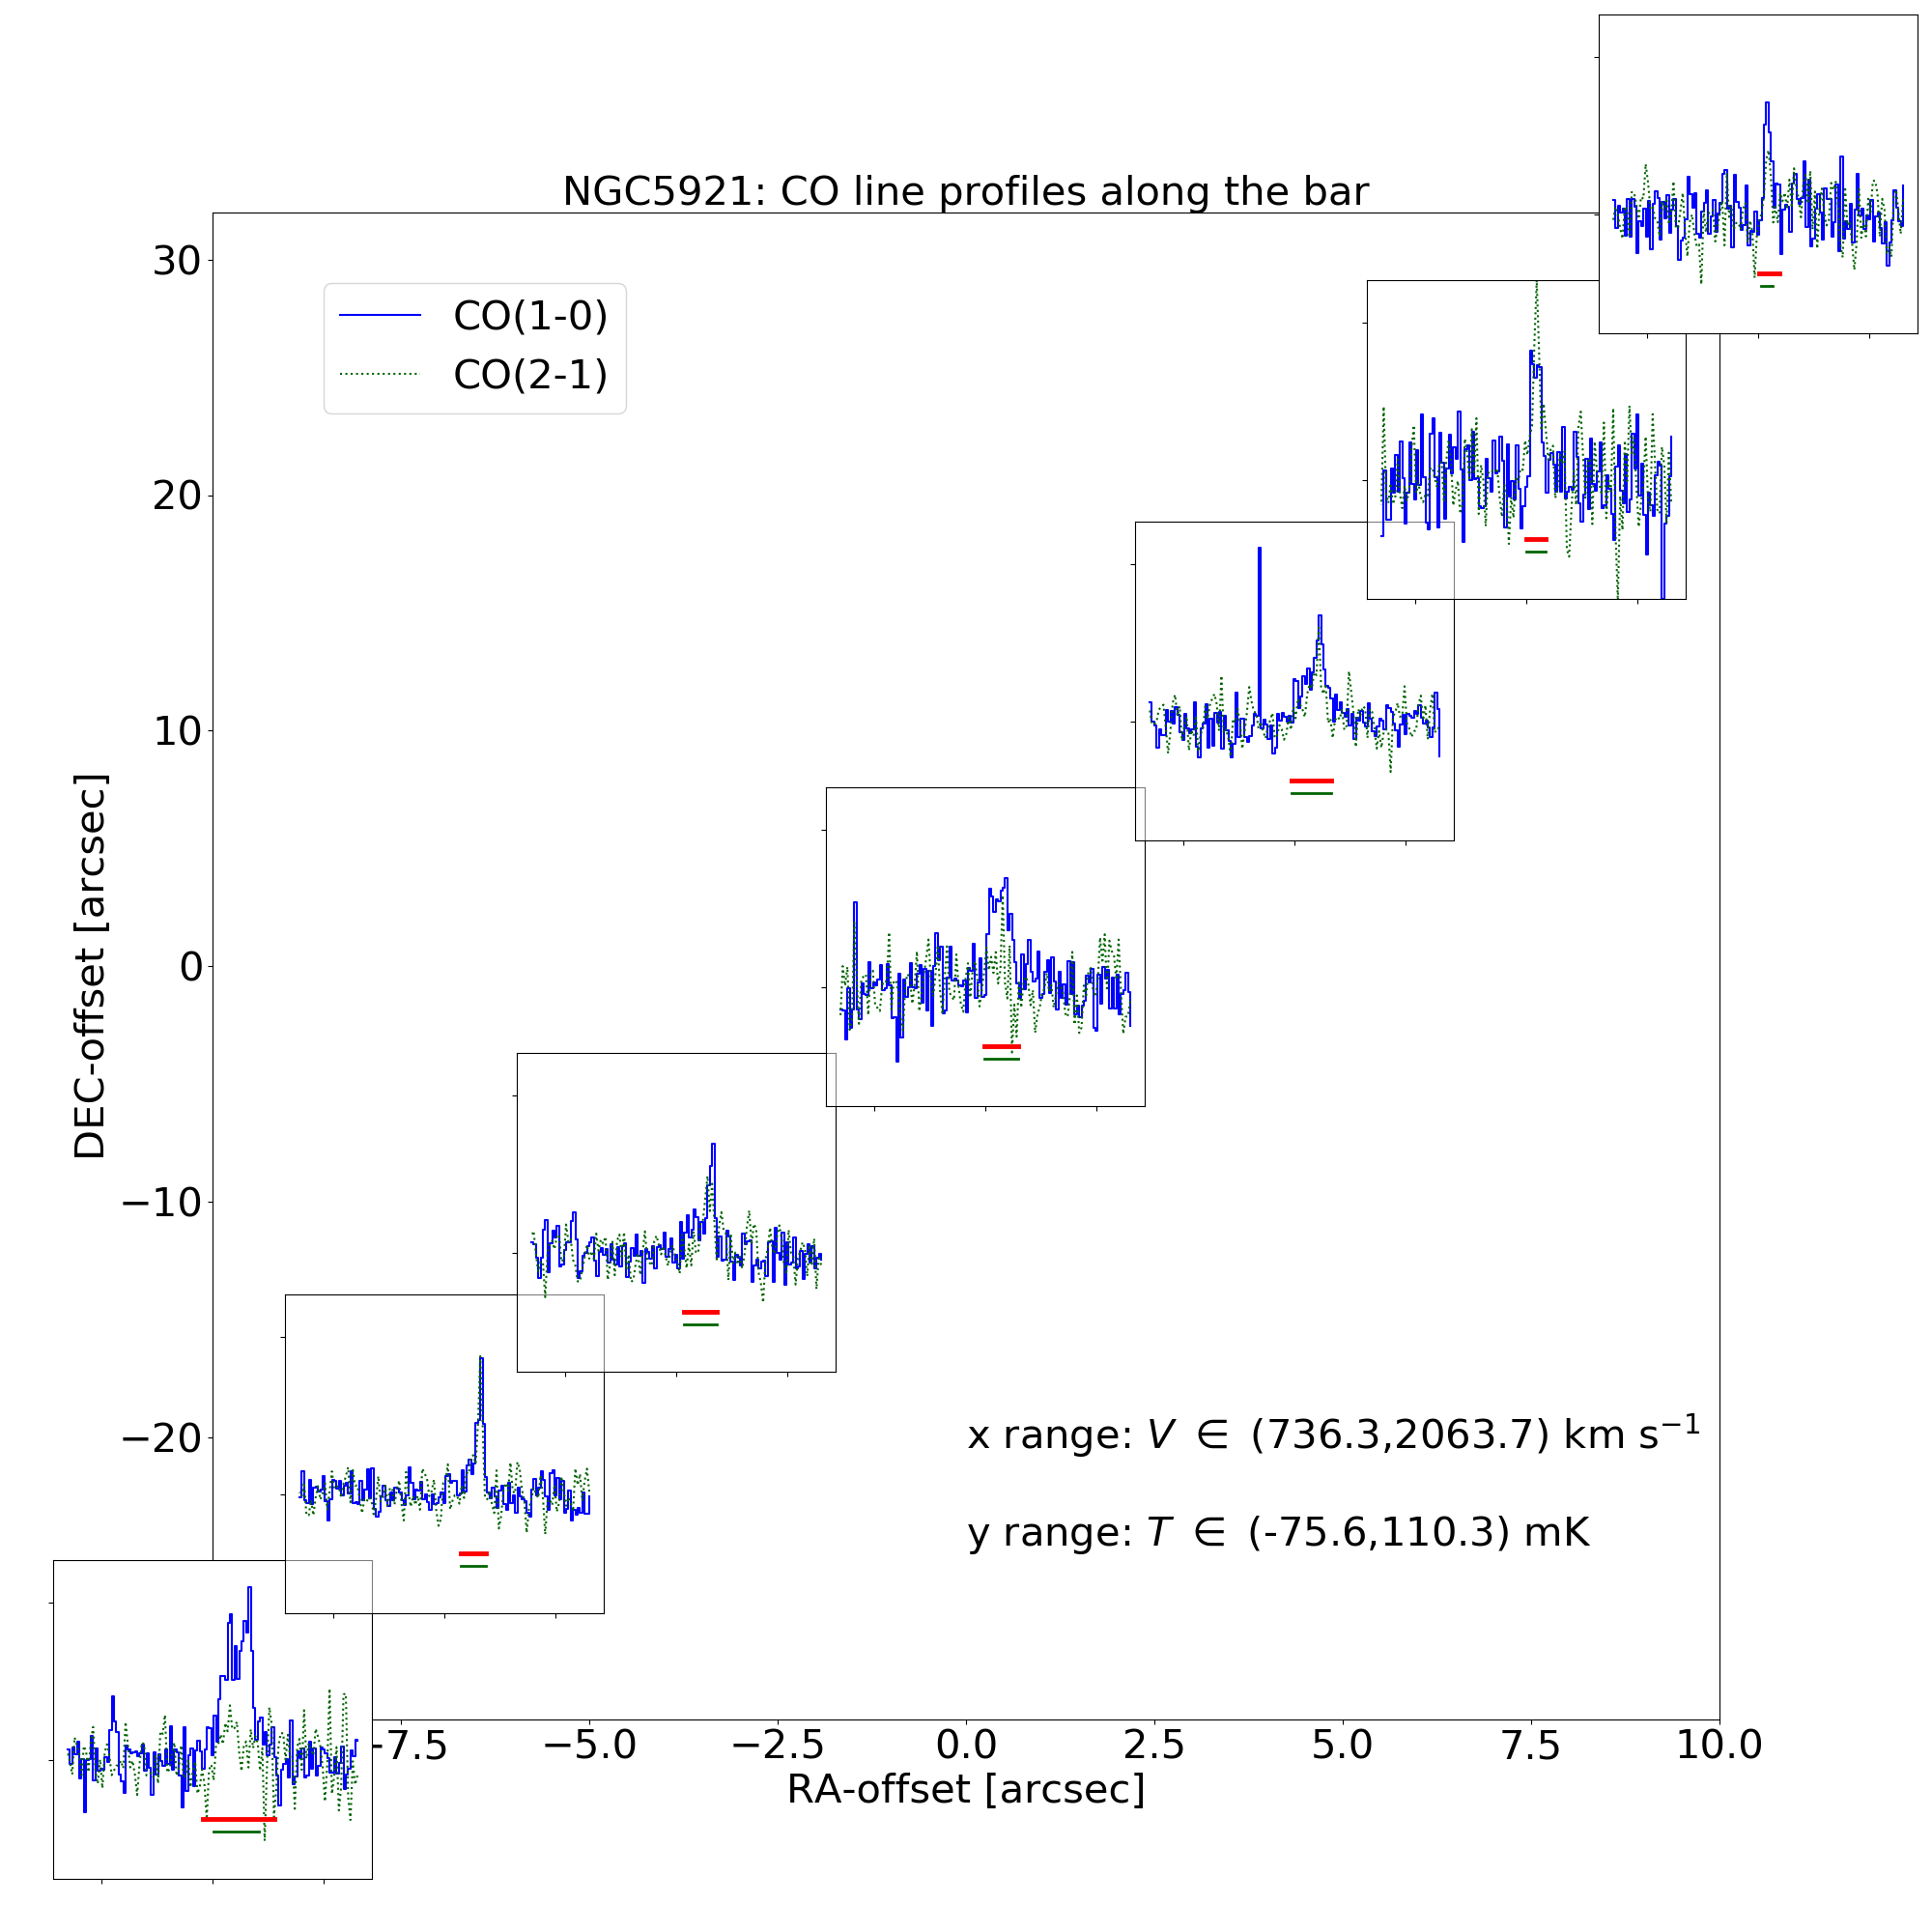
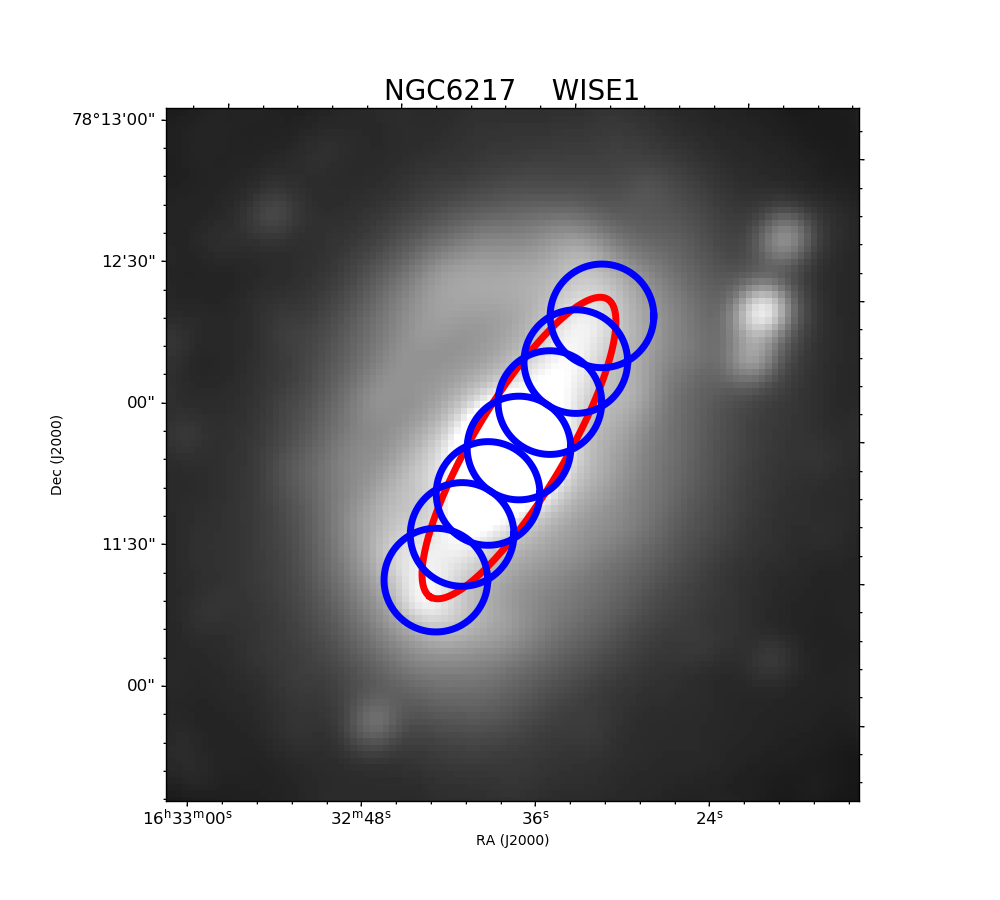
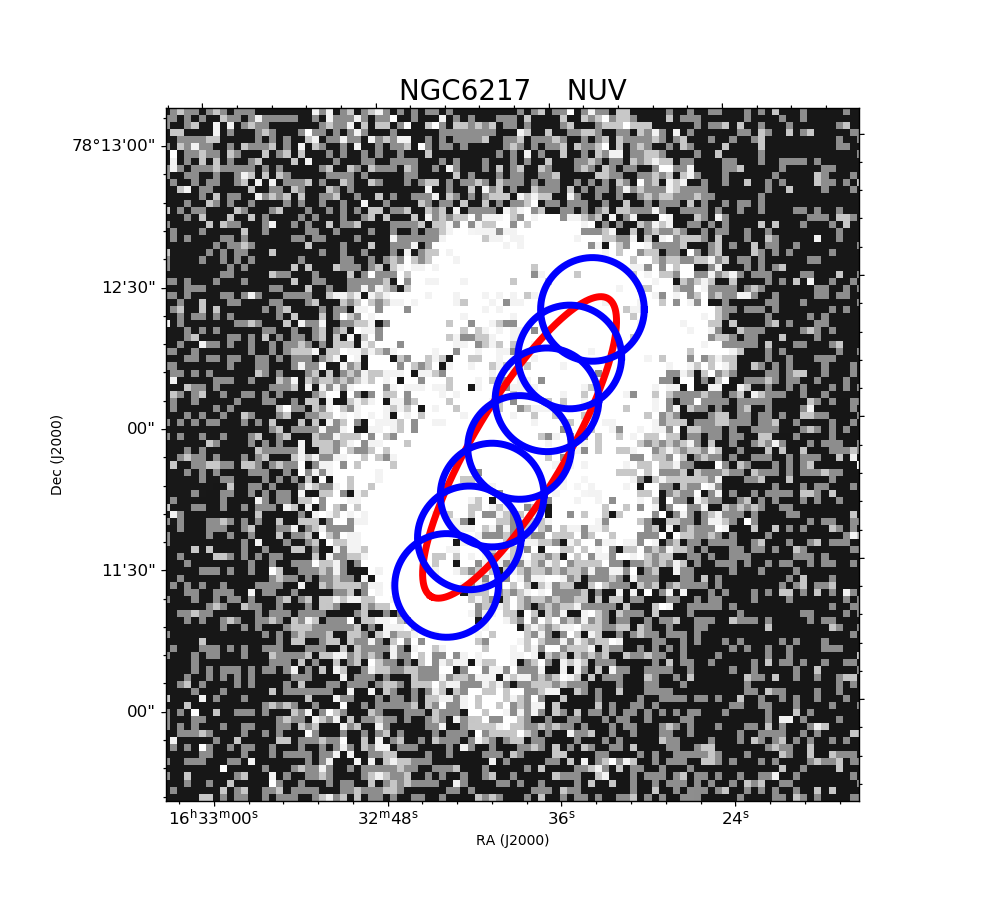
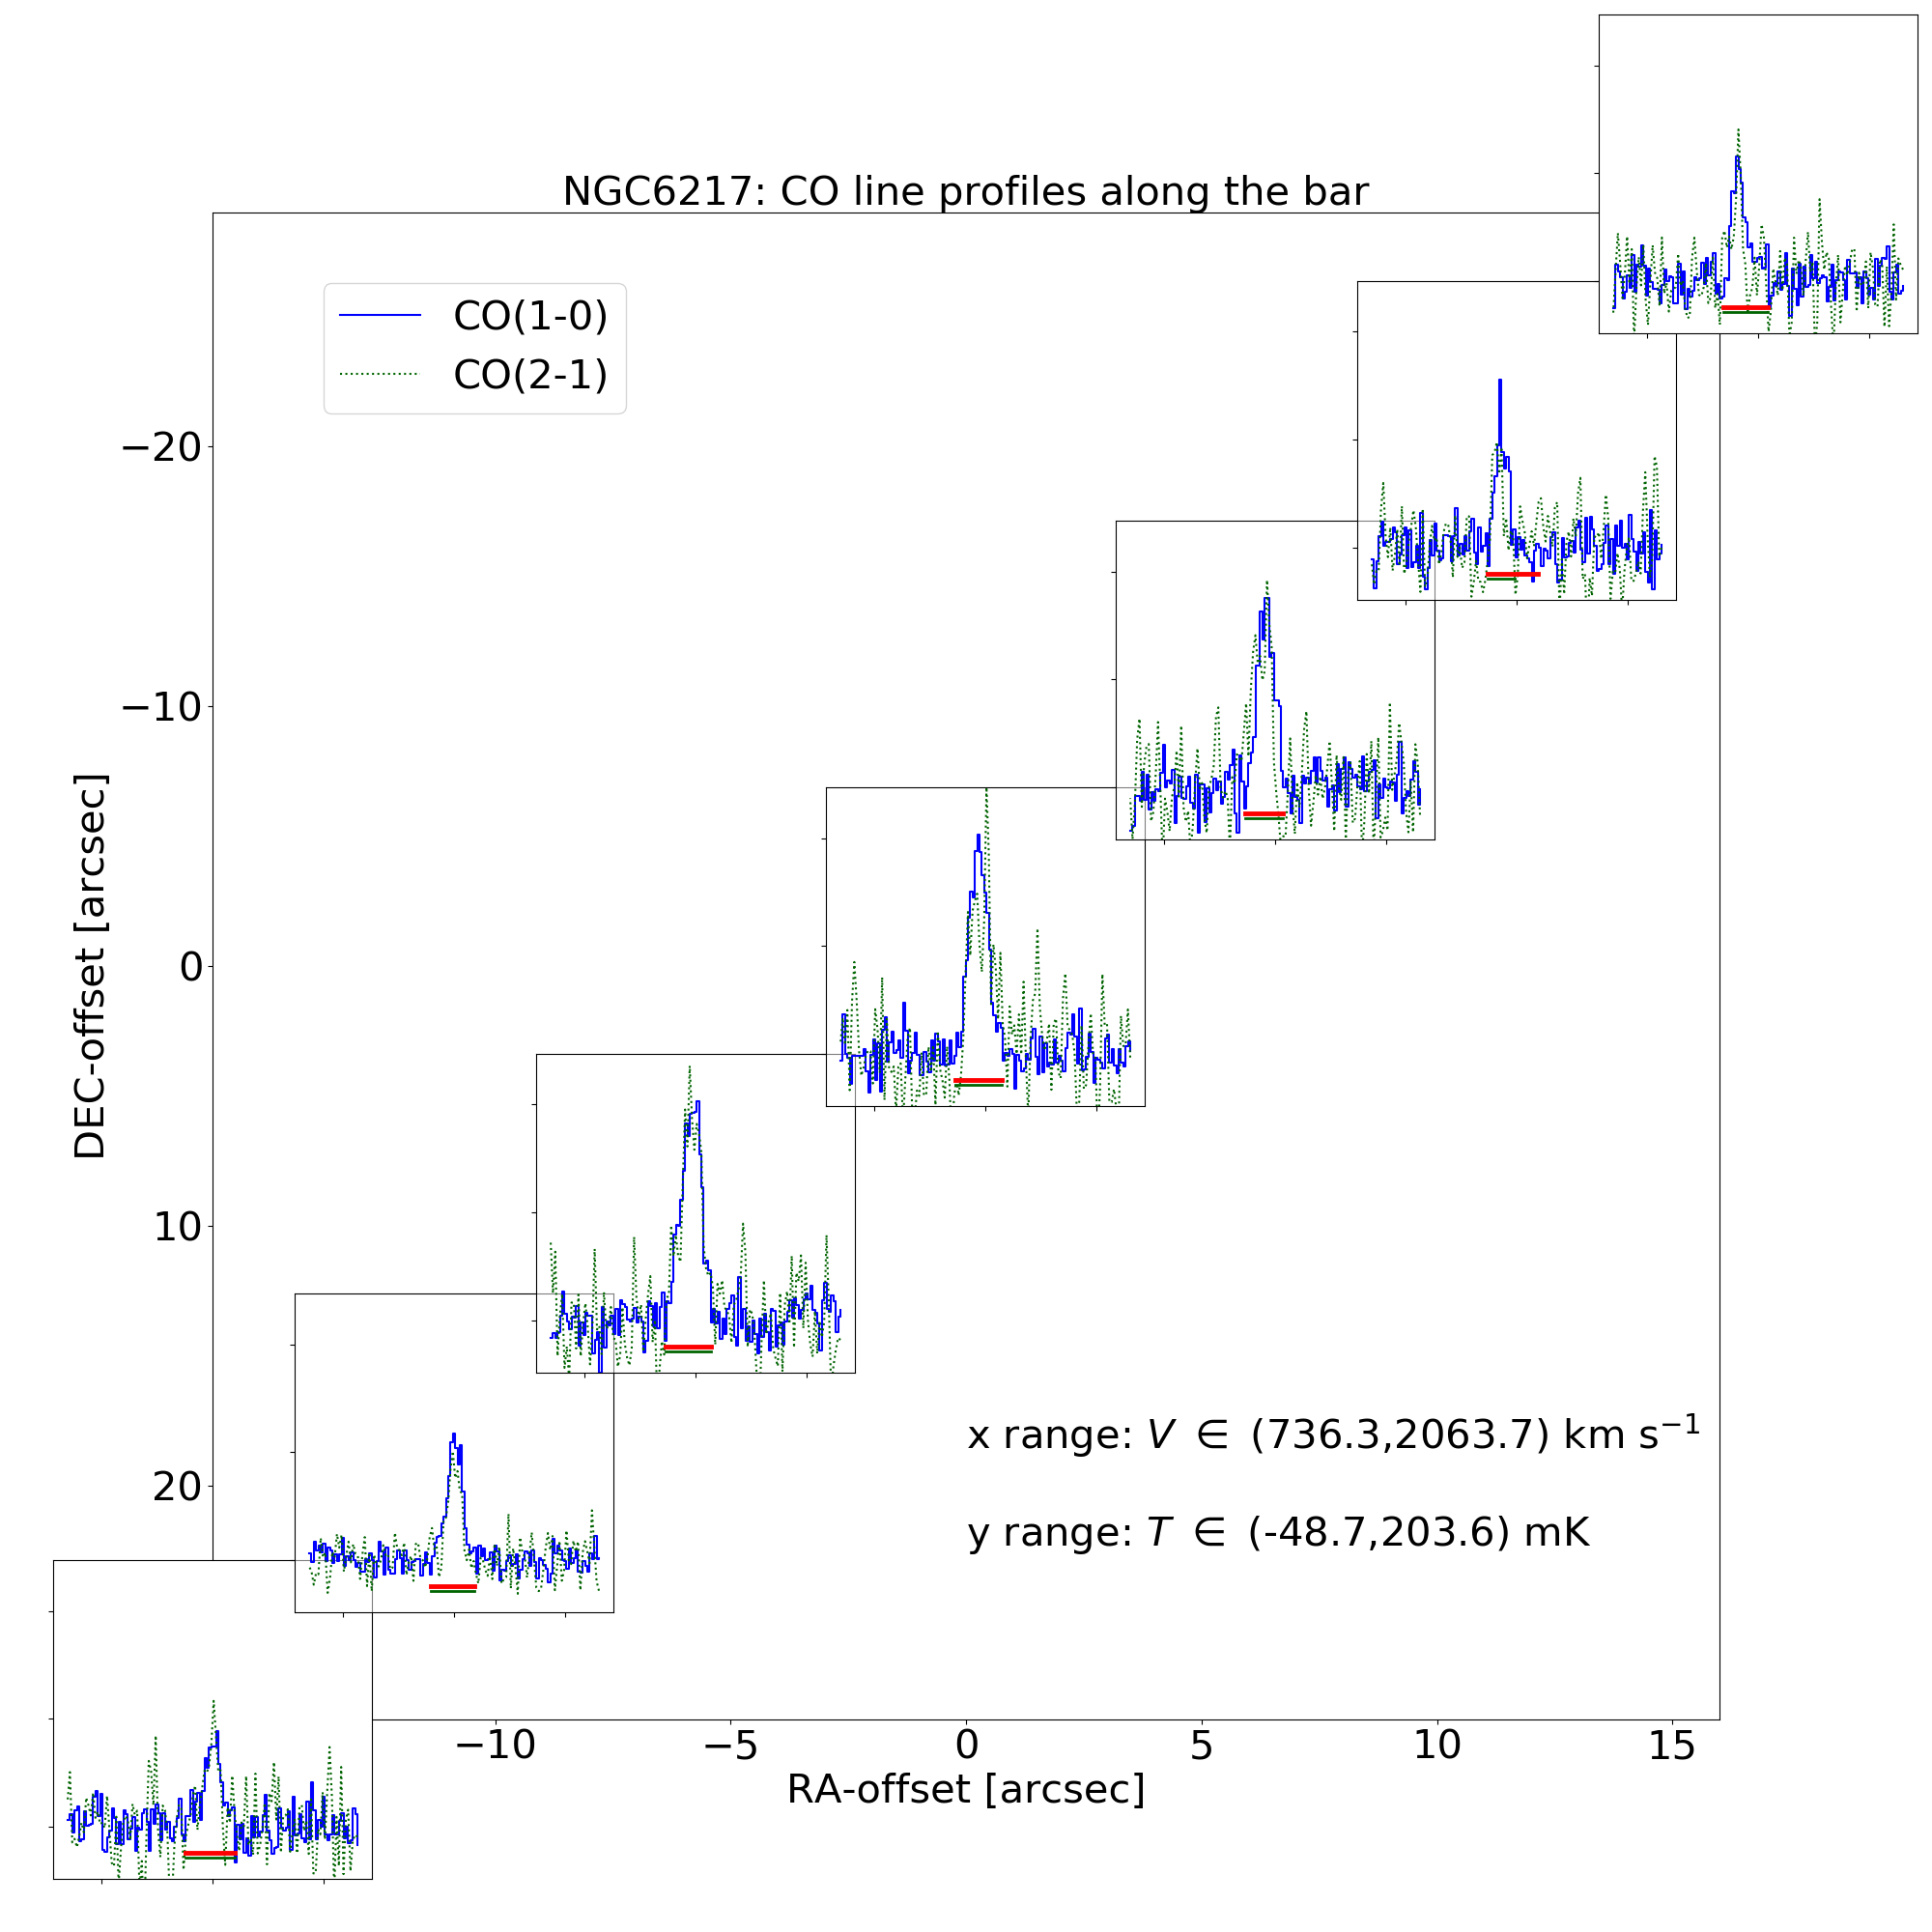
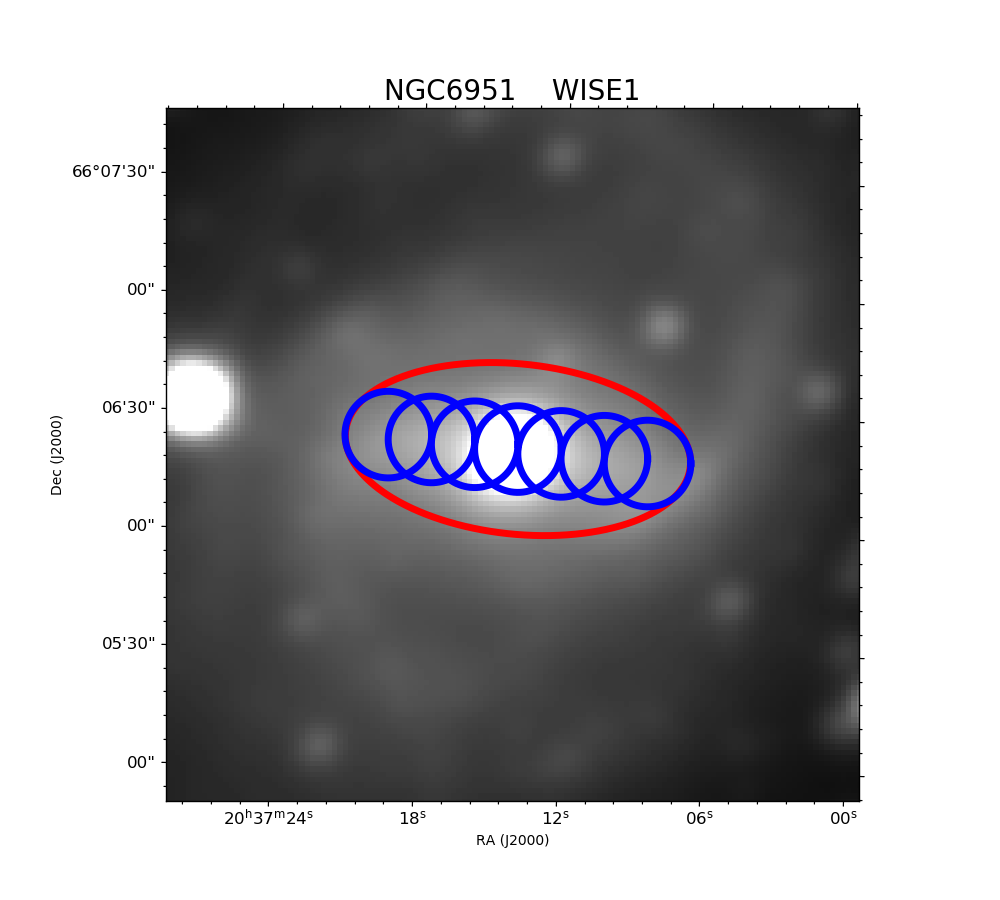
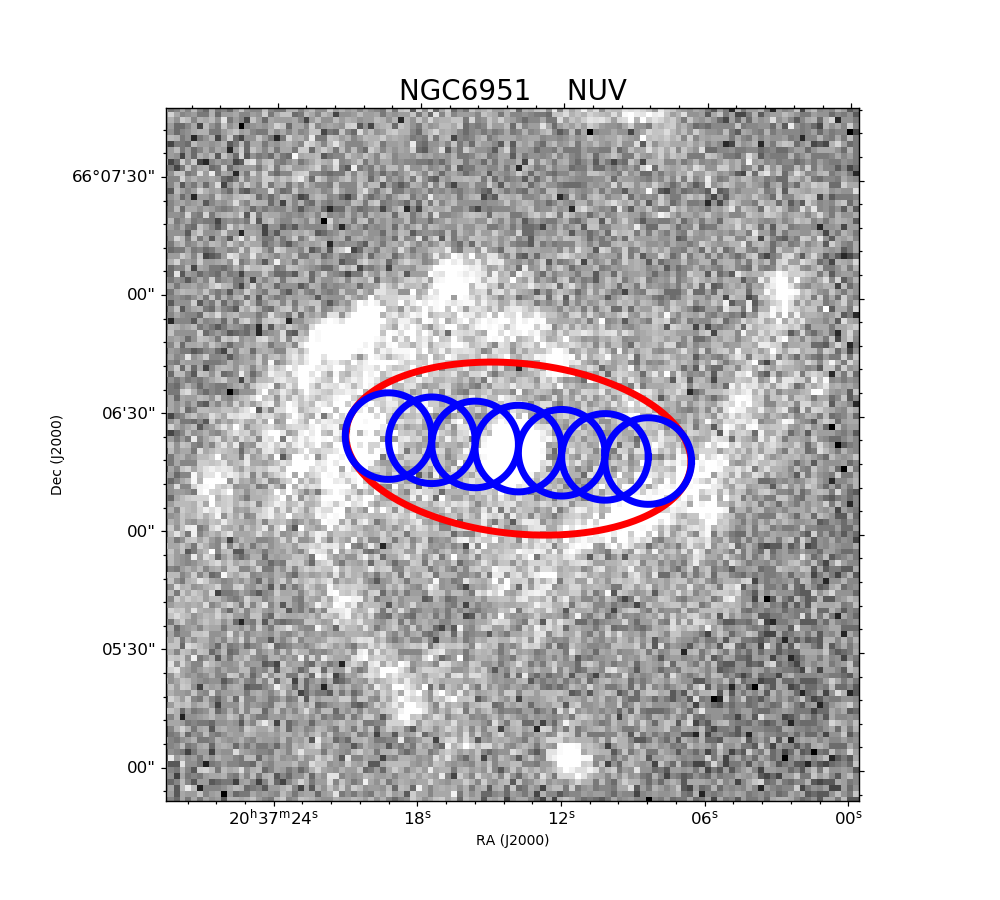
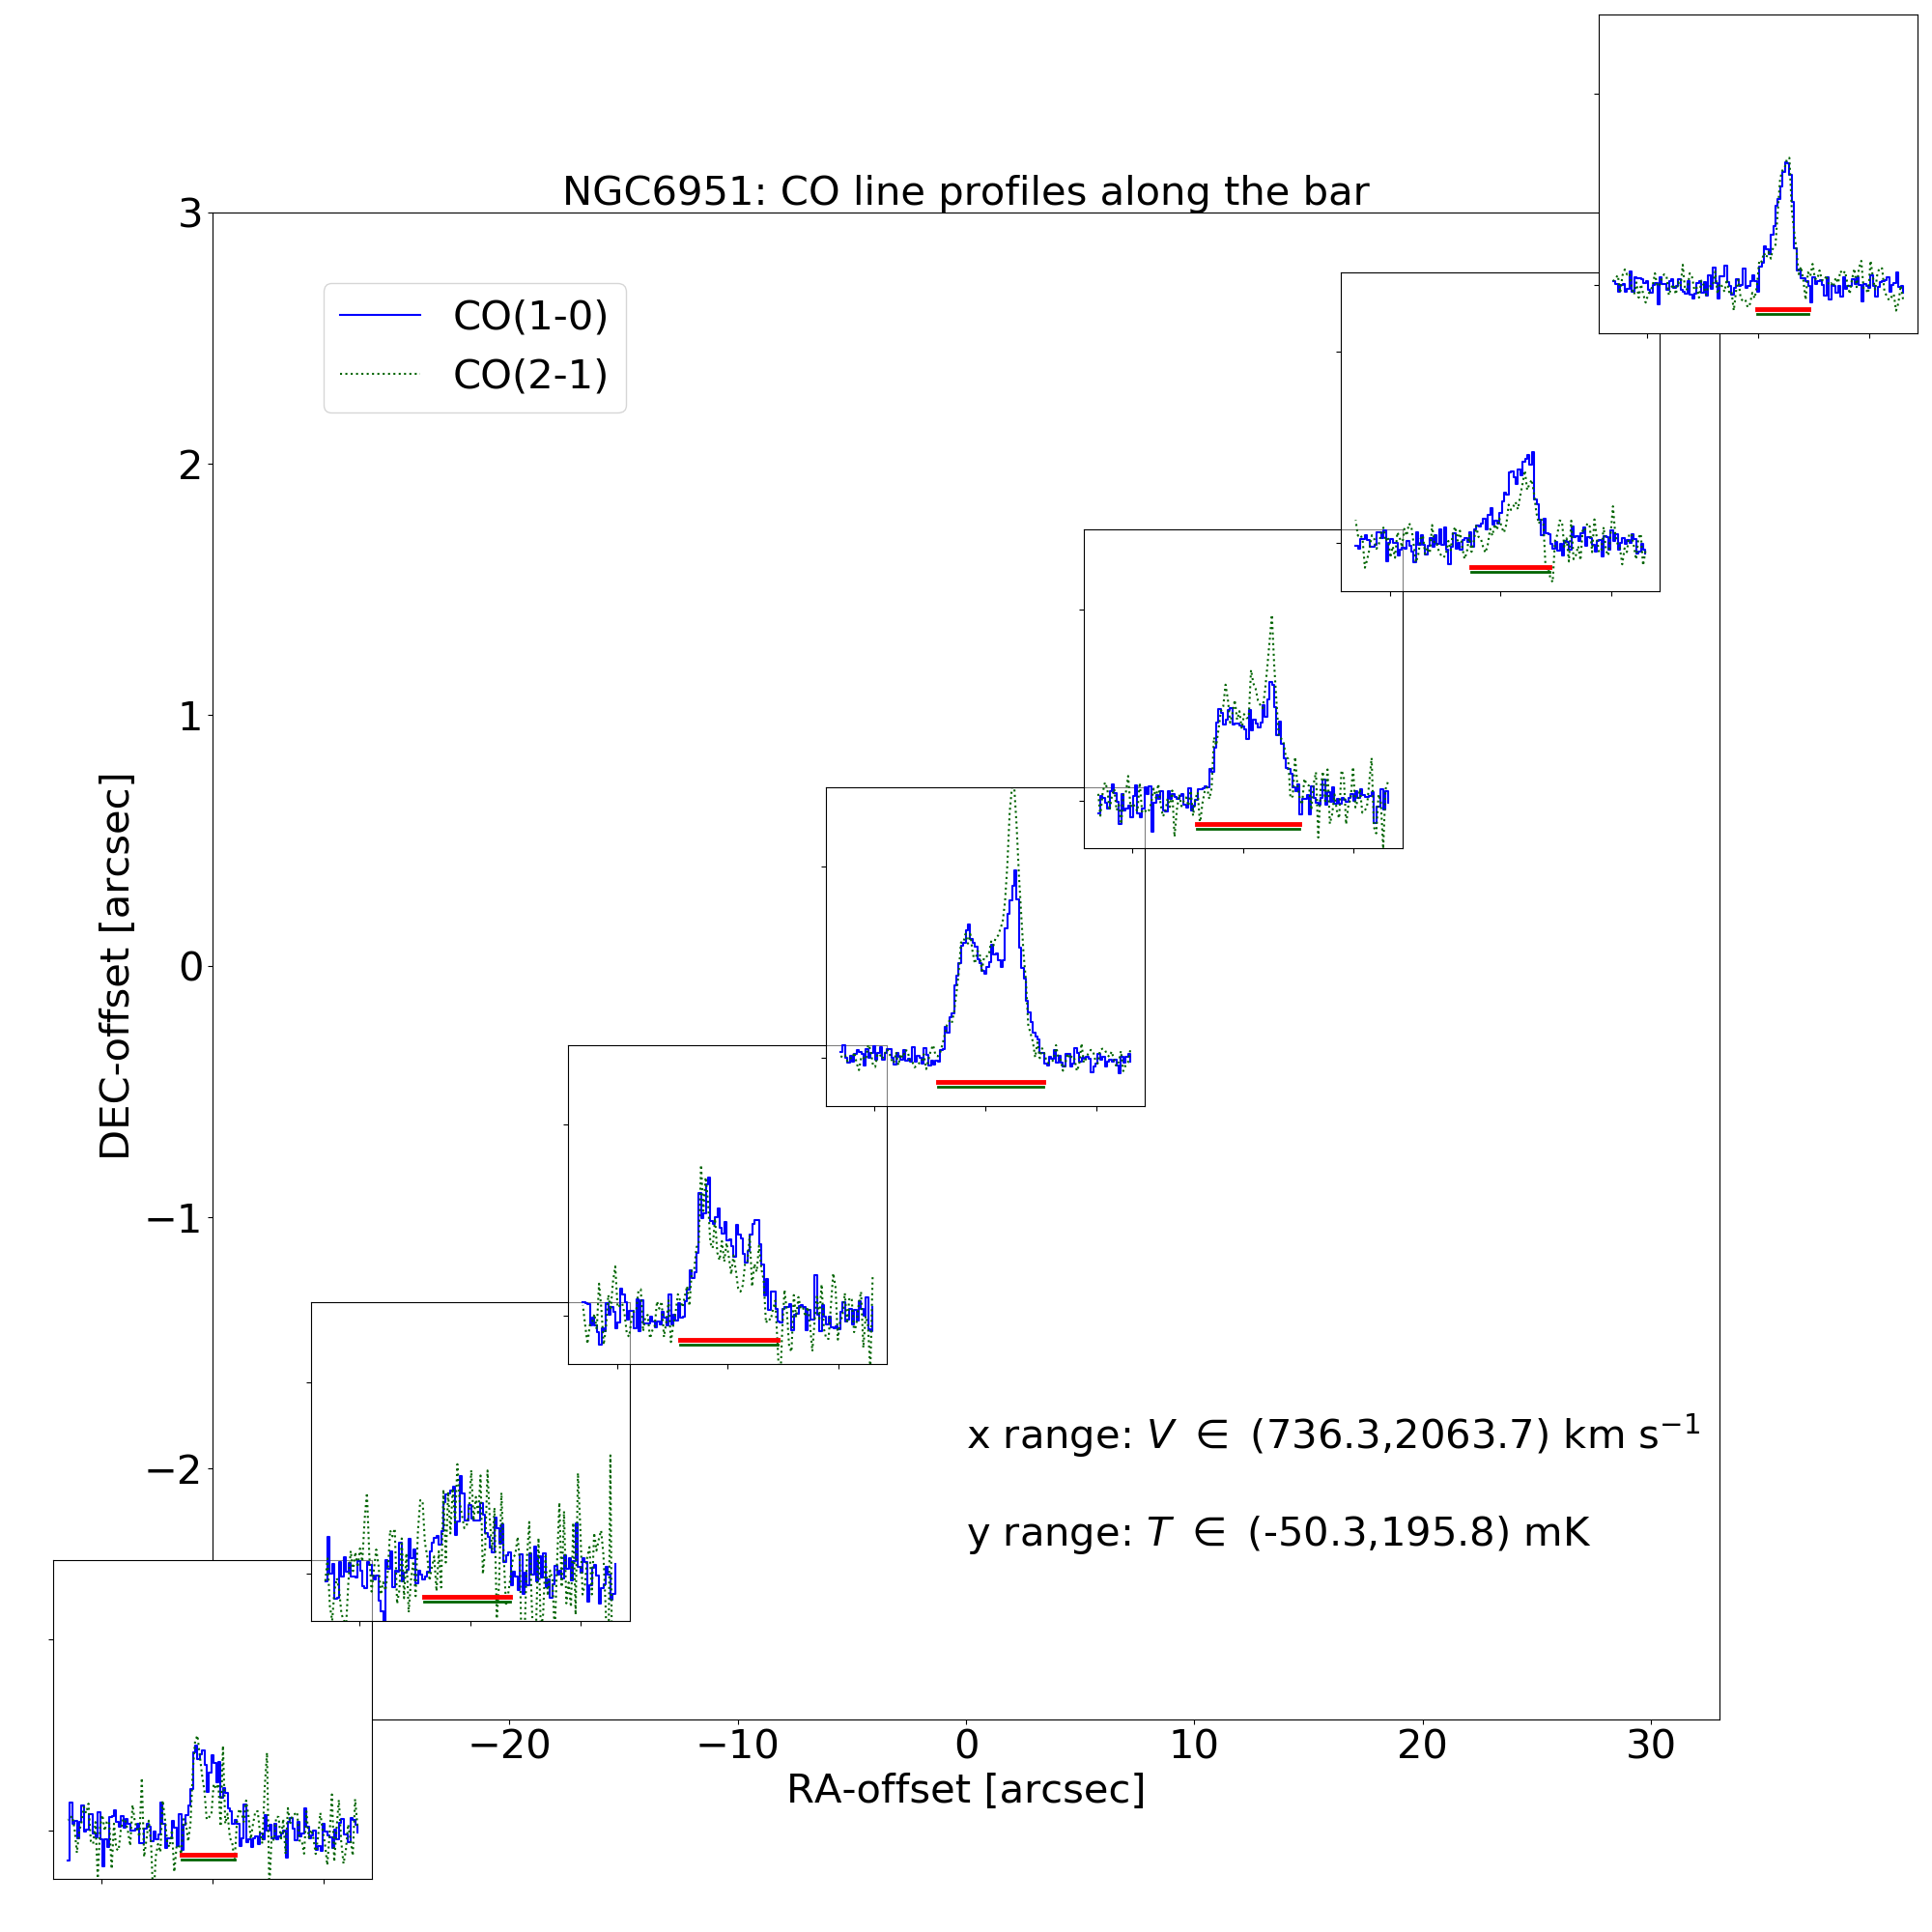
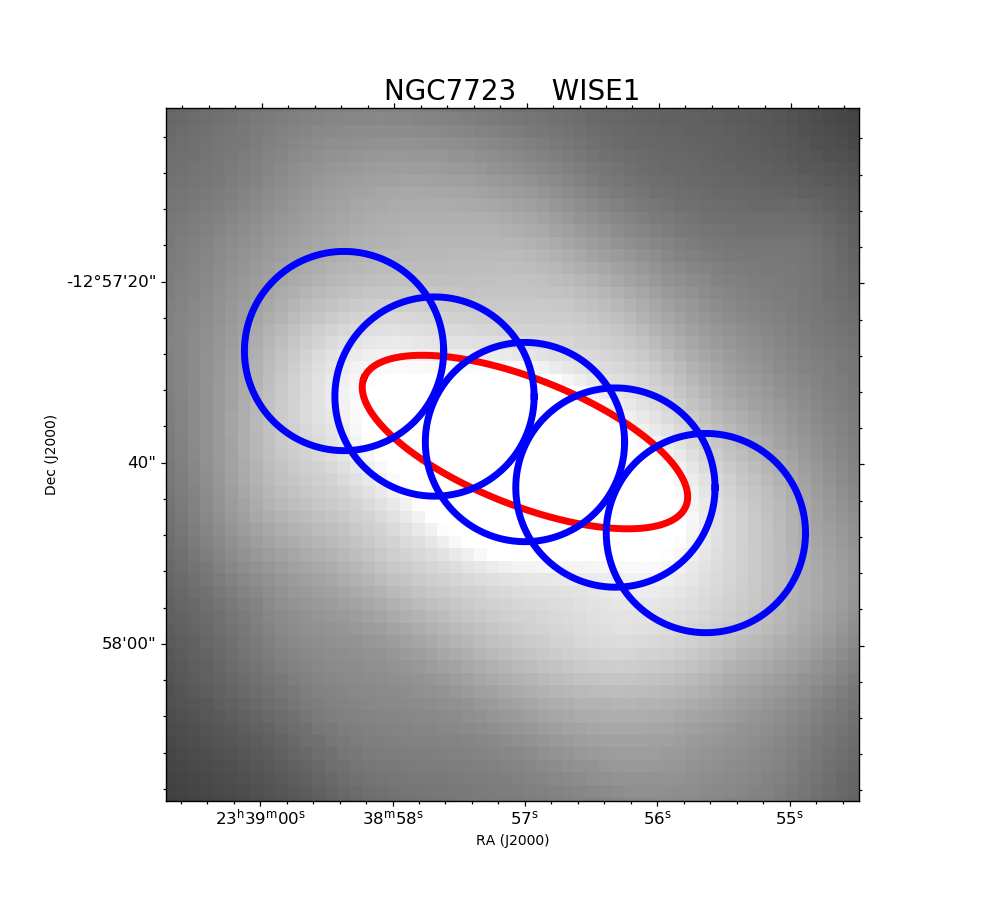
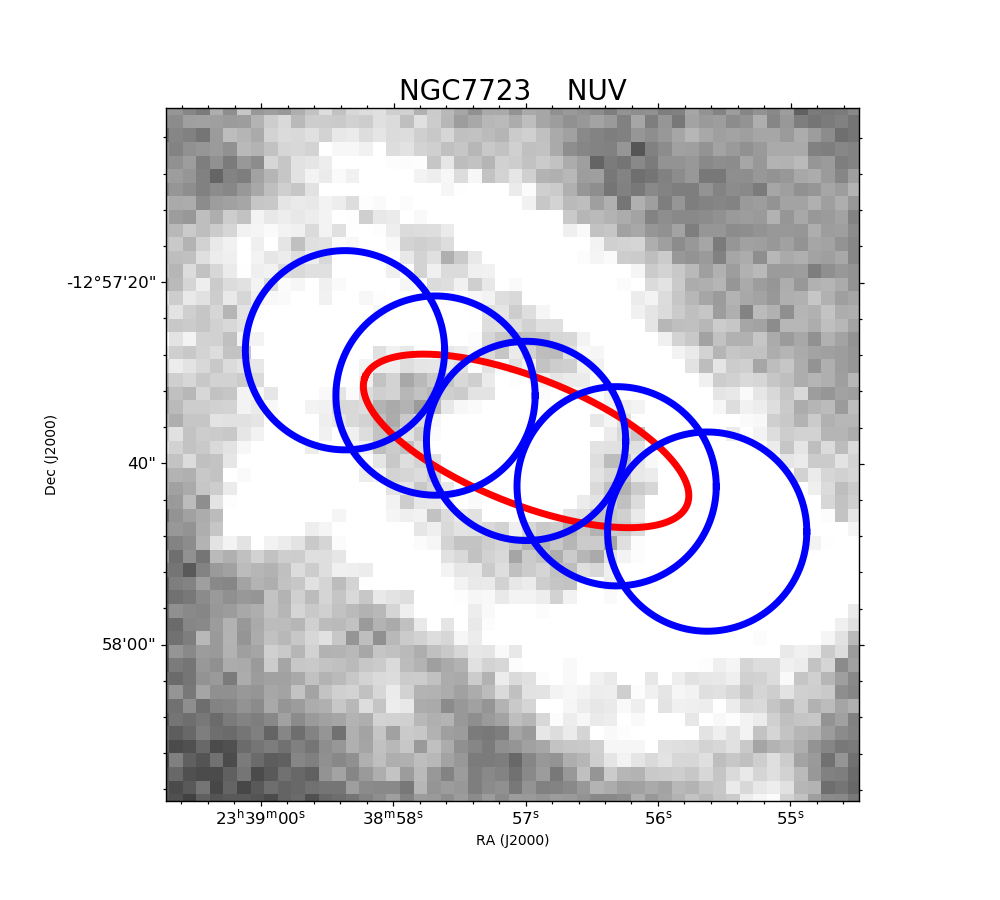
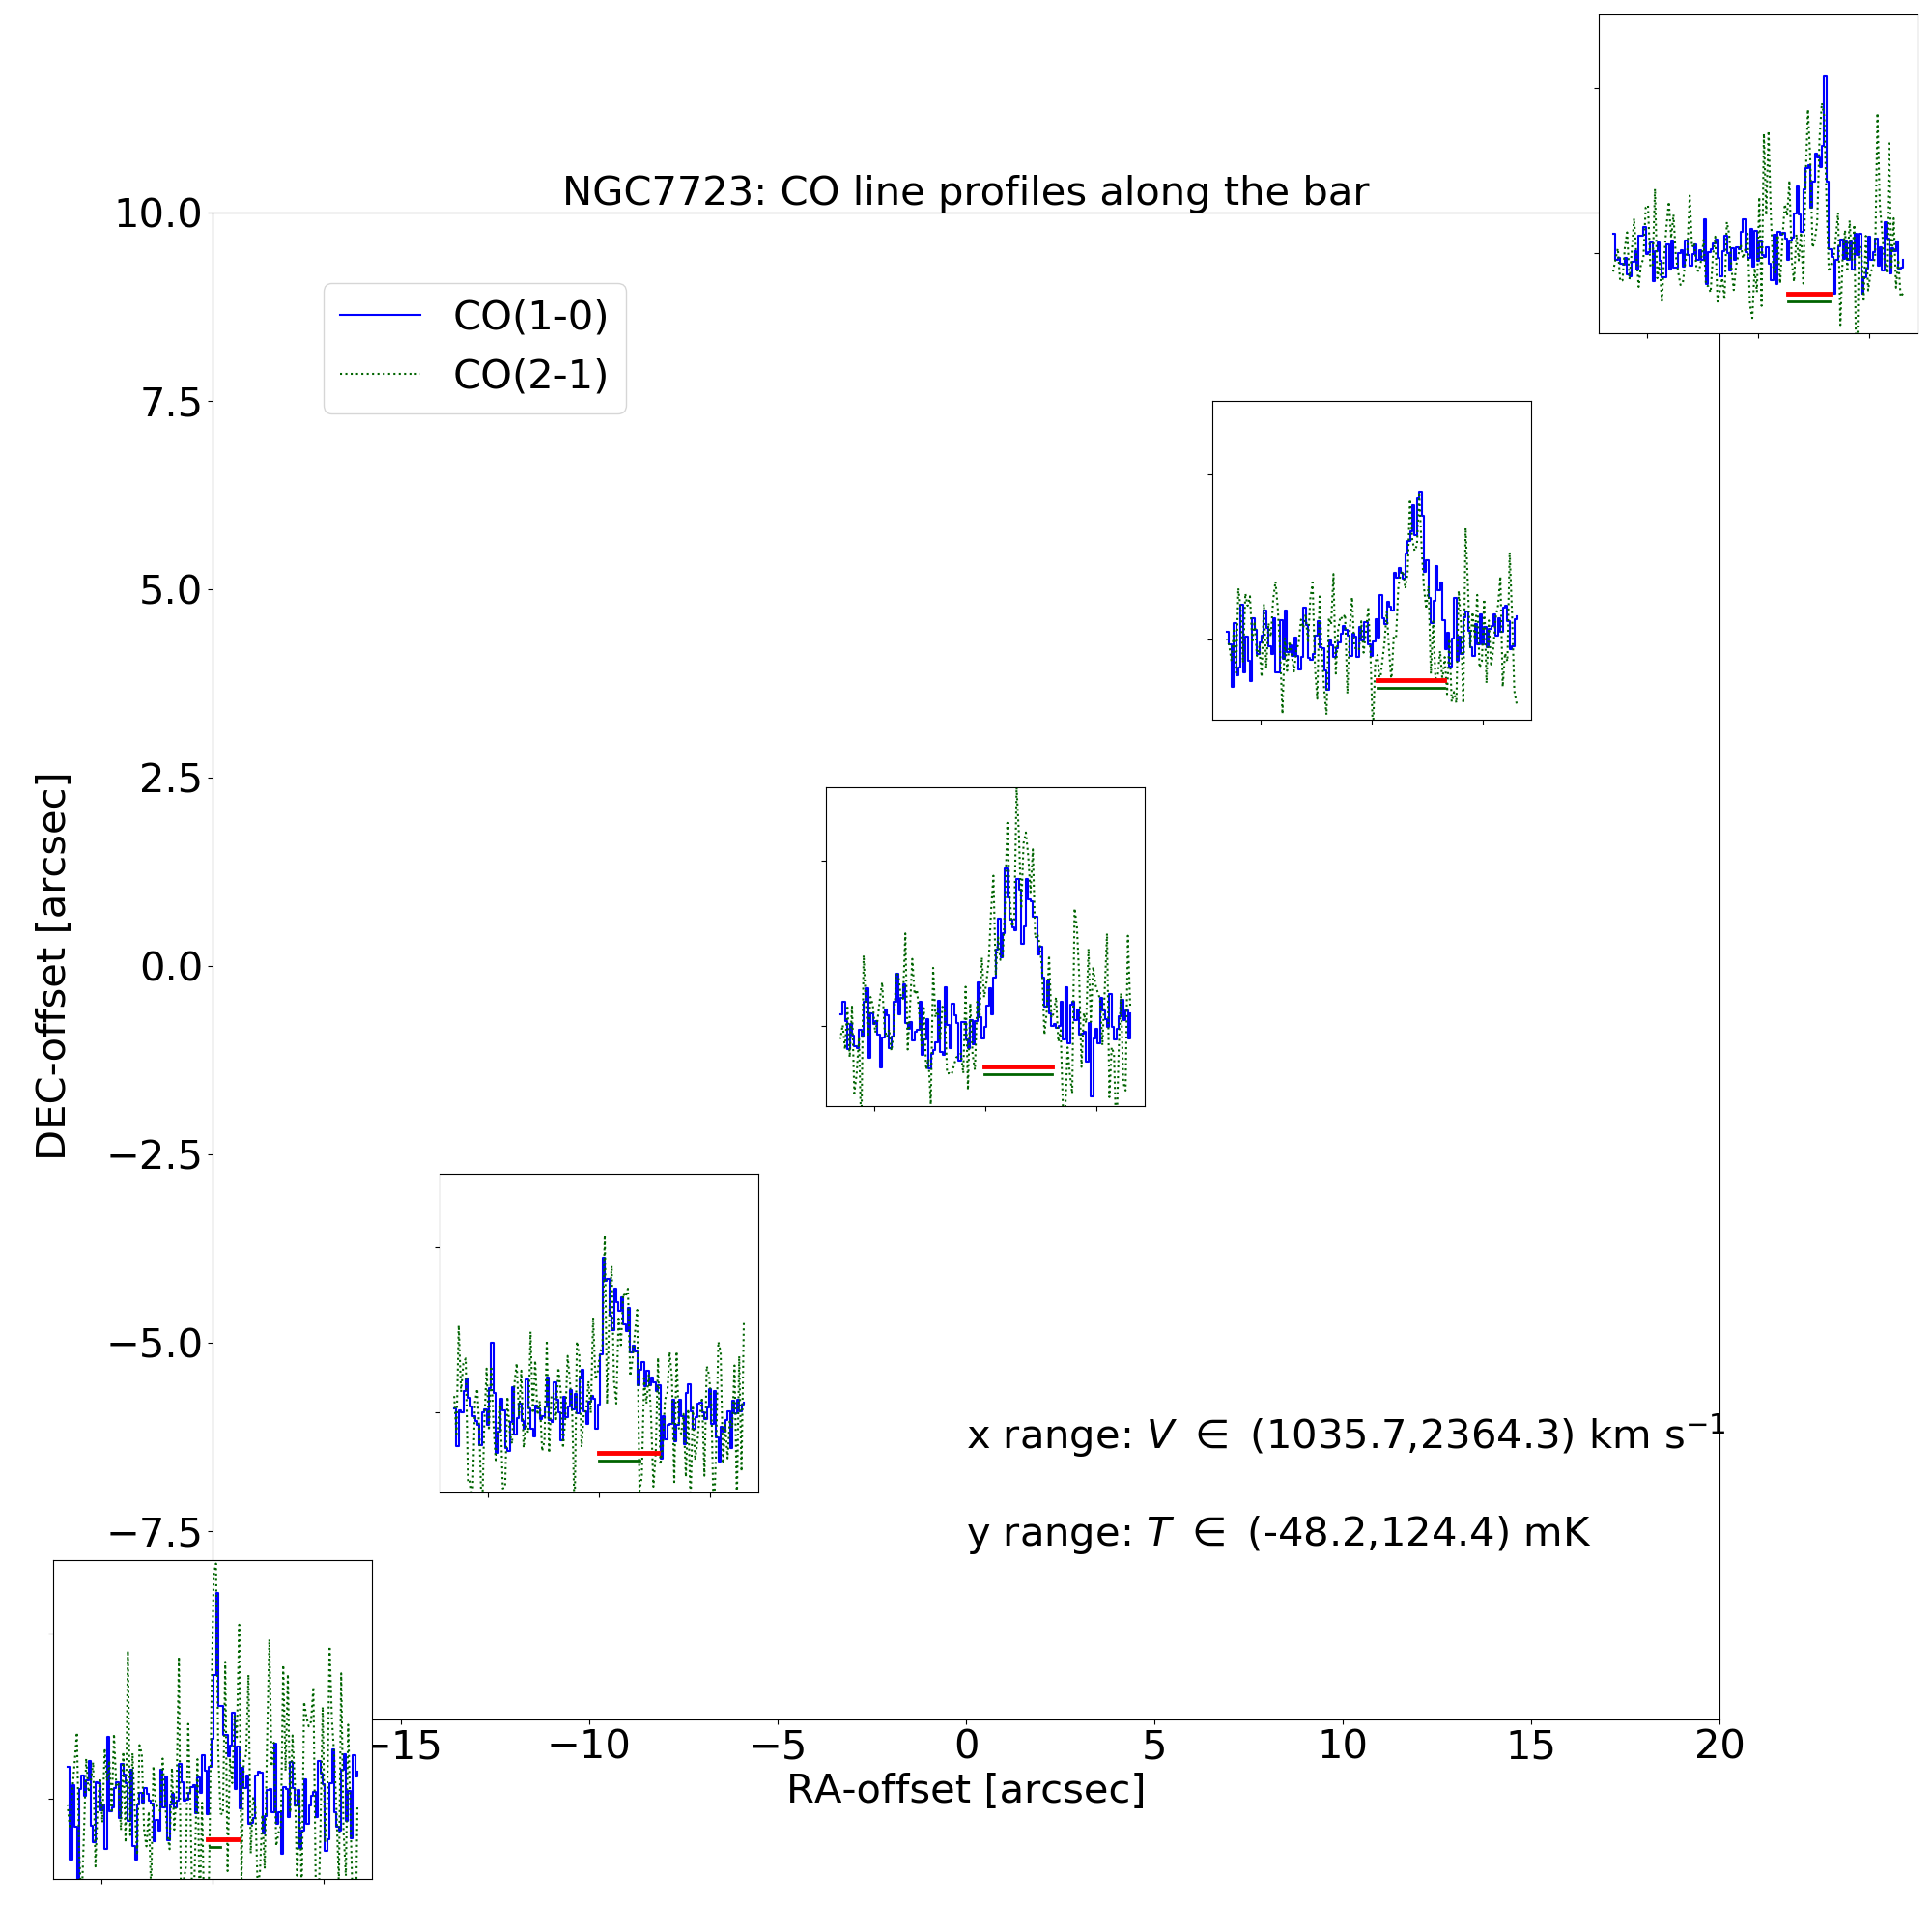
Appendix B Velocity-integrated intensities
The following data are listed in Table LABEL:CO_H2_int:
-
•
Column 1: Galaxy name;
-
•
Column 2: Right ascension of centre of the IRAM-30m pointing (in degrees);
-
•
Column 3: Declination of centre of the IRAM-30m pointing (in degrees);
-
•
Column 4: Velocity-integrated intensity (in K km s-1) and uncertainty on spectrum integration;
-
•
Column 5: Root mean square (rms) noise (in mK) associated with each CO(1-0) spectrum at a velocity resolution of km s-1;
-
•
Column 6: Zero-level velocity width of the CO(1-0) line (in km s-1) of each spectrum ();
-
•
Column 7: Velocity-integrated intensity (in K km s-1) and its error;
-
•
Column 8: Root mean square (rms) noise (in mK) associated with each CO(2-1) spectrum at a velocity resolution of km s-1;
-
•
Column 9: Mass of molecular gas (in ) and its error (Eq. 7);
-
•
Column 10: Surface density of molecular gas mass (in pc-2) and its error (Eq. 8).
| Galaxy | RA | DEC | rmsCO(1-0) | rmsCO(2-1) | |||||
| (∘) | (∘) | (K km s-1) | (mK) | (km s-1) | (K km s-1) | (mK) | () | ( pc-2) | |
| (1) | (2) | (3) | (4) | (5) | (6) | (7) | (8) | (9) | (10) |
| NGC3504 | 165.79059 | 27.98028 | 10.030.59 | 11.34 | 260 | 8.770.83 | 15.92 | 8.321.25 | 42.581.84 |
| 165.79248 | 27.97750 | 26.110.49 | 9.06 | 283 | 26.620.77 | 14.10 | 8.741.73 | 110.811.54 | |
| 165.79436 | 27.97500 | 55.880.58 | 10.43 | 293 | 107.100.68 | 12.32 | 9.071.99 | 237.181.80 | |
| 165.79625 | 27.97222 | 42.300.53 | 9.41 | 300 | 52.530.68 | 12.22 | 8.951.91 | 179.511.64 | |
| 165.79814 | 27.96944 | 12.970.52 | 9.54 | 281 | 6.570.76 | 14.02 | 8.431.42 | 55.061.61 | |
| 165.80002 | 27.96694 | 5.700.32 | 9.54 | 105 | 10.170.85 | 25.66 | 8.081.28 | 24.200.99 | |
| 165.80191 | 27.96417 | 4.280.37 | 9.23 | 155 | 4.820.52 | 12.92 | 7.951.10 | 18.151.16 | |
| NGC4123 | 182.03407 | 2.88211 | 2.910.32 | 9.86 | 95 | 2.960.49 | 15.46 | 7.711.00 | 8.650.70 |
| 182.03685 | 2.88128 | 2.980.30 | 11.85 | 114 | ¡ 3.23 | 23.52 | 7.721.04 | 8.870.66 | |
| 182.03990 | 2.88044 | 4.490.38 | 7.95 | 144 | 3.570.48 | 12.34 | 7.901.10 | 13.360.84 | |
| 182.04269 | 2.87961 | 9.830.50 | 8.83 | 226 | 13.080.92 | 18.91 | 8.241.32 | 29.221.09 | |
| 182.04575 | 2.87878 | 14.230.43 | 10.21 | 230 | 18.701.35 | 27.63 | 8.401.54 | 42.310.93 | |
| 182.04881 | 2.87794 | 10.740.48 | 8.77 | 241 | 7.341.12 | 22.23 | 8.271.37 | 31.941.04 | |
| 182.05159 | 2.87711 | 4.940.38 | 9.87 | 175 | 2.860.70 | 16.41 | 7.941.15 | 14.700.83 | |
| 182.05466 | 2.87628 | 3.200.31 | 10.27 | 146 | ¡ 2.89 | 21.05 | 7.751.05 | 9.530.68 | |
| 182.05743 | 2.87544 | 2.260.41 | 8.71 | 115 | 2.930.60 | 17.42 | 7.600.81 | 6.730.90 | |
| 182.06049 | 2.87461 | 2.010.29 | 9.51 | 80 | ¡ 2.24 | 16.31 | 7.550.91 | 5.990.62 | |
| NGC4394 | 186.47528 | 18.22185 | 1.860.16 | 4.54 | 92 | ¡ 0.75 | 5.45 | 7.381.11 | 6.990.44 |
| 186.47733 | 18.21935 | 1.270.17 | 5.90 | 79 | ¡ 1.68 | 12.27 | 7.220.93 | 4.770.47 | |
| 186.47937 | 18.21685 | 1.960.22 | 4.33 | 191 | ¡ 0.87 | 6.33 | 7.401.00 | 7.350.60 | |
| 186.48141 | 18.21435 | 2.050.34 | 5.09 | 174 | ¡ 1.57 | 11.48 | 7.430.84 | 7.710.95 | |
| 186.48347 | 18.21185 | 1.910.19 | 5.96 | 189 | ¡ 1.97 | 14.35 | 7.391.04 | 7.170.53 | |
| 186.48552 | 18.20935 | 1.320.20 | 4.88 | 114 | ¡ 1.02 | 7.47 | 7.230.87 | 4.970.56 | |
| 186.48756 | 18.20685 | 1.900.16 | 8.09 | 120 | ¡ 2.17 | 15.82 | 7.391.11 | 7.140.44 | |
| NGC4535 | 188.58041 | 8.19330 | 10.210.58 | 9.68 | 224 | ¡ 2.85 | 20.81 | 8.151.27 | 40.081.68 |
| 188.58211 | 8.19553 | 26.850.60 | 10.99 | 281 | 23.221.38 | 25.44 | 8.571.66 | 105.351.72 | |
| 188.58463 | 8.19803 | 30.660.51 | 12.04 | 262 | 34.571.83 | 34.91 | 8.631.79 | 120.341.46 | |
| 188.58659 | 8.19997 | 19.380.60 | 11.73 | 249 | 14.951.77 | 34.75 | 8.431.52 | 76.041.73 | |
| 188.58884 | 8.20275 | 7.840.48 | 11.36 | 169 | 6.160.76 | 18.11 | 8.031.24 | 30.781.38 | |
| 188.59052 | 8.20469 | 9.570.56 | 12.22 | 204 | 7.411.18 | 25.59 | 8.121.25 | 37.561.63 | |
| NGC4548 | 188.84856 | 14.49091 | 5.240.31 | 9.89 | 154 | 3.810.83 | 20.63 | 7.751.26 | 17.700.76 |
| 188.85143 | 14.49230 | 3.280.30 | 7.53 | 146 | 1.850.41 | 10.41 | 7.551.08 | 11.080.74 | |
| 188.85429 | 14.49369 | 4.890.41 | 6.43 | 356 | ¡ 1.83 | 13.37 | 7.721.11 | 16.521.03 | |
| 188.85716 | 14.49508 | 5.970.35 | 8.14 | 323 | 5.560.87 | 14.98 | 7.811.25 | 20.190.88 | |
| 188.86003 | 14.49647 | 9.400.42 | 7.64 | 360 | 13.011.14 | 18.66 | 8.011.37 | 31.771.05 | |
| 188.86290 | 14.49786 | 5.170.46 | 7.59 | 308 | ¡ 2.52 | 18.35 | 7.751.09 | 17.491.15 | |
| 188.86577 | 14.49925 | 3.300.29 | 6.78 | 190 | 2.120.46 | 10.30 | 7.551.10 | 11.150.71 | |
| 188.86864 | 14.50064 | 2.880.31 | 6.06 | 161 | 2.120.46 | 11.17 | 7.501.01 | 9.750.77 | |
| 188.87151 | 14.50202 | 3.420.41 | 6.87 | 166 | 2.140.43 | 10.40 | 7.570.97 | 11.561.02 | |
| NGC4593 | 189.90707 | -5.34977 | ¡ 0.93 | 8.52 | 600 | ¡ 1.68 | 12.23 | ¡ 7.680.44 | ¡ 3.361.43 |
| 189.90958 | -5.34783 | 2.530.59 | 7.19 | 283 | ¡ 1.33 | 9.70 | 8.110.72 | 9.201.58 | |
| 189.91209 | -5.34616 | 7.110.47 | 7.87 | 424 | 5.450.76 | 11.46 | 8.561.21 | 25.811.26 | |
| 189.91460 | -5.34421 | 10.490.53 | 6.75 | 405 | 20.150.67 | 10.23 | 8.731.32 | 38.101.42 | |
| 189.91711 | -5.34227 | 7.140.53 | 10.88 | 433 | ¡ 2.55 | 18.60 | 8.561.16 | 25.921.41 | |
| 189.91962 | -5.34060 | ¡ 0.99 | 7.08 | 183 | ¡ 1.22 | 8.87 | ¡ 7.700.62 | ¡ 3.580.84 | |
| 189.92213 | -5.33866 | ¡ 1.17 | 8.17 | 118 | ¡ 1.22 | 8.91 | ¡ 7.780.69 | ¡ 4.250.80 | |
| NGC5383 | 209.25691 | 41.85528 | 3.610.46 | 10.69 | 147 | 2.340.39 | 10.01 | 8.350.94 | 12.901.22 |
| 209.25989 | 41.85305 | 6.620.51 | 10.40 | 192 | 2.680.43 | 9.64 | 8.611.14 | 23.701.35 | |
| 209.26324 | 41.85083 | 14.920.60 | 9.51 | 322 | 7.830.80 | 13.77 | 8.971.41 | 53.391.57 | |
| 209.26622 | 41.84861 | 32.240.70 | 11.48 | 347 | 34.170.73 | 12.19 | 9.301.67 | 115.361.83 | |
| 209.26958 | 41.84639 | 31.960.65 | 11.86 | 369 | 33.931.04 | 16.79 | 9.301.70 | 114.341.72 | |
| 209.27293 | 41.84417 | 23.750.67 | 11.46 | 373 | 7.942.76 | 44.22 | 9.171.56 | 84.991.78 | |
| 209.27592 | 41.84195 | 6.380.58 | 10.31 | 247 | ¡ 2.49 | 18.18 | 8.601.08 | 22.811.53 | |
| 209.27928 | 41.83972 | 7.170.46 | 11.58 | 223 | 7.490.68 | 14.08 | 8.651.22 | 25.641.21 | |
| 209.28226 | 41.83750 | 3.600.45 | 10.52 | 180 | 2.630.39 | 8.94 | 8.350.95 | 12.871.19 | |
| 209.28561 | 41.83528 | ¡ 1.47 | 10.81 | 188 | ¡ 2.03 | 14.78 | ¡ 7.960.61 | ¡ 5.251.25 | |
| NGC5850 | 226.76862 | 1.55108 | 1.490.29 | 7.45 | 102 | 1.520.25 | 7.52 | 7.540.79 | 5.250.74 |
| 226.77139 | 1.54969 | 1.450.29 | 7.88 | 93 | ¡ 0.76 | 5.55 | 7.530.78 | 5.110.74 | |
| 226.77417 | 1.54830 | 1.810.25 | 6.95 | 194 | ¡ 0.84 | 6.15 | 7.620.92 | 6.390.64 | |
| 226.77696 | 1.54691 | 1.660.25 | 5.51 | 125 | 0.970.24 | 6.63 | 7.580.88 | 5.840.65 | |
| 226.77974 | 1.54552 | 6.190.40 | 9.18 | 247 | 6.130.44 | 8.69 | 8.161.22 | 21.811.04 | |
| 226.78252 | 1.54413 | 8.890.41 | 8.78 | 294 | 11.660.52 | 9.44 | 8.311.35 | 31.301.07 | |
| 226.78529 | 1.54274 | 4.510.37 | 7.96 | 212 | 3.760.73 | 15.43 | 8.021.12 | 15.890.97 | |
| 226.78807 | 1.54136 | 1.020.24 | 6.44 | 133 | 0.910.37 | 9.82 | 7.370.72 | 3.590.62 | |
| 226.79085 | 1.53997 | 0.740.22 | 6.73 | 98 | ¡ 1.40 | 10.18 | 7.230.65 | 2.590.56 | |
| 226.79362 | 1.53858 | 2.800.22 | 6.87 | 98 | ¡ 2.77 | 20.18 | 7.811.14 | 9.880.57 | |
| 226.79640 | 1.53719 | 2.370.20 | 6.39 | 98 | ¡ 1.59 | 11.57 | 7.741.10 | 8.360.53 | |
| NGC5921 | 230.48247 | 5.06178 | 13.620.90 | 12.00 | 321 | ¡ 2.28 | 16.63 | 8.381.21 | 49.462.41 |
| 230.48331 | 5.06483 | 3.140.31 | 7.90 | 111 | 2.770.33 | 9.55 | 7.741.05 | 11.380.82 | |
| 230.48415 | 5.06761 | 3.650.82 | 9.51 | 147 | 2.150.44 | 11.23 | 7.810.74 | 13.262.19 | |
| 230.48526 | 5.07067 | 6.510.56 | 15.59 | 155 | ¡ 2.10 | 15.30 | 8.061.10 | 23.651.50 | |
| 230.48637 | 5.07372 | 5.170.41 | 9.02 | 175 | 3.060.46 | 10.78 | 7.961.14 | 18.771.09 | |
| 230.48721 | 5.07650 | 4.440.24 | 20.96 | 89 | 4.940.64 | 21.03 | 7.891.29 | 16.130.64 | |
| 230.48805 | 5.07956 | 2.730.37 | 13.97 | 93 | ¡ 2.01 | 14.65 | 7.680.92 | 9.911.00 | |
| NGC6217 | 248.14055 | 78.20620 | 7.790.76 | 15.09 | 222 | 6.681.47 | 30.50 | 8.341.05 | 31.102.23 |
| 248.14734 | 78.20342 | 9.540.79 | 9.14 | 199 | 6.580.75 | 16.44 | 8.431.12 | 38.072.31 | |
| 248.15413 | 78.20092 | 22.270.76 | 16.06 | 201 | 22.261.60 | 34.89 | 8.791.48 | 88.902.24 | |
| 248.16228 | 78.19814 | 19.650.65 | 15.74 | 208 | 17.711.77 | 37.89 | 8.741.49 | 78.451.91 | |
| 248.17043 | 78.19537 | 15.400.68 | 17.27 | 170 | 13.601.43 | 34.00 | 8.631.38 | 61.491.99 | |
| 248.17722 | 78.19286 | 6.920.45 | 16.65 | 227 | 5.121.48 | 30.33 | 8.291.22 | 27.641.31 | |
| 248.18401 | 78.19009 | 8.770.68 | 13.93 | 197 | 6.261.23 | 27.05 | 8.391.14 | 35.022.01 | |
| NGC6951 | 309.28613 | 66.10472 | 11.790.31 | 12.95 | 242 | 8.021.16 | 23.13 | 8.431.59 | 39.650.77 |
| 309.29367 | 66.10500 | 18.800.63 | 17.12 | 391 | 14.163.23 | 50.51 | 8.631.49 | 63.211.56 | |
| 309.30121 | 66.10528 | 30.440.55 | 12.34 | 439 | 22.991.53 | 22.52 | 8.841.75 | 102.381.36 | |
| 309.30875 | 66.10555 | 41.730.54 | 6.17 | 474 | 48.630.48 | 6.82 | 8.981.89 | 140.331.34 | |
| 309.31628 | 66.10583 | 29.690.86 | 9.88 | 464 | 34.441.23 | 17.64 | 8.831.55 | 99.862.12 | |
| 309.32382 | 66.10611 | 15.001.04 | 8.09 | 355 | 8.350.87 | 14.28 | 8.531.19 | 50.442.58 | |
| 309.33139 | 66.10639 | 12.540.63 | 7.70 | 230 | 11.940.55 | 11.23 | 8.451.32 | 42.181.57 | |
| NGC7723 | 354.73221 | -12.96361 | 6.020.49 | 16.66 | 140 | 3.501.64 | 42.96 | 8.211.12 | 17.601.06 |
| 354.73508 | -12.96222 | 11.800.62 | 12.15 | 268 | 8.481.54 | 29.13 | 8.501.30 | 34.521.33 | |
| 354.73792 | -12.96083 | 15.370.54 | 12.87 | 305 | 19.771.58 | 27.96 | 8.621.47 | 44.971.17 | |
| 354.74075 | -12.95944 | 11.840.68 | 11.70 | 299 | 5.851.28 | 22.82 | 8.501.27 | 34.641.46 | |
| 354.74362 | -12.95806 | 7.540.73 | 9.63 | 184 | 5.151.05 | 24.04 | 8.311.05 | 22.071.57 |
Appendix C SFEs with different direct and hybrid recipes of SFRs
Here we show the relationship between star formation rate and molecular gas surface densities (Sects. 4 and 5) using a variety of hybrid (Fig. 22) and direct (Fig. 23) recipes for the calculation of SF calibrated by Leroy et al. (2019):
| (16) |
| (17) |
| (18) |
| (19) |
We take advantage of the combination of UV and infrared (IR) data, which allows us to obtain dust-corrected SFRs:
| (20) |
| (21) |
| (22) |
| (23) |
In Table 4 we indicate the slope, -intercept, and 1 forward scatter of the residuals associated with the linear fit (log space) of the KS law. For a discussion of the differences of the KS law for the different recipes, see Sects. 4 and 5 in this paper.
We also estimate from NUV and WISE 4 combined (Eq. 23) to study the KS relation (Fig. 24) as a function of total stellar mass, specific star formation rate, bulge stellar mass, and projected surface density to the third-nearest neighbour galaxy. The trends are qualitatively the same as reported in Sect. 5, where was estimated from NUV and WISE 3 (Fig. 7).
| KS | slope (m) | intercept (b) | scatter (1-) |
|---|---|---|---|
| NUV | 0.810.08 | -3.620.11 | 0.35 |
| FUV | 0.690.10 | -3.870.13 | 0.41 |
| W3 | 0.920.06 | -3.260.08 | 0.25 |
| W4 | 1.150.09 | -3.530.13 | 0.40 |
| NUV+W3 | 0.880.06 | -3.200.09 | 0.27 |
| NUV+W4 | 1.040.09 | -3.370.12 | 0.37 |
| FUV+W3 | 0.860.06 | -3.210.09 | 0.26 |
| FUV+W4 | 1.040.09 | -3.440.13 | 0.39 |
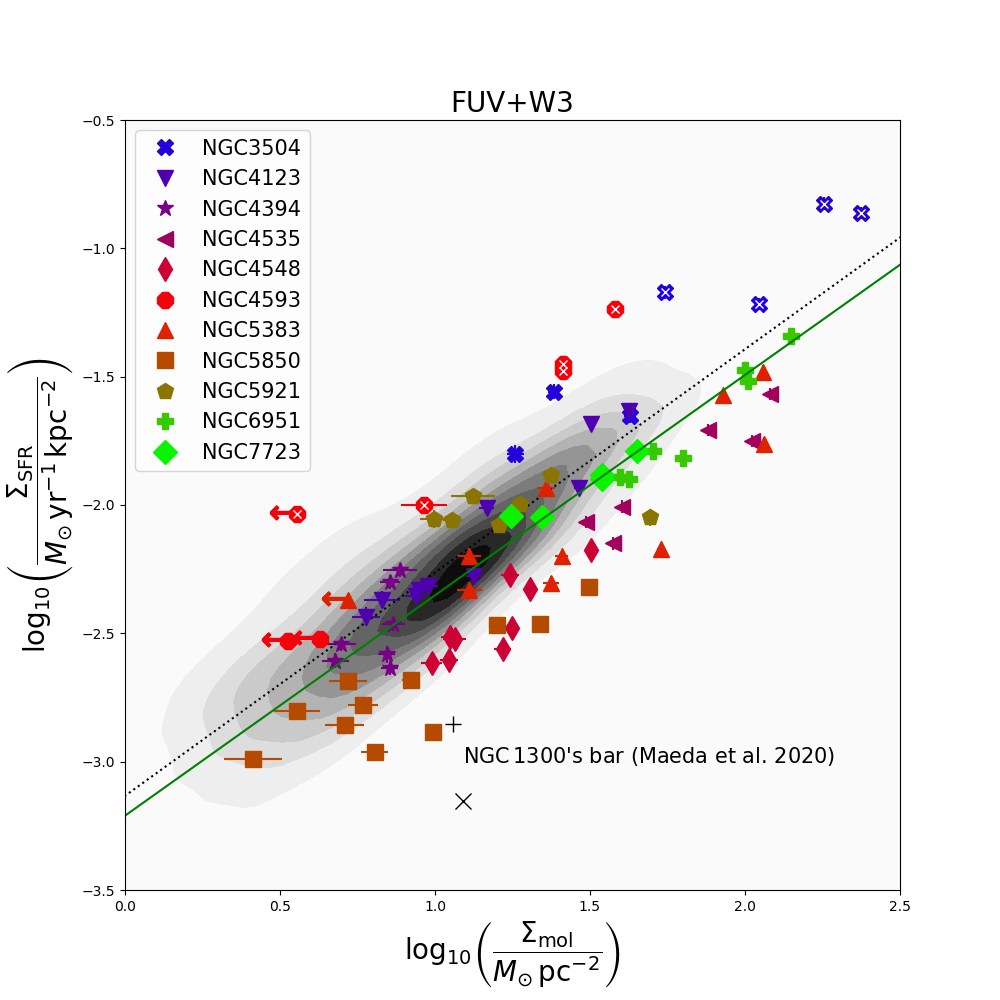
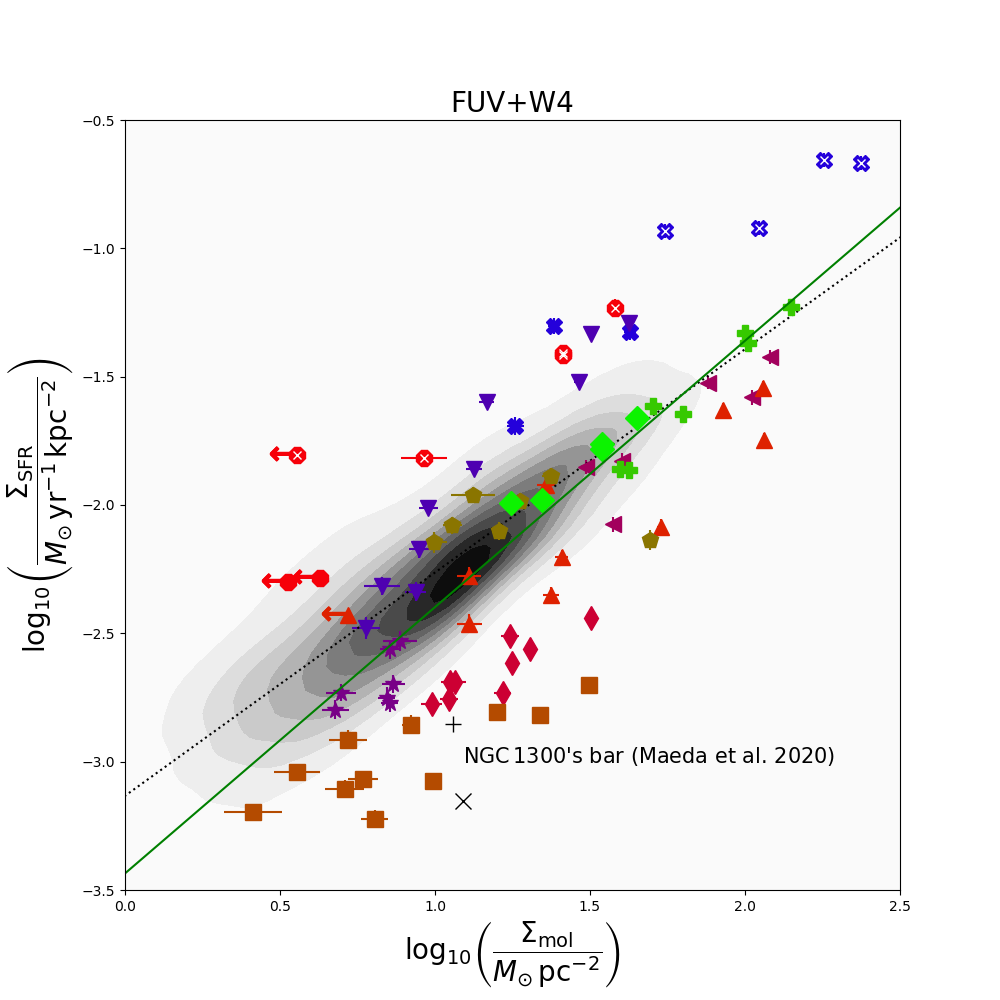
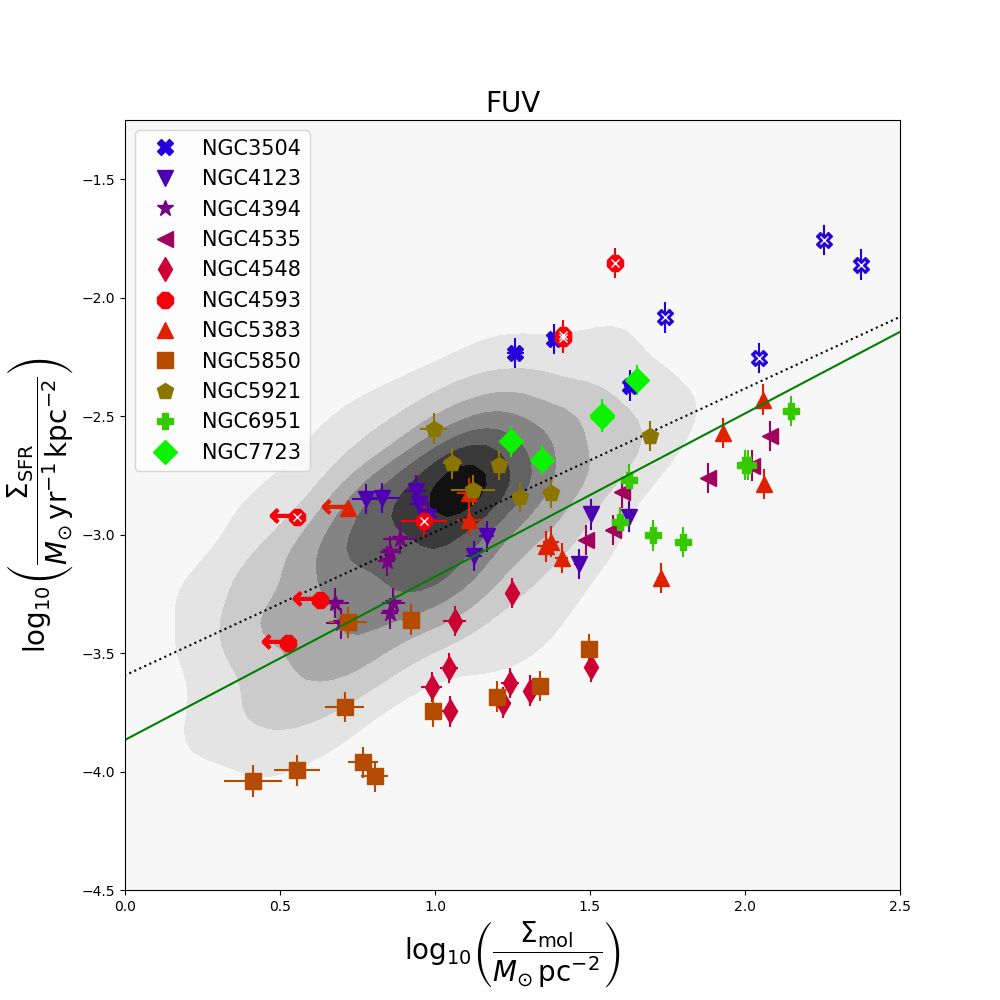
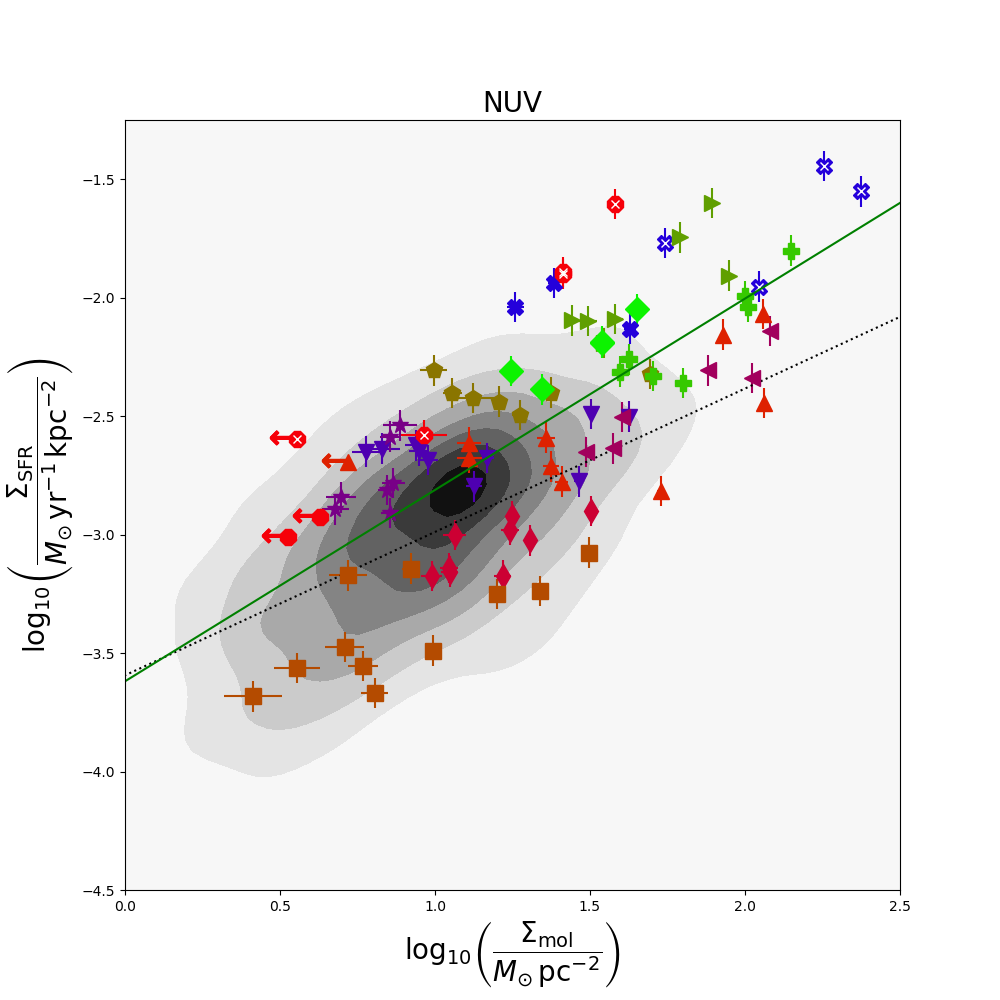
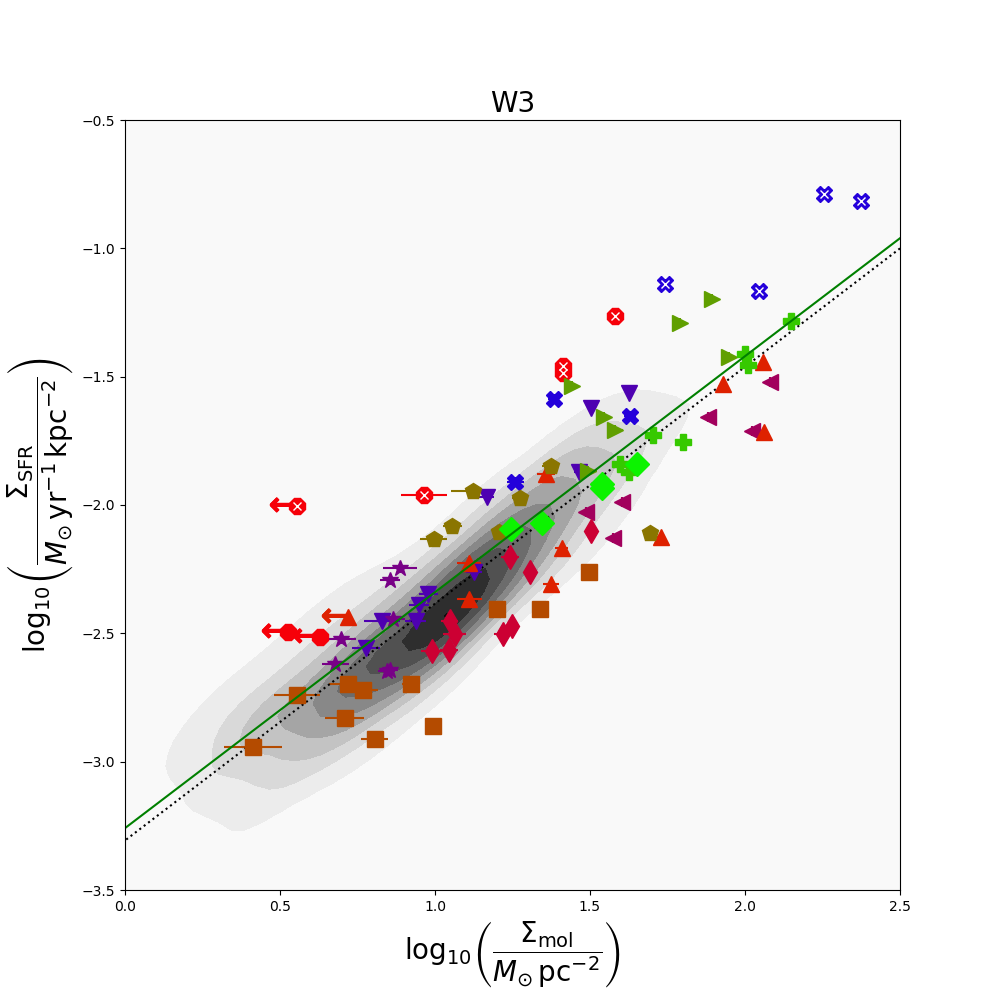
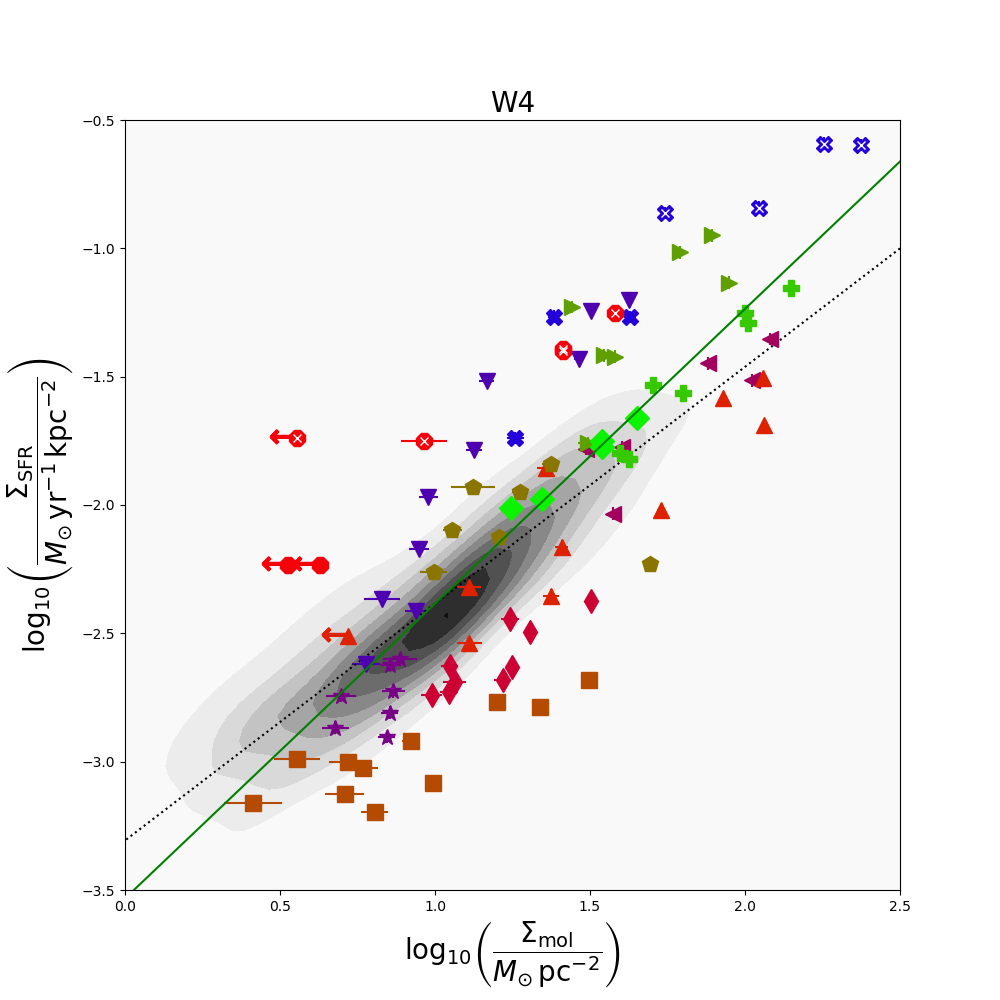
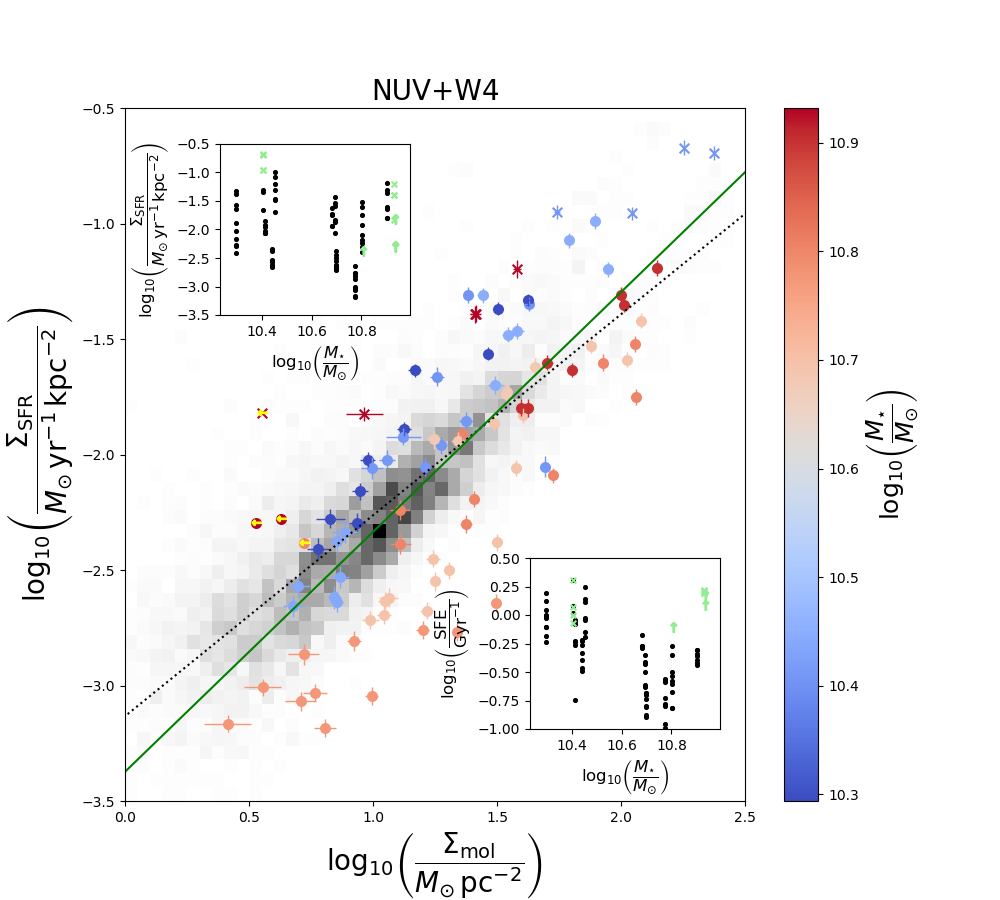
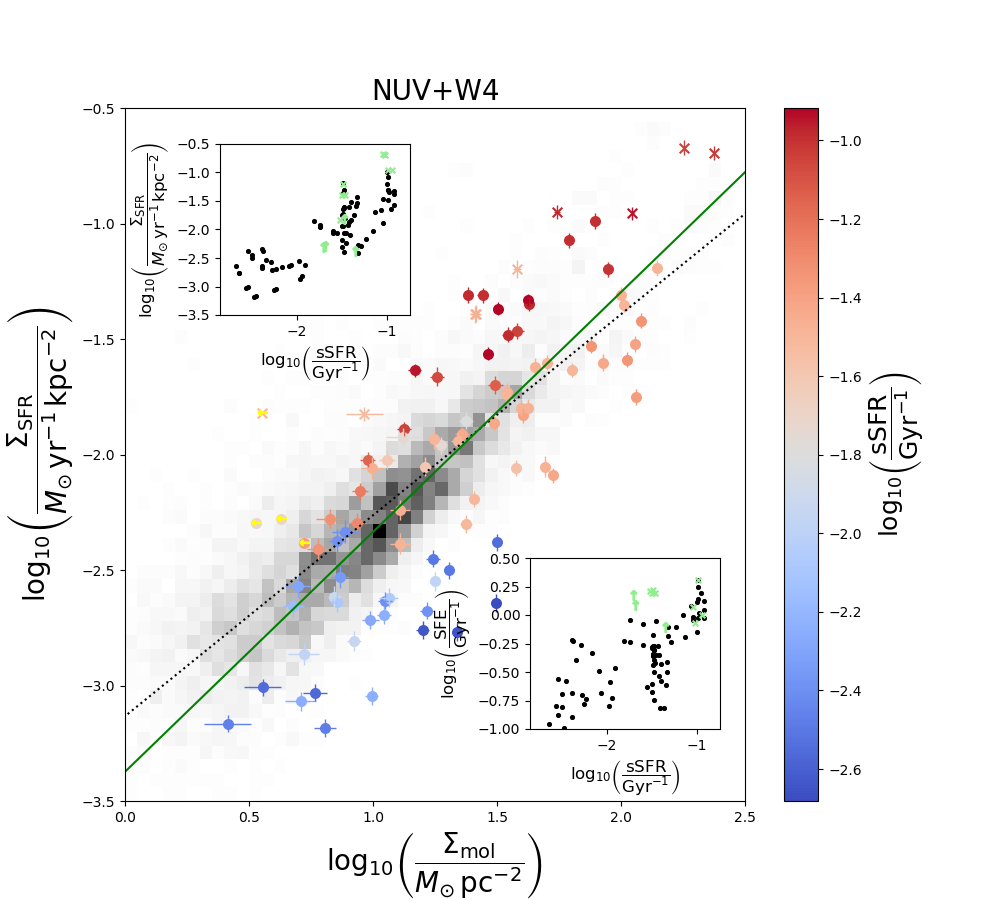
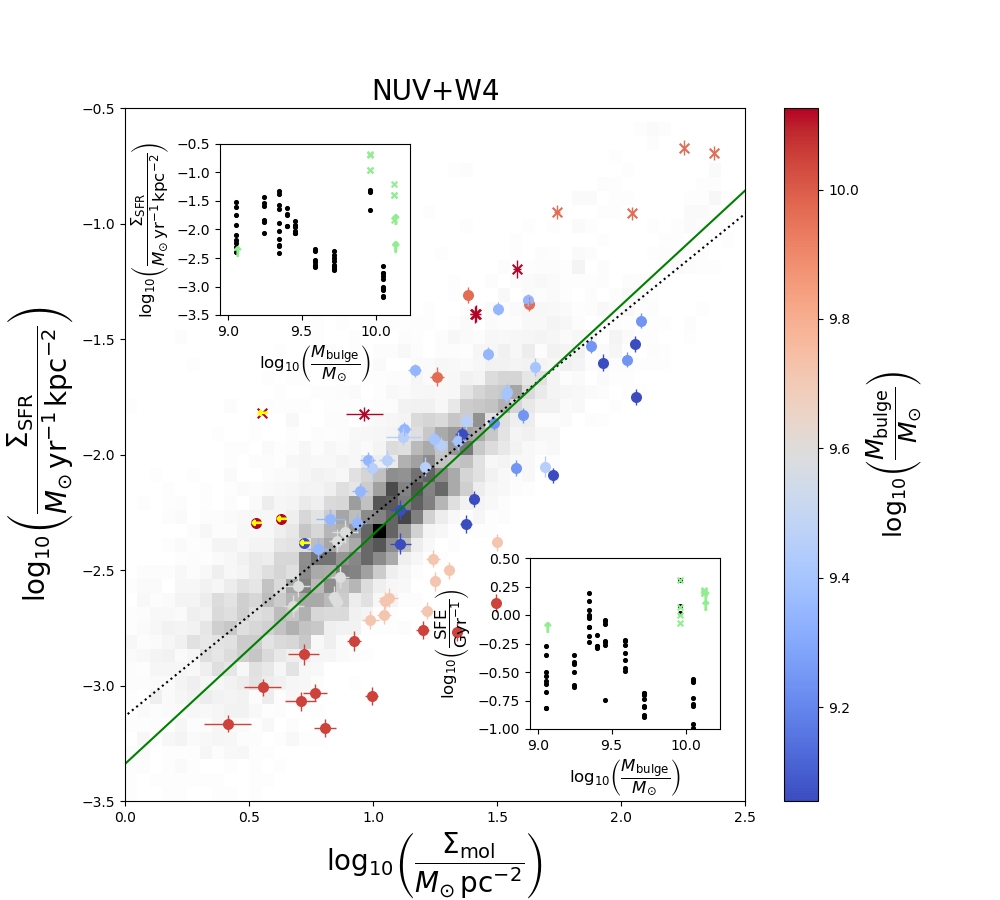
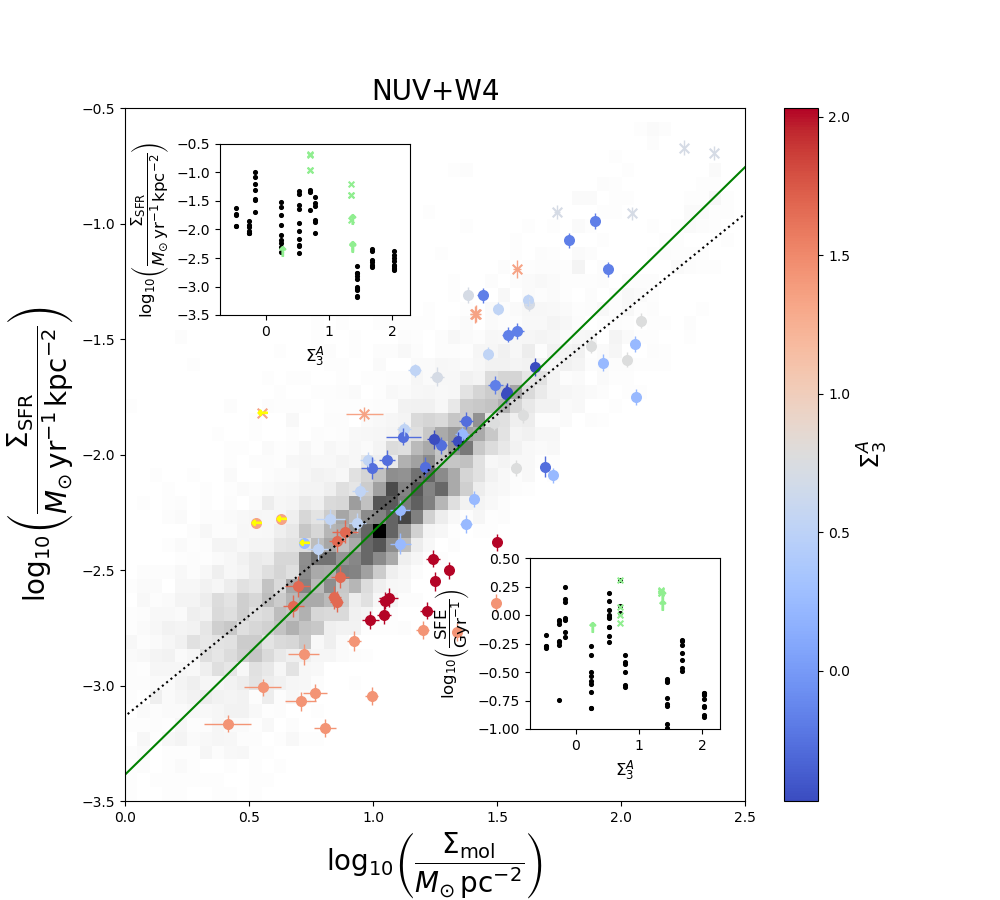
Appendix D Aperture photometry output
The following data are listed in Table LABEL:ap_phot:
-
•
Column 1: Galaxy name;
-
•
Column 2: Right ascension of centre of the IRAM-30m pointing (in degrees);
-
•
Column 3: Declination of centre of the IRAM-30m pointing (in degrees);
-
•
Column 4: Decimal logarithm of the flux within beam in the NUV images (in janskys) and its uncertainty;
-
•
Column 5: Decimal logarithm of the flux within beam in the FUV images (in janskys) and its uncertainty;
-
•
Column 6: Decimal logarithm of the flux within beam in the WISE 1 images (in janskys) and its uncertainty;
-
•
Column 7: Decimal logarithm of the flux within beam in the WISE 2 images (in janskys) and its uncertainty;
-
•
Column 8: Decimal logarithm of the flux within beam in the WISE 3 images (in janskys) and its uncertainty;
-
•
Column 9: Decimal logarithm of the flux within beam in the WISE 4 images (in janskys) and its uncertainty;
- •
-
•
Column 11: - Stellar mass surface density (in pc-2) obtained from WISE 1 images using Eq. 13, and its error.
| Galaxy | RA | DEC | log10 | log10 | log10 | log10 | log10 | log10 | log10 | log10 |
| (∘) | (∘) | (Jy) | (Jy) | (Jy) | (Jy) | (Jy) | (Jy) | ( yr-1 kpc-2) | ( pc-2) | |
| (1) | (2) | (3) | (4) | (5) | (6) | (7) | (8) | (9) | (10) | (11) |
| NGC3504 | 165.79059 | 27.98028 | -2.990.06 | -3.230.06 | -1.880.01 | -2.080.01 | -1.330.02 | -0.750.02 | -1.640.03 | 2.620.01 |
| 165.79248 | 27.97750 | -2.810.06 | -3.110.06 | -1.520.01 | -1.640.01 | -0.840.02 | -0.320.02 | -1.240.03 | 2.990.01 | |
| 165.79436 | 27.97500 | -2.410.06 | -2.710.06 | -1.180.01 | -1.260.01 | -0.490.02 | -0.080.02 | -0.870.03 | 3.330.01 | |
| 165.79625 | 27.97222 | -2.300.06 | -2.610.06 | -1.140.01 | -1.220.01 | -0.460.02 | -0.070.02 | -0.830.03 | 3.360.01 | |
| 165.79814 | 27.96944 | -2.630.06 | -2.940.06 | -1.470.01 | -1.590.01 | -0.810.02 | -0.340.02 | -1.170.03 | 3.030.01 | |
| 165.80002 | 27.96694 | -2.800.06 | -3.030.06 | -1.830.01 | -2.020.01 | -1.260.02 | -0.740.02 | -1.530.04 | 2.680.01 | |
| 165.80191 | 27.96417 | -2.900.06 | -3.090.06 | -2.110.01 | -2.310.01 | -1.580.02 | -1.220.02 | -1.750.04 | 2.400.01 | |
| NGC4123 | 182.03407 | 2.88211 | -3.330.06 | -3.510.06 | -2.360.01 | -2.600.01 | -1.970.02 | -1.740.02 | -2.320.04 | 1.990.01 |
| 182.03685 | 2.88128 | -3.350.06 | -3.570.06 | -2.270.01 | -2.510.01 | -1.910.02 | -1.490.02 | -2.290.04 | 2.080.01 | |
| 182.03990 | 2.88044 | -3.500.06 | -3.790.06 | -2.200.01 | -2.430.01 | -1.780.02 | -1.110.02 | -2.270.03 | 2.150.01 | |
| 182.04269 | 2.87961 | -3.480.06 | -3.820.06 | -1.990.01 | -2.200.01 | -1.390.02 | -0.750.02 | -1.960.03 | 2.360.01 | |
| 182.04575 | 2.87878 | -3.210.06 | -3.620.06 | -1.760.01 | -1.940.01 | -1.080.02 | -0.520.02 | -1.660.03 | 2.590.01 | |
| 182.04881 | 2.87794 | -3.200.06 | -3.610.06 | -1.800.01 | -1.990.01 | -1.140.02 | -0.570.02 | -1.700.03 | 2.550.01 | |
| 182.05159 | 2.87711 | -3.380.06 | -3.710.06 | -2.040.01 | -2.250.01 | -1.490.02 | -0.840.02 | -2.020.03 | 2.310.01 | |
| 182.05466 | 2.87628 | -3.390.06 | -3.620.06 | -2.220.01 | -2.460.01 | -1.870.02 | -1.290.02 | -2.290.04 | 2.130.01 | |
| 182.05743 | 2.87544 | -3.340.06 | -3.550.06 | -2.310.01 | -2.540.01 | -1.970.02 | -1.690.02 | -2.320.04 | 2.040.01 | |
| 182.06049 | 2.87461 | -3.350.06 | -3.550.06 | -2.440.01 | -2.650.01 | -2.070.02 | -1.940.02 | -2.380.04 | 1.920.01 | |
| NGC4394 | 186.47528 | 18.22185 | -3.620.06 | -3.910.06 | -2.160.01 | -2.420.01 | -2.260.02 | -2.330.02 | -2.510.04 | 2.300.01 |
| 186.47733 | 18.21935 | -3.700.06 | -4.090.06 | -1.940.01 | -2.200.01 | -2.240.02 | -2.290.02 | -2.530.04 | 2.510.01 | |
| 186.47937 | 18.21685 | -3.590.06 | -4.090.06 | -1.640.01 | -1.900.01 | -2.060.02 | -2.150.02 | -2.380.04 | 2.810.01 | |
| 186.48141 | 18.21435 | -3.350.06 | -3.820.06 | -1.400.01 | -1.670.01 | -1.860.02 | -2.030.02 | -2.170.04 | 3.060.01 | |
| 186.48347 | 18.21185 | -3.390.06 | -3.870.06 | -1.440.01 | -1.710.01 | -1.910.02 | -2.050.02 | -2.210.04 | 3.010.01 | |
| 186.48552 | 18.20935 | -3.650.06 | -4.180.06 | -1.730.01 | -1.990.01 | -2.140.02 | -2.170.02 | -2.450.04 | 2.720.01 | |
| 186.48756 | 18.20685 | -3.710.06 | -4.130.06 | -2.000.01 | -2.260.01 | -2.260.02 | -2.240.02 | -2.550.04 | 2.450.01 | |
| NGC4535 | 188.58041 | 8.19330 | -3.330.06 | -3.640.06 | -1.910.01 | -2.130.01 | -1.630.02 | -1.220.02 | -1.990.03 | 2.560.01 |
| 188.58211 | 8.19553 | -3.160.06 | -3.530.06 | -1.720.01 | -1.930.01 | -1.350.02 | -0.960.02 | -1.740.03 | 2.750.01 | |
| 188.58463 | 8.19803 | -2.970.06 | -3.400.06 | -1.560.01 | -1.760.01 | -1.160.02 | -0.800.02 | -1.550.03 | 2.910.01 | |
| 188.58659 | 8.19997 | -3.130.06 | -3.580.06 | -1.670.01 | -1.880.01 | -1.300.02 | -0.890.02 | -1.690.03 | 2.800.01 | |
| 188.58884 | 8.20275 | -3.480.06 | -3.840.06 | -1.910.01 | -2.150.01 | -1.660.02 | -1.230.02 | -2.060.03 | 2.560.01 | |
| 188.59052 | 8.20469 | -3.460.06 | -3.800.06 | -1.980.01 | -2.220.01 | -1.770.02 | -1.480.02 | -2.130.03 | 2.490.01 | |
| NGC4548 | 188.84856 | 14.49091 | -3.680.06 | -4.000.06 | -1.980.01 | -2.230.01 | -2.050.02 | -2.010.02 | -2.450.03 | 2.430.01 |
| 188.85143 | 14.49230 | -3.900.06 | -4.320.06 | -1.870.01 | -2.130.01 | -2.140.02 | -2.110.02 | -2.580.03 | 2.540.01 | |
| 188.85429 | 14.49369 | -3.930.06 | -4.460.06 | -1.690.01 | -1.950.01 | -2.080.02 | -2.060.02 | -2.550.03 | 2.720.01 | |
| 188.85716 | 14.49508 | -3.780.06 | -4.410.06 | -1.410.01 | -1.650.01 | -1.830.02 | -1.880.02 | -2.320.03 | 3.000.01 | |
| 188.86003 | 14.49647 | -3.660.06 | -4.310.06 | -1.240.01 | -1.480.01 | -1.680.02 | -1.760.02 | -2.170.03 | 3.170.01 | |
| 188.86290 | 14.49786 | -3.740.06 | -4.380.06 | -1.360.01 | -1.600.01 | -1.780.02 | -1.820.02 | -2.270.03 | 3.050.01 | |
| 188.86577 | 14.49925 | -3.920.06 | -4.500.06 | -1.650.01 | -1.900.01 | -2.020.02 | -2.010.02 | -2.500.03 | 2.760.01 | |
| 188.86864 | 14.50064 | -3.940.06 | -4.400.06 | -1.850.01 | -2.110.01 | -2.140.02 | -2.120.02 | -2.600.03 | 2.560.01 | |
| 188.87151 | 14.50202 | -3.760.06 | -4.120.06 | -1.960.01 | -2.220.01 | -2.070.02 | -2.070.02 | -2.500.03 | 2.440.01 | |
| NGC4593 | 189.90707 | -5.34977 | -3.800.06 | -4.240.06 | -2.020.01 | -2.250.01 | -2.100.02 | -1.640.02 | -2.500.03 | 2.420.01 |
| 189.90958 | -5.34783 | -3.370.06 | -3.730.06 | -1.740.01 | -1.870.01 | -1.570.02 | -1.160.02 | -1.990.03 | 2.700.01 | |
| 189.91209 | -5.34616 | -2.680.06 | -2.940.06 | -1.340.01 | -1.370.01 | -1.060.02 | -0.810.02 | -1.430.03 | 3.100.01 | |
| 189.91460 | -5.34421 | -2.400.06 | -2.640.06 | -1.150.01 | -1.160.01 | -0.870.02 | -0.660.02 | -1.200.04 | 3.290.01 | |
| 189.91711 | -5.34227 | -2.690.06 | -2.960.06 | -1.370.01 | -1.400.01 | -1.090.02 | -0.800.02 | -1.450.03 | 3.070.01 | |
| 189.91962 | -5.34060 | -3.390.06 | -3.710.06 | -1.770.01 | -1.900.01 | -1.610.02 | -1.150.02 | -2.030.03 | 2.670.01 | |
| 189.92213 | -5.33866 | -3.720.06 | -4.060.06 | -2.020.01 | -2.250.01 | -2.120.02 | -1.640.02 | -2.480.03 | 2.420.01 | |
| NGC5383 | 209.25691 | 41.85528 | -3.460.06 | -3.720.06 | -2.340.01 | -2.560.01 | -1.960.02 | -1.940.02 | -2.290.04 | 2.090.01 |
| 209.25989 | 41.85305 | -3.500.06 | -3.810.06 | -2.230.01 | -2.460.01 | -1.900.02 | -1.760.02 | -2.270.03 | 2.200.01 | |
| 209.26324 | 41.85083 | -3.600.06 | -3.960.06 | -2.110.01 | -2.330.01 | -1.720.02 | -1.420.02 | -2.170.03 | 2.320.01 | |
| 209.26622 | 41.84861 | -3.230.06 | -3.570.06 | -1.820.01 | -2.010.01 | -1.310.02 | -1.090.02 | -1.770.03 | 2.620.01 | |
| 209.26958 | 41.84639 | -2.850.06 | -3.210.06 | -1.550.01 | -1.740.01 | -1.040.02 | -0.910.02 | -1.470.03 | 2.880.01 | |
| 209.27293 | 41.84417 | -2.940.06 | -3.350.06 | -1.610.01 | -1.810.01 | -1.130.02 | -0.990.02 | -1.560.03 | 2.820.01 | |
| 209.27592 | 41.84195 | -3.380.06 | -3.830.06 | -1.910.01 | -2.120.01 | -1.480.02 | -1.260.02 | -1.930.03 | 2.520.01 | |
| 209.27928 | 41.83972 | -3.560.06 | -3.880.06 | -2.120.01 | -2.340.01 | -1.770.02 | -1.570.02 | -2.200.03 | 2.310.01 | |
| 209.28226 | 41.83750 | -3.400.06 | -3.610.06 | -2.210.01 | -2.430.01 | -1.820.02 | -1.730.02 | -2.180.03 | 2.220.01 | |
| 209.28561 | 41.83528 | -3.480.06 | -3.670.06 | -2.440.01 | -2.650.01 | -2.040.02 | -1.920.02 | -2.340.04 | 1.990.01 | |
| NGC5850 | 226.76862 | 1.55108 | -3.950.06 | -4.140.06 | -2.320.01 | -2.580.01 | -2.290.02 | -2.400.02 | -2.690.03 | 2.110.01 |
| 226.77139 | 1.54969 | -4.250.06 | -4.500.06 | -2.240.01 | -2.510.01 | -2.420.02 | -2.520.02 | -2.870.03 | 2.180.01 | |
| 226.77417 | 1.54830 | -4.450.06 | -4.790.06 | -2.130.01 | -2.400.01 | -2.500.02 | -2.590.02 | -2.970.03 | 2.290.01 | |
| 226.77696 | 1.54691 | -4.330.06 | -4.730.06 | -1.890.01 | -2.150.01 | -2.310.02 | -2.420.02 | -2.800.03 | 2.540.01 | |
| 226.77974 | 1.54552 | -4.020.06 | -4.410.06 | -1.540.01 | -1.820.01 | -1.990.02 | -2.190.02 | -2.480.03 | 2.880.01 | |
| 226.78252 | 1.54413 | -3.850.06 | -4.260.06 | -1.390.01 | -1.660.01 | -1.850.02 | -2.080.02 | -2.330.03 | 3.040.01 | |
| 226.78529 | 1.54274 | -4.030.06 | -4.460.06 | -1.540.01 | -1.810.01 | -2.000.02 | -2.170.02 | -2.480.03 | 2.880.01 | |
| 226.78807 | 1.54136 | -4.340.06 | -4.770.06 | -1.880.01 | -2.150.01 | -2.330.02 | -2.390.02 | -2.810.03 | 2.540.01 | |
| 226.79085 | 1.53997 | -4.460.06 | -4.810.06 | -2.130.01 | -2.390.01 | -2.530.02 | -2.560.02 | -3.000.03 | 2.300.01 | |
| 226.79362 | 1.53858 | -4.270.06 | -4.520.06 | -2.240.01 | -2.500.01 | -2.450.02 | -2.480.02 | -2.890.03 | 2.190.01 | |
| 226.79640 | 1.53719 | -3.920.06 | -4.130.06 | -2.290.01 | -2.560.01 | -2.290.02 | -2.320.02 | -2.680.03 | 2.130.01 | |
| NGC5921 | 230.48247 | 5.06178 | -3.110.06 | -3.370.06 | -2.020.01 | -2.240.01 | -1.710.02 | -1.640.02 | -1.990.04 | 2.420.01 |
| 230.48331 | 5.06483 | -3.190.06 | -3.490.06 | -1.860.01 | -2.090.01 | -1.690.02 | -1.510.02 | -2.010.04 | 2.580.01 | |
| 230.48415 | 5.06761 | -3.220.06 | -3.600.06 | -1.620.01 | -1.850.01 | -1.550.02 | -1.340.02 | -1.930.03 | 2.820.01 | |
| 230.48526 | 5.07067 | -3.190.06 | -3.610.06 | -1.480.01 | -1.720.01 | -1.450.02 | -1.250.02 | -1.860.03 | 2.960.01 | |
| 230.48637 | 5.07372 | -3.290.06 | -3.630.06 | -1.660.01 | -1.890.01 | -1.580.02 | -1.360.02 | -1.980.03 | 2.780.01 | |
| 230.48721 | 5.07650 | -3.230.06 | -3.490.06 | -1.890.01 | -2.130.01 | -1.710.02 | -1.530.02 | -2.040.04 | 2.540.01 | |
| 230.48805 | 5.07956 | -3.100.06 | -3.340.06 | -2.040.01 | -2.270.01 | -1.740.02 | -1.670.02 | -2.000.04 | 2.400.01 | |
| NGC6217 | 248.14055 | 78.20620 | -2.930.06 | - | -2.040.01 | -2.240.01 | -1.510.02 | -1.210.02 | -1.760.04 | 2.440.01 |
| 248.14734 | 78.20342 | -2.920.06 | - | -1.900.01 | -2.100.01 | -1.350.02 | -0.870.02 | -1.660.03 | 2.580.01 | |
| 248.15413 | 78.20092 | -2.740.06 | - | -1.680.01 | -1.860.01 | -1.070.02 | -0.590.02 | -1.410.03 | 2.800.01 | |
| 248.16228 | 78.19814 | -2.430.06 | - | -1.470.01 | -1.630.01 | -0.840.02 | -0.400.02 | -1.160.03 | 3.010.01 | |
| 248.17043 | 78.19537 | -2.580.06 | - | -1.560.01 | -1.730.01 | -0.940.02 | -0.470.02 | -1.270.03 | 2.920.01 | |
| 248.17722 | 78.19286 | -2.930.06 | - | -1.800.01 | -1.980.01 | -1.180.02 | -0.680.02 | -1.550.03 | 2.680.01 | |
| 248.18401 | 78.19009 | -3.020.06 | - | -1.980.01 | -2.160.01 | -1.300.02 | -0.870.02 | -1.660.03 | 2.500.01 | |
| NGC6951 | 309.28613 | 66.10472 | -3.070.06 | -3.700.06 | -1.730.01 | -1.950.01 | -1.410.02 | -1.170.02 | -1.830.03 | 2.670.01 |
| 309.29367 | 66.10500 | -3.120.06 | -3.790.06 | -1.550.01 | -1.770.01 | -1.330.02 | -0.940.02 | -1.780.03 | 2.860.01 | |
| 309.30121 | 66.10528 | -2.800.06 | -3.460.06 | -1.260.01 | -1.480.01 | -1.030.02 | -0.670.02 | -1.480.03 | 3.140.01 | |
| 309.30875 | 66.10555 | -2.560.06 | -3.230.06 | -1.110.01 | -1.330.01 | -0.850.02 | -0.530.02 | -1.280.03 | 3.300.01 | |
| 309.31628 | 66.10583 | -2.750.06 | -3.460.06 | -1.240.01 | -1.460.01 | -0.980.02 | -0.630.02 | -1.430.03 | 3.160.01 | |
| 309.32382 | 66.10611 | -3.090.06 | -3.760.06 | -1.530.01 | -1.760.01 | -1.300.02 | -0.910.02 | -1.750.03 | 2.870.01 | |
| 309.33139 | 66.10639 | -3.020.06 | -3.520.06 | -1.730.01 | -1.950.01 | -1.440.02 | -1.200.02 | -1.830.03 | 2.670.01 | |
| NGC7723 | 354.73221 | -12.96361 | -3.010.06 | -3.300.06 | -1.790.01 | -2.030.01 | -1.600.02 | -1.330.02 | -1.980.04 | 2.560.01 |
| 354.73508 | -12.96222 | -2.880.06 | -3.190.06 | -1.590.01 | -1.830.01 | -1.450.02 | -1.090.02 | -1.840.04 | 2.750.01 | |
| 354.73792 | -12.96083 | -2.750.06 | -3.040.06 | -1.490.01 | -1.740.01 | -1.350.02 | -0.980.02 | -1.720.04 | 2.850.01 | |
| 354.74075 | -12.95944 | -2.890.06 | -3.190.06 | -1.590.01 | -1.830.01 | -1.430.02 | -1.070.02 | -1.830.04 | 2.760.01 | |
| 354.74362 | -12.95806 | -3.080.06 | -3.380.06 | -1.790.01 | -2.030.01 | -1.580.02 | -1.290.02 | -2.000.04 | 2.550.01 |
Appendix E Use of CO(2-1) to estimate molecular gas masses and star formation efficiencies
In order to test the sensitivity to resolution of the KS law within bars, we use the CO(2-1) spectra instead of CO(1-0). The latter, exploited in the previous sections, have better quality and two times lower calibration errors, but also two times worse resolution. We calculated and from , assuming an intrinsic ratio (Leroy et al. 2009), and then applied Eqs. 6, 7, and 8. We recalculate and following the steps described in Sect. 4 for the smaller CO(2-1) beam (i.e. FWHM=10.75″, corresponding to kpc) if CO(2-1) was detected. The resulting profiles are shown in Fig. 26. These are more centrally peaked, as expected from the higher resolution, and the SF dips in quiescent bars are more clearly resolved. The - relation and SFE profiles (Fig. 25) are similar to the ones reported in Sect. 5. The mean SFEs are 0.12 dex lower when using CO(2-1) to estimate as compared to CO(1-0); however, the differences in the CO(2-1)-based SFE amplitudes are dependent on the adopted , which is not necessarily constant in and across galaxies (see next Sect. F). Despite the poorer data quality, the analysis of the KS law with CO(2-1) spectra reinforces the conclusions of this work: low SFE in the massive galaxies NGC 4548 and NGC 5850, which are known to lie in denser environments and host massive bulges (Sect. 5).
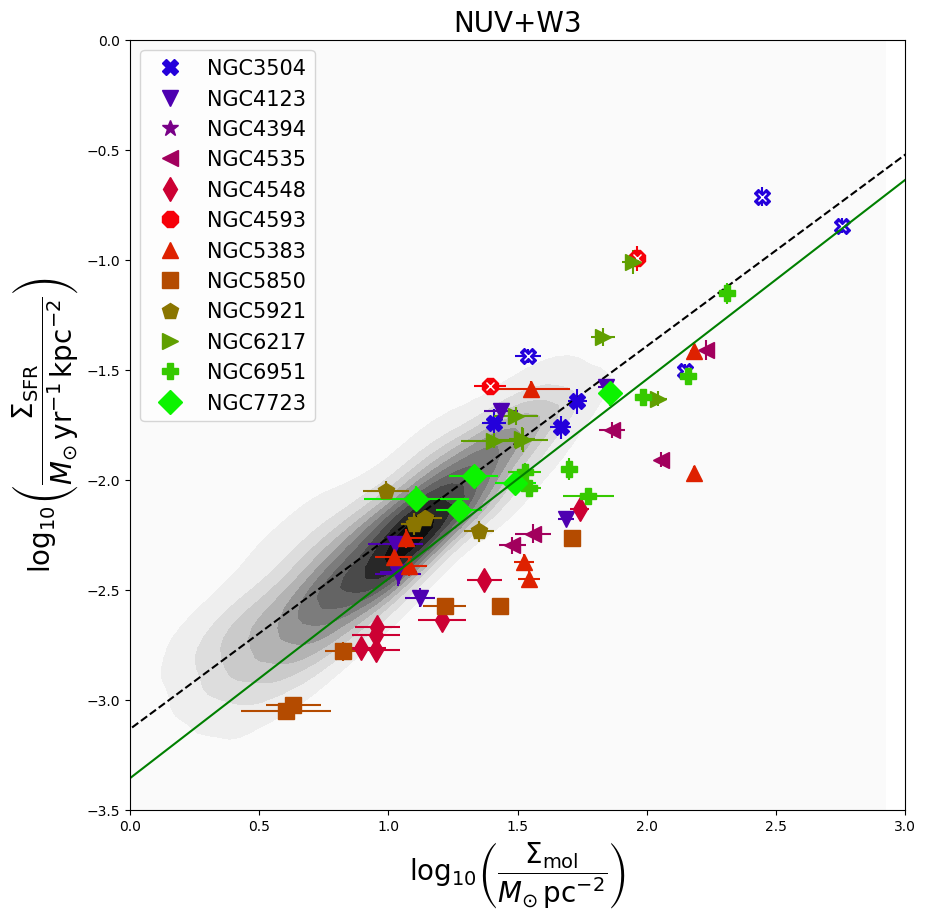
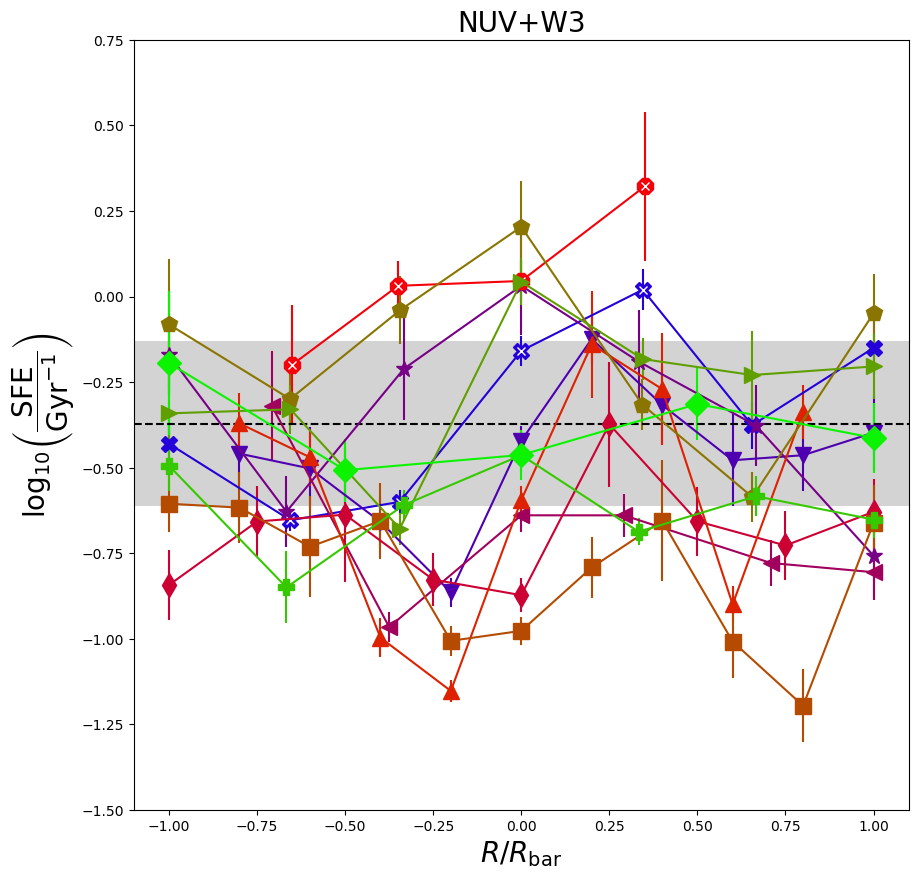
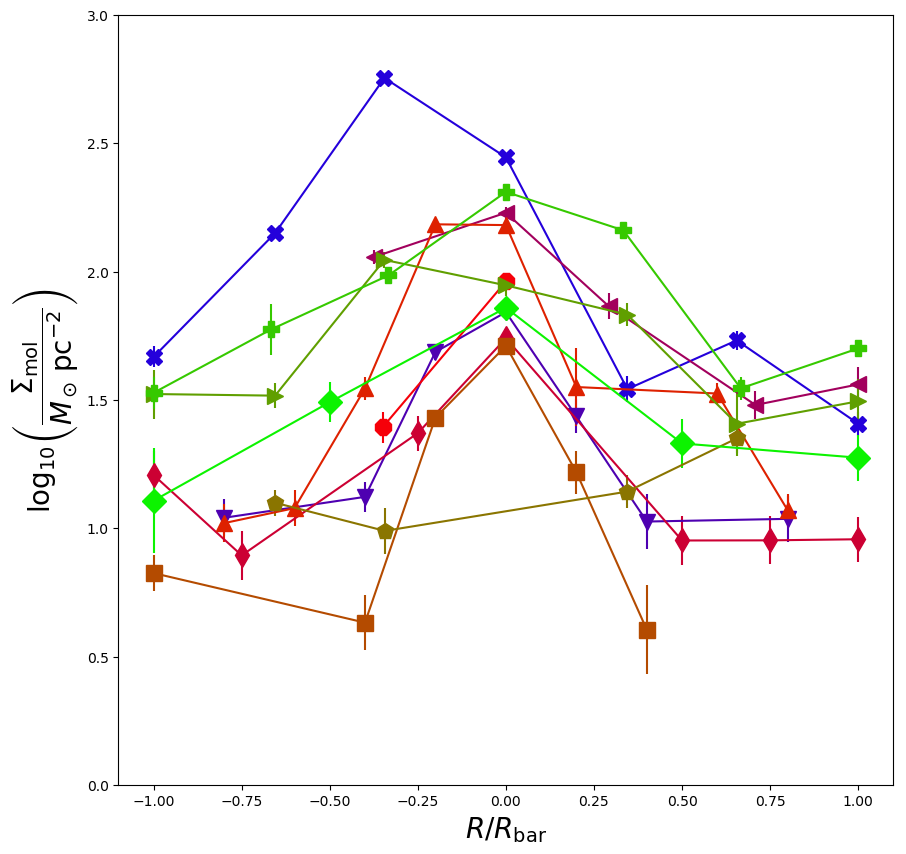
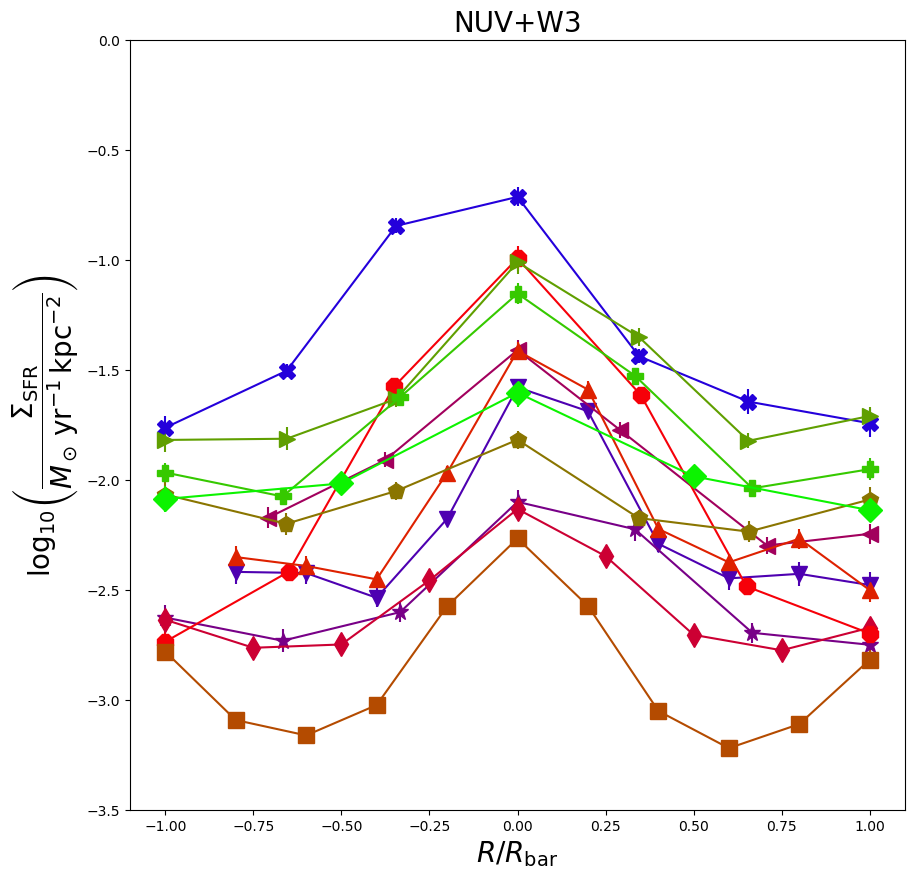
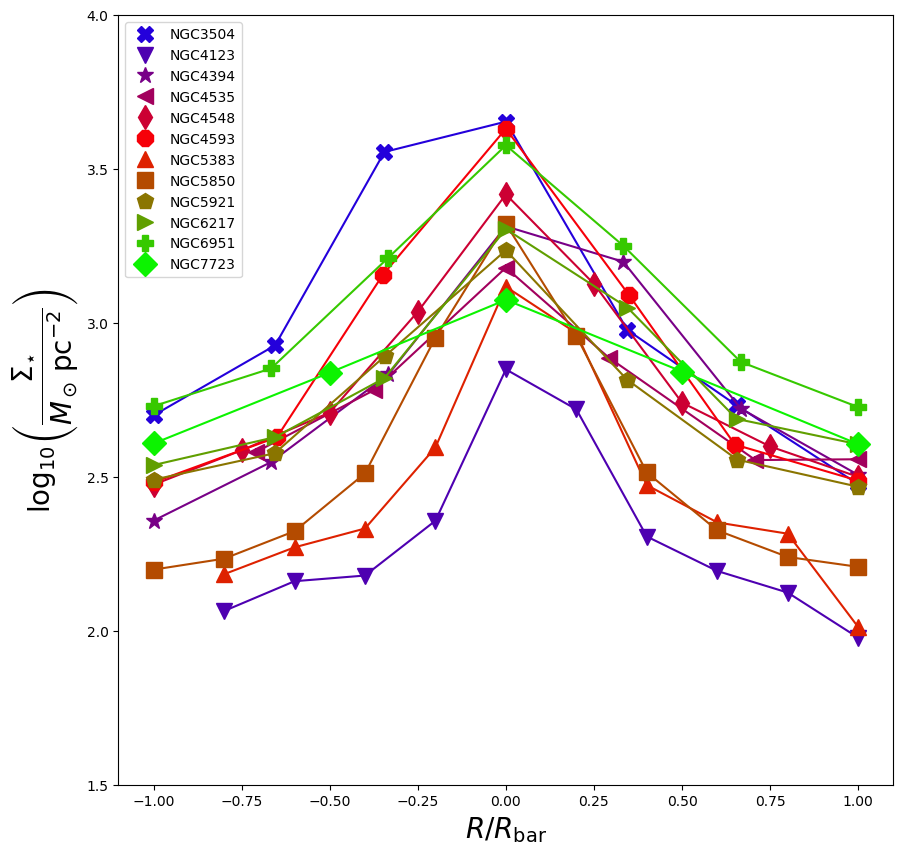
Appendix F Gas excitation traced from CO(2-1) and CO(1-0) spectra
In this appendix we analyse the gas excitation across the bars in our sample. We calculate the ratio of the velocity-integrated line intensity of the IRAM-30m CO(1-0) and CO(2-1) spectra: . The mean value is . In the upper panel of Fig. 27 we show as a function of radius along the individual bars. There is no clear trend of along the bars, and no noticeable differences between the different galaxies. In the lower panel of Fig. 27 we show the KS relation, colour-coded by . There is no correlation between and or SFE (see inset plots of Fig. 27).
In order to interpret we have to take into account several effects. depends on the excitation temperature and the opacity of the molecular gas. In addition, the observed depends on the distribution of the molecular gas relative to the beam size since in our measurements the beam size of is half the beam size of . The intrinsic value, , that would be measured with matched aperture observations is for optically thin gas, and (the more realistic case) for optically thick gas in thermal equilibrium, where depends on the temperature of the gas. Values below are an indication of subthermal excitation due to a gas density well below the critical density so that the excitation temperature is below the kinetic temperature.
If the source is more extended than the beams, we observe . If the source is less extended than the beams, the observed ratio is higher than the intrinsic ratio with the limiting case of a point-like source, for which we would observe (see Solomon et al. 1997; Lisenfeld et al. 2019).
Matched aperture observations of CO(1-0) and CO(2-1) give line ratios of (Braine et al. 1993, for a small sample of nearby spiral galaxies), (Leroy et al. 2009, for the SINGS sample), and (Casasola et al. 2015, for four low-luminosity AGNs from the NUclei of GAlaxies, NUGA, survey). is consistent with optically thick gas with an excitation temperature of 10 K (Leroy et al. 2009). It is therefore very likely that a similar situation holds in our sample, meaning that can be interpreted as optically thick thermalised gas with a spatial extension smaller than (at least) the CO(1-0) beam, and the values between as optically thick extended gas in thermal and kinetic equilibrium. There are a few pointings with a lower which indicate subthermal excitation due to a low gas density.
Maeda et al. (2020) found a tight correlation between the SFE and (observed with matched beams, so that ), in the sense that areas with a low SFE show a lower . We cannot confirm this trend. Even though we took into account the different beam sizes of CO(1-0) and CO(2-1), a possibly small source size can only mean that our measured overestimates . Thus, the low values of indicate that is even lower. From Fig. 27 (lower panel) it is hard to see how we could produce a trend between and the SFE, since the low values () are rather evenly distributed in pixels of high and low SFEs.