In-depth Analysis of Evolving Binary Systems that Produce Nova Eruptions
Abstract
This study is the direct continuation of a previous work performed by Hillman et al., where they used their feedback dominated numerical simulations to model the evolution of four initial models with white dwarf (WD) masses of and and red dwarf (RD) masses of and from first Roche-lobe contact of the donor RD, over a few times years, until the RD was eroded down to below . This study presents an in-depth analysis of their four models complimented by three models with a higher WD mass of , one of which comprises an oxygen-neon (ONe) core. Common features were found for all seven models on a secular time scale as well as on a cyclic time scale. On the other hand, certain features were found that are strongly dependent either on the WD or the RD mass but are indifferent to the other of the two. Additionally, a model with a WD composed of an ONe core was compared with its corresponding carbon oxygen (CO) core WD model and found to have a significant impact on the heavy element abundances in the ejecta composition.
keywords:
(stars:) novae, cataclysmic variables – (stars:) binaries: close1 Introduction
Novae are bright eruptions Pay1957 that occur in the degenerate envelope near the surface of a white dwarf (WD) as a result of accretion of hydrogen rich matter from a donor companion. The accumulating matter slowly raises the subsurface pressure and temperature until eventually igniting the accreted hydrogen in the CNO cycle Shara1981; MacDonald1983. Since the degeneracy pressure is insensitive to temperature, heating does not cause the envelope to expand, thus, the temperature continues to rise, triggering a thermonuclear runaway (TNR) ejecting the accreted matter Starrfield1972. It has been established that the manner in which a single nova eruption evolves may vary immensely depending on the system properties, specifically the WD mass and the rate that it accretes mass from its companion (e.g., Shara1986; Kovetz1988; Livio1988; Kolb2001; Yaron2005; Toonen2014; Hillman2020). In some cases, these properties may be deduced from observations (e.g., Schaefer2010; Strope2010; Shara2018). A nova producing system undergoes extensive secular changes as well. Hillman2020 have shown that the donor may be eroded over a few Gyr as the result of thousands of nova cycles of accretion and eruption, while the mass of the WD changes very little. They demonstrated this by using a feedback-dominated code designed to follow the evolution of the stellar binary components from an initial state of Roche lobe overflow (RLOF) of a red dwarf (RD) donor onto the surface of a WD accretor. They showed that the mass transfer rate () from the RD to the WD, which had been assumed constant in nearly all earlier simulations Prikov1995; Idan2013; Wolf2013; Hillman2015, varies over a few orders of magnitude — rapidly decreasing and then slowly increasing — during the accretion phase of a single nova cycle i.e., between eruptions. They have also found that evolves slowly over many orders of magnitude throughout the course of thousands of nova cycles, ranging from as high as to low enough as to be considered effectively zero. Different rates of accretion characterize different types of eruptive behavior Collazzi2009; Knigge2011; Dubus2018, i.e., classical novae (CN), recurrent nova (RN), dwarf nova (DN) and nova-likes (NL). Hillman2020 showed that the behavior of their four different models, spanning a vast range of accretion rates throughout evolution, implies that the various types of phenomena do not originate from different types of systems, but rather occur at different evolutionary phases of the same type of system, demonstrating that their models alternate between states of being detached hibernating systems, NLs, DNs and CNs depending on the accretion rate at the time. This paper is a direct continuation of their study, presenting an in-depth analysis of their results. In addition, included here are three more models as an effort to expand this exercise to consider more massive WDs, and a WD with an oxygen-neon (ONe) core. This study investigates the trends common to all the models, as well as the differences between the models, focusing on determining the key parameters that dominate each of these trends. This includes short term features of the nova cycle that characterize the eruption phase as well the accretion phase, and secular changes over thousands of cycles that slowly erode the RD. §2 describes the seven models and the methods of calculation. The results are in §3 followed by a comparison with the results of an ONe core model in §LABEL:sec:ONe. The conclusions are summarized in §LABEL:sec:conclusions
2 Methods and models
All the simulations were carried out with the combined code for simulating the long-term evolution of a binary system producing consecutive nova eruptions Hillman2020. This code utilizes two originally independent codes that have been modified and combined. The first simulates the donor component by the use of a hydrostatic stellar evolution code which is designed to follow the evolution of a star from pre-MS all the way through to a WD Kovetz2009. The data produced by this code was used to build a dense database of donor input parameters to be used in the second code — a hydrodynamic Lagrangian nova evolution code designed to follow the evolution of hundreds of thousands of complete consecutive nova cycles on the surface of a WD Prikov1995; Epelstain2007; Hillman2015. Kalomeni2016 found that regardless of the initial RD age, the ratio of orbital period () to RD mass () for cataclysmic variables (CV) in RLOF remains the same. Since a CV system can emerge in the state of RLOF after numerous different scenarios, for simplicity, in this work each simulation begins with a zero age main sequence (ZAMS) donor filling its Roche lobe (RL). The combined code calculates the rate of mass accretion onto the surface of the WD at each timestep by accounting for orbital momentum change due to magnetic braking (MB) and gravitational radiation (GR) following Paxton2015:
| (1) |
| (2) |
and by accounting for the separation change due to mass lost from the system during each nova eruption by using:
| (3) |
where and are the change in orbital angular momentum due to magnetic braking (MB) and gravitational radiation (GR) respectively, and are the masses of the WD accretor and the RD donor respectively, is the radius of the RD, is the orbital period of the binary system, and and are the accreted and ejected masses of the previous nova cycle respectively. Further description of the method, including the treatment of the irradiated RD for tens to hundreds of years after each nova eruption, may be found in Hillman2020, noting that all processes are treated as spherically symmetrical. The implications of this simplification on the irradiated RD means that the increase in the RD’s effective temperature on the side near the WD may be higher than calculated here Kovetz1988, which may increase the enhanced RLOF and therefore, the mass transfer rate in the tens to hundreds of years following an eruption. Justification for treating the effects of irradiation as spherical is based on the calculations of Kovetz1988 who showed that the thermal timescale is of order seconds, which is very much shorter than the timescale of tens to hundreds of years during which the RD is irradiated due a nova eruption. The RD bloating is adopted from Kovetz1988 and then parameterized (see Hillman2020) in order to accommodate for different WD masses. A total of seven models were analyzed here. The four models (1 through 4) that are presented in Hillman2020 in addition to three models (5 through 7) with a more massive WD () one of which consists of an oxygen-neon (ONe) core. The initial model parameters are summarized in Table 1.
| Model | WD type | |||
|---|---|---|---|---|
| 1. | CO | 0.70 | 0.70 | |
| 2. | CO | 0.70 | 0.45 | |
| 3. | CO | 1.0 | 0.70 | |
| 4. | CO | 1.0 | 0.45 | |
| 5. | CO | 1.25 | 0.70 | |
| 6. | CO | 1.25 | 0.45 | |
| 7. | (ONe) | ONe | 1.25 | 0.45 |
3 Results
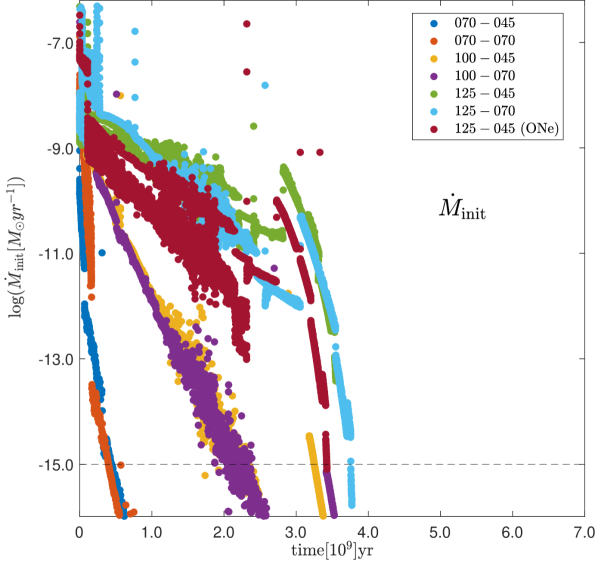
The evolution of the binary masses for the seven models are presented in Figure 1, showing that the three new models with a WD (models 5 through 7) behave in a manner similar to the previous four models with less massive WDs — all of the WD masses remain almost constant while the WDs of models with a RD donor lose less mass than the WDs (of equal initial masses) of models with a donor. This is because during each nova eruption the WD ejects more mass than it has accreted during the previous accretion phase meaning that the net mass change at the end of each cycle is negative. Since is inversely proportional to (e.g., Yaron2005), WDs with more massive companions require a larger number of cycles (accretion phases) in order to erode their RD companion, meaning that they experience more eruptions as well, resulting in a larger total net mass loss.
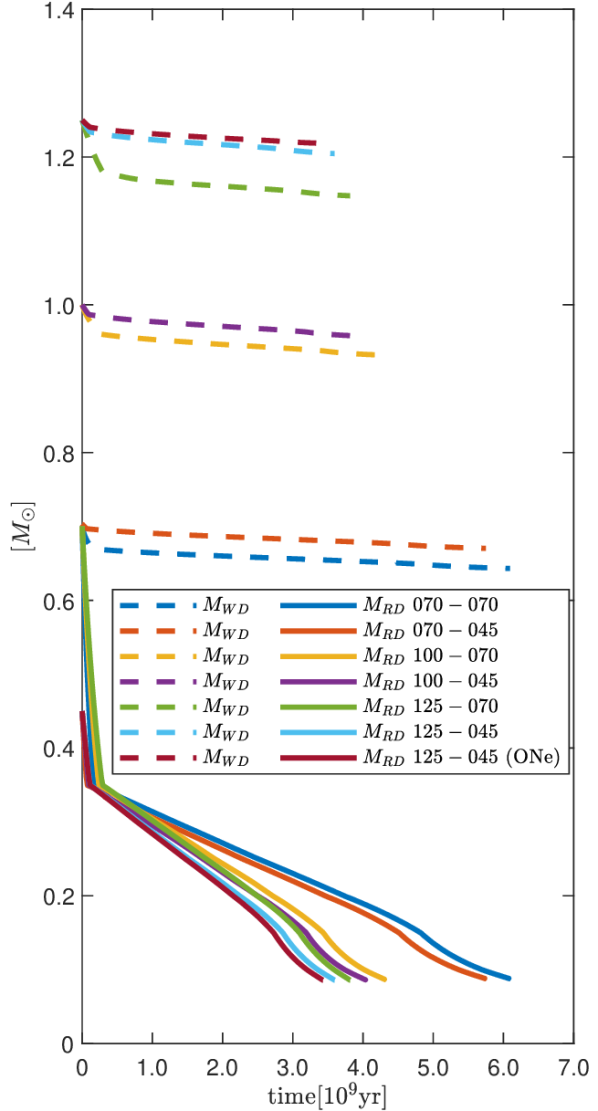
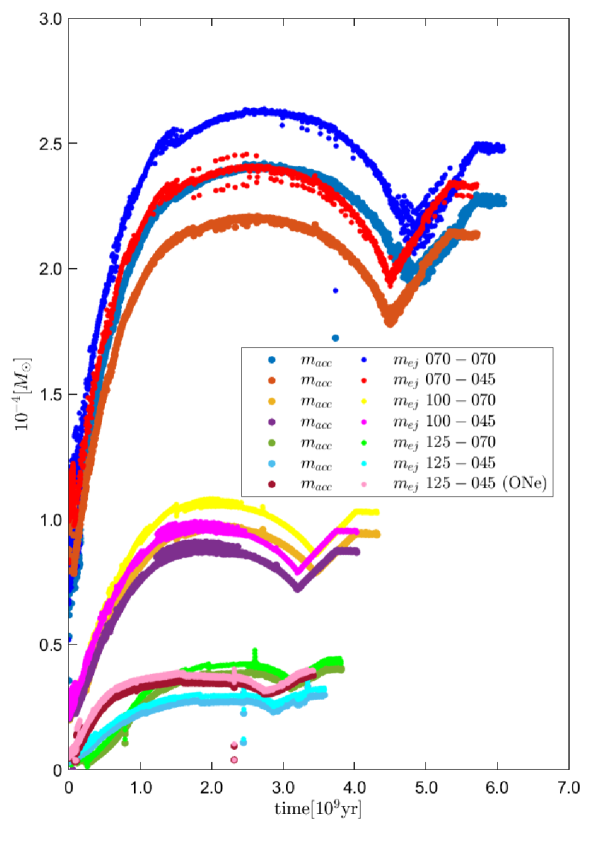
Although the models with the more massive () RDs experience roughly a factor of two more cycles than do the models with the less massive () RDs (when comparing between models with the same initial WD masses) the total evolutionary time is almost the same. This is because the time to erode a RD down to constitutes only a small fraction of the time it takes to continue eroding the RD down to . Essentially, the total evolutionary time of any combination model may be determined by the time it takes for the WD to erode a RD. This is the source of the "knee" in all the mass curves (WDs and RDs) in Figure 1. The reason for this discrepancy before and after lies in the effect of magnetic braking (MB). When the RD mass falls below , for which RDs become fully convective, the MB becomes inefficient in removing angular momentum and the binary separation () decreases at a substantially slower rate. This causes the accretion rate to increase at a slower rate as well, considerably extending the time needed for the WD to accumulate the critical mass () that is needed for triggering a TNR that will lead to a nova eruption. It is noted that for high mass loss rates, roughly higher than a few times , the RD will become fully convective at a mass lower than 0.35 (this is in agreement with e.g., Howell2001). Since for RDs approaching 0.35, the accretion rate does not become this high for most of the accretion time, this effect may only slightly decrease the total time of the accretion phase for these RDs until the RD is somewhat more eroded.
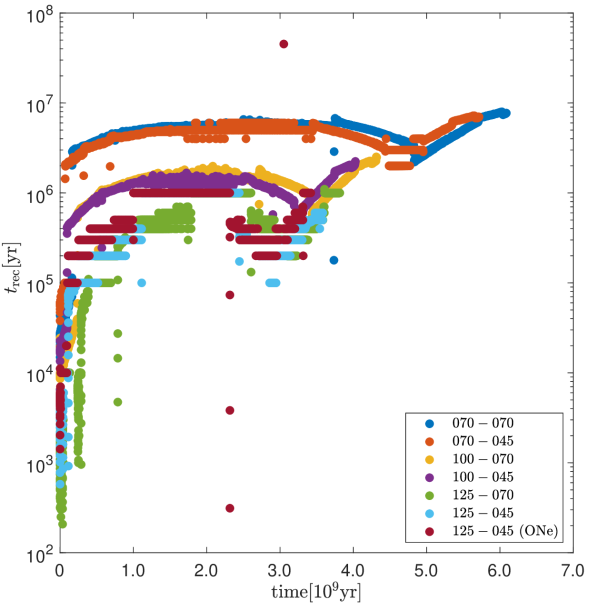
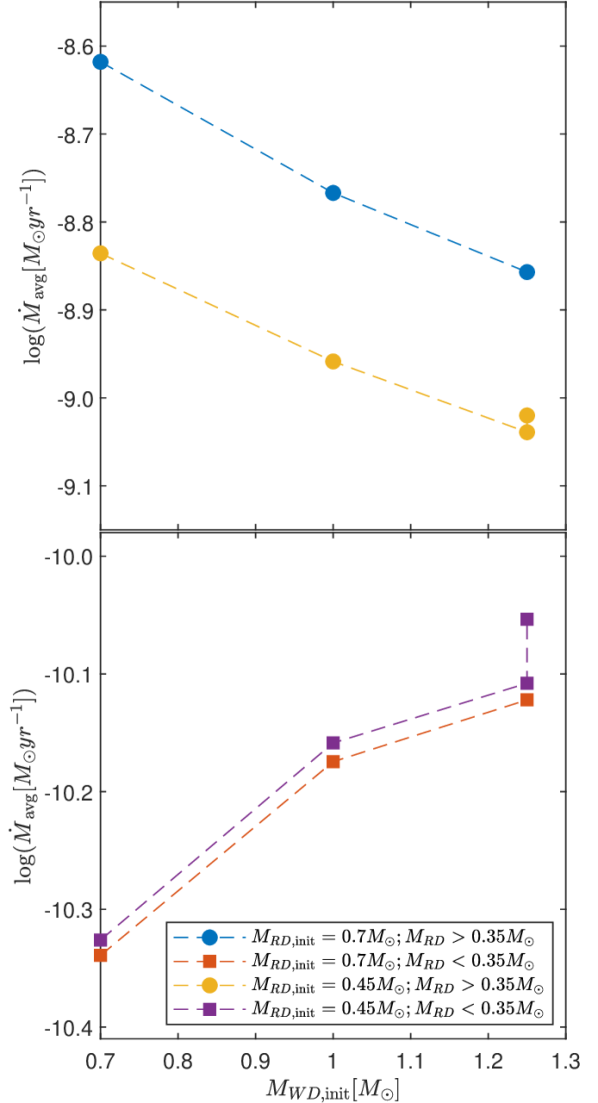
An additional aspect which may be seen in Figure 1 is the relation between the total evolutionary times of models with different WD masses. More massive WDs erode their donor down to faster. The total evolutionary time () may be estimated as the (average) recurrence time () multiplied by the number of cycles. is given in Figure 2, showing a ten fold decrease in the of the WD models as compared with the WD models, while the of WD models are in between. The reason for this is because a more massive WD builds up the required critical sub-surface pressure with less accreted mass (), thus, (for a given accretion rate) less time is needed. This also means that (for a given WD mass) the critical accreted mass required to trigger a TNR is lower as well, as may be seen in the left panel of Figure 3, where the curves representing more massive WDs are lower than the curves representing less massive WDs. The ejected mass () shows a similar trend. On the other hand, the general shape of the curves is common to all seven models, expressing that the trend of and changes twice throughout evolution. They begin increasing, reaching a peak doubling their original value when the RD mass reaches roughly . At this point there is a plateau after which they begin to decline. When the RD mass reaches they resume increasing. This is in correlation with the general trend of the accretion rate, and of . The number of cycles may be estimated as divided by the (average) , giving the total evolutionary time as . Although, and both decrease with increasing WD mass, so this simple parameterized calculation does not contribute sufficient information to the trend of the total evolutionary time. However, , means that, leading to the conclusion that a shorter total evolutionary time implies a higher total evolutionary average accretion rate. This means that on an evolutionary time scale, models with more massive WDs accrete at higher average rates and will erode their RD companion faster, regardless of the RDs initial mass.
The average accretion rate per model (), each divided into two epochs, is demonstrated in Figure 4. The squares show for the epoch of eroding the RD mass from down to , showing that a higher initial yields a higher total for this part of the evolution, for all the models. On the contrary, the circles representing for the earlier evolutionary phase of eroding the donor from its initial mass down to , show an opposite trend — the more massive initial WD masses have a slower . However this has a negligible influence on the total evolutionary time because the total time of this stage, for all seven models, is only a small fraction of the total evolutionary time.
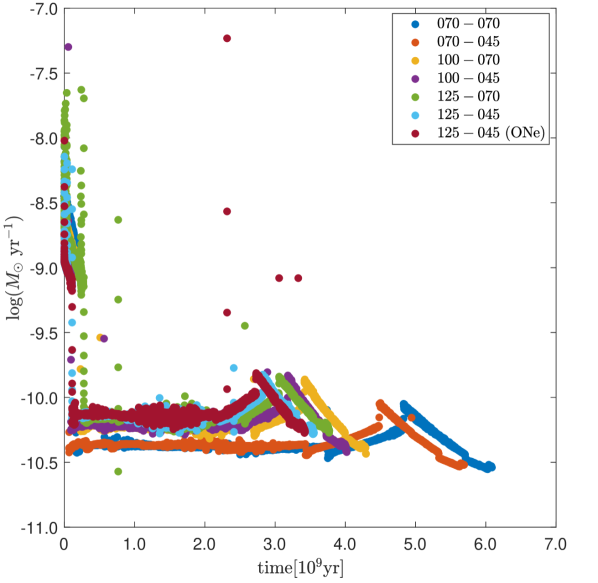
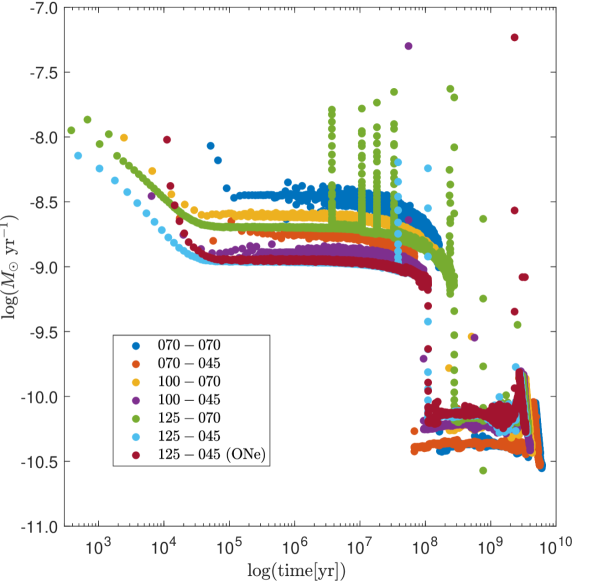
A more detailed examination of the accretion rate, averaged per cycle is given in Figure 5. The average accretion rate drops about two orders of magnitude when the MB stops, as expected from Figure 4, but it also shows a more subtle change as the RD mass approaches . At such low RD masses, hydrogen burning becomes less efficient, resulting in the radius not contracting with mass loss as efficiently as before. This causes the RLOF to increase, and thus causes to temporarily stray away from its fairly constant secular average rate. It then decreases back to its normal value, until the RD is eroded (). The period minimum (discussed later) occurs at as well, for the same reason as the temporary increase.
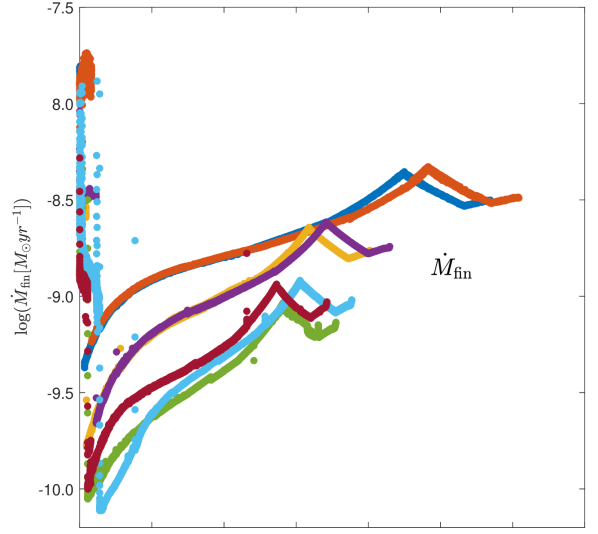
Remarkably, even though the average accretion rate per cycle (Figure 5) and per epoch (Figure 4) are very similar for all the models, looking closely at the initial and final accretion rates shows diversity depending strongly on the WD mass. This is presented in Figure 6 showing that for all the models the initial accretion rate per cycle () decreases and the final accretion rate per cycle () increases seculary, however for the less massive WDs () the changes occur faster resulting in these systems reaching a state of accretion rate which is practically zero () at an earlier evolutionary point than the moderate mass WDs (), and the massive WDs () erode their donor before has a chance to become very low. The trend is the opposite for because the longer the accretion phase, the longer time there is for orbital momentum loss to decrease the separation and thus increase , resulting in a higher for a lower WD mass. Because the trends are opposite, the average rates (Figure 5) are similar.
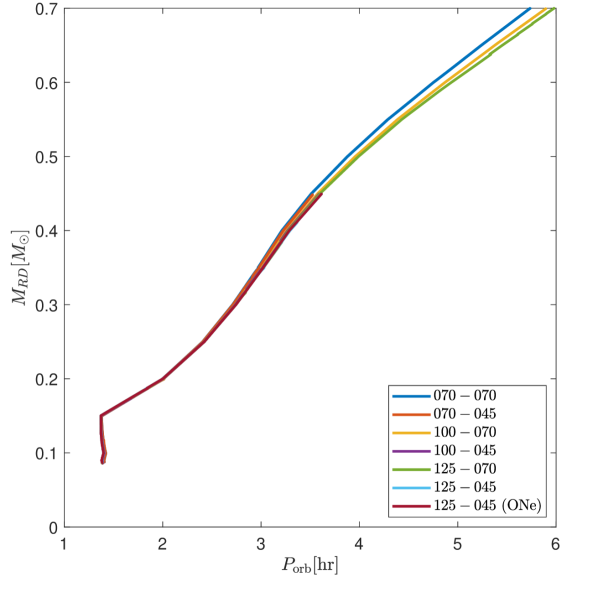
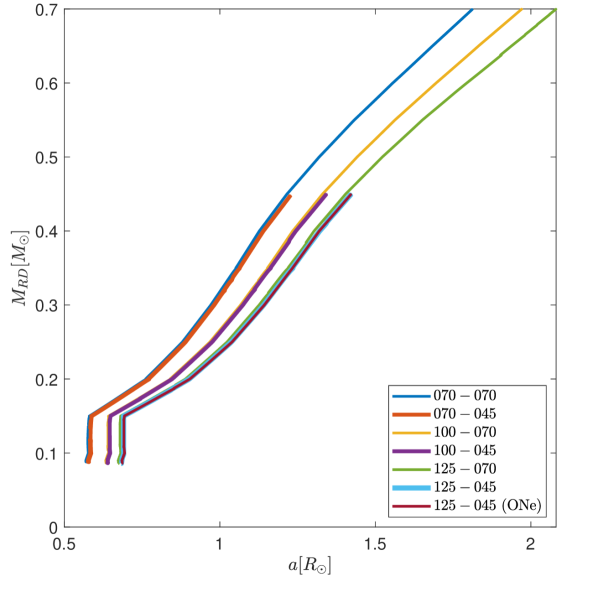
The accretion rate is strongly dependent on the binary separation (and orbital period) Ritter1988; Livio1994b; Kolb2001; Hillman2020 which show a clear trend in Figure 7 — the RD mass determines . All three of the models with a RD begin the simulation with an orbital period of hours, regardless of the WD mass (the curves overlap) and the period decreases with decreasing RD mass. When these RD masses are eroded down to , their curves coincide with the overlapping curves of all the models with initial RDs, that began with hours. The reason for the WD to be having a negligible influence on determining is that in close RLOF CVs, . The results for the models explored in this work yield quite a narrow range of RL radii for the initial models, ranging from to 111The entire range of for is Eggleton1983 implying that most in RLOF CVs would not be far from the above mentioned narrow range.. This range is a result of the varying () which determines the relation between the separation and the RL radius via (e.g., Eggleton1983, eq.2):
| (4) |
which is the only way the WD has an effect on determining the separation. This is apparent in the right panel of Figure 7 as the spaces between curves with different WD masses. These spaces are (nearly) absent in the orbital period curves, because of Kepler’s third law which dictates the relation thus compensating for the differences in the WD mass and eliminating almost entirely the dependence of the orbital period on the WD mass. All seven of the curves continue to decrease, in identical fashion, until reaching the minimum orbital period of hours for a RD mass of . From this point remains fairly constant until the end of the simulation, at . The minimal period is the result of the transition of the RD donor from a star to a sub-stellar object. For a RD with a mass as low as , hydrogen burning starts to become less efficient, approaching the brown dwarf limit. For the stellar mass-radius relation, , begins to transition from order , which is characteristic of main sequence stars, to , which is characteristic of degenerate objects. This means that for these extremely low mass RDs, the radius does not contract with mass loss as efficiently as before, halting the decrease in the orbital period Howell2001; King2002; Knigge2011a; Knigge2011.
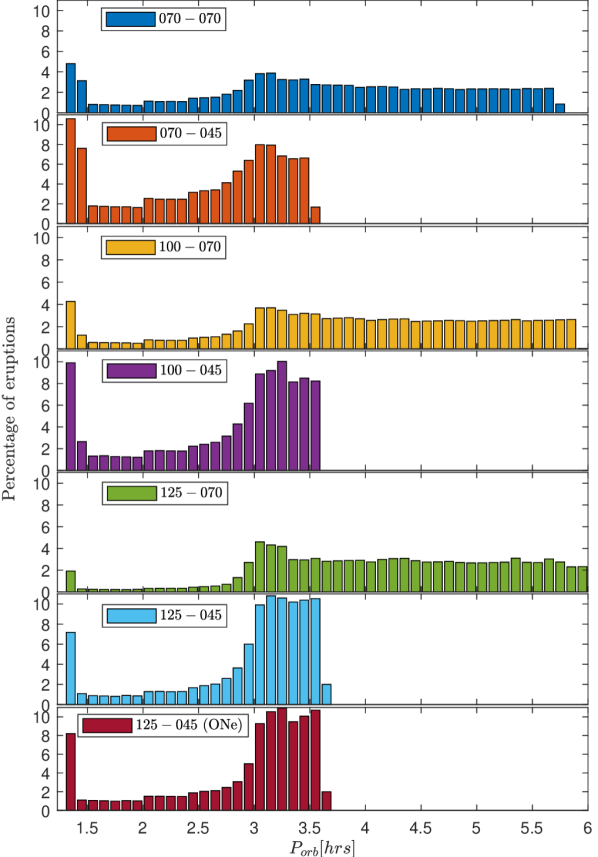
Although the relation between the RD mass and the orbital period is almost linear for almost the entire evolution, it does not reflect the detection probability of systems with different orbital periods. As discussed earlier and shown in Figure 2 (see right panel), after the MB turns off, the time between eruptions () increases drastically. Since this type of system is only detected during eruption, systems with long — i.e., systems that rarely erupt — will rarely be detected. These systems comprise of RDs below the MB turn-off, i.e., with masses below which, as seen in Figure 7, is correlated with orbital periods below hours. Figure 8 shows the percentage of eruptions (total number of eruptions that occurred within each bin divided by the total evolutionary number of eruption for each model) that occur within each bin, exhibiting a dip in the percentage of eruptions in the regime of roughly hours (see also figures 3 and 4 in Hillman2020). This is in agreement with the period gap, within which a relatively small number of systems have been discovered (e.g., Knigge2011).
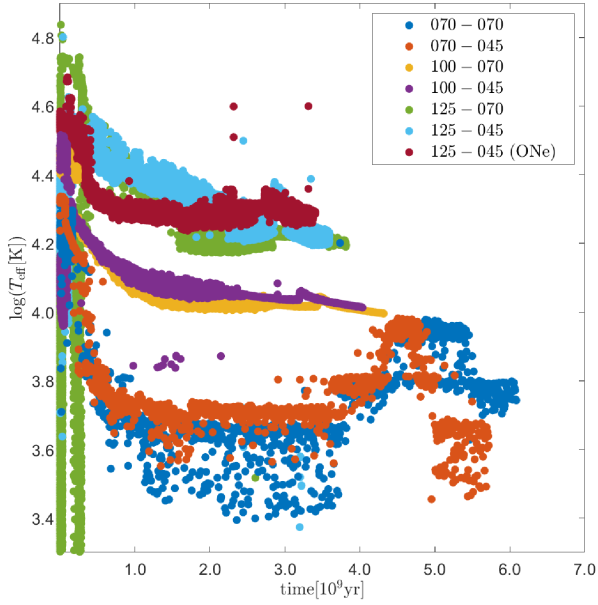
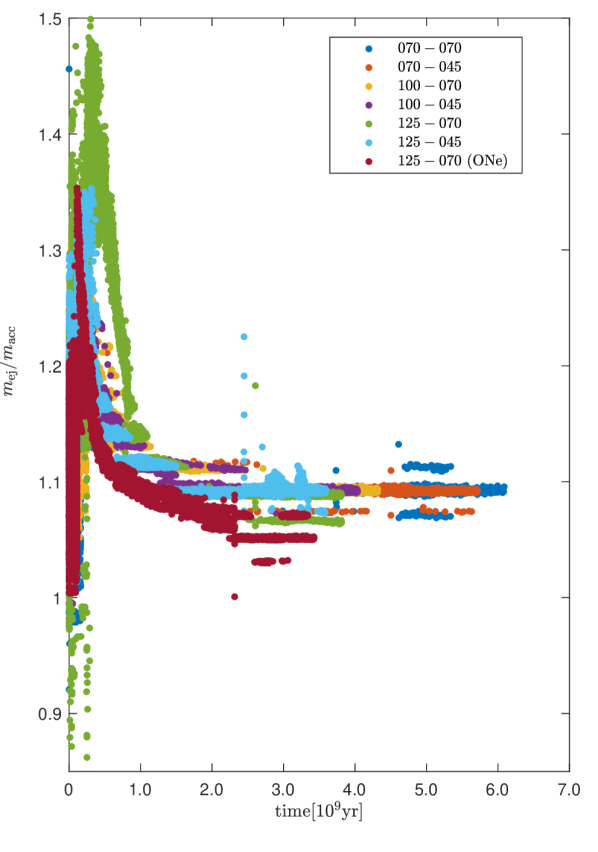
In addition, Figure 9 presents the minimal WD effective temperature () per cycle, showing that its behavior follows the behavior of the accretion rate — higher for higher accretion rates, and therefore, for less accreted mass and vice versa. This is because lower accretion rates produce stronger TNRs, causing more of an expansion of the outer layers of the WD than for faster accretion rates. When the outer layers expand, the effective temperature decreases, which means that lower accretion rates result in lower minimum effective temperatures (for a given WD mass). For the same reason, lower accretion rates lead to the ejection of more mass than do higher accretion rates. The critical takes more time to accumulate, thus allowing more time to mix deeper into the envelope Prialnik1984; Prialnik1986; Iben1992, resulting in a stronger TNR and a higher ratio . This ratio is shown in Figure 3 (right) where all the models have a substantially higher ratio for the evolutionary epoch of than for the evolutionary epoch of , which is explained as follows.
As presented in Figure 4, the accretion rate for is of order and for it is of order . Examining models from Yaron2005 which are closest to the models presented here (i.e., 0.65, 1.0 and 1.25 for , , and ) and comparing the ratio between their models, yields that for identical WD mass and accretion rate, the ratio depends on the core temperature () of the WD. For [K] their ratio is higher than for [K]. The of all the models was followed throughout evolution and presented in Figure 10, showing that it begins at [K] and declines in the same manner as the ratio , reaching [K] at around the same time that the ratio declines from its high value and stabilizes at roughly , consistent with the behavior of the models from Yaron2005.
Figure 10 also shows the maximal WD temperature () per cycle, which is correlated with the accreted mass. As explained earlier, more accreted mass means that there was more time for accretion (due to a lower accretion rate). This allows more time for heavy elements (mainly carbon) to be dredged up from the core into the envelope, thus raising the burning temperature and leading to a more powerful TNR. This is exhibited as increases and decreases in , following the trend of the accreted mass. Although, the more substantial difference in exhibited in Figure 10 is between models of different WD masses — the for models with reaches at most only [K] while for models with the reaches as high as [K].
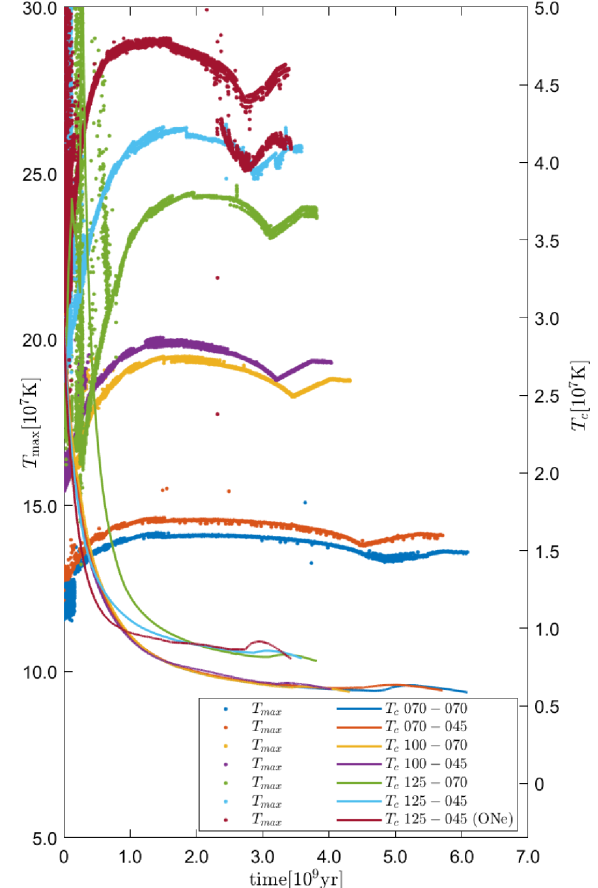
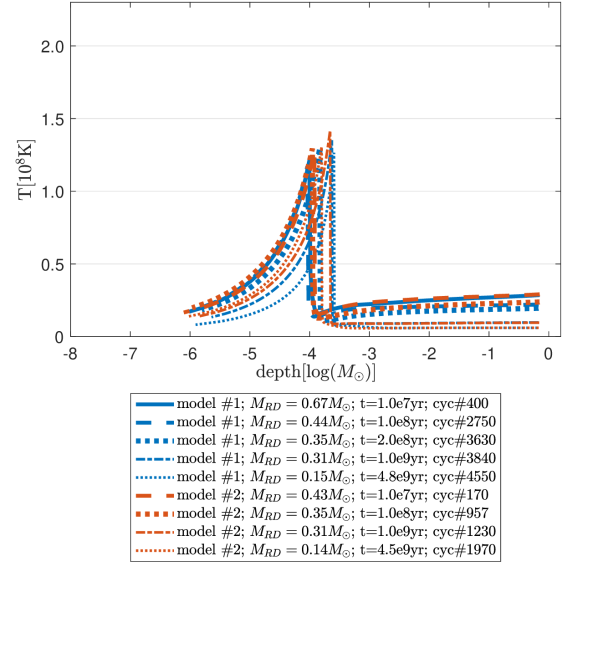
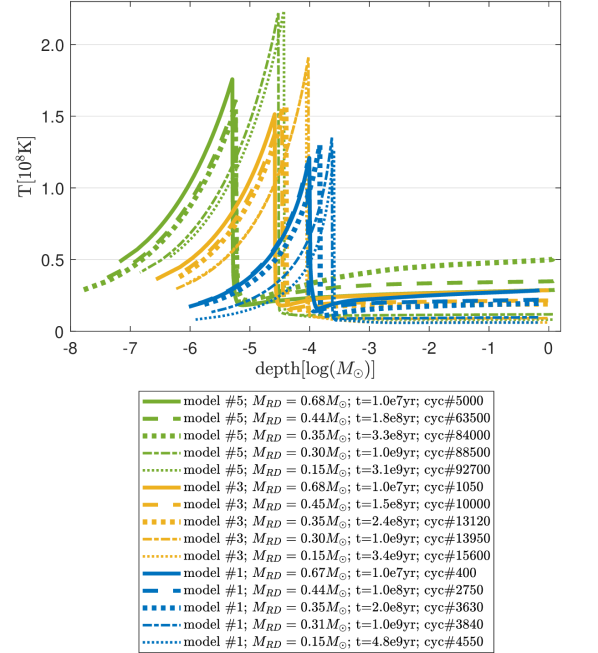
To further demonstrate the independence of the WD temperature evolution from the RD mass, Figure 11 shows depth profiles of the WD temperature at various points in time throughout evolution. The left panel shows the temperature evolution of the 0.70 WDs for models with different initial RD masses (models and ), showing that the curves of the two models coincide and for both models there is a general cooling of the core over time (which is a feature that is evident from Figure 10 as well). In contrast, the right panel of Figure 11 shows the temperature evolution of the different WD masses in the models with an initial RD mass of 0.7 (models , and ), all exhibiting a general cooling, but each model developing differently. The less massive WDs have a deeper envelope, a lower maximal temperature () and less of a change in throughout evolution.