Reimagining GNN Explanations with ideas from Tabular Data
Abstract
Explainability techniques for Graph Neural Networks still have a long way to go compared to explanations available for both neural and decision decision tree-based models trained on tabular data. Using a task that straddles both graphs and tabular data, namely Entity Matching, we comment on key aspects of explainability that are missing in GNN model explanations.
1 Introduction
Explainability techniques for Graph Neural Networks are an active area of research. Just as new methods are being proposed, it could be useful to take a step back and compare these methods with the progress made in other areas of machine learning.
Over the years, deep neural networks models have benefited from applying ideas from one domain to another. Explainability techniques too have been adopted across domains, though explanations in some domains (like tabular data) might be inherently easier than others (like graphs).
Entity matching is the task of predicting if two entities in a database belong to the same real-world entity. This task has a number of enterprise applications in sales recommendations, financial services and customer support. People and organization entities are of particular interest though entity matching also applies to products, locations, events, and even abstract ideas like compliance clauses and legal cases.
A somewhat unique aspect of entity matching is that it could be treated both as a task in tabular data and graphs. Hence using entity matching as our task, we explored explainability techniques in both tabular data and graph neural networks, and have identified some key aspects of explainability that are missing in GNN model explanations. In particular, we looked at very popular explainability techniques in tabular data, namely LIME (Ribeiro et al., 2016), SHAP (Lundberg & Lee, 2017), Anchors (Ribeiro et al., 2018) and TabNET (Arik & Pfister, 2019), that have been widely adopted in the industry and not just recent advances in research.
We formally state our observations as follows:
-
•
Learning feature importance from the entire training data, referred to as global methods, can help GNN explainability.
-
•
A sliding window where we produce explanations at different levels of model accuracy could be useful.
-
•
Graph visualization has its uses, but a logical explanation might be more intuitive.
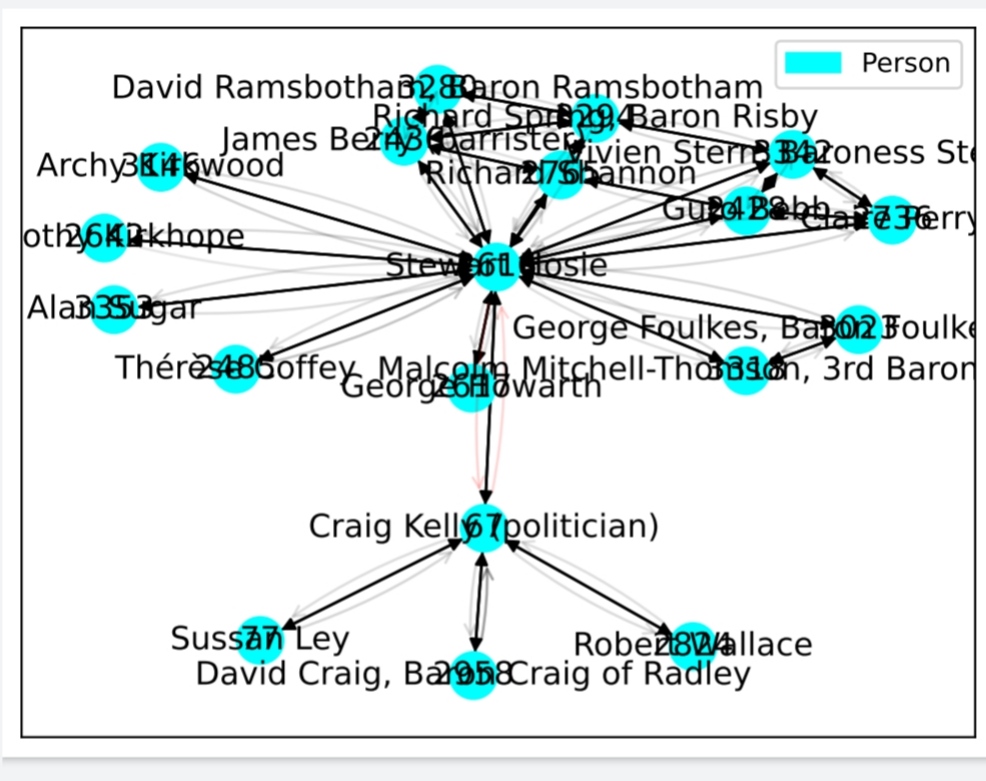
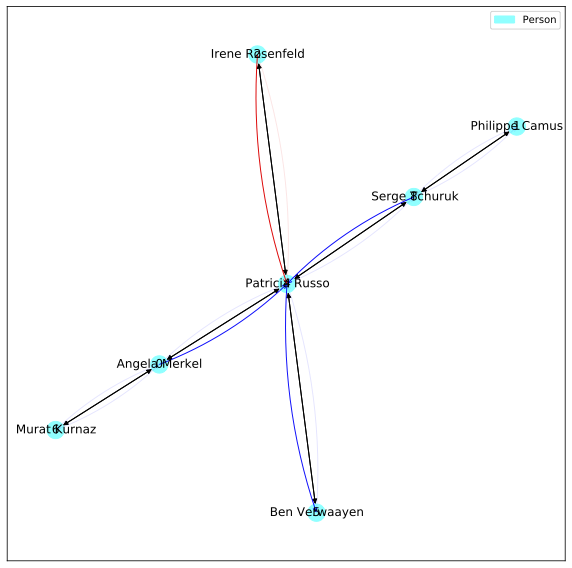
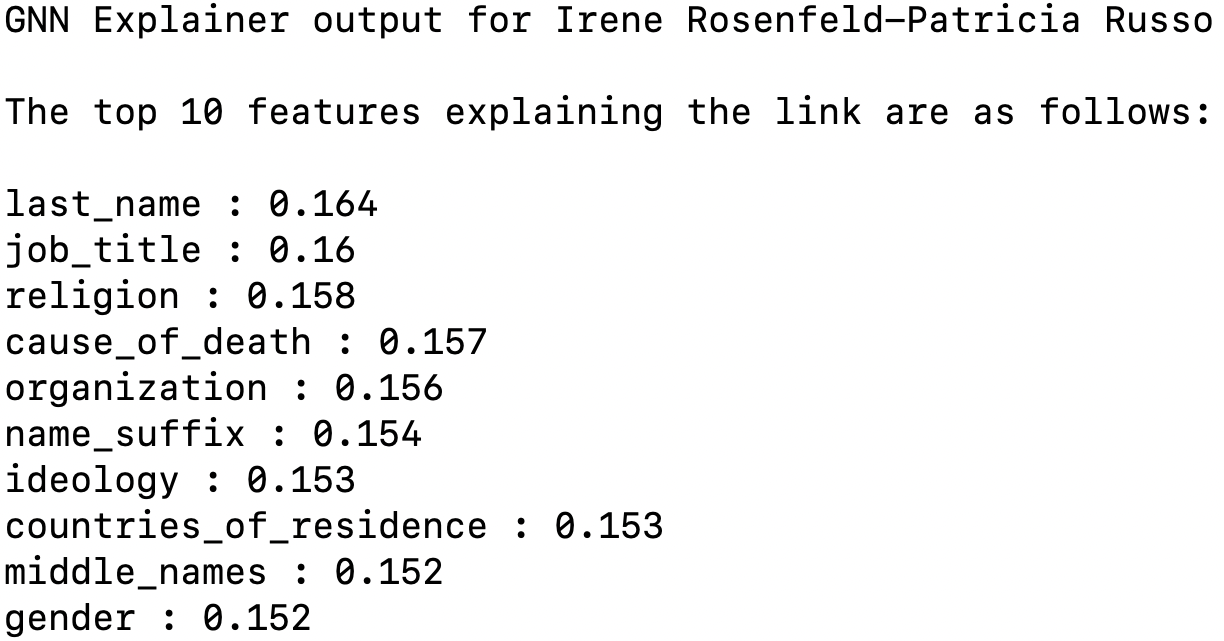
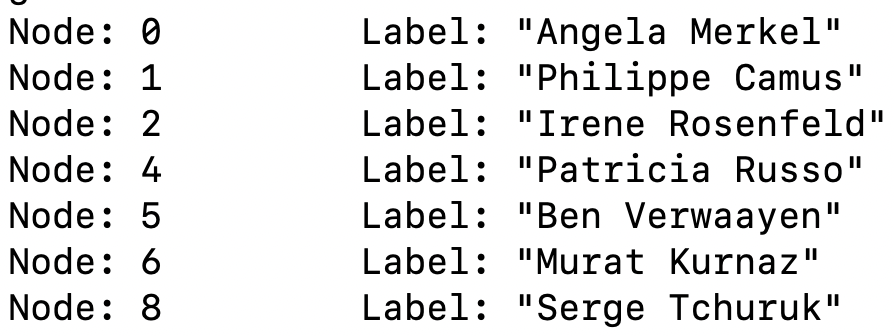
A typical explanation subgraph from GNN-Explainer (Ying et al., 2019) looks as shown in Figure 6. Similar visualizations can be obtained from other GNN explainability techniques like (Ying et al., 2019), (Yuan et al., 2020), (Vu & Thai, 2020), (Yuan et al., 2021), (Schlichtkrull et al., 2020).
We have in prior works attempted to substantiate GNN model predictions using information retrieval (Ganesan et al., 2020a), path ranking (Ganesan et al., 2020b) and reasoner based explanations (BK et al., 2021). In (Vannur et al., 2020), we had used a random forest model for post-hoc explanations. In the rest of this extended abstract, we’ll present ideas from tabular data.
2 Feature importance from global methods
Features selection by looking at the entire training data could be one of the ways to improve both GNN models and explanations which are currently more oriented towards message passing in the local neighborhood and learning the graph structure.
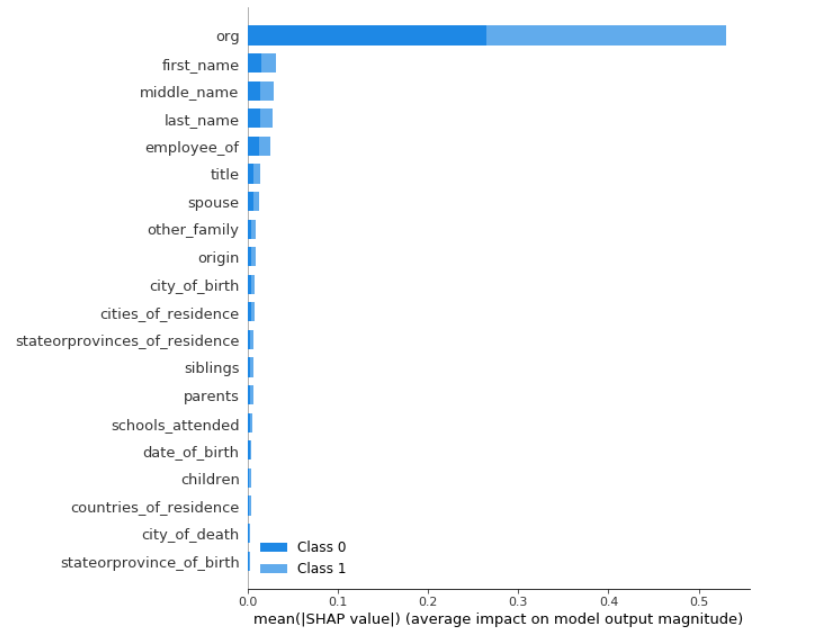
Finding feature importance by looking at all the training data is typical of models trained on tabular data. A typical example from SHAP (Lundberg & Lee, 2017) on a tabular data prediction is as shown in Figure 2(a).
TabNet (Arik & Pfister, 2019) expands this idea to multiple layers and aggregates the attention information to identify important features. GNN models like GATNE (Zhu et al., 2019) have shown how to use attention to improve node representation.
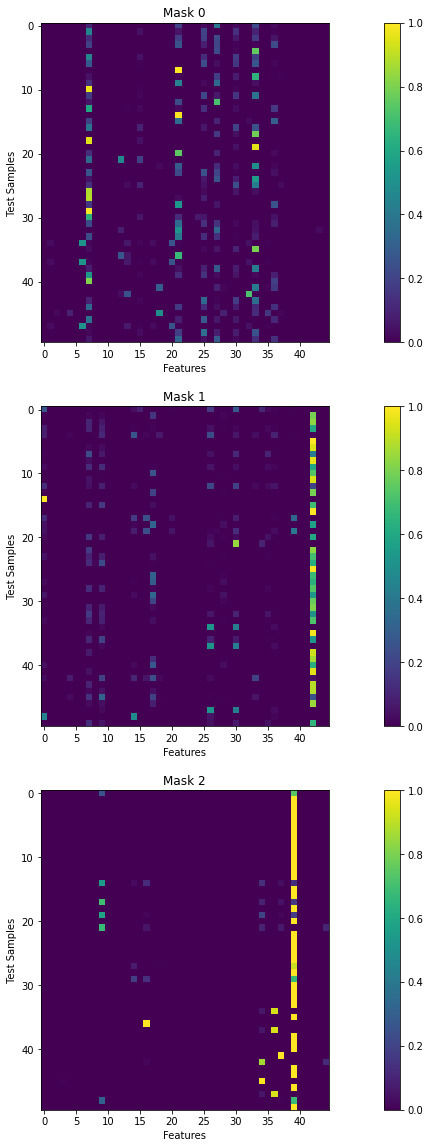
To learn global feature importance with TabNet, we conducted a small experiment by simply converting the graph dataset into tabular data. Our task is to predict if two nodes match and hence in our tabular data we had 146 features (73 for the left entity and 73 for the right) and 67391 entries. Since multiple features consisted entirely of NULL values, they were dropped. Furthermore, we dropped features with less than 500 non-null values. Wholly distinct attributes were dropped since they were unlikely to contribute to the prediction. Even then our dataset ended up with 120 features (60 for each entity).
We then trained the TabNet model using the ground truth (match, no_match) from our graph dataset. The model achieved a test accuracy of 0.8708, a valid_auc score of 0.93617 and the loss was 0.27686. We were also able to obtain the feature importance information from TabNet using masks as shown in Figure 2(b). In this figure, X-axis denotes different features and Y axis denotes the samples. Mask i implies feature selection at i-th step. Brighter the color, the higher the feature importance.
Although we did not have human annotations to validate the feature importance as produced by TabNet, we observe that this kind of output could be useful for training better GNN models. Pruning the node features could also lead to better explanations.
3 Sliding window for explanations
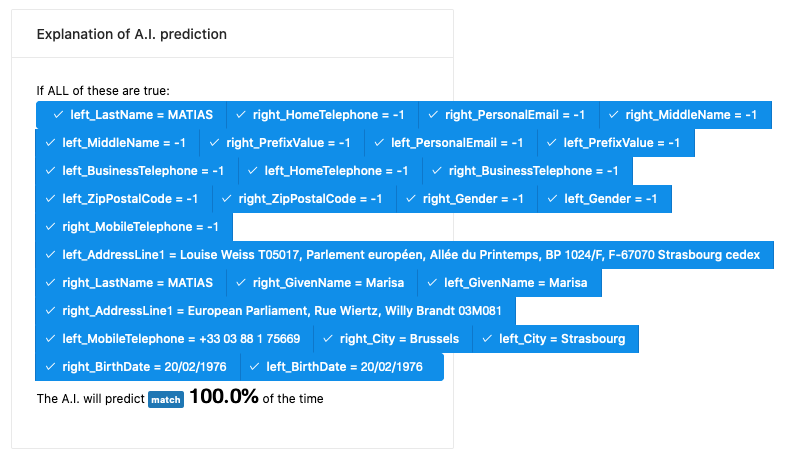
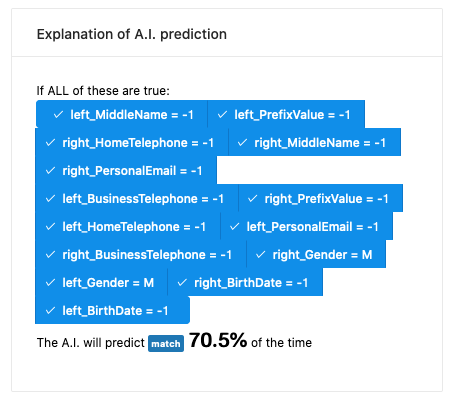
The next aspect of explainability we find useful is what can be called as the sliding window on accuracy as done in Anchors (Ribeiro et al., 2018). Consider the Figures 3 and 4. Both are explanations from Anchors for the entity matching task. The explanation in Figure 3 is when we ask the explainability technique to assume 100% model accuracy. Naturally for a model to predict at higher accuracy, it may have to learn lot more features, and hence the explanations may also be quite noisy. If on the other hand, we ask for explanations at a lower accuracy, as shown in Figure 4, we might be able to understand the predictions better.
Although the explanations on our toy dataset are not that meaningful, we observe that this ability to view explanations at different accuracy levels could be useful in GNN explanations. However, we hasten to add that explanations using methods like GNN Explainer take non-trivial time in some cases, and an interactive setup to consume explanations at different accuracy levels will be lot harder to implement in GNN explanations.
4 Logical explanations
Figure 6 is the explanation subgraph produced by GNN Explainer (Ying et al., 2019). Many other works have followed this output format but with improvements in the techniques.
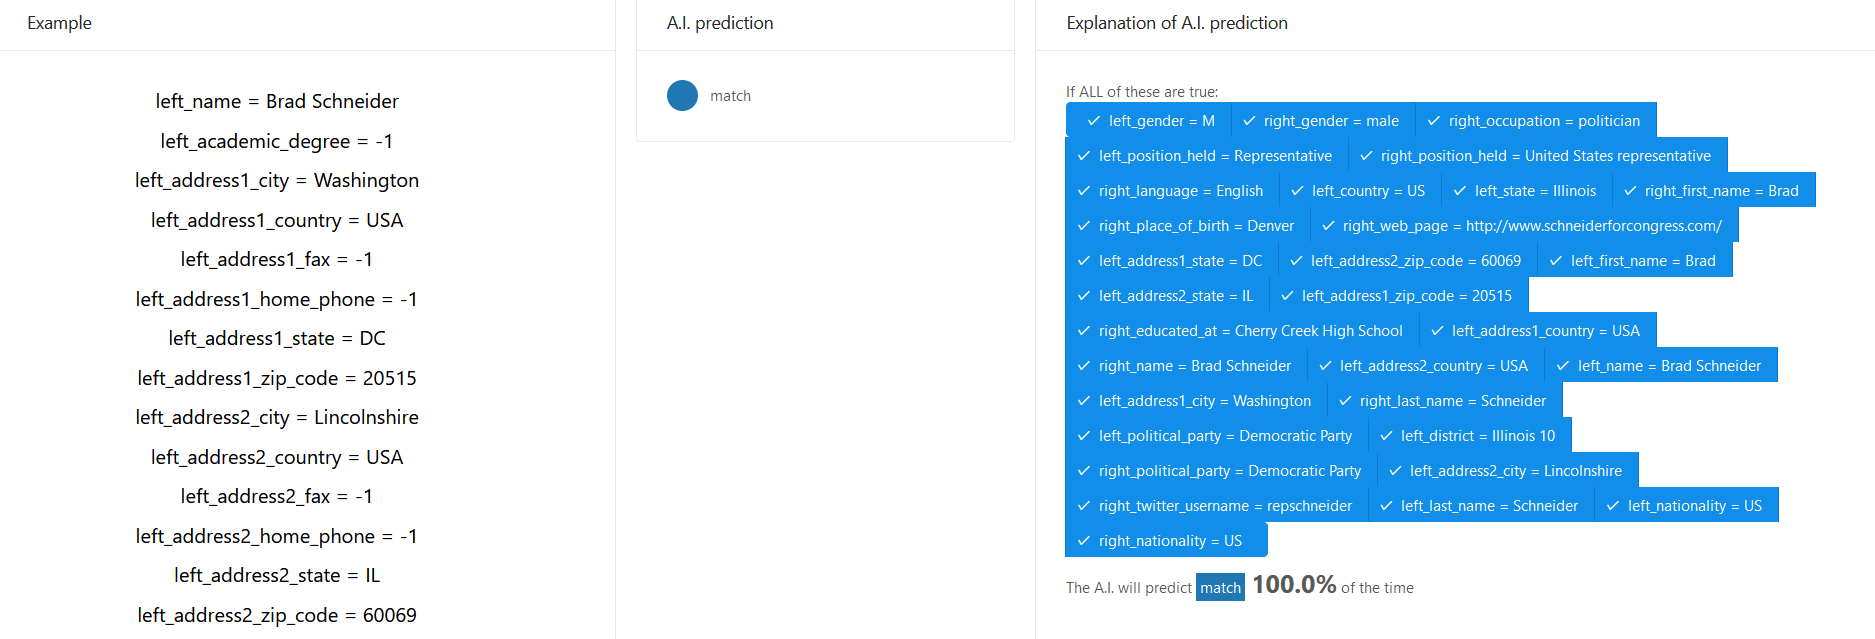
Now consider the Anchors explanation in Figure 5. It displays the input, the prediction and an explanation for a given accuracy rate. We believe these kind of logical explanations are more intuitive than graphs in certain cases. Perhaps both the graph visualization and logical explanation could be used together.
Conclusion
In this work, we presented three key aspects of explainability techniques from tabular data that could be adopted to Graph Neural Network explanations. We showed example explanations from GNN Explainer, SHAP, TabNet, and Anchors to illustrate our observations.
Acknowledgements
This work was done as part of the Global Remote Mentorship initiative of IBM University Relations. We thank Poornima Iyengar, Prof. Balachandra, and Manipal Institute of Technology, Manipal, India for their support. We thank Lokesh Nagalapatti for the discussions.
References
- Arik & Pfister (2019) Arik, S. Ö. and Pfister, T. Tabnet: Attentive interpretable tabular learning. CoRR, 2019.
- BK et al. (2021) BK, V., Ganesan, B., Saxena, A., Sharma, D., and Agarwal, A. Towards automated evaluation of explanations in graph neural networks, 2021.
- Ganesan et al. (2020a) Ganesan, B., Mishra, G., Parkala, S., Singh, N. R., Patel, H., and Naganna, S. Link prediction using graph neural networks for master data management. arXiv preprint arXiv:2003.04732, 2020a.
- Ganesan et al. (2020b) Ganesan, B., Patel, H., and Mehta, S. Explainable link prediction for privacy-preserving contact tracing. arXiv preprint arXiv:2012.05516, 2020b.
- Lundberg & Lee (2017) Lundberg, S. M. and Lee, S.-I. A unified approach to interpreting model predictions. In Advances in neural information processing systems, pp. 4765–4774, 2017.
- Ribeiro et al. (2016) Ribeiro, M. T., Singh, S., and Guestrin, C. ” why should i trust you?” explaining the predictions of any classifier. In Proceedings of the 22nd ACM SIGKDD international conference on knowledge discovery and data mining, pp. 1135–1144, 2016.
- Ribeiro et al. (2018) Ribeiro, M. T., Singh, S., and Guestrin, C. Anchors: High-precision model-agnostic explanations. In Thirty-Second AAAI Conference on Artificial Intelligence, 2018.
- Schlichtkrull et al. (2020) Schlichtkrull, M. S., De Cao, N., and Titov, I. Interpreting graph neural networks for nlp with differentiable edge masking. arXiv preprint arXiv:2010.00577, 2020.
- Vannur et al. (2020) Vannur, L. S., Nagalapatti, L., Ganesan, B., and Patel, H. Data augmentation for personal knowledge graph population. arXiv preprint arXiv:2002.10943, 2020.
- Vu & Thai (2020) Vu, M. N. and Thai, M. T. Pgm-explainer: Probabilistic graphical model explanations for graph neural networks, 2020.
- Ying et al. (2019) Ying, Z., Bourgeois, D., You, J., Zitnik, M., and Leskovec, J. Gnnexplainer: Generating explanations for graph neural networks. In Advances in neural information processing systems, pp. 9244–9255, 2019.
- Yuan et al. (2020) Yuan, H., Tang, J., Hu, X., and Ji, S. Xgnn: Towards model-level explanations of graph neural networks. In Proceedings of the 26th ACM SIGKDD International Conference on Knowledge Discovery & Data Mining, pp. 430–438, 2020.
- Yuan et al. (2021) Yuan, H., Yu, H., Wang, J., Li, K., and Ji, S. On explainability of graph neural networks via subgraph explorations. arXiv preprint arXiv:2102.05152, 2021.
- Zhang et al. (2017) Zhang, Y., Zhong, V., Chen, D., Angeli, G., and Manning, C. D. Position-aware attention and supervised data improve slot filling. In Proceedings of the 2017 Conference on Empirical Methods in Natural Language Processing, pp. 35–45, 2017.
- Zhu et al. (2019) Zhu, R., Zhao, K., Yang, H., Lin, W., Zhou, C., Ai, B., Li, Y., and Zhou, J. Aligraph: A comprehensive graph neural network platform. arXiv preprint arXiv:1902.08730, 2019.