MuseumViz - Towards Visualizing Online Museum Collections
Abstract.
Despite the growth of online museums for India’s cultural heritage data, there is limited increase in terms of visitors. Over the years, online museums adopted many techniques to improve the overall user experience. However, many Indian online museums display artifacts as lists and grids with basic search functionality, making it less visually appealing and difficult to comprehend. Our work aims to enhance the user experience of accessing Indian online museums by utilizing advancements in information visualization. Hence, we propose MuseumViz, a framework which processes data from online museums and visualizes it using four different interactive visualizations: the Network Graph, TreepMap, Polygon Chart and SunBurst Chart. We demonstrate MuseumViz on a total of 723 cultural heritage artifacts present in the Archaeological Survey of India, Goa. Based on our evaluation with 25 users, about 83% of them find it easier and more comprehensible to browse cultural heritage artifacts through MuseumViz.
1. Introduction
In light of recent digitization, we have witnessed the growth of online museums that showcase the diverse cultural heritage collections taken from galleries, libraries, archives and museums (Windhager et al., 2018). By displaying the information about the cultural heritage artifacts, these online museums help promote these artifacts to a broader range of audiences (Styliani et al., 2009). Researchers have used various technical advances to improve the overall user experience, such as displaying cultural heritage information through mixed reality (Gheorghiu and Ştefan, 2014) and 3D modelling (Thudt et al., 2012). For instance, DIVE (De Boer et al., 2015) makes use of Linked Data which allows users to search for cultural heritage artifacts through links between historical objects and events. Tietz et al. utilize knowledge graphs to deal with sparse meta-data in historic collections (Tietz et al., 2020).
In order to make online museums more interactive, researchers have used information visualization techniques to display the numerous cultural heritage artifacts in a more interactive and comprehensible way to the users (Cecotti et al., 2020)(Windhager et al., 2018). To visualize the extensive collections of cultural heritage artifacts, online museums have developed new types of web-based interfaces (Kalay et al., 2007)(Parry, 2007). These interfaces leverage information visualization methods such as integrating Maps (Simon et al., 2016), and slideshows (Crissaff et al., 2017) to enhance the user experience and allow for a better comprehension of the cultural heritage artifacts by the users (Windhager et al., 2018). The various visualization techniques enable the users to view the data with different perspectives (Sula, 2013)(Dörk et al., 2017). For instance, Histograph combines the timeline view with histograms targeting the relations between people, places and events (Novak et al., 2014). Some of the other temporal approaches include combining timelines with Ring charts (Deufemia et al., 2012) and ontologies (Damiano et al., 2015). Similar interfaces for non-temporal cultural heritage data utilize plots (Algee et al., 2012), sets (Crockett, 2016), and networks (Windhager et al., 2018).
In India, several steps towards digitization have been undertaken for the preservation of cultural heritage artifacts present in museums and galleries across the country 111The National Portal of Museum for India: http://museumsofindia.gov.in/repository/. The Digital Library of India initiative attempts to digitize one million textual artifacts, including but not limited to books, journals, and manuscripts and make them accessible to users all over the world (Joshi, 2006). A similar attempt to digitize cultural heritage artifacts across 11 National Museums of India was done by Centre for Development of Advanced Computing, India (C-DAC)222Centre for Development of Advanced Computing, India: https://www.cdac.in/index.aspx?id=mc_hc_jatan_virtual_museum. C-DAC developed the National Portal of Museum for India in which the cultural heritage artifacts are displayed in the form of grids and can be browsed through simple keyword searches. However, a limitation to this approach is that the user has to search and browse through a large number of catalogued cultural heritage artifacts that are often displayed as long lists and grids.
While there are several visualization solutions for museums across the globe, each of them is either region-specific, or target individual museums (Dörk et al., 2017) and are not available for Indian online museums. Even though it is possible to develop a tool for a single museum in India, it is effort-intensive to develop separate tools for 11 National Museums and multiple other museums 333City wise museums in India: https://www.museumsofindia.org/. Hence, there is a need to automate the process. We believe that the digitization of India’s cultural heritage can be accelerated by utilizing the advances made in the representation of cultural heritage artifacts in the literature. For example, visualizing the relationship among different artifacts based on the textual information present in the Indian National Portal could help museum enthusiasts gain broader insights about multiple artifacts in the museum. Therefore, in this paper, we propose MuseumViz, a framework that helps to visualize cultural heritage data in interactive ways to users and can be used for multiple Indian museums444MuseumViz demo: https://museum-visualization.herokuapp.com. The contributions of this paper are:
-
•
Visualization - MuseumViz renders text-heavy cultural heritage data into four different visualizations: Network Graph, TreeMap, SunBurst Chart, and Polygon Chart focusing on different aspects of data such as connectivity and hierarchy.
-
•
Automation - The framework streamlines the process of collecting data from online museums and ultimately converting them into multiple data-driven visualizations for the users.
To demonstrate the framework, we automatically generate four different visualizations for the Archaeological Survey of India, Goa555Archaeological Survey of India, Goa: http://museumsofindia.gov.in/repository/museum/gom_goa which has a total of 723 cultural heritage artifacts. We show that the collections from it can be utilized to generate interactive visualizations for the users. We surveyed 25 users, asking them to compare their experience of using MuseumViz against using the National Portal of India. The results show that by using MuseumViz, 83% of the users experienced a better overall user experience than using the existing web portal.
2. Design and Development of MuseumViz
2.1. Design Decisions
MuseumViz is a framework that facilitates the interactive visualization of cultural heritage artifacts of existing collections taken from online museums and archives. MuseumViz framework is modular, which allows easy modifications for targeting multiple online museums and allowing the integration of different types of visualizations.
We focus on multiple visualizations to allow the data to be comprehended in different perspectives. MuseumViz renders the data in four different visualizations: the Network Graph, TreepMap, SunBurst Chart and Polygon Chart, each targeting different aspects of the cultural heritage data as shown in Table 1. The interactive nature of these visualizations enables the users to navigate the artifacts based on different dimensions of the data with ease. Origin Place, Object Type, Dynasty and Material are the different dimensions that MuseumViz draws from the meta-data.
| Visualization | Target aspect in the museum data |
|---|---|
| Network Graph | Focuses on connections between various artifacts present in the data |
| TreeMap | Focuses on classification of cultural heritage artifacts |
| SunBurst Chart | Deals with the proportionality of the cultural heritage data based on the classifications |
2.2. Development
We developed the MuseumViz framework as two different components that can generate interactive visualizations from online cultural heritage collections when invoked in a pipelined manner, as shown in Fig. LABEL:fig:tool_arch. Data Processor and Visualizer are the two main components of MuseumViz. Data Processor pertains to the collection and processing of data, whereas the Visualizer component deals with displaying interactive browser-based visualizations.
2.2.1. Data Processor
The Data Processor component is designed to collect data from existing online museums and then forward the processed data to the visualization module. It takes the target website and its blueprint and generates JSON files containing the data of all the cultural heritage artifacts. Data Processor then processes the JSON files to convert them into input files specific to each visualization. The development of this module is done in python and a combination of selenium666Selenium library: https://pypi.org/project/selenium/ and BeautifulSoup4777BeautifulSoup4 library: https://pypi.org/project/beautifulsoup4/ libraries. The current design of this component targets the National Portal of Museum for India developed by C-DAC. This component can be modified to target other online museums.
2.2.2. Visualizer
The Visualizer component is developed as a standalone web application using Flask888Flask framework: https://pypi.org/project/Flask/ and Javascript999Javascript: https://www.javascript.com/. Visualizer takes the processed JSON files from the data processor and generates browser-based visualizations. The web interface renders the cultural heritage data into four different visualizations as mentioned in Table 1, each showing various aspects of the data. The interface enables the users to switch between the available visualizations using a drop-down menu. The Network Graph is developed using Vis.js 101010VisJs library: https://visjs.org, a browser-based visualization library. The TreeMap, SunBurst Chart and Polygon Chart are developed using Anychart111111Anychart library: https://www.anychart.com, which is a lightweight browser based charting library. These visualizations are created as separate sub-modules and are highly modular. Hence the framework can be easily updated and modified to accommodate different visualizations using different existing APIs.
3. User Scenario
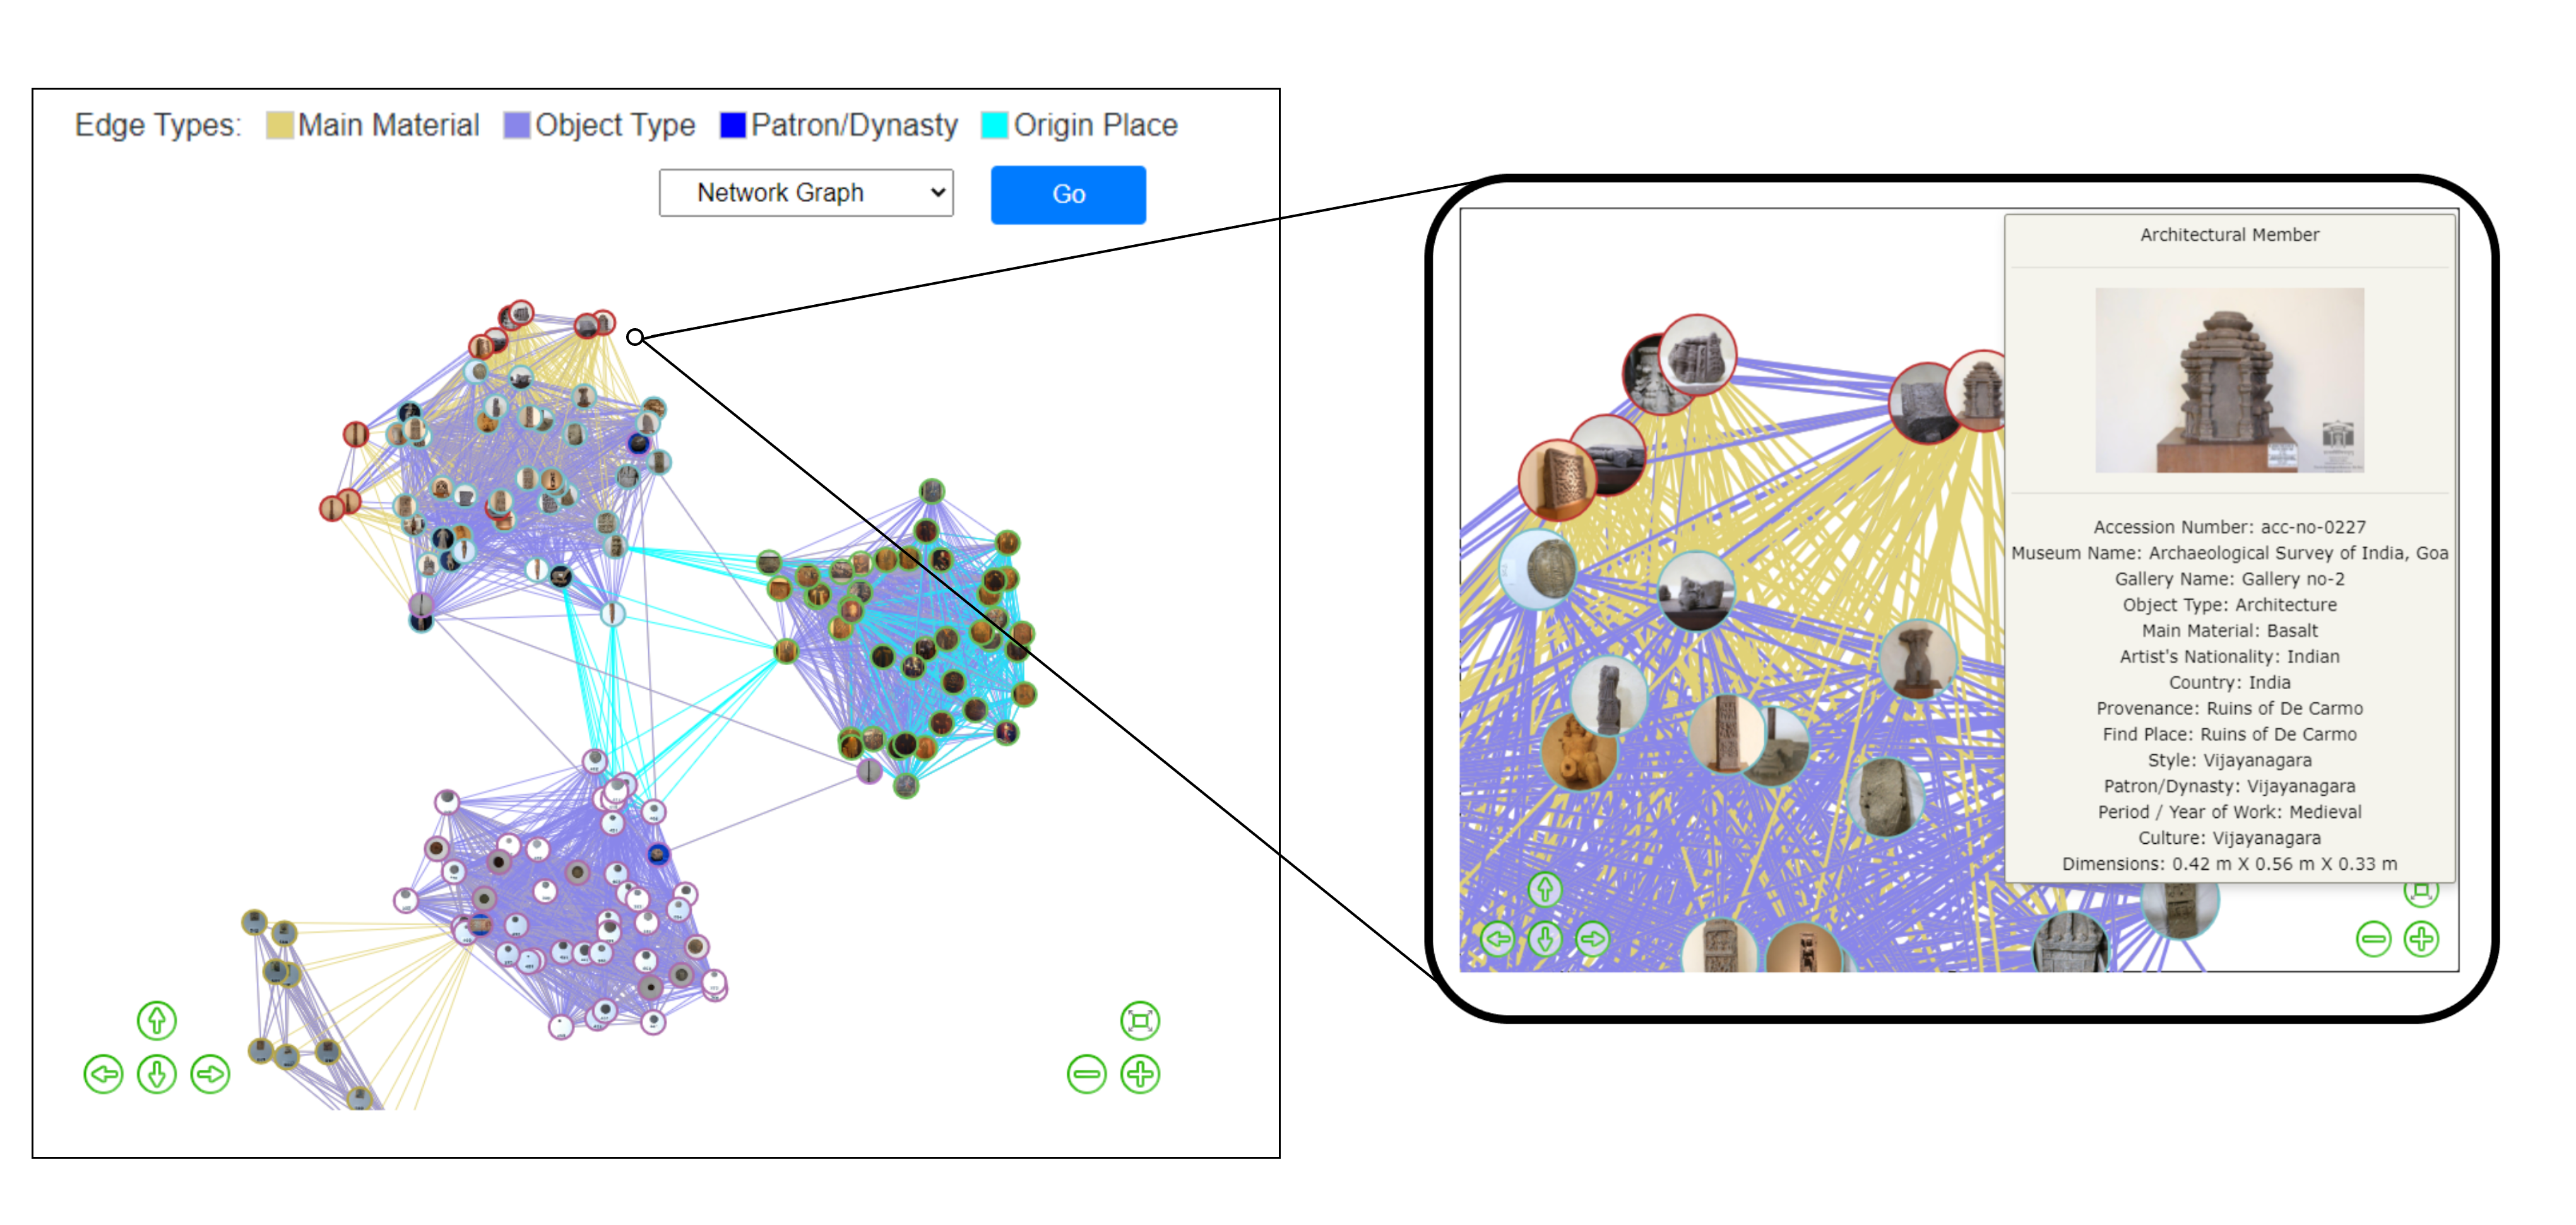
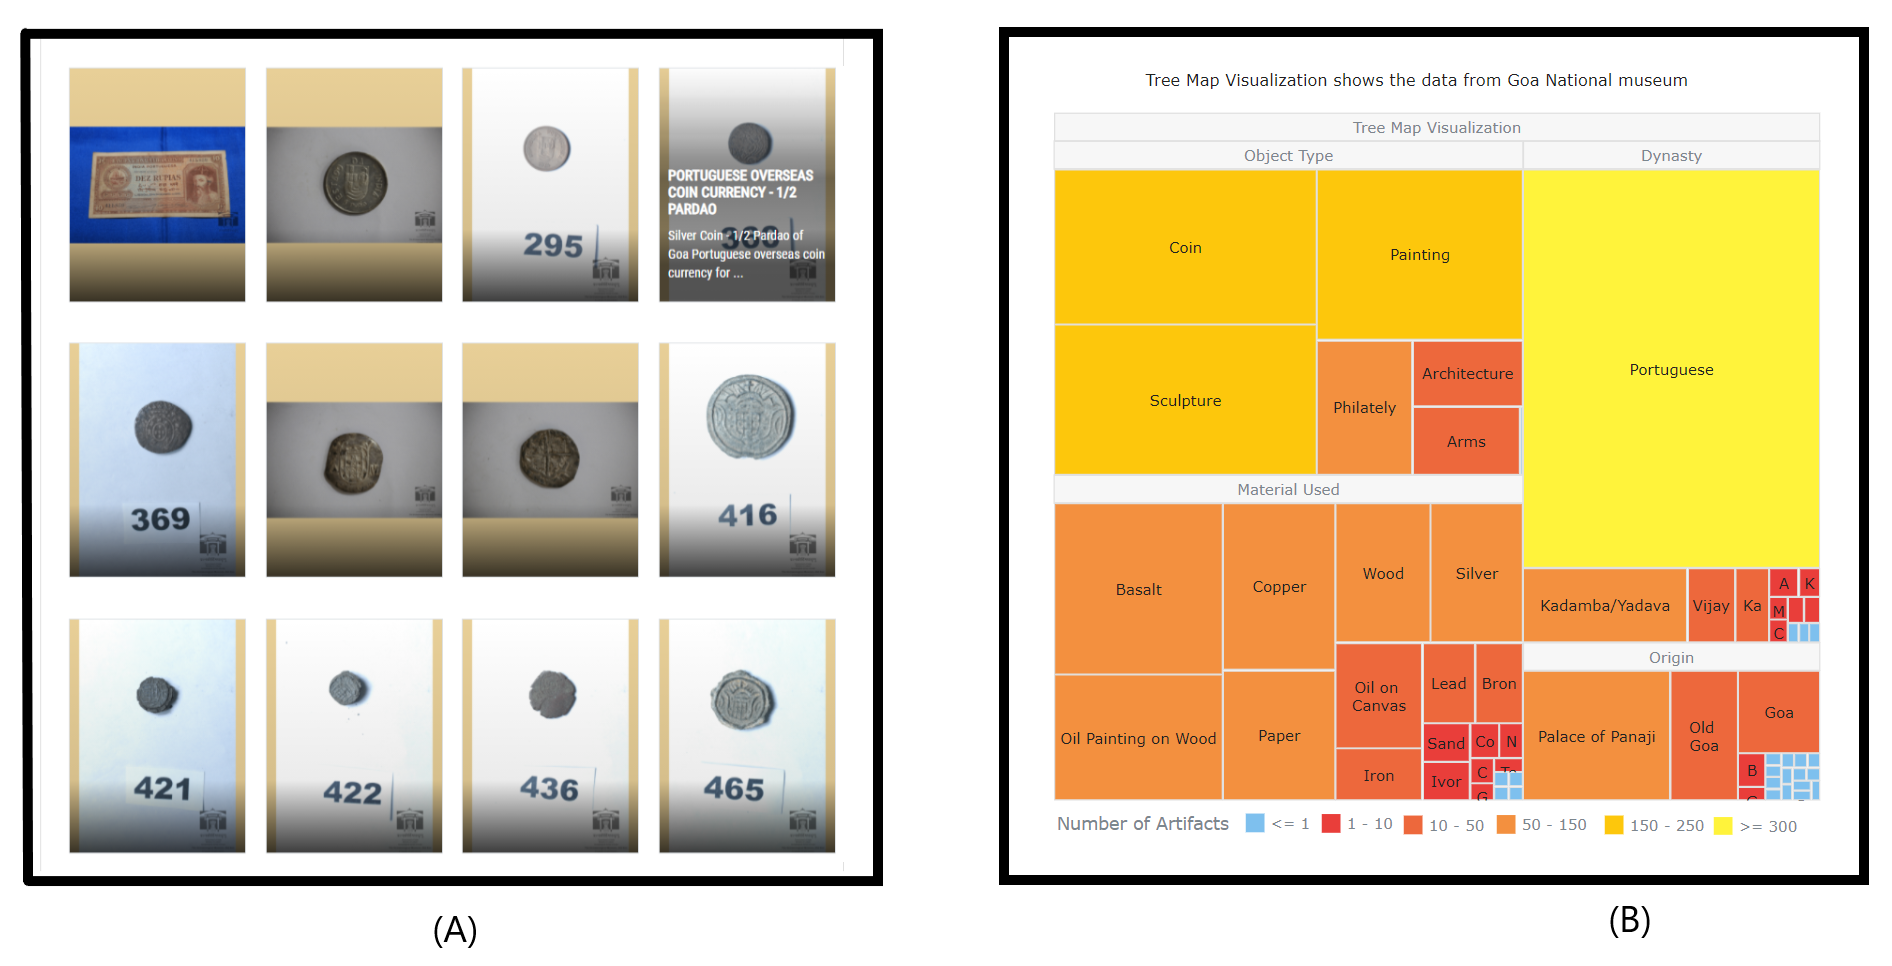
Consider the following situation, Moksha is a university student who wants to write a report about the various cultural heritage artifacts present in the National Museum of Goa. Moksha visits the National Portal of Museum for India by C-DAC to learn about the cultural artifacts hosted at the National Museum of Goa. Even though she can find all the artifacts in the portal, she finds it challenging to navigate various artifacts based on their meta-data. Moksha comes across the MuseumViz’s visualization interface, which has already collected data about the various artifacts from the National Portal. At the landing page of the portal, Moksha is prompted to select a specific visualization. She chooses the Network Graph to understand the connections among different cultural heritage artifacts. Moksha is now shown all the artifacts as nodes and different types of edges where each edge depicts a certain kind of connection among the artifacts based on the dimensions as illustrated in Fig. 1. Moksha now decides to learn about the hierarchy of artifacts based on different dimensions in the data. Moksha now selects the TreeMap, which shows different levels of classification of artifacts based on the meta-data, as depicted in Fig. 2. She can go deeper through the layers until she finds individual items based on the classification. Similarly, Moksha uses the SunBurst Chart and the Polygon Chart to visualize and understand the distribution of data in different forms.
4. Evaluation and Results
The main aim of developing MuseumViz is to improve the user experience for visitors of online museums by displaying various visualizations based on the relationships among multiple artifacts in the museum. Hence, we evaluate MuseumViz to understand the usefulness and user experience, as perceived by the users. Models such as Technology Acceptance Model (TAM), Unified Theory of Acceptance and Use of Technology (UTAUT), Innovation Diffusion Theory (IDT) and so on support evaluation of a technological intervention through a questionnaire-based user survey that comprises of various dimensions which include usability, usefulness and ease of use (Venigalla and Chimalakonda, 2020; Attuquayefio and Addo, 2014). Existing technological innovations aimed towards improving user experience and usefulness have been evaluated using multiple adapted versions of these models, based on the nature of the innovation (Oshlyansky et al., 2007; Attuquayefio and Addo, 2014; Venigalla and Chimalakonda, 2020). UTAUT model (Venkatesh et al., 2003) deals with effort expectancy (EE), performance expectancy (PE), social influence (SI) and facilitating conditions (FC), which are influenced by gender, age, experience and voluntariness of use, and is also observed to be adapted for evaluation of technological interventions in museums (Kontiza et al., 2018; Chen and Huang, 2012). Considering the need for MuseumViz to support a wide range of audience, irrespective of gender, age and experience, we observe the UTAUT model is a better fit for evaluating MuseumViz. Hence, we conduct a user survey, using a 5-point Likert scale-based questionnaire designed to fit MuseumViz evaluation aspects by adapting the UTAUT questionnaire. We also included other questions to understand the demographics of the users, such as age, gender and number of times they visited physical museums. We sent out the survey forms to 50 individuals with varied educational and professional backgrounds. 25 of these individuals have responded to the survey.
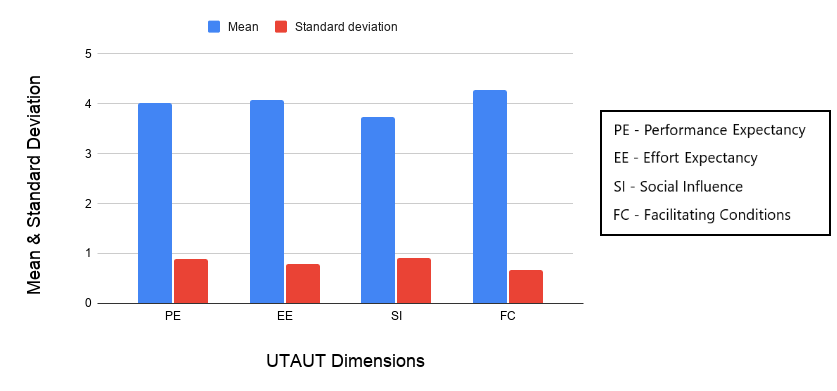
As we demonstrated the MuseumViz framework for Archeological Survey of India, Goa121212http://museumsofindia.gov.in/repository/museum/gom_goa, we requested all the participants of the survey to visit an online museum before responding to the survey. This is to ensure that the participants can distinguish between the visualizations being displayed by MuseumViz from regular artifacts displayed by the museum. The questionnaire used and anonymized responses of the participants are presented here131313https://bit.ly/3sdgQhh. Based on the responses to the survey’s demographic questions, we observe that 10 of the participants were female, and 15 of them were male. There were six participants in the age group 15-20, 15 participants in the age group 20-25, two participants with age group ¿35 and one participant each in age groups 25-30 and ¡15. Among the 25 participants, 18 participants have visited physical museums more than once, two have visited once, and 5 have never visited physical museums. The results of the user survey as presented in Fig. 3, display higher mean values (¿3.5), and lower standard deviation values (¡1) for all dimensions, indicating that majority of the participants found MuseumViz to be easy to use, useful and interesting, thus implying improved user experience. The mean 4.02 and standard deviation 0.88 for the performance expectancy (PE) dimension indicate that most participants had a common notion that MuseumViz is useful and has increased their productivity. MuseumViz was observed to be easy to use, with the majority of the participants responding positively (mean = 4.06 and standard deviation = 0.78) to the questions based on effort expectancy (EE) dimension. Mean values for social influence (SI) and facilitating conditions (FC) dimensions are 3.74 and 4.27, respectively, with standard deviations equal to 0.91 and 0.66 for each of the dimensions. This indicates the willingness and possibility of participants to use MuseumViz, which consequently indicates that MuseumViz satisfies the goal of improving user experience to a considerable extent.
5. Related Work
Online museums facilitate the transmission of cultural heritage knowledge to a wide range of audience (Styliani et al., 2009)(Aiello et al., 2019). However, studies also indicated that basic online websites might not attract more audience and suggest exploring solutions to make virtual museums more interactive (Fenu and Pittarello, 2018). One of the solutions suggested by Hinton et al. is to leverage techniques from the information visualization domain to make online museums interactive, and exploratory access to cultural heritage data (Whitelaw and Hinton, 2010). Researchers have leveraged techniques such as storytelling/narration (Carrozzino et al., 2018)(Swensen and Nomeikaite, 2019), augmented reality (Venigalla and Chimalakonda, 2019)(Geronikolakis et al., 2020), and virtual reality (Cecotti et al., 2020)(Jones and Alba, 2019) to make online museums interactive and more appealing to the users. Multiple visualization techniques such as usage of plots (Algee et al., 2012), clusters and sets (Crockett, 2016), geographical maps (Dumas et al., 2014) and networks (Windhager et al., 2018) have also been utilized in the development of online museums.
In a survey by Windhager et al. (Windhager et al., 2018), around 80% of the online museums utilize more than one visualization, as using a single visualization leads to over-complication of the visual representation of cultural heritage data (Mauri et al., 2013). To address this problem Mauri et al. (Mauri et al., 2013) have developed a platform that integrates different types of entities and allows users to switch between different visualizations types coherently. Similarly, Kerracher et al. (Kerracher et al., 2014) present a platform in which the user can select and switch between visualizations for different tasks such as browsing and searching of artifacts.
These existing information visualization solutions are limited to individual museums or collection of museums over specific regions (Pescarin, 2014)(Terras et al., 2017); however, they are not available for India. For example, the National Portal of Museum for India introduces its cultural heritage through digital collections from 11 different National Museums across India. However, it uses a simple grid-based system to display the artifacts. The web portal focuses on showing the museum’s objects as a list of categories and enables the searching of artifacts through keyword-based approach. The web portal also displays single object previews, which capture all the relevant textual metadata of a single artifact and displays it to the user.
Fig 2.A shows the interface of the National Portal of Museum for India. In contrast, by using multiple visualization techniques, the interface of MuseumViz looks more appealing and informative as shown by the TreeMap in the Fig 2.B. The TreeMap presents the data in a hierarchical manner based on different dimensions extracted from the data. To this end, the goal of MuseumViz is to act as a framework that can leverage multiple visualization techniques to improve the user experience and generalize this process for Indian online museums.
6. Conclusion and Future Work
Incorporating better visualization techniques in online museums provides the users with more insights about the cultural heritage data and improves their overall experience. The National Portal of Museum for India, developed by C-DAC, hosts cultural heritage artifacts from 11 different National Museums. However, it lacks the visual appeal that can help the users comprehend a large collection of cultural heritage artifacts. In this paper, we presented MuseumViz, a framework specifically for enhancing Indian cultural heritage web portals using interactive visualizations. The framework uses four different visualizations; the Network Graph, the TreeMap, the SunBurst Chart and the Polygon Chart, each targeting a different aspect of the cultural heritage data. We used the framework on the online museum of the Archaeological Survey of India, Goa, for demonstration. A total of 723 artifacts were collected from the portal and displayed using the four visualizations. The evaluation of the framework was done with a pool of 25 users through a remote survey. The results of the user survey with 25 users show that about 83% of users prefer using MuseumViz for browsing cultural heritage artifacts over the traditional web portal.
As part of the future work, we plan to incorporate different kinds of visualizations in the framework, providing additional perspectives to the cultural heritage data. The visualization interface is currently supported by desktop browsers. It can be further extended to support other devices such as mobile phones. We also plan to improve the framework to support a wide range of museum websites designed in different formats. This could be achieved by implementing appropriate machine learning and natural language processing-based approaches to detect and extract meta-data of the artifacts, irrespective of the structure of the website.
References
- (1)
- Aiello et al. (2019) D Aiello, Stephen Fai, and C Santagati. 2019. VIRTUAL MUSEUMS AS A MEANS FOR PROMOTION AND ENHANCEMENT OF CULTURAL HERITAGE. International Archives of the Photogrammetry, Remote Sensing & Spatial Information Sciences (2019).
- Algee et al. (2012) Lauren Algee, Jefferson Bailey, and Trevor Owens. 2012. Viewshare and the kress collection: Creating, sharing, and rapidly prototyping visual interfaces to cultural heritage collection data. D-Lib Magazine 18, 11 (2012), 3.
- Attuquayefio and Addo (2014) Samuel Attuquayefio and Hillar Addo. 2014. Using the UTAUT model to analyze students’ ICT adoption. International Journal of Education and Development using ICT 10, 3 (2014).
- Carrozzino et al. (2018) Marcello Carrozzino, Marianna Colombo, Franco Tecchia, Chiara Evangelista, and Massimo Bergamasco. 2018. Comparing different storytelling approaches for virtual guides in digital immersive museums. In International Conference on Augmented Reality, Virtual Reality and Computer Graphics. Springer, 292–302.
- Cecotti et al. (2020) Hubert Cecotti, Zachary Day-Scott, Laura Huisinga, and Luis Gordo-Pelaez. 2020. Virtual Reality for Immersive Learning in Art History. In 2020 6th International Conference of the Immersive Learning Research Network (iLRN). IEEE, 16–23.
- Chen and Huang (2012) Chia-Chen Chen and Tien-Chi Huang. 2012. Learning in a u-Museum: Developing a context-aware ubiquitous learning environment. Computers & Education 59, 3 (2012), 873–883.
- Crissaff et al. (2017) Lhaylla Crissaff, Louisa Wood Ruby, Samantha Deutch, R Luke DuBois, Jean-Daniel Fekete, Juliana Freire, and Claudio Silva. 2017. ARIES: enabling visual exploration and organization of art image collections. IEEE computer graphics and applications (2017).
- Crockett (2016) Damon Crockett. 2016. Direct visualization techniques for the analysis of image data: the slice histogram and the growing entourage plot. International Journal for Digital Art History 2 (2016).
- Damiano et al. (2015) Rossana Damiano, Vincenzo Lombardo, and Antonio Lieto. 2015. Visual metaphors for semantic cultural heritage. In 2015 7th International Conference on Intelligent Technologies for Interactive Entertainment (INTETAIN). IEEE, 100–109.
- De Boer et al. (2015) Victor De Boer, Johan Oomen, Oana Inel, Lora Aroyo, Elco Van Staveren, Werner Helmich, and Dennis De Beurs. 2015. DIVE into the event-based browsing of linked historical media. Journal of Web Semantics 35 (2015), 152–158.
- Deufemia et al. (2012) Vincenzo Deufemia, Luca Paolino, Genoveffa Tortora, A Traverso, Viviana Mascardi, Massimo Ancona, Maurizio Martelli, Nicoletta Bianchi, and Henry De Lumley. 2012. Investigative analysis across documents and drawings: visual analytics for archaeologists. In Proceedings of the international working conference on advanced visual interfaces. 539–546.
- Dörk et al. (2017) Marian Dörk, Christopher Pietsch, and Gabriel Credico. 2017. One view is not enough: High-level visualizations of a large cultural collection. Information Design Journal 23, 1 (2017), 39–47.
- Dumas et al. (2014) Bruno Dumas, Bram Moerman, Sandra Trullemans, and Beat Signer. 2014. ArtVis: combining advanced visualisation and tangible interaction for the exploration, analysis and browsing of digital artwork collections. In Proceedings of the 2014 International Working Conference on Advanced Visual Interfaces. 65–72.
- Fenu and Pittarello (2018) Cristina Fenu and Fabio Pittarello. 2018. Svevo tour: The design and the experimentation of an augmented reality application for engaging visitors of a literary museum. International Journal of Human-Computer Studies 114 (2018), 20–35.
- Geronikolakis et al. (2020) Efstratios Geronikolakis, Paul Zikas, Steve Kateros, Nick Lydatakis, Stelios Georgiou, Mike Kentros, and George Papagiannakis. 2020. A True AR Authoring Tool for Interactive Virtual Museums. In Visual Computing for Cultural Heritage. Springer, 225–242.
- Gheorghiu and Ştefan (2014) Dragoş Gheorghiu and Livia Ştefan. 2014. 3D Online Virtual Museum as e-Learning Tool-A Mixed Reality Experience. In International Conference on Computer Supported Education, Vol. 2. SCITEPRESS, 379–388.
- Jones and Alba (2019) Greg Jones and Adriana D Alba. 2019. Reviewing the effectiveness and learning outcomes of a 3D virtual museum: A pilot study. In Virtual Reality in Education: Breakthroughs in Research and Practice. IGI Global, 52–75.
- Joshi (2006) Govind Joshi. 2006. Digital Library Initiative in North East India With Special Reference to Tocklai Experimental Station: A Case Study. (2006).
- Kalay et al. (2007) Yehuda Kalay, Thomas Kvan, and Janice Affleck. 2007. New heritage: new media and cultural heritage. Routledge.
- Kerracher et al. (2014) Natalie Kerracher, Jessie Kennedy, and Kevin Chalmers. 2014. The Design Space of Temporal Graph Visualisation.. In EuroVis (Short Papers).
- Kontiza et al. (2018) Kalliopi Kontiza, Olga Loboda, Louis Deladiennee, Sylvain Castagnos, and Yannick Naudet. 2018. A museum app to trigger users’ reflection. In International Workshop on Mobile Access to Cultural Heritage (MobileCH2018).
- Mauri et al. (2013) Michele Mauri, Azzurra Pini, Daniele Ciminieri, and Paolo Ciuccarelli. 2013. Weaving data, slicing views: a design approach to creating visual access for digital archival collections. In Proceedings of the Biannual Conference of the Italian Chapter of SIGCHI. 1–8.
- Novak et al. (2014) Jasminko Novak, Isabel Micheel, Mark Melenhorst, Lars Wieneke, Marten Düring, Javier Garcia Morón, Chiara Pasini, Marco Tagliasacchi, and Piero Fraternali. 2014. HistoGraph–A visualization tool for collaborative analysis of networks from historical social multimedia collections. In 2014 18th International Conference on Information Visualisation. IEEE, 241–250.
- Oshlyansky et al. (2007) Lidia Oshlyansky, Paul Cairns, and Harold Thimbleby. 2007. Validating the Unified Theory of Acceptance and Use of Technology (UTAUT) tool cross-culturally. In Proceedings of HCI 2007 The 21st British HCI Group Annual Conference University of Lancaster, UK 21. 1–4.
- Parry (2007) Ross Parry. 2007. Recoding the museum: Digital heritage and the technologies of change. Routledge.
- Pescarin (2014) Sofia Pescarin. 2014. Museums and virtual museums in Europe: reaching expectations. SCIRES-IT-SCIentific RESearch and Information Technology 4, 1 (2014), 131–140.
- Simon et al. (2016) Rainer Simon, Leif Isaksen, Elton TE Barker, and Pau de Soto Cañamares. 2016. Peripleo: a tool for exploring heterogenous data through the dimensions of space and time. (2016).
- Styliani et al. (2009) Sylaiou Styliani, Liarokapis Fotis, Kotsakis Kostas, and Patias Petros. 2009. Virtual museums, a survey and some issues for consideration. Journal of cultural Heritage 10, 4 (2009), 520–528.
- Sula (2013) Chris Alen Sula. 2013. Quantifying culture: Four types of value in visualisation. In Electronic Visualisation in Arts and Culture. Springer, 25–37.
- Swensen and Nomeikaite (2019) Grete Swensen and Laima Nomeikaite. 2019. Museums as narrators: heritage trails in a digital era. Journal of Heritage Tourism (2019), 1–19.
- Terras et al. (2017) Melissa Terras, Inna Kizhner, Maxim Rumyantsev, and Kristina Sycheva. 2017. Accessing Russian Culture Online: The scope of digitisation in museums across Russia.. In DH.
- Thudt et al. (2012) Alice Thudt, Uta Hinrichs, and Sheelagh Carpendale. 2012. The bohemian bookshelf: supporting serendipitous book discoveries through information visualization. In Proceedings of the SIGCHI Conference on Human Factors in Computing Systems. 1461–1470.
- Tietz et al. (2020) Tabea Tietz, Jörg Waitelonis, Mehwish Alam, and Harald Sack. 2020. Knowledge Graph based Analysis and Exploration of Historical Theatre Photographs.. In Qurator.
- Venigalla and Chimalakonda (2019) Akhila Sri Manasa Venigalla and Sridhar Chimalakonda. 2019. Towards Enhancing User Experience through a Web-Based Augmented Reality Museum. In 2019 IEEE 19th International Conference on Advanced Learning Technologies (ICALT), Vol. 2161. IEEE, 357–358.
- Venigalla and Chimalakonda (2020) Akhila Sri Manasa Venigalla and Sridhar Chimalakonda. 2020. DynamiQue–a technical intervention to augment static textbook with dynamic Q&A. Interactive Learning Environments (2020), 1–15.
- Venkatesh et al. (2003) Viswanath Venkatesh, Michael G Morris, Gordon B Davis, and Fred D Davis. 2003. User acceptance of information technology: Toward a unified view. MIS quarterly (2003), 425–478.
- Whitelaw and Hinton (2010) M Whitelaw and S Hinton. 2010. Exploring the digital commons: an approach to the visualisation of large heritage datasets. Electronic Visualisation and the Arts (2010).
- Windhager et al. (2018) Florian Windhager, Paolo Federico, Günther Schreder, Katrin Glinka, Marian Dörk, Silvia Miksch, and Eva Mayr. 2018. Visualization of cultural heritage collection data: State of the art and future challenges. IEEE transactions on visualization and computer graphics 25, 6 (2018), 2311–2330.