Quantifying the Impact of Human Capital, Job History, and Language Factors on Job Seniority with a Large-scale Analysis of Resumes.
Abstract.
As job markets worldwide have become more competitive and applicant selection criteria have become more opaque, and different (and sometimes contradictory) information and advice is available for job seekers wishing to progress in their careers, it has never been more difficult to determine which factors in a résumé most effectively help career progression. In this work we present a novel, large scale dataset of over half a million résumés with preliminary analysis to begin to answer empirically which factors help or hurt people wishing to transition to more senior roles as they progress in their career. We find that previous experience forms the most important factor, outweighing other aspects of human capital, and find which language factors in a résumé have significant effects. This lays the groundwork for future inquiry in career trajectories using large scale data analysis and natural language processing techniques.
1. Introduction
Given the increasingly competitive global job market, job seekers are interested in finding the most effective ways to advance their careers with investment in education, skills training, and résumé fine tuning. In this work we present a first-of-its-kind, large-scale analysis of a résumé corpus with 641,170 resumes. We operationalize a large set of factors by utilizing natural language processing (NLP) and data science methods to computationally model how human capital factors (e.g., education, skills), résumé presentation language, and previous experience, jointly predict career transitions into senior positions in order to address the following open research questions:
-
RQ1
How do seniority transitions occur across the workforce over time within people’s careers?
-
RQ2
How does human capital — conceptualized as the accumulation skills, and education — affect seniority transitions?
-
RQ3
How does employment history including gaps between jobs affect seniority transitions?
-
RQ4
How much of an impact does résumé language, style, and presentation have on seniority transitions?
-
RQ5
How do these effects apply across sectors of occupations/jobs?
2. Related Work
2.1. Career Transitions
Career transitions and success have been of great interest in economics (Jovanovic, 1984; Feldman and Ng, 2007) and psychology (Judge et al., 1999; Ng et al., 2005). In computer science, there is growing interest in predicting career transitions and job tenure at the individual level using statistical methods like survival analysis (Li et al., 2017a) and generalized linear models (Xu et al., 2014), as well as neural networks (Li et al., 2017b; Meng et al., 2019). Individuals can be modeled as a sequence of their professional positions, where each position node is indicated by the job title, company, industry, time duration, and keyword summary of the job. (Xu et al., 2014) compute node-level similarity using GLMs and compute user-level similarity by aligning users’ node-level similarity time series. Another body of work considers talent flows in a job transition networks where organizations are represented as nodes and the flow of employees between these organizations is represented by a set of weighted edges (Xu et al., 2016, 2018). Safavi et al. (Safavi et al., 2018) analyze the career trajectories of computer science PhD students, identifying hubs and authorities in the career transition networks, which include movements between employers and also sectors (academia, government, industry). Xu et al. (Xu et al., 2018) used stock market prices to predict changes in the job transition network across time. There is also significant amount of research studying how to develop job recommendation systems (Wang et al., 2013; Kenthapadi et al., 2017; Zhang et al., 2014; Mishra and Reddy, 2016; Shalaby et al., 2017).
2.2. Resume Analysis
In order to study careers on a large scale, résumés form an accessible and comprehensive source of data of job history, human capital, and language framing. Zhang and Wang (Zhang and Wang, 2018) proposed a résumé visualization system, Resumevis, which they use to summarize patterns of career development, compare career trajectories across résumés, find similar résumés, and discover career evolving patterns across time and organizations in the aggregate. Other visualization work has developed standard ways to extract information from CV’s and more easily compare across formatting (Filipov et al., 2019). Additionally there are many resources for résumé writers for proposed best practises. High-quality résumés are free of spelling or grammatical mistakes (Risavy, 2017), and the best résumés are typically short and concise (Helwig, 1985). Furthermore, there is an empirical advantage to using strong active verbs like “built,” “presented,” and “manufactured” instead of vague generalizations or platitudes like “amplified company impact” (Gross et al., 2017; Oliphant and Alexander III, 1982; Stephens et al., 1979). Power and agency verb frames can also connote that the applicant is “decisive” and “capable of pushing forward their own storyline” (Sap et al., 2017). On the other hand, hedge words indicate uncertainty and can weaken the applicant’s rhetorical persuasiveness (Hyland, 2018). Similarly, subjective language (considerably, courageously, crazy, delightful) can weaken a résumé (Riloff and Wiebe, 2003). Professionals expect accomplishments to be linked to concrete outcomes and quantified when possible (Gross et al., 2017). Finally, applicants are expected to avoid using personal pronouns (Horn, 1988), passive voice (Gross et al., 2017), or any overly emotional language (Weaver, 2017).
3. Data
We scraped 635,929 public résumés posted in August 2017 to an online résumé storage and hiring service.
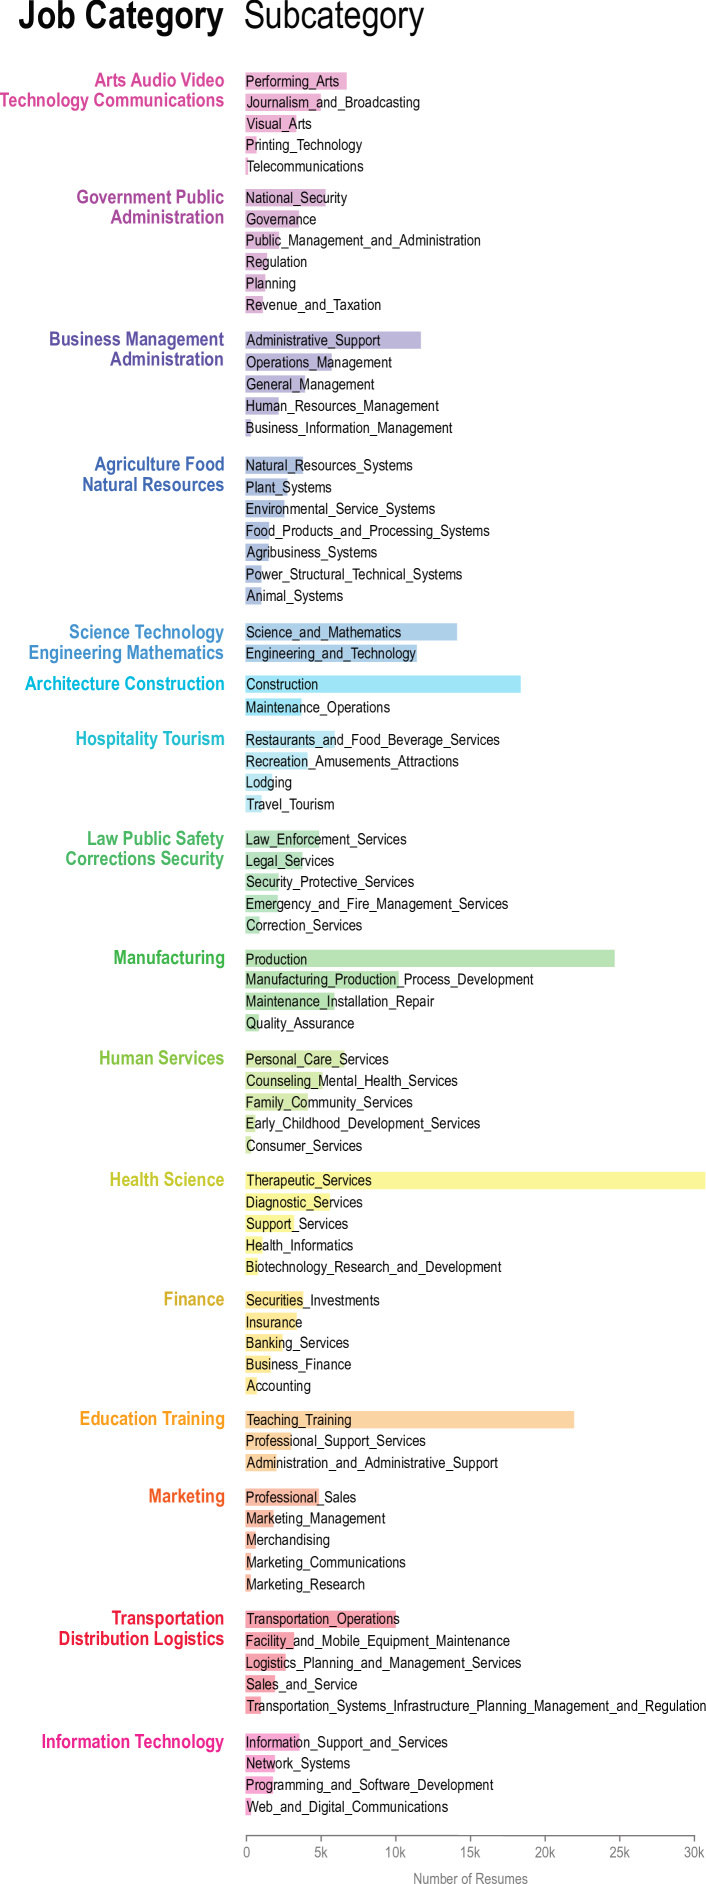
We used the Standard Occupational Classification (SOC) System from Bureau of Labor Statistics (https://www.bls.gov/soc/) to structure resumes. The résumés span 16 occupational sectors specified in the SOC: Manufacturing, Health Science, Education, STEM, Business, Architecture, Transportation, Human Services, Arts & Communication, Government, Food & Agriculture, Public Safety, Tourism, Finance, Marketing, and Information Technology (IT). For each occupation sector, we used the job titles defined within the sector as query terms for résumés. Each sector is well-represented in our dataset, with 15,000 samples in IT, the least prevalent sector. The distribution of job categories can be seen in Figure 1.
As a pre-processing step, we removed duplicate résumés and converted all documents to a regular JSON format with the following fields:
-
(1)
Summary: This optional field corresponds to the “objective” statement that some résumé authors chose to include.
- (2)
-
(3)
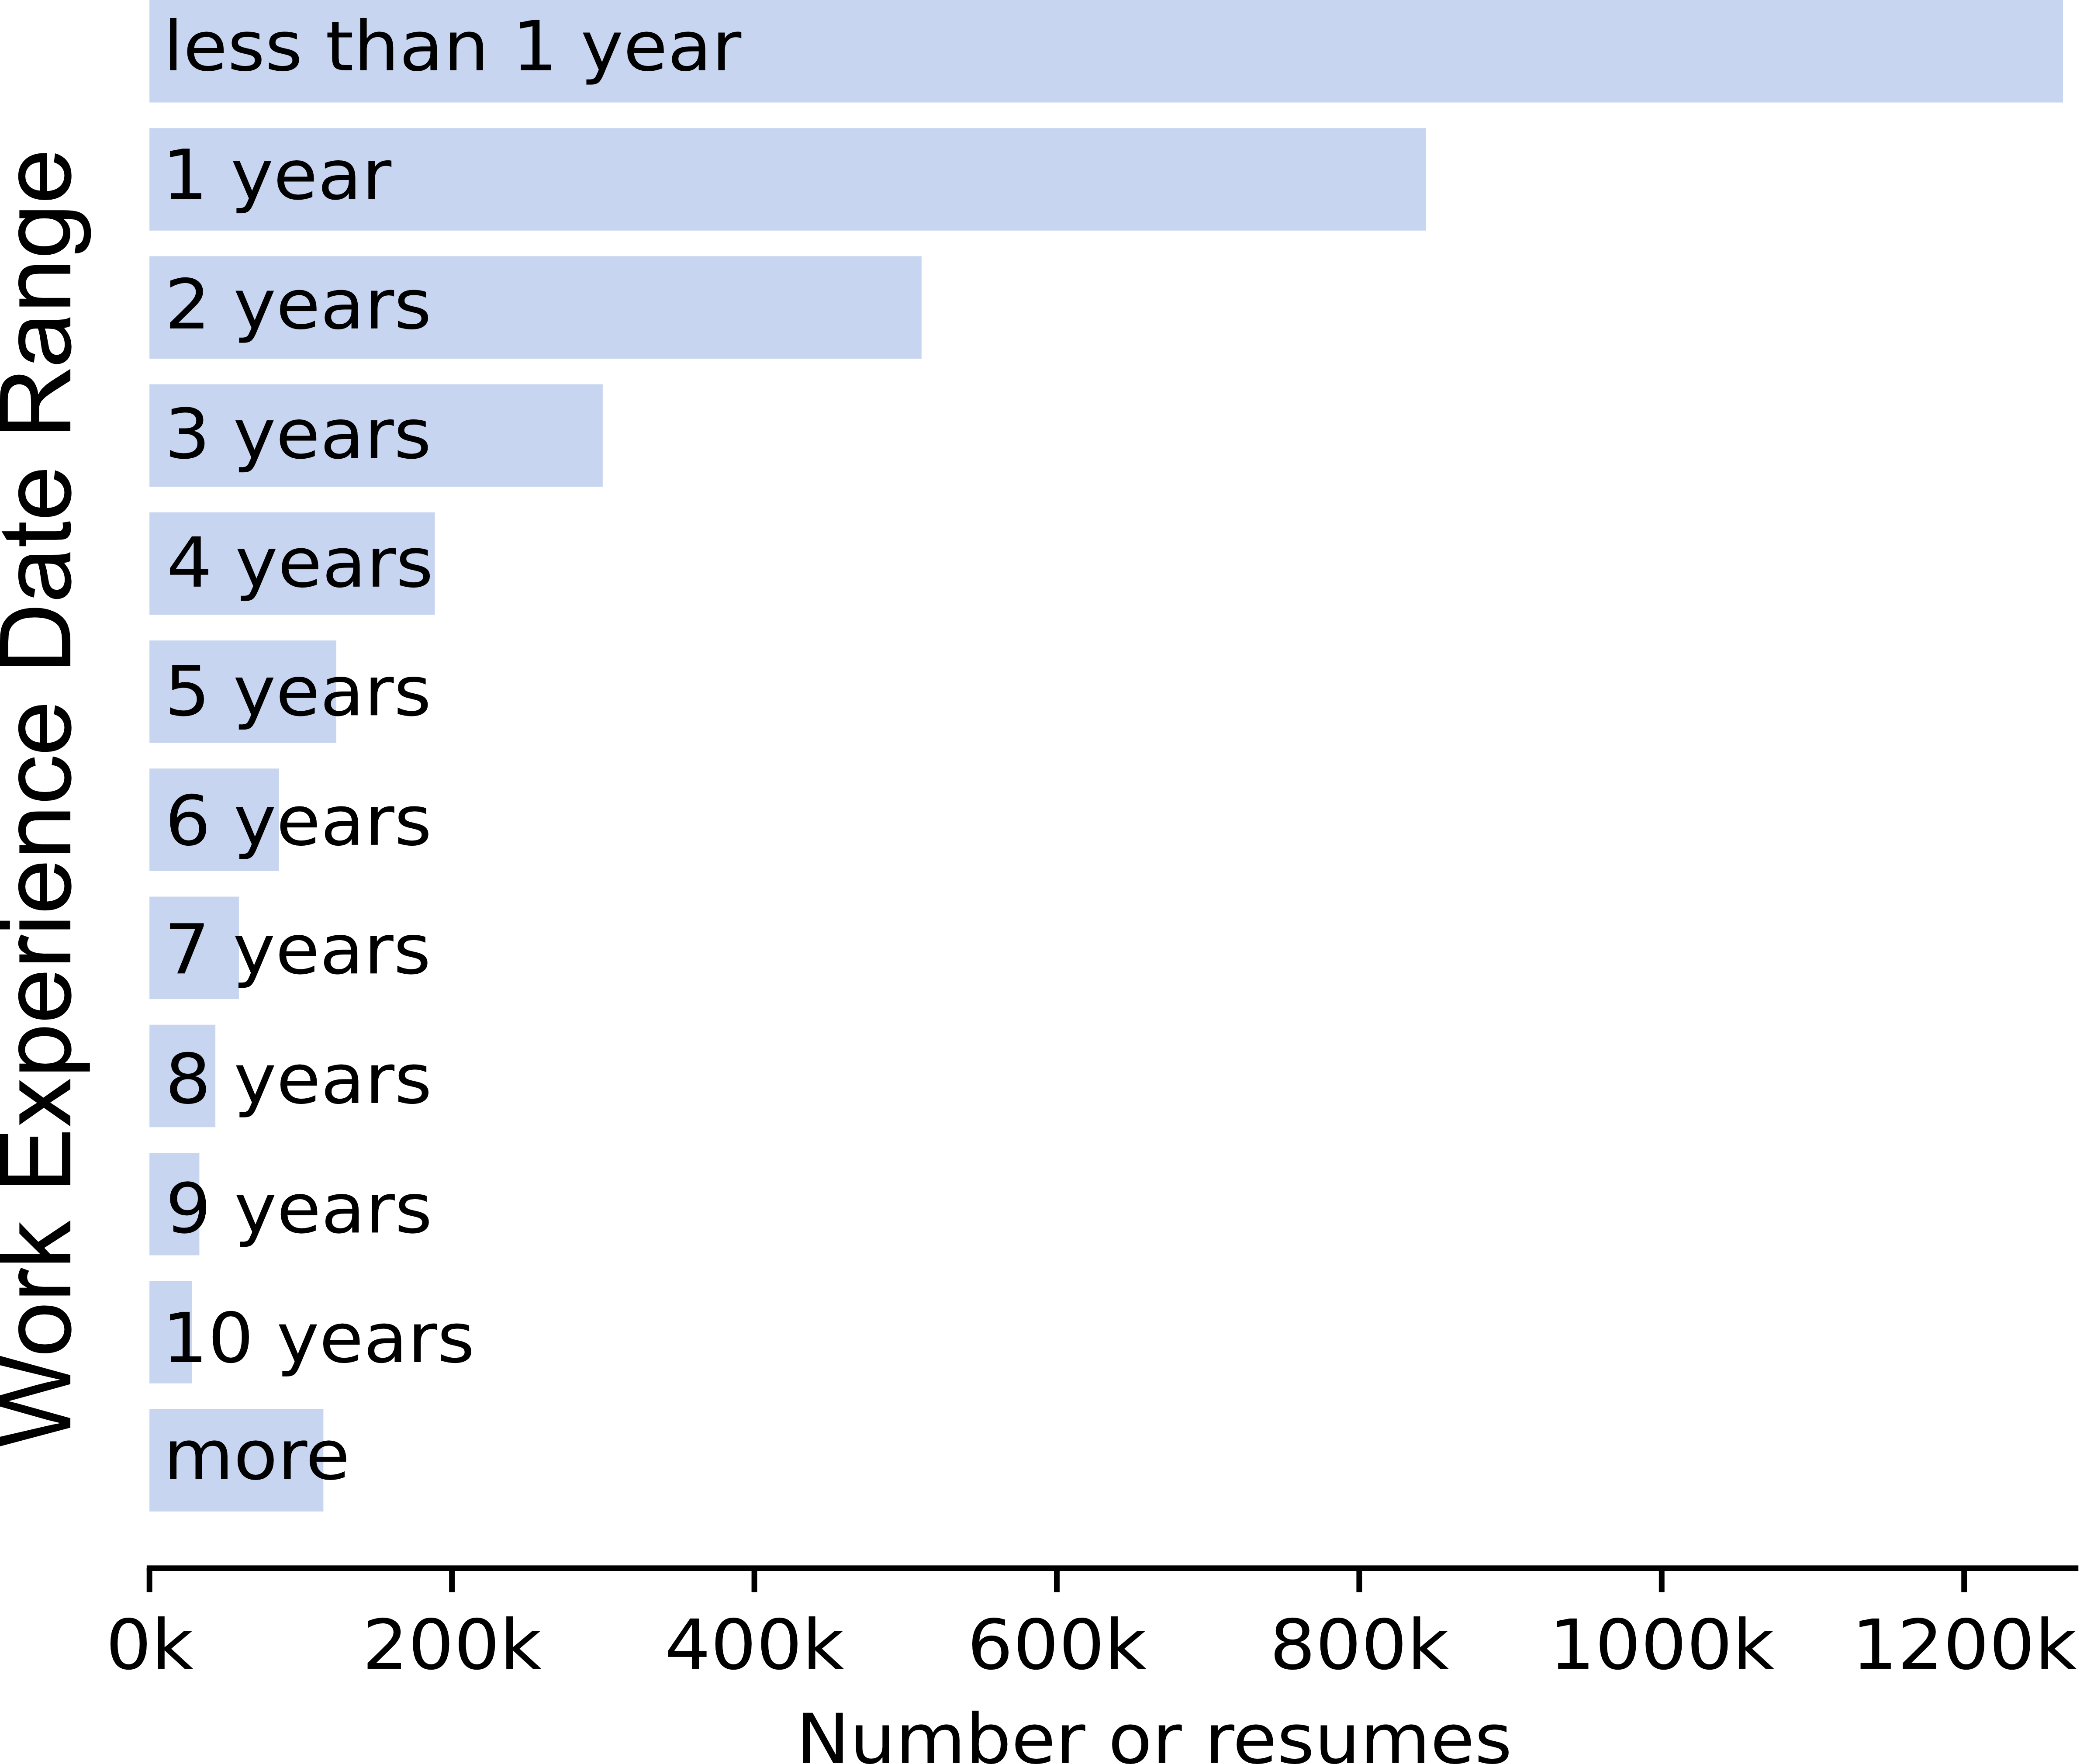
Work Experience: This field includes a the work experience of the individual. It is a list of job entries each with a date range (Figure 5), description, and title.
-
(4)
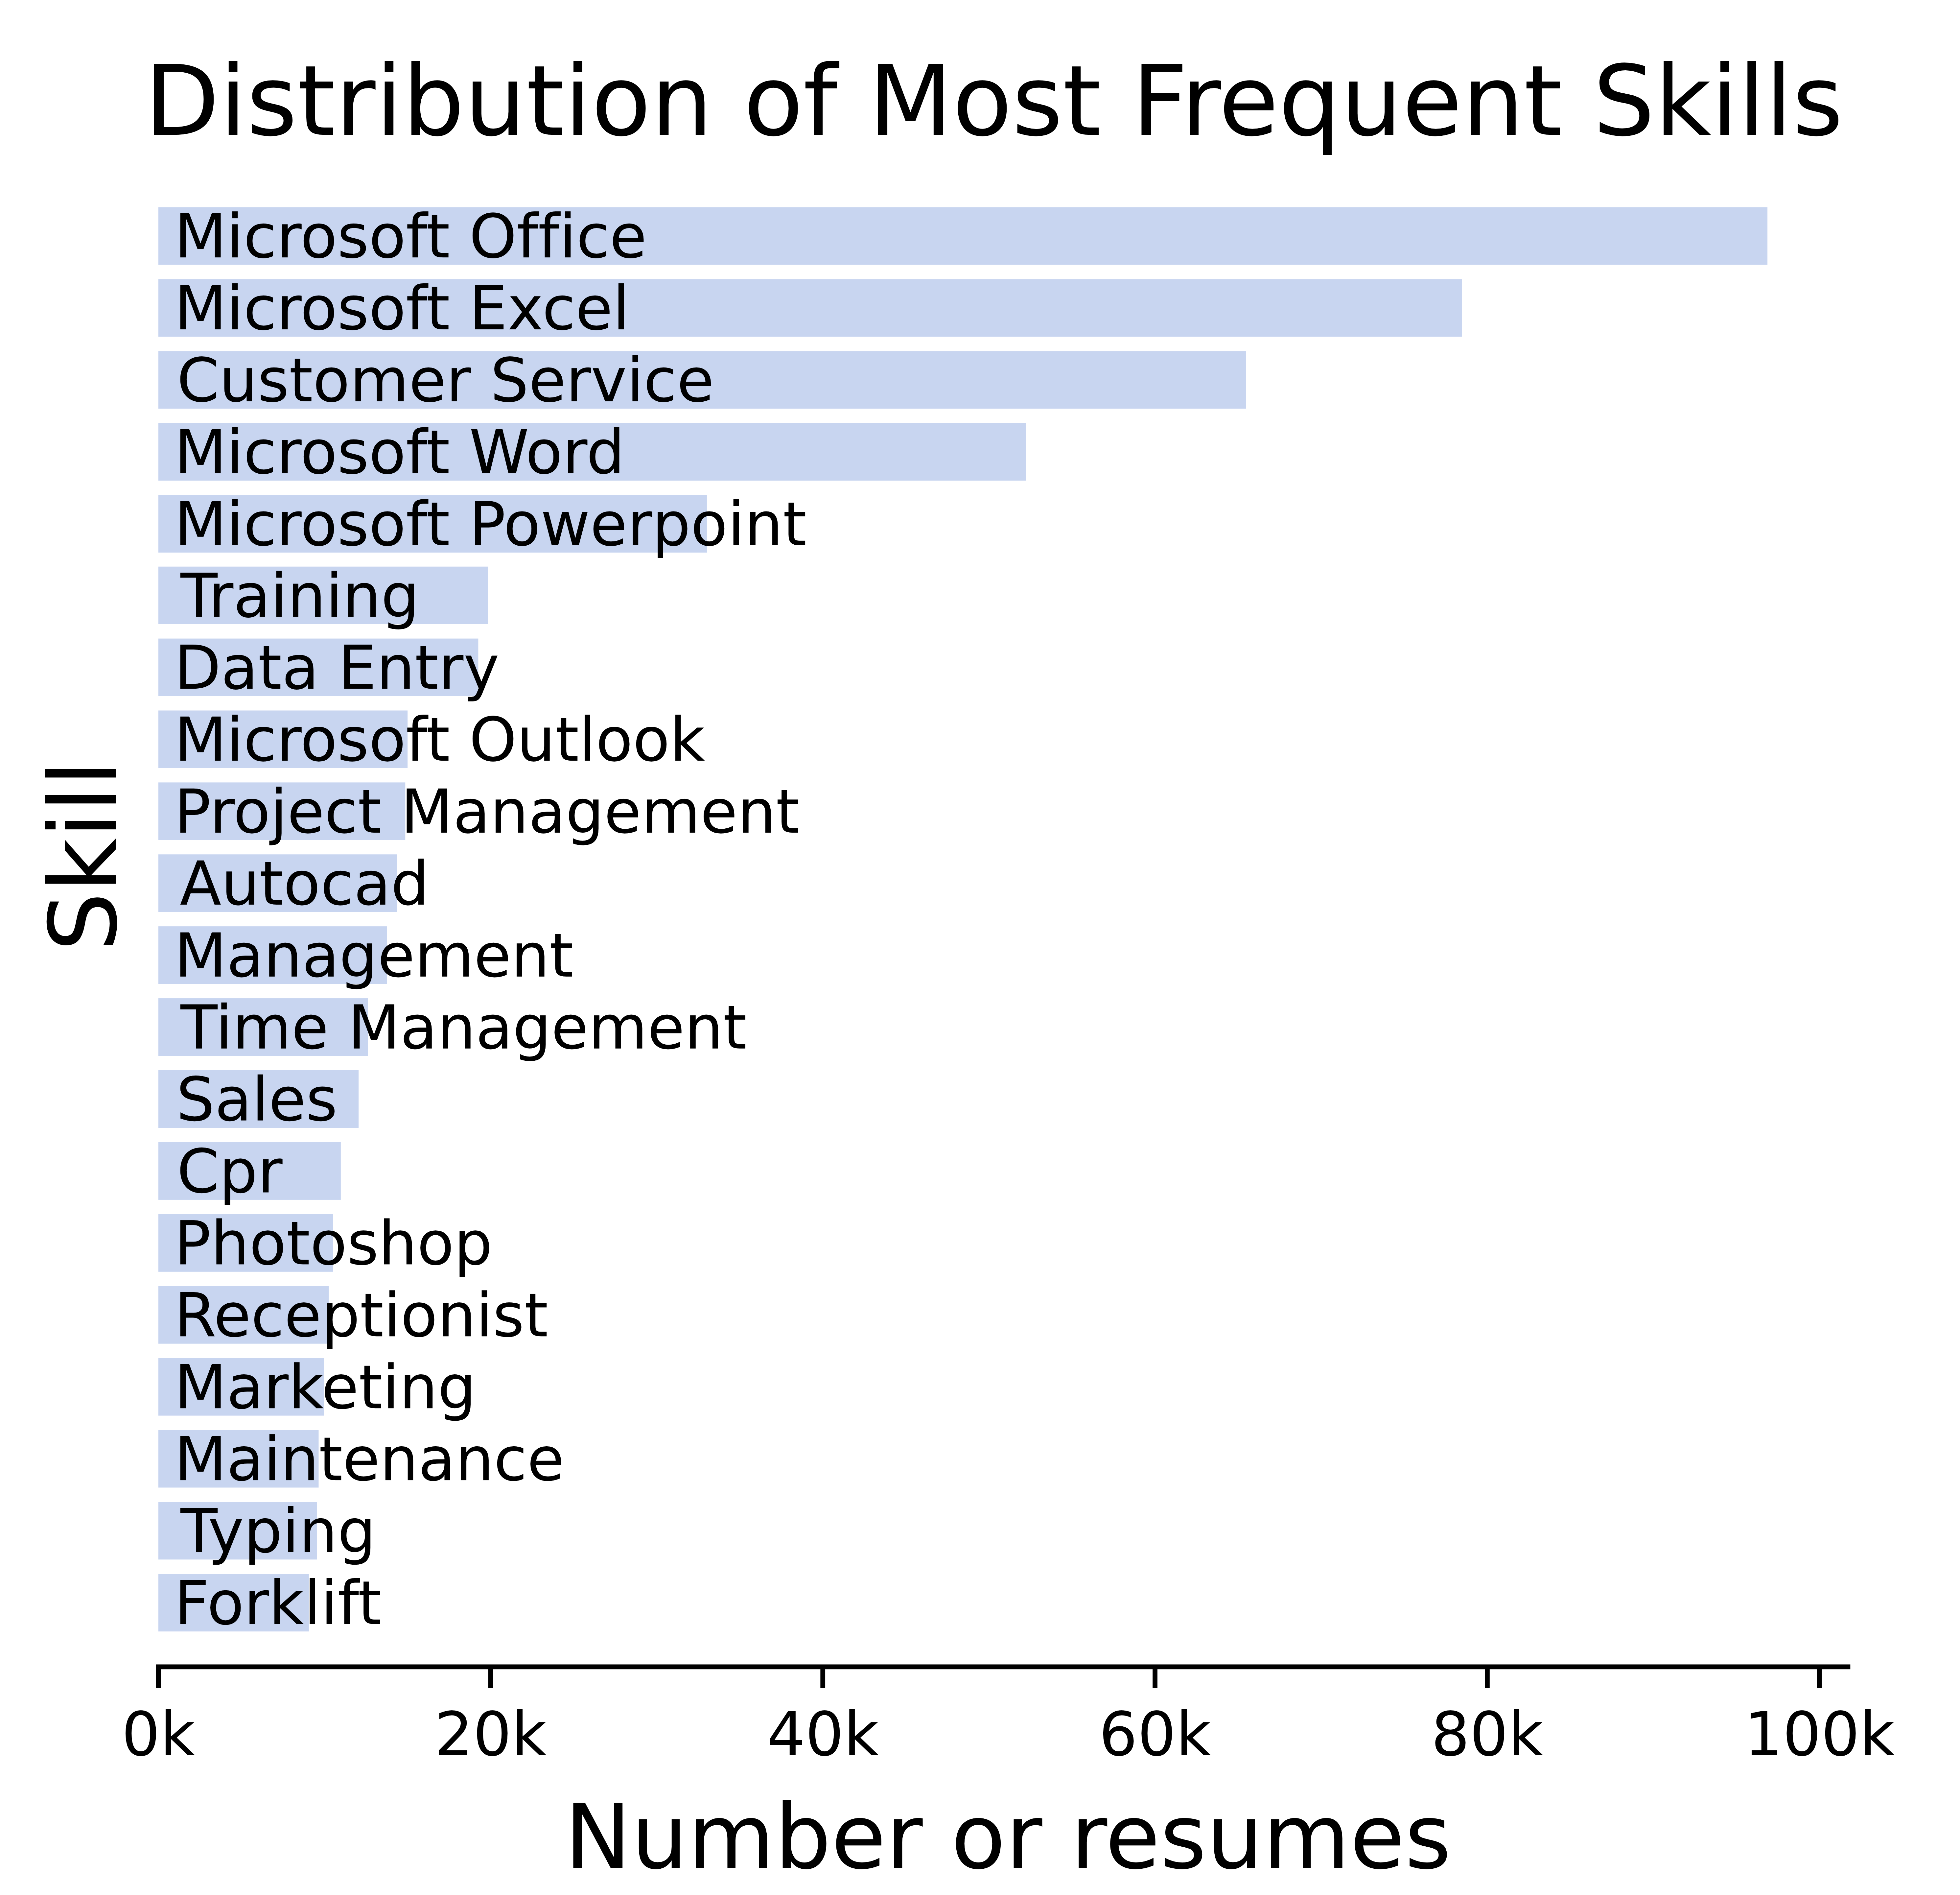
Skills: This field is a list of reported skills accompanied by a value representing months of experience in that skill. Figure 2 shows the distribution of 20 most frequent skills.
-
(5)
Awards: This field represents the awards earned by the individual with names and descriptions.
-
(6)
Patents: This field represents the patents held by the individual, with names and descriptions.
-
(7)
Certifications: This field holds the certifications accumulated by the individual with names and descriptions.
-
(8)
Publications: This field represents the publications of the individual listed in their profile with names and descriptions.
4. Measures
4.1. Extracting Education
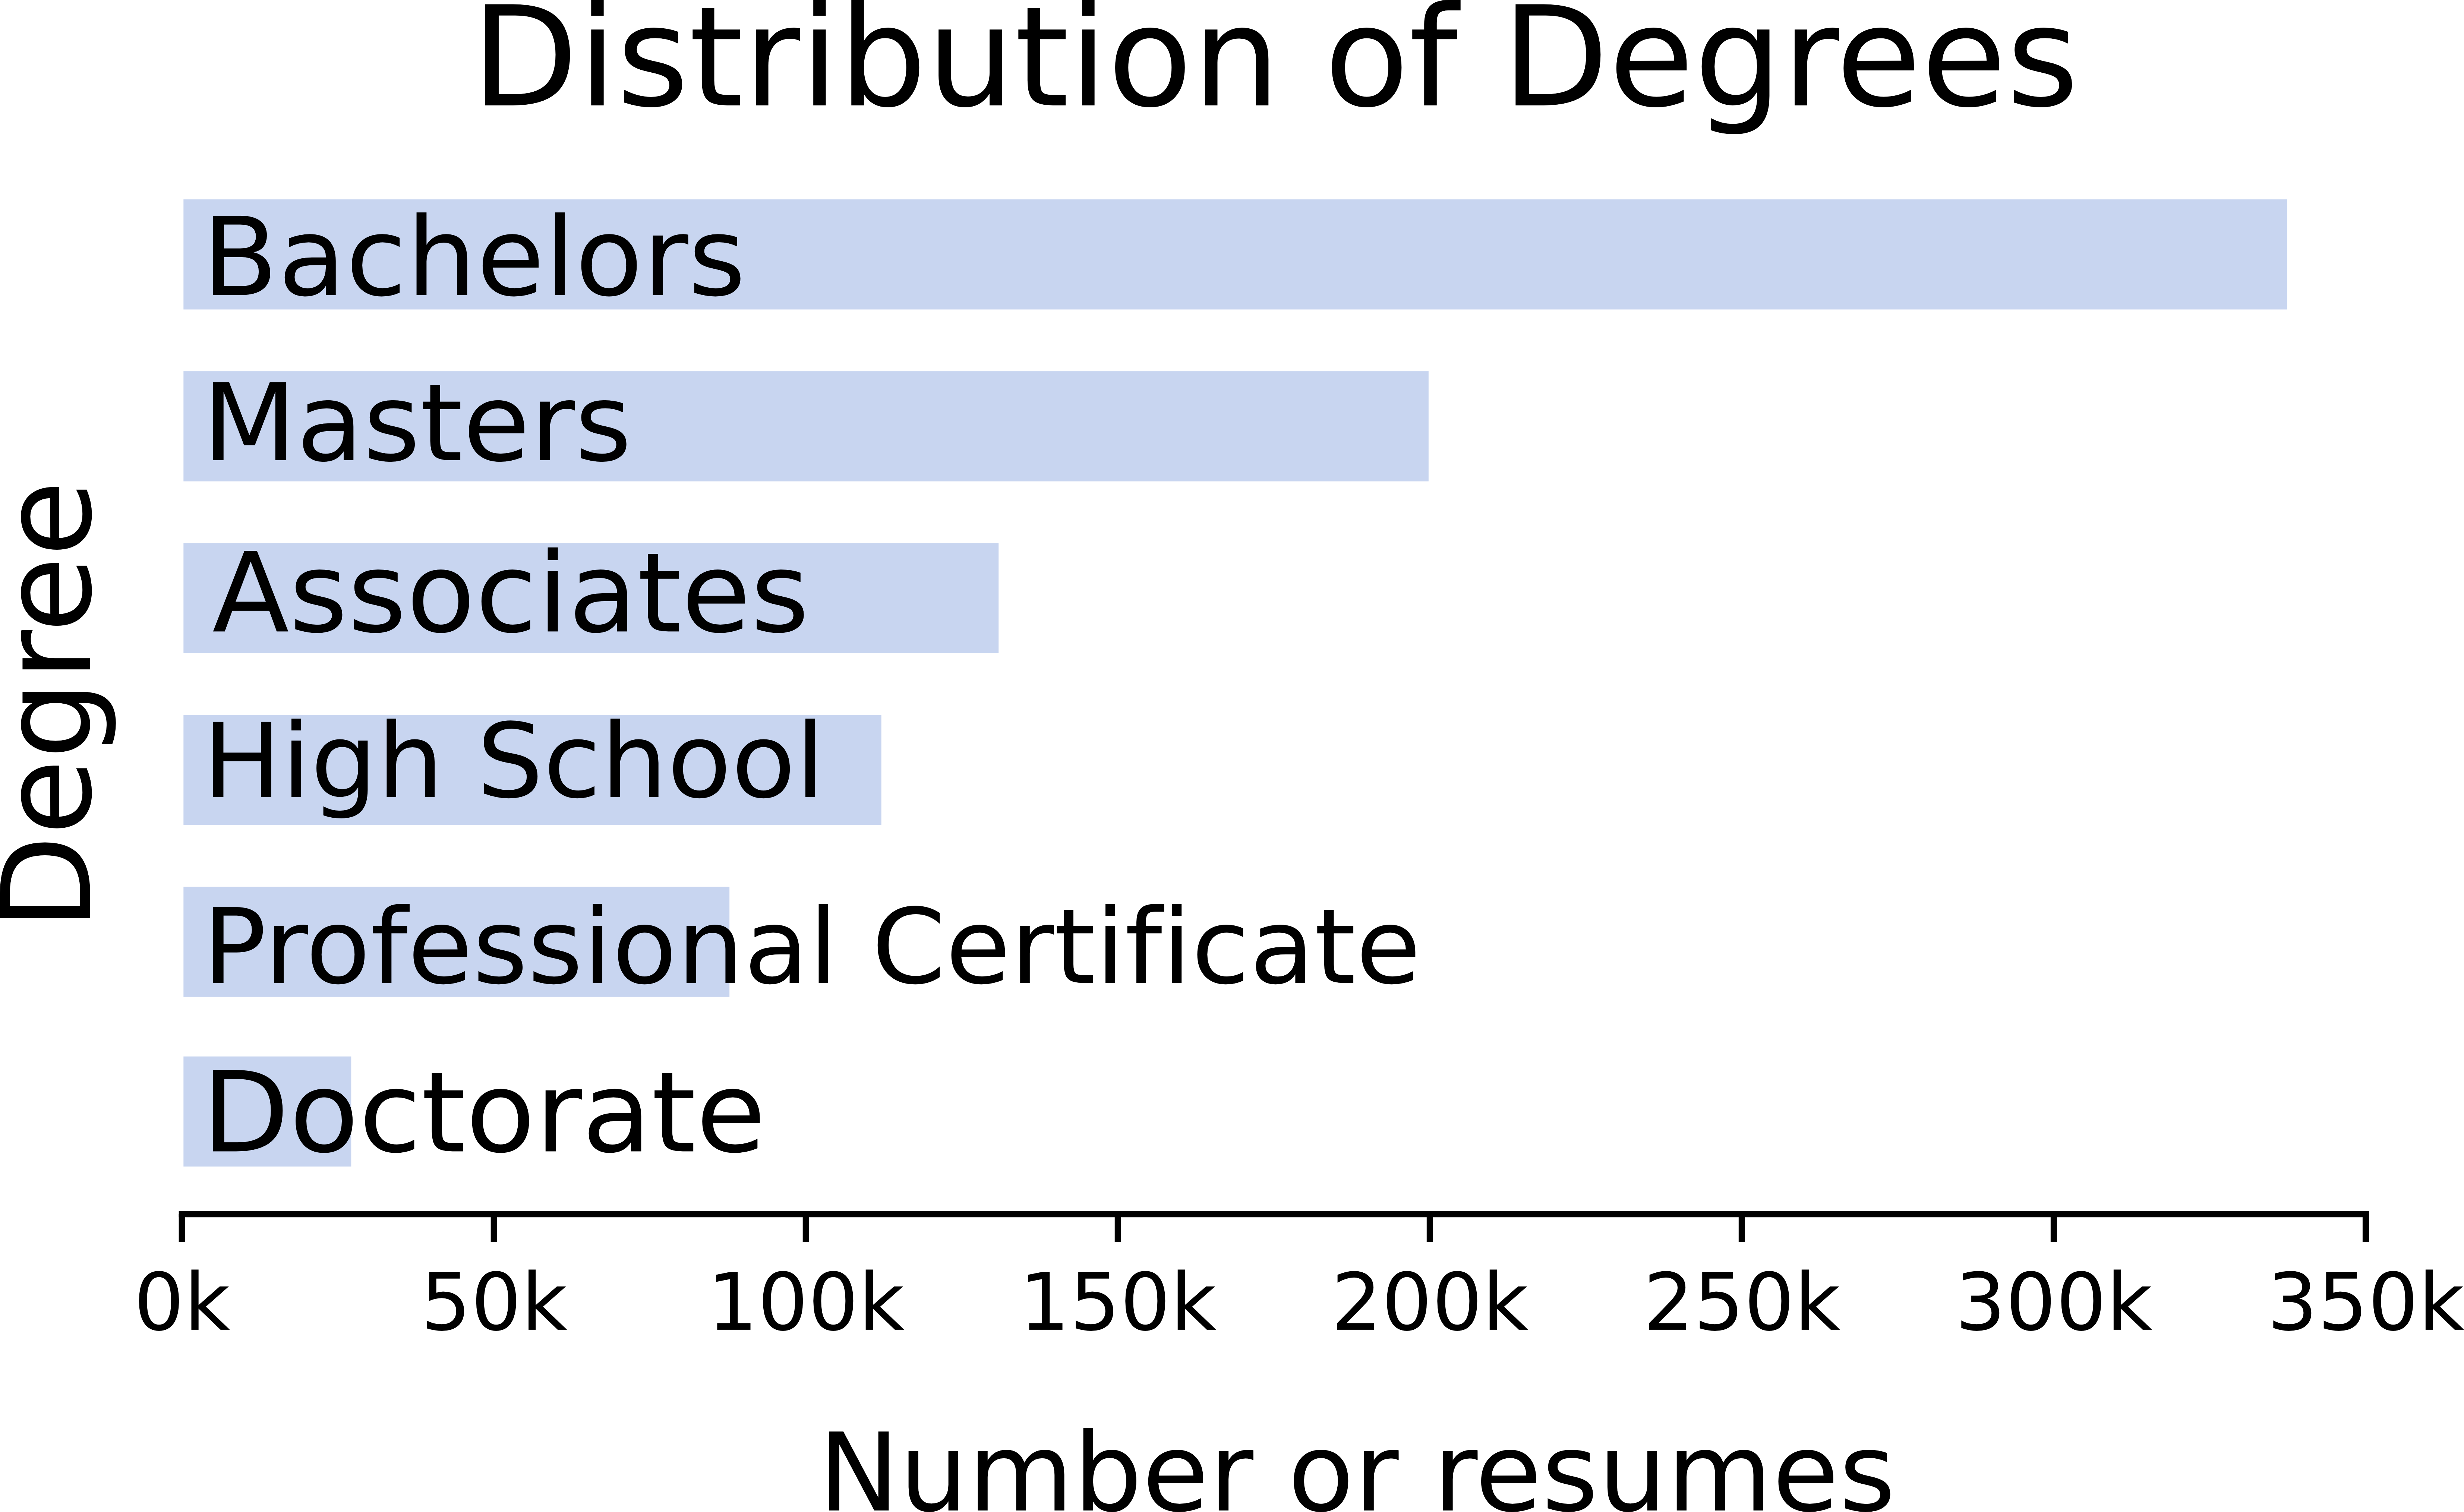
In our dataset, education is self reported as a list of attained education levels, with descriptions of the ‘field’ of the degree, the ‘dateRange’, and the actual ‘degree’ all self reported strings. In order to categorize these into standard education levels, we defined the most common (American) degree/education types:
-
(1)
High School
-
(2)
Associates
-
(3)
Bachelors
-
(4)
Masters
-
(5)
Doctorate
-
(6)
Professional Certificate
For each of degree types, we enumerated common abbreviations and names referring to each type. We then categorized each résumé by the most recent education entry, taking the ‘degree’ field and searching for matches of these known terms. The terms used for each education type are:
-
(1)
High School
‘high’, ‘hs’, ‘h.s.’, ‘ged’, ‘g.e.d.’ -
(2)
Associates
‘aa’, ‘a.a.’, ‘associate’, ‘associates’, ‘assoc’, ‘a.a’, ‘aa.’ -
(3)
Bachelors
‘bachelor’, ‘bachelors’, ‘bachelorś’, ‘ba’, ‘bs’, ‘b.a.’, ‘b.s.’, ‘b.a’, ‘b.s’, ‘bfa’, ‘b.f.a.’ -
(4)
Masters
‘master’, ‘masters’, ‘ms’, ‘ma’, ‘mfa’, ‘m.s.’, ‘m.a.’, ‘m.f.a.’, ‘msc’, ‘m.a’, ‘ma.’, ‘m.s’, ‘ms.’, ‘msc.’, ‘m.b.a’, ‘mba’, ‘mph’, ‘m.p.h.’, ‘mpa’, ‘m.p.a.’, ‘m.’ -
(5)
Doctorate
‘phd’, ‘phd.’, ‘ph.d’, ‘ph.d.’, ‘doctorate’, ‘doctor’, ‘jd’, ‘j.d.’, ‘md’, ‘m.d.’, ‘d.’ -
(6)
Professional Certificate
‘cert’, ‘certificate’, ‘certification’, ‘vocation’, ‘vocational’
In addition, we categorized résumés without education descriptions (or with empty education descriptions) with the category ‘None’. These categories together account for 93% of all resumes, with the remaining résumés not including any of these descriptions, and we put them in the ‘Other’ category. These “Other” résumés often contain ambiguous education descriptions, e.g., “college”, “39 credits earned”, or “visual communications”.
4.2. Job History
For each résumé, we extract information regarding their job history. Each résumé includes a list of job entries, each containing information regarding the date range of the job. From this list, we extract multiple pieces of information:
-
(1)
The total number of job entries.
-
(2)
The total amount of time working. This is done by taking each job entry and calculating the time worked at that job using the start and end dates. Then this value is summed over every job entry. In the case where multiple jobs are listed overlapping in time, that overlapped time is counted for each job separately and are both part of the total number.
-
(3)
The size of the largest gap in employment on the resume. A gap is defined as the amount of time (number of months) between the end date of a job and the start date of the next job. Thus, the largest gap refers to the longest such time interval.
This metric is potentially useful for understanding the impact of large gaps caused by maternity leave, medical issues, incarceration, or other causes of gaps which are often pointed out as negative factors on résumés.
4.3. Language Factors
We operationalized professionally-attested writing strategies as explicit prescriptive measures of résumé quality, summarized in Table 1. To begin, we compiled a collection of relevant lexicons and phrase sets from public career advice pages on the web. We then set out to implement analysis of each résumé by looking at the job descriptions and summary statement (if present).
We built phrase sets of buzzwords 111https://en.wikipedia.org/wiki/Buzzword222https://sba.thehartford.com/business-management/delete-these-buzzwords/333https://github.com/words/buzzwords, graded quantifiers and qualifiers. Additionally, we considered relevant hedge (Hyland, 2018)
lexicons from previous works on text and discourse analysis.
Finally, we applied a multi-step NLP pipeline to operationalize our prescriptive résumé quality features. On each sentence in the résumé, we ran the standard spaCy language processing pipeline, which includes tokenization (with stemming), part of speech (POS) tagging, dependency parsing, and named-entity recognition (NER). For each lexicon, we counted matches at the stemmed token level, and for each phrase set, we used a string matching procedure to capture multi-word phrases.
Separately, we found real-valued sentiment scores using VADER (Gilbert and Hutto, 2014).
| Measure | Approach | Examples |
|---|---|---|
| Use active voice (not passive) (Gross et al., 2017) | flag nsubjpass dependencies |
passive: “Sales were increased 30% after my system was deployed”
active: “My system increased sales by 30%” |
| Use exact quantities (not graded quantifiers) (Gross et al., 2017) |
use graded quantifiers phrase set
flag numeric entity types (SpaCy) |
graded quantifier: “My approach improved sales a lot”
exact quantity: “My approach improved sales by 30% |
| Avoid buzzwords | use buzzwords phrase set | buzzwords: team player, synergy, next generation, moving forward |
| Avoid semantically vacuous words and symbols (Gross et al., 2017; Oliphant and Alexander III, 1982; Stephens et al., 1979) |
flag fixed dependencies
flag discourse dependencies flag expl dependencies flag vocative dependencies |
fixed MWE:
as well as, in addition to, because of
discourse: like, well, oh, uh, :) expl: “There were 60 people in attendance” no expl: “60 people attended” vocative: “Guys, the software really works perfectly” no vocative: “The software works perfectly” |
| Avoid qualifiers and other hedges (Hyland, 2018) |
use hedges lexicon (Hyland, 2018)
use qualifiers phrase set |
hedges: approximately, generally, often, seems, tends to, indicates
qualifiers: actually, basically, just, kind of, really, sort of |
|
Avoid overly emotional or subjective language
(and especially avoid negativity) (Weaver, 2017) |
use VADER sentiment (Gilbert and Hutto, 2014)
use weak and strong subjectivity lexicons (Riloff and Wiebe, 2003) |
strongly subjective: considerably, courageously, crazy, delightfully strongly negative: I abhor public speaking… Technology is so annoying |
| Remove all personal pronouns (Horn, 1988) | POS tagging |
first-person personal pronoun: I implemented a seq2seq model.
third-person personal pronoun: We implemented a seq2seq model. no personal pronoun: Implemented a seq2seq model. |
| Use past-tense verbs | POS tagging |
past: “Operated the lathe”
present continuous: “Operates the lathe” |
| Remove all “be” verbs | match lemmas |
be verb: “I was responsible for operating the lathe”
no be verb: “Operated the lathe” |
4.4. Extracting Senior Positions
In order to understand how people advance in their careers we defined a measure of job title seniority. Senior jobs are those that represent the higher levels within the management hierarchy of an organization, thus representing managers, executives, and other jobs in charge of managing others. We define Senior positions with a list of representative terms often used in such job titles. For example an archetypal ‘Senior’ position would be a management or executive level position, and thus such a title may include terms like ‘lead’, ‘head’ or ‘manager’. Thus we define a set of paradigmatic Senior title words as: ‘senior’, ‘chief’, ‘lead’, ‘head’, ‘president’, ‘manager’, ‘director’, ‘supervisor’, ’superintendent’, ‘ceo’, ‘coordinator’, ‘principal’, ‘founder’, ‘partner’, ‘sr’, ‘cfo’, ‘cio’. The expectation is that any senior job title would include some terms within or similar to the specific words mentioned above. As a way of measuring the similarity between job title variants, we use word mover distance (Kusner et al., 2015), a metric designed to measure the similarity between word embeddings that capture the syntactic or semantic meaning of sentences. By using this metric to gauge how similar two different job titles are, we can match job titles that do not use identical words but effectively describe the same roles. This analysis results in a classification of Senior or non-Senior for every job history entry in each résumé, with 24% of resumes being currently in senior positions and thus 76% of positions being currently non-senior.
5. Analysis
Given our large and feature-rich dataset, we set forth to analyze how each of the factors we extracted from each résumé affects career trajectories. In particular, we looked at what helps enable people to transition into more senior roles as they progress in their career (RQ1). We did this by performing a linear logistic regression analysis (with l1 regularization) with a dependent variable of the most recent job seniority categorization on each résumé.
As independent variables, we included the seniority level of each person’s second most recent job entry, to see the comparative effect of already having a senior position, and thus the likelihood of maintaining such a position or transitioning from a non-senior position into a senior position. We included the total number of jobs held and the total cumulative time of work experience to see the effect of experience. In addition, we include human capital factors (RQ2) of the highest level of education achieved, the number of skills, awards, publications, and patents as an independent variables. Furthermore, we include the size of the largest employment gap in each résumé to measure the effect of such gaps in upward mobility (RQ3). Finally, we also include the language factors extracted from each résumé as independent variables, allowing us to compare how impactful these actionable strategies are in comparison to other factors (RQ4) in transitioning to senior roles.
We repeated this regression analysis for résumés in each high level Job Sector in order to see how these factors differed between sectors (RQ5).
5.1. Seniority Transitions
Given that the information used in the regression formulation is an incomplete picture of each career, we expect that any analysis is bound to be incomplete as well. In order to understand what portion of the real world effect our model is characterizing we evaluated our logistic regression first against a naïve baseline that always guesses the more likely option of non-senior as a lower bound of accuracy to assess our model’s improvement over the baseline. Table 2 shows the evaluation of the accuracy and F1 score of the regression compared to baseline (F1 score being more relevant due to the unbalanced nature of more non-senior positions). The regression performs better than baseline across all job sectors, suggesting a measurable gain in information and predictive power of the features extracted from the dataset. Furthermore, we can also see the differential in how easy or difficult each sector is to predict, with Business Management Administration having the largest increase, which makes sense as our encoding of seniority may be the most relevant in this sector, and Human Services having the smallest increase showing, possibly due to the large variety of jobs in that category, and showing the limitations of this technique in other contexts. Once it is established that the regression has learned predictive features, we can analyze the parameters of the regression to see the comparative effect of each independent variable on the dependent variable of likelihood to progress into senior positions.
| Job Sector | Regression Accuracy | Baseline Accuracy | Regression F1 Score | Baseline F1 Score |
|---|---|---|---|---|
| Agriculture Food Natural Resources | 0.757405 | 0.739286 | 0.583977 | 0.425051 |
| Architecture Construction | 0.815911 | 0.800044 | 0.616268 | 0.444458 |
| Arts Audio Video Technology Communications | 0.726572 | 0.709866 | 0.558111 | 0.415159 |
| Business Management Administration | 0.735396 | 0.684728 | 0.660820 | 0.406432 |
| Education Training | 0.798285 | 0.794900 | 0.485449 | 0.442866 |
| Finance | 0.730177 | 0.711849 | 0.561279 | 0.415836 |
| Government Public Administration | 0.714211 | 0.691448 | 0.610605 | 0.408791 |
| Health Science | 0.831652 | 0.830961 | 0.498625 | 0.453839 |
| Hospitality Tourism | 0.737358 | 0.729057 | 0.540708 | 0.421650 |
| Human Services | 0.769675 | 0.768184 | 0.471345 | 0.434448 |
| Information Technology | 0.727976 | 0.693597 | 0.643646 | 0.409541 |
| Law Public Safety Corrections Security | 0.810607 | 0.810382 | 0.474382 | 0.447630 |
| Manufacturing | 0.816519 | 0.795754 | 0.614662 | 0.443131 |
| Marketing | 0.711056 | 0.686147 | 0.581087 | 0.406932 |
| Science Technology Engineering Mathematics | 0.744574 | 0.693599 | 0.661161 | 0.409541 |
| Transportation Distribution Logistics | 0.785876 | 0.767633 | 0.609997 | 0.434272 |
5.2. Previous Experience
The first factor we analyze is the effect of previous job experience on senior transitions. We expected that more work experience would help achieve seniority; and in alignment with RQ3, we expect that larger employment gaps would have a negative impact. Table 3 shows that the most impactful parameter is the total time of job experience, having a significant positive impact on seniority across sectors which agrees with our hypothesis that people with more years of experience are more likely to be promoted to senior positions. At the same time, the total number of jobs has little or no significant impact in most industries. Finally, we see the effect of employment gaps is, as expected, negative across job sectors. However this effect seems to be comparatively small with less overall significance in most sectors. The sectors with the biggest impact of gaps are Manufacturing, Business Management Administration, and Education Training.
| Job Sector | Total Job Time | Number of Jobs | Largest Gap Size |
|---|---|---|---|
| Agriculture Food Natural Resources | 0.282±0.017 | 0.000 | -0.028±0.018 |
| Architecture Construction | 0.294±0.017 | -0.029±0.017 | -0.019±0.016 |
| Arts Audio Video Technology Communications | 0.132±0.018 | -0.018±0.018 | -0.036±0.017 |
| Business Management Administration | 0.297±0.015 | -0.009±0.015 | -0.128±0.015 |
| Education Training | 0.186±0.013 | 0.000 | -0.118±0.015 |
| Finance | 0.242±0.018 | 0.000 | -0.067±0.020 |
| Government Public Administration | 0.162±0.016 | 0.000 | -0.064±0.017 |
| Health Science | 0.213±0.012 | 0.000 | -0.065±0.013 |
| Hospitality Tourism | 0.173±0.019 | -0.041±0.020 | -0.055±0.019 |
| Human Services | 0.193±0.016 | 0.000 | -0.069±0.018 |
| Information Technology | 0.158±0.032 | 0.000 | -0.056±0.036 |
| Law Public Safety Corrections Security | 0.190±0.020 | 0.025±0.020 | -0.016±0.019 |
| Manufacturing | 0.361±0.011 | 0.000 | -0.131±0.013 |
| Marketing | 0.074±0.022 | 0.000 | -0.074±0.023 |
| Science Technology Engineering Mathematics | 0.329±0.016 | 0.006±0.015 | -0.056±0.013 |
| Transportation Distribution Logistics | 0.174±0.017 | -0.002±0.017 | -0.081±0.018 |
5.3. Human Capital
In accordance with RQ2 we looked at the effect of human capital on Seniority. Our hypothesis is that higher levels of education as well as skills would have a positive impact on transitions to senior positions. Table 5 shows our findings. We find that contrary to our hypothesis the effect of human capital is often either very small or we find no significant effect in most sectors. In education, we find small penalties for attaining education levels below a Bachelor level (Associates, Certificate, High School, None, and Other), and a significant but small positive effect for having a Bachelor’s degree, however in most fields there is little or no added effect from further education at the masters or doctorate level. The effect of education however does vary widely across sectors, with higher education being more helpful in Business Management Administration and Health Science, but less measurable in Arts Audio Video Technology Communications, Marketing, and Agriculture Food Natural Resources. At the same time, skills, publications, awards, and certifications have marginal or negligible effects across all sectors. This may be because the context of this analysis is looking at management level seniority which in general may not ask for as many listed technical skills compared to other kinds of advancement in a career on a non-managerial track.
| Job Sector | Associates | Bachelors | Certificate | Doctorate | HighSchool | Masters | None | Other |
|---|---|---|---|---|---|---|---|---|
| Agriculture Food Natural Resources | -0.042±0.019 | 0.059±0.019 | -0.030±0.018 | 0.000 | -0.103±0.023 | 0.000 | 0.000 | -0.018±0.018 |
| Architecture Construction | 0.000 | 0.138±0.015 | -0.014±0.017 | 0.000 | -0.146±0.021 | 0.000 | 0.000 | -0.041±0.017 |
| Arts Audio Video Technology Communications | -0.033±0.019 | 0.019±0.023 | -0.037±0.018 | 0.000 | -0.113±0.022 | 0.009±0.021 | 0.000 | -0.065±0.019 |
| Business Management Administration | -0.062±0.016 | 0.134±0.017 | -0.045±0.015 | 0.059±0.013 | -0.099±0.017 | 0.072±0.017 | 0.000 | 0.000 |
| Education Training | -0.008±0.014 | 0.022±0.015 | -0.013±0.014 | 0.064±0.013 | -0.042±0.018 | 0.000 | 0.000 | -0.003±0.014 |
| Finance | -0.028±0.020 | 0.000 | 0.000 | 0.000 | -0.014±0.021 | 0.057±0.020 | -0.026±0.020 | -0.034±0.020 |
| Government Public Administration | -0.035±0.017 | 0.000 | -0.016±0.017 | 0.000 | -0.046±0.018 | 0.054±0.017 | 0.000 | -0.017±0.017 |
| Health Science | -0.091±0.018 | 0.120±0.018 | -0.026±0.016 | 0.046±0.014 | -0.057±0.017 | 0.073±0.019 | 0.000 | -0.004±0.015 |
| Hospitality Tourism | 0.035±0.019 | 0.110±0.019 | 0.000 | 0.000 | -0.077±0.021 | 0.000 | 0.000 | -0.014±0.020 |
| Human Services | 0.063±0.016 | 0.088±0.017 | -0.016±0.017 | 0.019±0.017 | -0.065±0.020 | 0.000 | 0.000 | -0.023±0.018 |
| Information Technology | 0.000 | 0.000 | 0.000 | 0.000 | 0.000 | 0.000 | 0.000 | 0.000 |
| Law Public Safety Corrections Security | 0.000 | 0.082±0.021 | -0.006±0.021 | 0.000 | 0.000 | 0.046±0.021 | 0.000 | 0.000 |
| Manufacturing | -0.047±0.013 | 0.087±0.012 | -0.056±0.013 | 0.016±0.011 | -0.114±0.016 | 0.000 | 0.000 | -0.073±0.013 |
| Marketing | 0.000 | 0.025±0.025 | 0.000 | 0.000 | -0.007±0.023 | 0.079±0.025 | 0.000 | -0.040±0.024 |
| Science Technology Engineering Mathematics | -0.051±0.014 | 0.000 | -0.002±0.013 | 0.000 | -0.026±0.015 | 0.013±0.013 | 0.000 | -0.025±0.013 |
| Transportation Distribution Logistics | -0.004±0.019 | 0.115±0.021 | -0.014±0.019 | 0.000 | -0.121±0.022 | 0.007±0.022 | 0.000 | -0.061±0.020 |
| Job Sector | Number Skills | Number Awards | Number Certifications | Number Publications | Number Patents |
|---|---|---|---|---|---|
| Agriculture Food Natural Resources | 0.000 | 0.000 | 0.000 | 0.000 | 0.000 |
| Architecture Construction | 0.002±0.016 | 0.000 | 0.000 | 0.003±0.015 | 0.002±0.016 |
| Arts Audio Video Technology Communications | -0.027±0.016 | 0.000 | 0.000 | -0.006±0.016 | 0.000 |
| Business Management Administration | -0.010±0.014 | 0.017±0.012 | 0.000 | 0.000 | 0.000 |
| Education Training | 0.000 | 0.009±0.014 | 0.031±0.014 | 0.000 | 0.000 |
| Finance | 0.000 | 0.000 | -0.023±0.018 | 0.000 | 0.000 |
| Government Public Administration | 0.000 | 0.000 | 0.031±0.017 | 0.000 | 0.000 |
| Health Science | 0.052±0.012 | 0.038±0.011 | -0.081±0.014 | 0.000 | 0.005±0.010 |
| Hospitality Tourism | 0.000 | 0.000 | 0.003±0.019 | 0.000 | 0.000 |
| Human Services | 0.018±0.016 | 0.000 | 0.000 | 0.000 | 0.000 |
| Information Technology | 0.000 | 0.000 | 0.000 | 0.000 | 0.000 |
| Law Public Safety Corrections Security | 0.000 | 0.000 | 0.000 | 0.001±0.017 | 0.000 |
| Manufacturing | 0.006±0.012 | 0.013±0.011 | 0.000 | 0.002±0.012 | 0.017±0.012 |
| Marketing | 0.000 | 0.004±0.021 | 0.000 | 0.000 | 0.000 |
| Science Technology Engineering Mathematics | -0.033±0.013 | -0.009±0.014 | 0.040±0.013 | 0.000 | 0.011±0.012 |
| Transportation Distribution Logistics | 0.033±0.016 | 0.000 | -0.068±0.020 | 0.000 | 0.000 |
5.4. Language Factors
Finally, we looked at the effect of résumé language factors on seniority transitions with results in Tables 6, 7, and 8. Our current results We found that while experts recommend avoiding buzzwords, the inclusion of buzzwords has a large positive impact (with an effect of nearly the same size as cumulative working time for most sectors) across all job sector; other recommendations have much less impact, which is a surprising result and warrant further investigation (e.g., language factors could have a stronger effect for résumés with less job experience).
| Job Sector | Negative Sentiment | Positive Sentiment |
|---|---|---|
| Agriculture Food Natural Resources | 0.000 | 0.000 |
| Architecture Construction | -0.012±0.017 | -0.006±0.017 |
| Arts Audio Video Technology Communications | 0.010±0.016 | 0.000 |
| Business Management Administration | 0.000 | -0.057±0.014 |
| Education Training | -0.032±0.015 | 0.016±0.014 |
| Finance | 0.000 | -0.044±0.020 |
| Government Public Administration | 0.000 | -0.009±0.017 |
| Health Science | 0.000 | -0.026±0.013 |
| Hospitality Tourism | 0.000 | 0.000 |
| Human Services | 0.024±0.016 | 0.000 |
| Information Technology | 0.000 | 0.000 |
| Law Public Safety Corrections Security | 0.000 | -0.018±0.020 |
| Manufacturing | -0.001±0.012 | -0.017±0.013 |
| Marketing | 0.000 | -0.009±0.022 |
| Science Technology Engineering Mathematics | 0.000 | -0.022±0.014 |
| Transportation Distribution Logistics | 0.000 | -0.014±0.017 |
| Job Sector | Hedges | Graded Quantifiers | Qualifiers | Buzzwords |
|---|---|---|---|---|
| Agriculture Food Natural Resources | 0.000 | -0.018±0.019 | 0.000 | 0.155±0.017 |
| Architecture Construction | 0.000 | 0.000 | 0.000 | 0.198±0.015 |
| Arts Audio Video Technology Communications | 0.000 | 0.000 | 0.000 | 0.226±0.016 |
| Business Management Administration | 0.000 | -0.005±0.014 | 0.000 | 0.250±0.014 |
| Education Training | 0.002±0.015 | 0.000 | 0.007±0.013 | 0.154±0.014 |
| Finance | -0.033±0.019 | 0.000 | 0.000 | 0.197±0.019 |
| Government Public Administration | 0.000 | 0.000 | -0.014±0.016 | 0.200±0.017 |
| Health Science | 0.016±0.013 | 0.000 | 0.000 | 0.173±0.012 |
| Hospitality Tourism | 0.000 | 0.000 | -0.027±0.019 | 0.071±0.018 |
| Human Services | 0.000 | 0.000 | 0.000 | 0.086±0.016 |
| Information Technology | 0.000 | 0.000 | 0.000 | 0.239±0.033 |
| Law Public Safety Corrections Security | 0.000 | 0.000 | 0.000 | 0.156±0.020 |
| Manufacturing | -0.020±0.013 | 0.000 | -0.004±0.012 | 0.291±0.013 |
| Marketing | 0.000 | 0.000 | 0.000 | 0.224±0.023 |
| Science Technology Engineering Mathematics | 0.000 | 0.000 | -0.024±0.013 | 0.221±0.015 |
| Transportation Distribution Logistics | 0.000 | 0.000 | 0.000 | 0.277±0.016 |
| Job Sector | Passive Voice | Fixed Dependencies | Vocative Dependencies | Expletive Dependencies | Discourse Dependencies | Past Tense | Pronouns | ”To Be” Words |
|---|---|---|---|---|---|---|---|---|
| Agriculture Food Natural Resources | 0.000 | 0.000 | 0.000 | -0.024±0.019 | 0.000 | 0.000 | -0.037±0.020 | 0.000 |
| Architecture Construction | 0.000 | 0.000 | 0.000 | 0.000 | 0.000 | 0.000 | -0.045±0.017 | 0.000 |
| Arts Audio Video Technology Communications | 0.000 | 0.000 | 0.000 | 0.000 | 0.000 | 0.000 | -0.052±0.017 | 0.000 |
| Business Management Administration | 0.000 | 0.000 | 0.000 | -0.029±0.014 | 0.000 | 0.000 | -0.067±0.015 | 0.000 |
| Education Training | 0.000 | 0.000 | 0.000 | -0.004±0.014 | 0.000 | 0.028±0.017 | 0.000 | -0.047±0.019 |
| Finance | 0.000 | 0.000 | 0.000 | 0.000 | 0.000 | 0.000 | -0.022±0.020 | 0.000 |
| Government Public Administration | 0.000 | 0.000 | 0.000 | 0.000 | 0.000 | 0.000 | -0.044±0.016 | 0.000 |
| Health Science | 0.020±0.012 | 0.000 | 0.000 | -0.003±0.012 | 0.000 | 0.046±0.014 | -0.052±0.014 | 0.000 |
| Hospitality Tourism | 0.000 | 0.000 | 0.000 | 0.000 | 0.000 | 0.000 | 0.000 | 0.000 |
| Human Services | 0.000 | 0.000 | 0.000 | 0.000 | 0.000 | 0.000 | 0.000 | 0.000 |
| Information Technology | 0.000 | 0.000 | 0.000 | 0.000 | 0.000 | 0.000 | 0.000 | 0.000 |
| Law Public Safety Corrections Security | 0.000 | 0.000 | 0.000 | 0.000 | 0.000 | 0.007±0.020 | 0.000 | 0.000 |
| Manufacturing | 0.005±0.012 | 0.000 | 0.000 | -0.020±0.013 | 0.000 | 0.007±0.015 | -0.063±0.014 | 0.000 |
| Marketing | 0.000 | 0.000 | 0.000 | 0.000 | 0.000 | 0.000 | 0.000 | 0.000 |
| Science Technology Engineering Mathematics | 0.000 | 0.000 | 0.000 | 0.000 | 0.000 | 0.053±0.016 | -0.062±0.014 | 0.000 |
| Transportation Distribution Logistics | 0.001±0.022 | 0.000 | 0.000 | 0.000 | 0.000 | 0.000 | -0.064±0.018 | 0.000 |
References
- (1)
- Feldman and Ng (2007) Daniel C Feldman and Thomas WH Ng. 2007. Careers: Mobility, embeddedness, and success. Journal of management 33, 3 (2007), 350–377.
- Filipov et al. (2019) Velitchko Filipov, Alessio Arleo, Paolo Federico, and Silvia Miksch. 2019. CV3: Visual exploration, assessment, and comparison of CVs. In Computer Graphics Forum, Vol. 38. Wiley Online Library, 107–118.
- Gilbert and Hutto (2014) CHE Gilbert and Erric Hutto. 2014. Vader: A parsimonious rule-based model for sentiment analysis of social media text. In ICWSM, Vol. 81. 82.
- Gross et al. (2017) Allison Gross, Annemarie Hamlin, Billy Merck, Chris Rubio, Jodi Naas, Megan Savage, and Michele DeSilva. 2017. 12.3 Resume Sections and Guidelines. Technical Writing (2017).
- Helwig (1985) Andrew A Helwig. 1985. Corporate recruiter preferences for three resumé styles. Vocational Guidance Quarterly (1985).
- Horn (1988) J Kenneth Horn. 1988. What employers want in cover letters and resumes. Journal of Education for Business 64, 2 (1988), 90–93.
- Hyland (2018) Ken Hyland. 2018. Metadiscourse: Exploring interaction in writing. Bloomsbury Publishing.
- Jovanovic (1984) Boyan Jovanovic. 1984. Matching, turnover, and unemployment. Journal of political Economy 92, 1 (1984), 108–122.
- Judge et al. (1999) Timothy A Judge, Chad A Higgins, Carl J Thoresen, and Murray R Barrick. 1999. The big five personality traits, general mental ability, and career success across the life span. Personnel psychology 52, 3 (1999), 621–652.
- Kenthapadi et al. (2017) Krishnaram Kenthapadi, Benjamin Le, and Ganesh Venkataraman. 2017. Personalized job recommendation system at linkedin: Practical challenges and lessons learned. In Proceedings of the eleventh ACM conference on recommender systems. 346–347.
- Kusner et al. (2015) Matt Kusner, Yu Sun, Nicholas Kolkin, and Kilian Weinberger. 2015. From word embeddings to document distances. In International conference on machine learning. PMLR, 957–966.
- Li et al. (2017a) Huayu Li, Yong Ge, Hengshu Zhu, Hui Xiong, and Hongke Zhao. 2017a. Prospecting the career development of talents: A survival analysis perspective. In Proceedings of the 23rd ACM SIGKDD International Conference on Knowledge Discovery and Data Mining. 917–925.
- Li et al. (2017b) Liangyue Li, How Jing, Hanghang Tong, Jaewon Yang, Qi He, and Bee-Chung Chen. 2017b. Nemo: Next career move prediction with contextual embedding. In Proceedings of the 26th International Conference on World Wide Web Companion. 505–513.
- Meng et al. (2019) Qingxin Meng, Hengshu Zhu, Keli Xiao, Le Zhang, and Hui Xiong. 2019. A hierarchical career-path-aware neural network for job mobility prediction. In Proceedings of the 25th ACM SIGKDD International Conference on Knowledge Discovery & Data Mining. 14–24.
- Mishra and Reddy (2016) Sonu K Mishra and Manoj Reddy. 2016. A bottom-up approach to job recommendation system. In Proceedings of the Recommender Systems Challenge. 1–4.
- Ng et al. (2005) Thomas WH Ng, Lillian T Eby, Kelly L Sorensen, and Daniel C Feldman. 2005. Predictors of objective and subjective career success: A meta-analysis. Personnel psychology 58, 2 (2005), 367–408.
- Oliphant and Alexander III (1982) Van N Oliphant and Elmore R Alexander III. 1982. Reactions to resumes as a function of resume determinateness, applicant characteristics, and sex of raters. Personnel Psychology 35, 4 (1982), 829–842.
- Riloff and Wiebe (2003) Ellen Riloff and Janyce Wiebe. 2003. Learning extraction patterns for subjective expressions. In EMNLP. 105–112.
- Risavy (2017) Stephen D Risavy. 2017. The resume research literature: where have we been and where should we go next? Journal of Educational and Developmental Psychology 7, 1 (2017), 169–187.
- Safavi et al. (2018) Tara Safavi, Maryam Davoodi, and Danai Koutra. 2018. Career transitions and trajectories: A case study in computing. In Proceedings of the 24th ACM SIGKDD International Conference on Knowledge Discovery & Data Mining. 675–684.
- Sap et al. (2017) Maarten Sap, Marcella Cindy Prasettio, Ari Holtzman, Hannah Rashkin, and Yejin Choi. 2017. Connotation frames of power and agency in modern films. In EMNLP. 2329–2334.
- Shalaby et al. (2017) Walid Shalaby, BahaaEddin AlAila, Mohammed Korayem, Layla Pournajaf, Khalifeh AlJadda, Shannon Quinn, and Wlodek Zadrozny. 2017. Help me find a job: A graph-based approach for job recommendation at scale. In 2017 IEEE international conference on big data (big data). IEEE, 1544–1553.
- Stephens et al. (1979) David B Stephens et al. 1979. Getting through the Resume Preparation Maze: Some Empirically Based Guidelines for Resume Format. Vocational Guidance Quarterly 28, 1 (1979), 25–34.
- Wang et al. (2013) Jian Wang, Yi Zhang, Christian Posse, and Anmol Bhasin. 2013. Is it time for a career switch?. In Proceedings of the 22nd international conference on World Wide Web. 1377–1388.
- Weaver (2017) Joshua D Weaver. 2017. Predicting employee performance using text data from resumes. (2017).
- Xu et al. (2016) Huang Xu, Zhiwen Yu, Jingyuan Yang, Hui Xiong, and Hengshu Zhu. 2016. Talent circle detection in job transition networks. In Proceedings of the 22nd ACM SIGKDD International Conference on Knowledge Discovery and Data Mining. 655–664.
- Xu et al. (2018) Huang Xu, Zhiwen Yu, Jingyuan Yang, Hui Xiong, and Hengshu Zhu. 2018. Dynamic talent flow analysis with deep sequence prediction modeling. IEEE Transactions on Knowledge and Data Engineering 31, 10 (2018), 1926–1939.
- Xu et al. (2014) Ye Xu, Zang Li, Abhishek Gupta, Ahmet Bugdayci, and Anmol Bhasin. 2014. Modeling professional similarity by mining professional career trajectories. In Proceedings of the 20th ACM SIGKDD international conference on Knowledge discovery and data mining. 1945–1954.
- Zhang and Wang (2018) Chen Zhang and Hao Wang. 2018. Resumevis: A visual analytics system to discover semantic information in semi-structured resume data. ACM Transactions on Intelligent Systems and Technology (TIST) 10, 1 (2018), 1–25.
- Zhang et al. (2014) Yingya Zhang, Cheng Yang, and Zhixiang Niu. 2014. A research of job recommendation system based on collaborative filtering. In 2014 Seventh International Symposium on Computational Intelligence and Design, Vol. 1. IEEE, 533–538.