Feedback Shaping: A Modeling Approach to
Nurture Content Creation
Abstract.
Social media platforms bring together content creators and content consumers through recommender systems like newsfeed. The focus of such recommender systems has thus far been primarily on modeling the content consumer preferences and optimizing for their experience. However, it is equally critical to nurture content creation by prioritizing the creators’ interests, as quality content forms the seed for sustainable engagement and conversations, bringing in new consumers while retaining existing ones. In this work, we propose a modeling approach to predict how feedback from content consumers incentivizes creators. We then leverage this model to optimize the newsfeed experience for content creators by reshaping the feedback distribution, leading to a more active content ecosystem. Practically, we discuss how we balance the user experience for both consumers and creators, and how we carry out online A/B tests with strong network effects. We present a deployed use case on the LinkedIn newsfeed, where we used this approach to improve content creation significantly without compromising the consumers’ experience.
1. Introduction
Content ecosystems are an integral component of several social media platforms. This is true of Facebook, Instagram, LinkedIn, Twitter, and SnapChat, to name a few. In such an ecosystem, members play two roles — one as content creators and the other as content consumers. A creator creates and publishes, or reshares various forms of content (e.g., articles, images, videos, etc.) to express her views and opinions, which add to the content liquidity for consumers who can see that creator’s content. Consumers, in return, provide attention and feedback to the creators. A content ecosystem is very likely to grow when both creators and consumers are thriving.
There has been plenty of research (Agarwal et al., 2011; Agarwal et al., 2014, 2015b; Gubin et al., 2017) in recommender systems on predicting what consumers may find interesting. There are a few reasons for this focus. First, the modeling problem of identifying content items (from a candidate pool of potentially millions) is challenging, yet well-specified since the consumer behavior is observed and attributable to the recommendation. Second, the impact is fairly large if the candidate pool is big. Finally, measuring progress of modeling improvements is straightforward both via offline validation and online experiments randomized on the consumer.
Modeling approaches to improve the creator experience have been less common. To formulate the problem, it is important to enumerate certain salient points about the creator experience on such platforms. Upon sharing a piece of content, the creator’s network (i.e., audience) can view and interact with the content by liking, commenting and re-sharing it. We refer to these signals from the consumers to the creator collectively as feedback. One key motivation for content creators is to hear from their desired audience via feedback. This has been proved by past studies which demonstrate the effect of feedback as a strong social influence in online communities (Hoffmann et al., 2009; Eckles et al., 2016) and we have also observed a positive correlation between feedback and future content creation in the LinkedIn content ecosystem (analysis in Section 4).
The creator is notified about the feedback via notifications and dashboards among other means, with different platforms employing slightly different means. Creator-facing dashboards facilitate insights of how their audience are engaging with their content. Occasionally, some platforms boost creators when they satisfy some special criteria. An example is a platform selectively notifying a creator’s audience when the creator creates content after a long period of time. However, there is no systematic, data-driven, model-based solution to this problem to the best of our knowledge. To build such a solution, we need to address two key challenges:
-
•
Attribution of the reward (i.e., future creation) to the intervention (i.e., feedback) is difficult, as the ground truth effects of feedback to creation is unobservable.
-
•
Standard randomized experiments assume Stable Unit Treatment Value Assumption (SUTVA) (Rubin, 1974). However, measuring impact on creators would violate this assumption and requires a special design of the experiment.
There is also the additional problem of unobservable confounders which influence (may be causally) creation behavior. We do not address this further in our work, but call it out as a potential risk.
Our proposed solution involves the definition of a creator side utility which quantifies the incremental creation behavior driven by an additional unit of feedback, henceforth called “feedback sensitivity”. We propose a model-based method to estimate each creator’s feedback sensitivity and then use that estimated sensitivity to modify consumer side recommendations by adding a creator side utility to the ranking or scoring function. We use this solution on the LinkedIn newsfeed and show how it improves upon the previous heuristic based approach (Barrilleaux and Wang, 2018).
The key contributions of our work are as follows:
-
•
Defining a new creator side utility based on feedback sensitivity and proposing a model-based approach to estimate that utility. Our proposal includes strategies to deal with the unobservable ground truth scenario in both offline validation and online experimentation scenarios.
-
•
Proposing and implementing a framework that uses this creator side utility in an online ranking system to increase future creation activity, by reshaping the distribution of feedback.
-
•
Demonstrating success from online experiments on a social media platform (i.e., LinkedIn) which benefited hundreds of thousands of creators, without compromising the consumer experience.
The paper is organized as follows: Section 2 discusses the related work in developing feed recommendation system; estimating unobservable utility; optimizing creator side utility; and measuring peer impacts through the network A/B experiment design. We formally describe our problem statement in Section 3 and discuss how we develop our models and estimate the utilities in Section 4. Next, we show the application of utilities in Feed recommendation system in Section 5 and illustrate our system architecture in section 6. Finally, we summarize our findings and learnings along with some future work in Section 7.
2. Related Work
There have been several approaches proposed to predict model-item click behavior including item-based collaborative filtering (Sarwar et al., 2001), matrix factorization (Koren et al., 2009) (popularized immensely by the Netflix challenge) and wide and deep recommender systems (Cheng et al., 2016). This prediction task is a basic building block for consumer utility optimization in social media platform products like newsfeed. There are several papers describing the nuances of ranking a newsfeed — both at LinkedIn (Agarwal et al., 2014, 2015b) and beyond (Li et al., 2010; Gubin et al., 2017). However, all of these works focus on the consumer experience optimization.
One other related line of work is multi-objective optimization. As the products evolve, multiple objectives (e.g., member engagement, ads revenue) are driven by a complex product like newsfeed. In order to achieve the optimal trade-off among potentially conflicting objectives, constrained optimization based approaches relying on Lagrangian dual estimation have been proposed (Agarwal et al., 2011) and used in multiple applications (Agarwal et al., 2015a; Gupta et al., 2016; Gao et al., 2018). We use the same approach to introduce a creator side utility into the existing multi-objective feed ranking function.
There has been some work on improving the creator experience and incenting them to create more content. Examples include motivating newer users on Facebook to become content creators (Burke et al., 2009), studying the impact of social ties on content creation, and vice versa (Shriver et al., 2013), increasing content creation in a non-social network setting by finding synergies between content creation and information extraction tasks (Hoffmann et al., 2009). More recently, there was a heuristic-based creator utility proposed and tested at LinkedIn (Barrilleaux and Wang, 2018).
Unlike the observed response prediction problem, which is often formulated as a classification problem, the exact feedback sensitivity is not observable. A creator receives feedback from many members in her potential audience before creating again. We do not have observation data on how the creator would behave if a particular member’s feedback was the last feedback (in case it isn’t). One recent work studying such personalized (or fine-grained) effect estimation looks at a related problem of how individual notifications affect a member’s propensity to visit a site (Yuan et al., 2019). An alternate approach aimed at estimating more coarse-grained effect is observational causal study. Such studies estimate the average treatment effect of the intervention on the potential outcome (Aronow et al., 2017; Toulis and Kao, 2013; Frangakis and Rubin, 2002; Forastiere et al., 2017). Our work follows the methodology introduced in (Yuan et al., 2019) to a large extent.
Finally, in order to test the benefit of introducing our creator utility in the LinkedIn feed ranking function, we need to design a special randomized test. Conventional randomized tests (Rubin, 1980) (or A/B tests or bucket tests) suffice for consumer side optimization, but are inadequate to measure the impact of creators. This is due to the potential network effect of any treatment that redistributes feedback, since such a treatment violates the “Stable Unit Treatment Value Assumption” or SUTVA principle (Rubin, 1974). Thankfully, this has been a hot research area in the last few years (Katzir et al., 2012; Toulis and Kao, 2013; Ugander et al., 2013; Aronow and Samii, 2012; Gui et al., 2015; Kohavi et al., 2013; Eckles et al., 2016; Taylor and Eckles, 2017). At LinkedIn, we currently use a modified version (Saint-Jacques et al., 2019) of the method described in (Gui et al., 2015), which was also used in (Barrilleaux and Wang, 2018).
3. Problem Statement
A content creator on a social network is typically motivated to engage with her intended audience. Established content creators generally prefer their audience to keep growing in size, while new ones would love to get some feedback to confirm that their voice is being heard. If creators find value in the platform, they continue to create more – this assumption forms the basis of our choice to use creation propensity as a proxy for creator value. A model which better predicts how feedback affects a creator’s future creation behavior can be effectively used as a proxy to represent creator interests during item ranking for consumers.
Our focus is to understand how feedback as an intervention can facilitate creators to create more. The estimated impact of feedback on a creator can be used as a utility to balance the interests between consumers and creators using a linear combination. It can be shown that this is also the solution to a constrained optimization problem of maximizing consumer utility while ensuring a certain amount of creator utility (Agarwal et al., 2012).
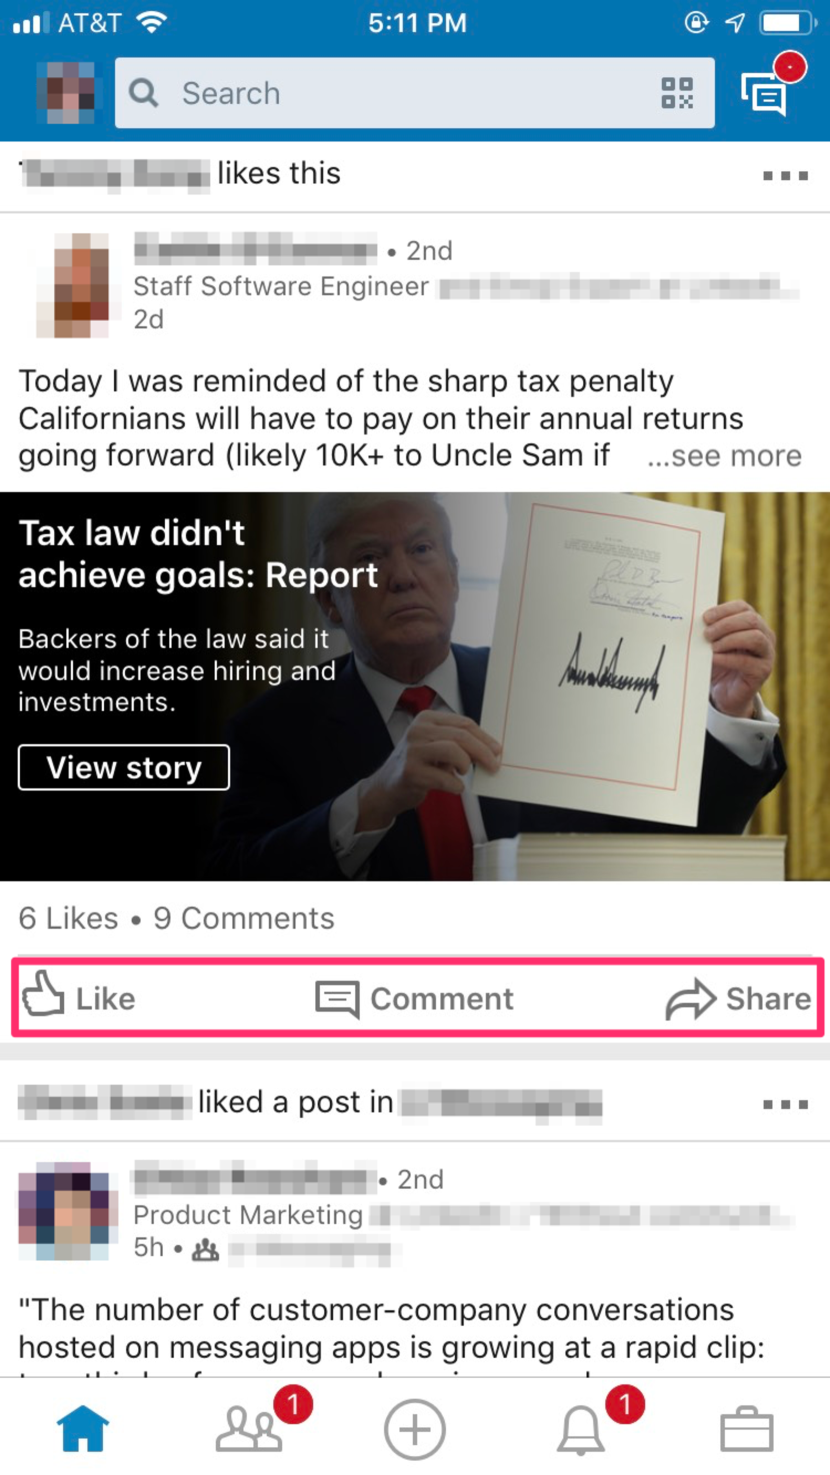
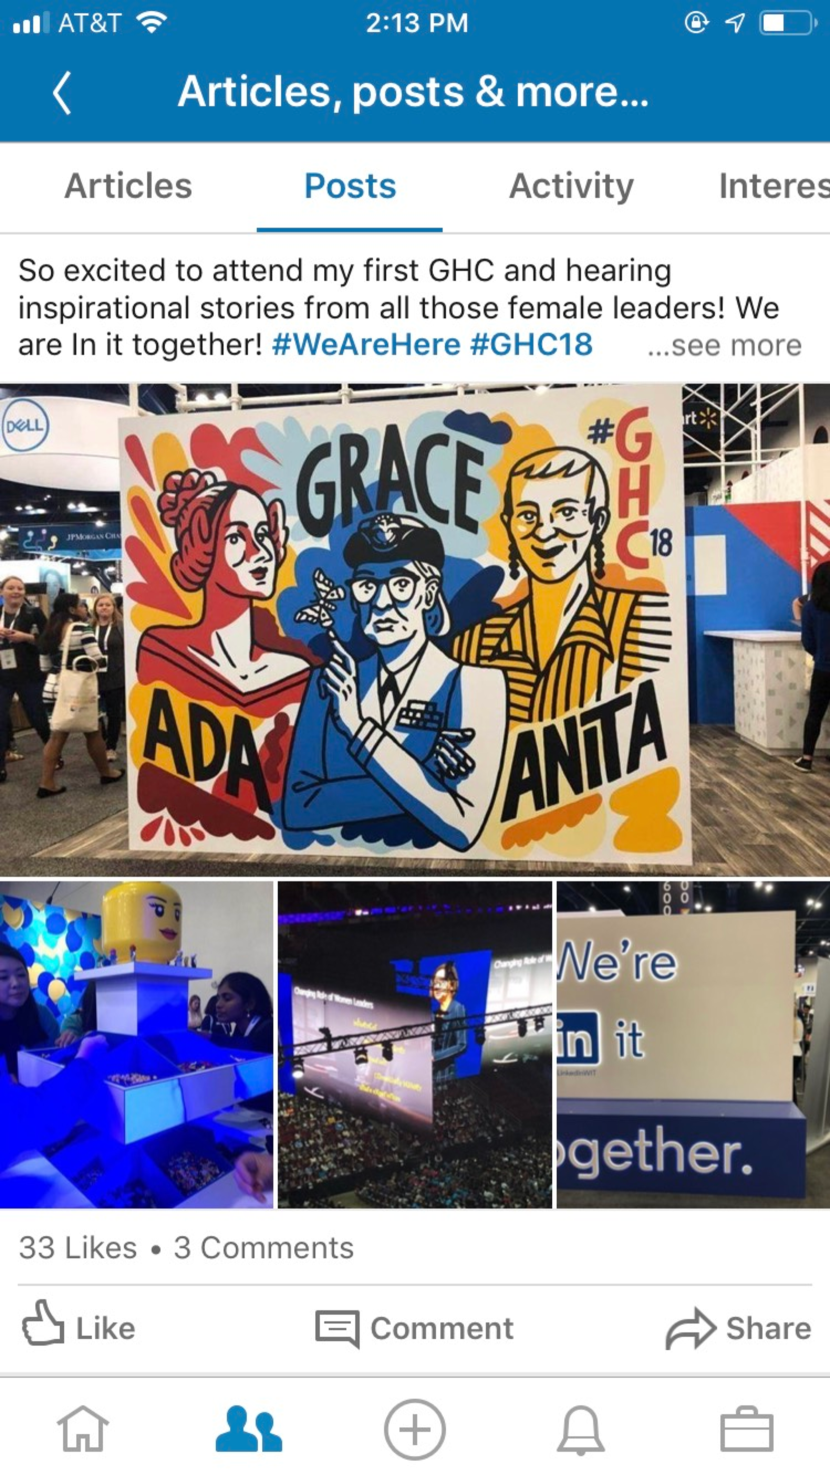


The primary interface for consumers to interact with content and provide feedback to creators is a newsfeed, instances of which are shown in Figures 1a-1 (LinkedIn mobile app) and 1b-1 (Instagram mobile app). Users can also use this interface (e.g., the post button on LinkedIn), or an adjacent screen (as on Instagram) to create and post content. Feedback is received and first presented to creators through notifications as shown in Figures 1a-3 and 1b-3, and creators can also get an aggregated view of the feedback and pursue subsequent conversations (e.g., replying to comments) from the self activity dashboard page (examples from LinkedIn and Instagram shown in Figures 1a-2 and 1b-2). Other social media platforms like Facebook and WeChat have similar product mechanisms for creators and consumers. Based on the feedback loop, it makes most sense to change the ranking on feed (the primary consumer interface) to provide more effective feedback to creators.
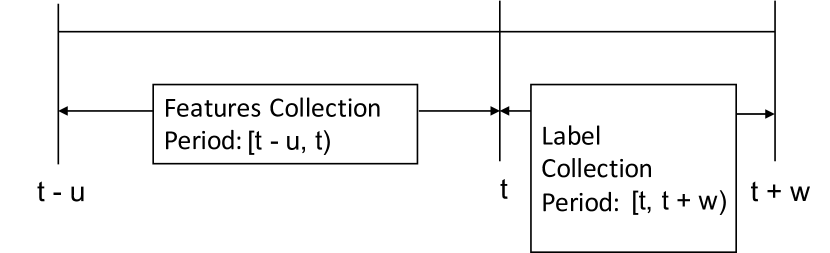
We now define the problem formally as follows. We use as an index over users. Let denote a discrete time point, and represent time intervals, be the number of content pieces user created during the time window and be the user features for user computed during the time window . Figure 2 illustrates the timeline. We then estimate the creator side utility with feedback sensitivity utilities based on the prediction of probability of creating, (details will be illustrated in Section 4). The features, , comprise of:
-
•
is the number of feedback items that user received in the time window .
-
•
is the set of other static features of user i at time .
-
•
are the interaction terms between the feedback features and the static user features. For instance “feedback in last 7 days” “member locale” of user , which would help personalize the estimation of the effect of feedback.
Prior work in optimizing creator side utility at LinkedIn introduced a heuristic model (Barrilleaux and Wang, 2018). Our goal is to improve this baseline heuristic with a model-based feedback sensitivity utility.
4. Modeling Creation Behavior and Utility Estimations
We now describe our future creation prediction model, and how that is used to come up with the feedback sensitivity estimation. Some of our modeling choices are influenced by member engagement patterns on LinkedIn, where different choices may be more pertinent in a non-LinkedIn context. To make the narrative accurate yet generally informative, we will clearly delineate those instances and also present the abstract learnings which are more broadly applicable.
4.1. Response Prediction Models
As we plan to serve the utilities in large scale online recommendation platforms where the latency tolerance is low, we focus on developing scalable linear or non-linear models to quantify how effective feedback can motivate a content creator to create again in the future on LinkedIn.
4.1.1. pCreate Models
The objective of the ”pCreate” model is to predict the probability of user creating at least one content piece during the time window given all the features, i.e., . Instead of predicting the number of content pieces created, we use the binarized version of the response because the number of creations for frequent creators is quite noisy, and the binarization retains most of the information since only a small fraction of all creators are constant creators. In a general setting, it may be more useful to formulate this as a regression problem with as the response, and an appropriate link function depending on the distribution of .
Linear Logistic Model
We use a linear logistic function to model the probability of creation as follows:
| (1) | ||||
where is the global intercept, , , and are the coefficients for , , and .
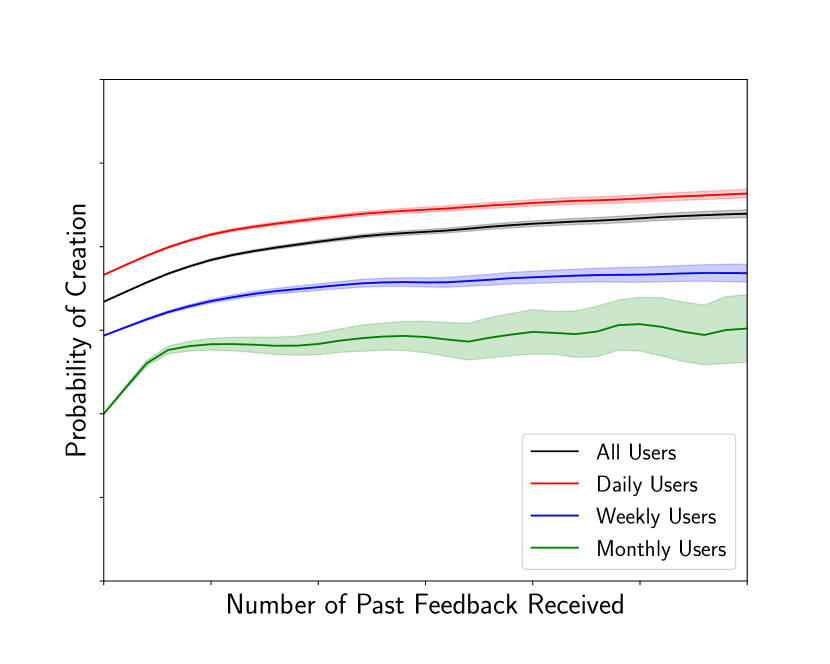
The relationship between feedback and a user’s future creation is shown in Figure 3. The plot demonstrates three key things: (1) The incremental value from feedback tends to diminish with increasing feedback amount; (2) The impact of feedback on creation varies with certain member features like activity level; and (3) The non-linearity between probability of creation and feedback can not be captured by the sigmoid function (the logit of the response would still be non-linear with feedback).
To address the non-linearity between and , we bucketized the numerical feedback feature into a -level categorical feature (the exact bucketization points are guided by the above correlation analysis) to allow for flexibility in the estimation of the feedback effect. We also include feedback interaction features in the linear model to better distinguish among member cohorts on how feedback affects future creation.
Tree Model
The non-linearity between features and response can also be handled by a tree model. To this end, we used an ensemble model of decision trees via the XGBoost library (Chen and Guestrin, 2016). This approach no longer requires the bucketization of the feedback feature , or the explicit use of interaction features .
4.2. Estimation of Feedback Sensitivity Utility
We define the “feedback sensitivity utility” as a delta probability of creation given an increase of feedback. The delta score can be estimated as follows:
-
(1)
Fetch all features for member .
-
(2)
Derive the updated feedback feature vector given the user receives one incremental unit of feedback.
-
(3)
Calculate the utility using estimated probability of content creation as
(2)
4.2.1. Fit Utility to Exponential Decay Form
Data sparsity is a major challenge in modeling user content creation behavior, especially for less active users and creators. The sparsity can make the delta estimates of such users quite noisy, hence we use a parameterized approach to smooth these estimates. Based on the observation in Figure 3, we use an exponential decay form. The utility function is then fitted using the following process.
-
(1)
Let be a matrix as shown in Equation 3, where represents a list of possible values of the “feedback received” feature, and each value is a representative of the feedback value interval (we use the minimum value of the interval) it represents:
(3) -
(2)
Estimate the delta effect of feedback as the change in creation probability as we transition from one feedback level to the next higher one. is the initial feedback level of feedback.
(4) -
(3)
Let be a vector of the level-specific feedback sensitivity of user :
(5) -
(4)
Now to fit the user-specific curve, let denote the exponential decay factor, and denote an offset. In order to fit these two parameters, we have data points:
(6) -
(5)
Taking logarithm on both sides of the Equation 6, we have:
(7) -
(6)
We can solve for and for each user as Equation 8 shown.
(8)
When we train trees using XGBoost, we use the actual, instead of bucketized, feedback value as feature. However, when fitting and , we currently use the same feedback intervals as in Logistic model. Alternately, we could have the tree model learn intervals, and generate a system of data points per user, sampling data point per learnt interval.
4.3. Data Collection
Clean and high quality training data is critical to building a good model. We sample from one month of 100M active users’ data at LinkedIn, and track their creation behavior. We include three major categories of features () as the following:
-
•
: Feedback features, the intervention feature.
-
•
: User profile features, such as country, preferred language, job title, etc. Also, static features from the user’s network (e.g., number of connections, followers and followees).
-
•
: Activity features including past visits, feed consumption features, likes, shares, comments, etc.
The data collection process is the same as described previously (and shown in Figure 2). The response interval can be defined as day, week, or longer — we use week. We compute the dynamic (activity based) features using one month data. Hence, the interval is month. We collect the static (profile/network based) features as a snapshot of the user’s status at time .
4.4. Offline Evaluation Analysis
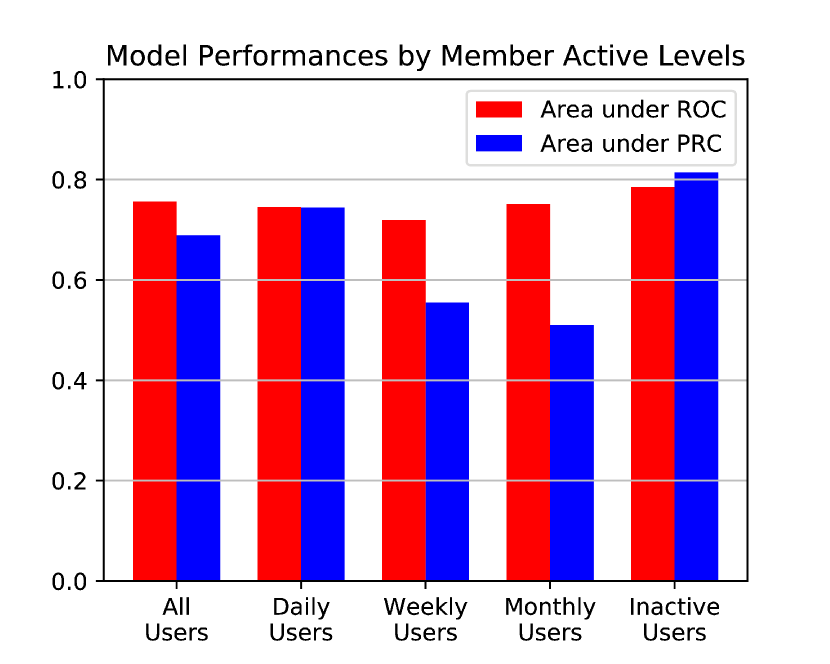
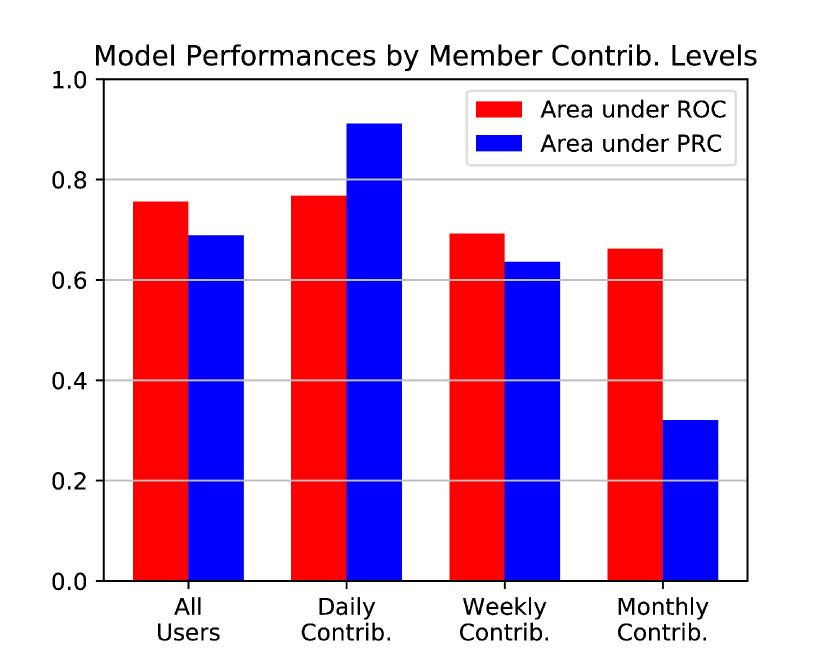
This section presents the offline performance of the logistic regression model and the XGBoost model to predict content creation. The collected data is partitioned randomly into training, validation and testing datasets. The validation dataset is used for hyper-parameter tuning (i.e., the regularization parameters in both logistic and tree models). Besides the model performance on all users, we also look at the results for specific member cohorts, segmented by member activity levels and contribution levels. Member activity levels represent the frequency of LinkedIn visits, while contribution levels represent the frequency of generating or distributing (e.g., share, like, comment, message) content contributions. Contributions are a super-set of creation, and the relaxed definition makes the least active cohorts less sparse. The segmented view allows us to understand the current model performance better and identify areas of improvement.
4.4.1. Logistic regression model performance
Figure 4a-2 shows the performance of the logistic regression model in terms of the area under ROC (AUROC) and the area under Precision-Recall curve (AUPRC). The model achieved in AUROC and in AUPRC across all users. When sliced by user activity levels (Figure 4a-1), the model has the best performance for inactive users, followed by daily users. Weekly users and monthly users’ content creation behavior is more difficult to predict. Slicing by user contribution levels (Figure 4a-2), daily contributors achieved the best model performance, followed by weekly and then monthly contributors. Both the segmented results indicate that the model performance improves with higher activity and creation levels. This is likely because users who visit LinkedIn frequently and/or contribute more frequently provide more data for training and their activities are more structured. The high accuracy for Inactive users has very low confidence (and hence is noisy), as there is very little data for that segment. Since they also account for less than of all data, we will exclude them from the rest of the discussion.
4.4.2. Feedback sensitivity
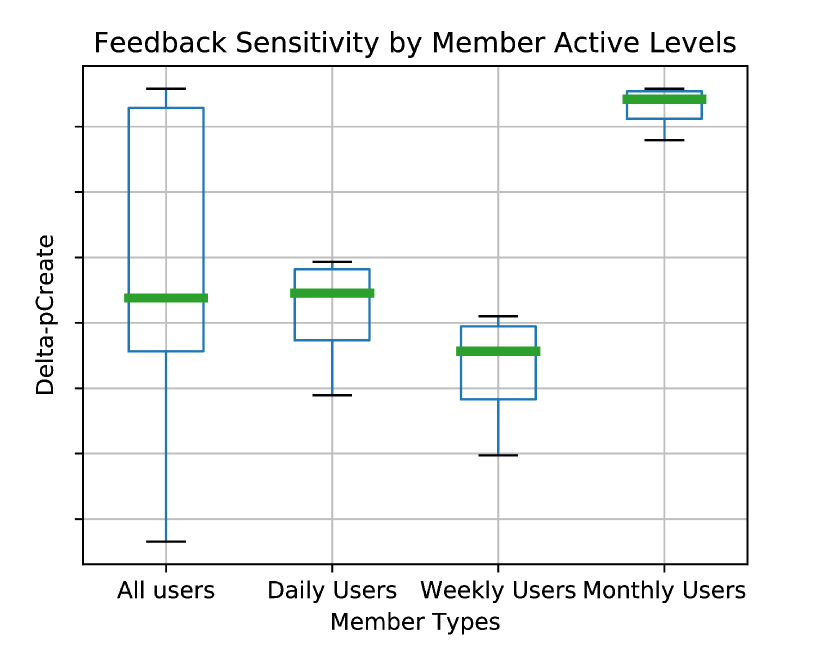
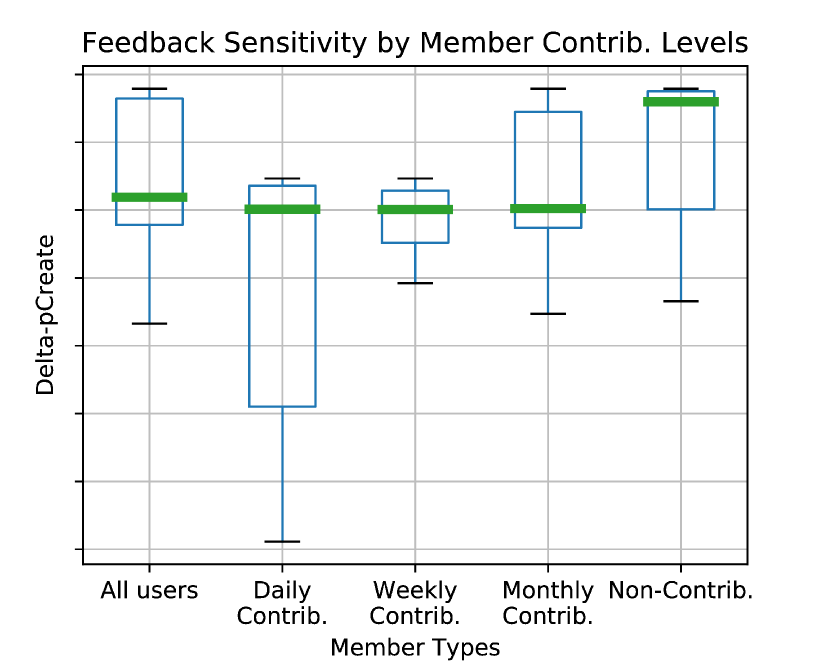
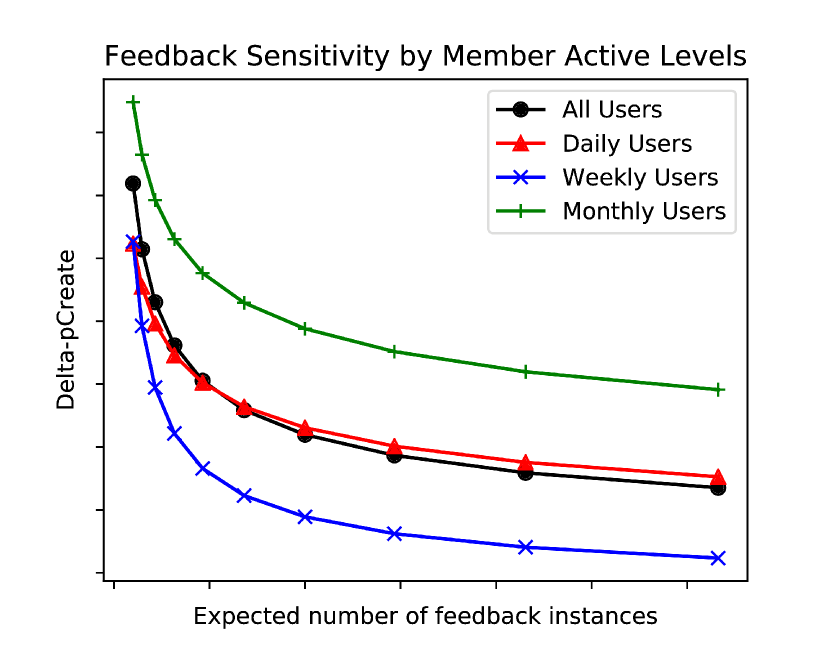
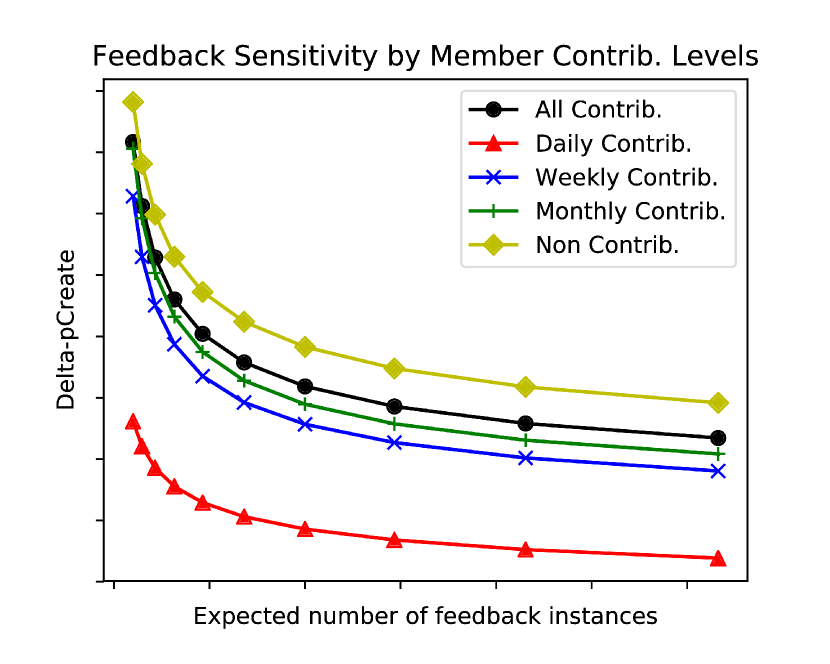
As explained in Section 4.2, we utilized the model results in either the feedback sensitivity form (), or the exponential decay form ( and ). The results of these two forms, again segmented by member activity levels and contribution levels, are shown in Figure 4b-2 and Figure 4c-2. The segmented analyses for feedback sensitivity identifies the most and least feedback sensitive cohorts.
As can be seen in Figure 4b-1 and Figure 4b-2, feedback sensitivity level is more diverse and separable when segmented by activity levels as compared to contribution levels. Monthly users are significantly more sensitive to feedback than daily and weekly users, and daily users has slightly higher feedback sensitivity than weekly users. This is likely because Monthly users receive less feedback than more active Daily and Weekly users, and hence additional feedback has higher value to them. This also aligns with the analysis shown in Figure 3. Among the various contribution levels, daily, weekly and monthly contributors have comparable median feedback sensitivities, with good overlap in the range as well. Non-contributors (who have not contributed in the past 4 weeks) have significantly higher median feedback sensitivity. Therefore, infrequent contributors who still actively visit LinkedIn (at least once a month) are quite sensitive to feedback.
Figure 4c-2 shows the feedback sensitivity after fitting the utility in the exponential decay form. The x-axis represents the expected number of feedback instances and y-axis represents feedback sensitivity of receiving one more feedback instance. The fitted feedback sensitivities under different cohorts are consistent (in terms of relative orders) with the results shown in Figure 4b-2. The use of fitted feedback sensitivity is preferred when the number of cohorts is large as the data of some cohorts could be sparse. Although different member types have slightly different rates of decay, the order of sensitivity does not change as the expected feedback instance increases. Therefore, member type is a more important factor when the expected feedback level is similar.
4.4.3. Tree model performance
Table 1 shows the performance of the XGBoost model and its comparison to the logistic regression model for different user activity levels. The same set of data was used for both model performance analyses. However, the XGBoost model did not use interaction features, and the feedback feature is not bucketized, as tree models inherently learn nonlinear relationships and allow the formation of discriminative interaction features. The XGBoost model performed better for all member cohorts. Overall, the XGBoost model achieved in AUROC and in AUPRC as compared to the logistic regression model. The improvement is more significant for weekly users and monthly users, especially in AUPRC (e.g., for weekly users and for monthly users in AUPRC). As the weekly and monthly users are more sensitive to feedback (illustrated in Figure 4b-2), improving model accuracy for these members is most beneficial. The improvement from the non-linear model (compared to the linear model) is expected. We were more interested in quantifying the extent of the improvement.
| Member Types | Metrics | Logistic | XGBoost | Gain |
|---|---|---|---|---|
| AUROC | ||||
| All Users | AUPRC | 0.690 | ||
| AUROC | ||||
| Daily Users | AUPRC | 0.742 | ||
| AUROC | ||||
| Weekly Users | AUPRC | 0.557 | ||
| AUROC | ||||
| Monthly Users | AUPRC | 0.502 | ||
| AUROC | ||||
| Inactive Users | AUPRC | 0.820 |
5. Feed Recommendation Application
We now discuss how to use the ”pCreate” model-based feedback sensitivity to modify feed ranking and incentivize content creators. We introduced two forms of feedback sensitivity related utilities: (1) as a direct proxy of creator utility represents the incremental probability of a specific creator generating some content if he or she receives higher amount of feedback; (2) and represents the decay rate and intercept of feedback value to creation assuming an exponential decay form of the incremental feedback value.
We modify the feed ranking score formulation to incorporate the utilities (as described in Section 5.1) and launched online A/B tests to compare the pCreate model-based feedback utilities with the baseline model (results in Section 5.2).
5.1. Modifying feed ranking
If an item , whose creator is user , is being shown to a consumer , then its feed score can be written as:
| (9) | ||||
where is the creator side utility for , is the probability of consumer reacting to item from creator which gives feedback to creator and is a parameter that controls how much we prioritize the consumer utility over the creator utility. Following are the representations of the creator utility, , in the heuristic approach and the pCreate model.
5.1.1. Baseline Heuristic Model
The heuristic model leverages a prediction model on the expectation of feedback ()) assuming an exponential decay function between feedback and the creation utility. The creator side utility is defined formally as
| (10) |
5.1.2. pCreate Model
We represent the creator side utility using the delta feedback effect as:
| (11) |
One can also explore models which make specific to the consumer as well, but that is a direction we do not explore more in this work. An alternative is to represent the creator utility assuming the exponential decay of the incremental feedback value as:
| (12) |
We chose the parameterized version of utilities (, ) due to a few practical advantages over the direct delta effect estimator:
-
•
With the creator utility definition in Equation 12, we can keep our feedback sensitivity estimation flows offline, and still leverage the real-time estimations of expected feedback, , using the online features.
-
•
The resultant utility scores are smoother than , especially for the users who are infrequent creators, or who have received very little feedback in the past.
5.2. Online A/B Tests
We set up online A/B experiments on both consumers and creators separately to evaluate the performance of our pCreate model against the baseline heuristic. Table 2 shows the list of metrics that we are interested in. They represent metrics for consumer engagement as well as creator activity.
| Metrics | Descriptions |
|---|---|
| Contributions | Number of activities that generate or distribute content in the ecosystem (includes the public ones: shares, likes, comments; and the private ones like messages). |
| (Public/Private) Contributors | Unique number of users who have (public/private) contribution activities. |
| Contributors with Response | Unique number of contributors who receive a response within a time window. |
| Retained Creators | Unique number of content creators who are retained from a previous time window. |
| Feed Viral Actions | Total numbers of viral actions (like, share, comment) on Feed. |
| Feed Viral Actors | Unique number of users who make viral actions. |
| Feed Interactions | Total (clicks + viral actions) on Feed. |
5.2.1. Consumer Side Experiments
Consumer side effects can be measured through the standard online randomized experiment set up. The first step in running these experiments is to find an appropriate value of .
Tuning
is a parameter (introduced in Equation 9) which controls the balance of the creator and consumer utility. For both the heuristic model and the pCreate models, we first ran some offline simulations to pick a range of which did not drop the consumer metrics too much. The eventual fine-tuning was done by online A/B tests performed by randomization on the consumer side. The performance numbers reported are based on an that was picked in this manner.
Once is decided, we ran a standard A/B test to observe the consumer side effect of both the heuristic model and the parameterized form of feedback sensitivity. For the base heuristic model, was picked to make the consumer metrics neutral. For the pCreate model, we observed small lifts even in the consumer side metrics with a tuned value of , and also some sensitivity of the metrics with variation in . The results for two values of from an online experiment are shown in Table 3. This indicates the feedback sensitivity is not only positively correlated with consumer metrics of interest, it captures certain aspects of consumer engagement, which our current consumer utilities are not covering. However, it should also be noted that the consumer side wins are small. Also, both the heuristic base model and the pCreate model test boosts the term, which is part of the consumer utility as well.
| Metrics | Delta % Effects (p-value) | |
|---|---|---|
| Contributors (Daily) | () | Neutral |
| Contributors (Weekly) | () | Neutral |
| Public Contributors (Daily) | () | () |
| Feed Viral Actors | () | () |
| Feed Interactions | Neutral | () |
5.2.2. Creator Side Experiments
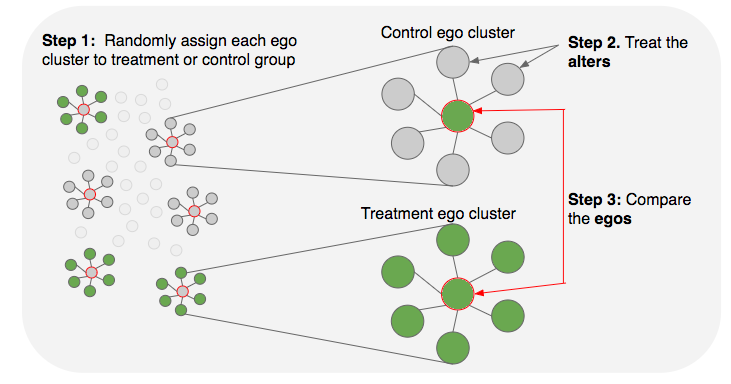
To measure creator side impact, we leveraged the ”Ego Clusters” experiment set up where the randomization unit is a cluster of users rather than an individual user (Saint-Jacques et al., 2019; Barrilleaux and Wang, 2018). The measurement is only done on the ego member of the cluster. Such a randomization on the clusters enables measurement of the effect from peers/network, but the trade-off is a large reduction on the sample size which leads to: (1) Low statistical power and high error-margin in tests. (2) Under-estimation of the treatment effect due to partial overlap in clusters.
As Figure 5 illustrates, in this method, we take a sample of members referred to as the “Egos” (following ego network definitions (Arnaboldi et al., 2012)) and randomize them into either the treatment or control group. But instead of enabling the treatment or control experience for the Egos themselves, we treat their Alters (their connections): (1) Feedback sensitivity utilities are incorporated in ranking Alters’ feed for the treatment clusters. (2) Alters’ feed ranking uses baseline heuristic model for the control.
Ego cluster experiments aim to replicate for each Ego, a network which is treated as if the whole population has been treated. This is the rationale behind the described treatment allocation, post randomization of the clusters. Due to the aforementioned limitations of cluster-level randomization, only relatively large impacts can be captured by the ”Ego Clusters” experiments with any reasonable statistical significance (i.e., low p-value). Table 4 shows the creator side metrics impact from: (1) Base heuristic model vs control (which had no creator utility term) (2) pCreate model (treatment) vs the base heuristic model (control).
The heuristic model launch showed significant lifts on the creator metrics ( retained creators) along with an increase on the feed activities metrics ( feed viral actions on mobile). The pCreate model based utilities further improve the creator experience where we observe incremental positive impact on feed activities metrics ( feed viral actions on desktop) and an increase in number of contributors who receive a response in time ( public contributor with response). Although the significant impacts on overall contributors metric are not yet detected, metrics regarding to heavier type of contribution activities (Weekly Commenter and Total Reshares) have also shown large improvements. We also observed positive incremental lift () on Retained Creators (weekly) metric, however the impact is not significant potentially due to the limited statistical power in the network A/B measurement.
The fact that we measured significant positive impact on various critical metrics on the creator side over the baseline model is a strong validation of our feedback sensitivity utilities. We are currently in the process of testing the tree model (XGBoost) based feedback sensitivity utilities online, and expect an even greater amount of metric improvement (based on the offline results previously reported).
| Metrics | Delta % Effects (p-value) | |
|---|---|---|
| Heuristic vs No creator-utility | Pcreate vs Heuristic | |
| Public Contributors with Response (Daily) | NA | () |
| Retained Creators (Weekly) | () | () |
| Feed Viral Actions (mobile) | () | Neutral |
| Feed Viral Actions (desktop) | Neutral | () |
| Commenter (Weekly) | Neutral | () |
| Total Reshares | Neutral | () |
6. System Architecture
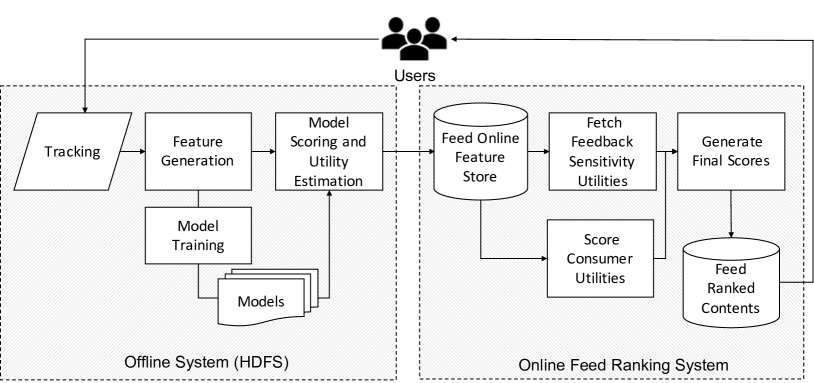
We summarize a design of the system that generates the creator side utility and incorporates it in the feed online recommendation system in Figure 6. Since feedback sensitivity is relatively static, we build an offline pipeline to generate daily estimates with the following data processing flows:
-
(1)
A flow to fetch and process tracking data and to generate offline features;
-
(2)
Model training pipeline to generate “pCreate” models with regularly updated feature data.
-
(3)
Scoring flows to calculate the probability of creation based on the features, and calculate the feedback sensitivity utilities (, , ) as illustrated in Section 4.2.
-
(4)
A job to regularly push updated utility scores computed by the offline flow to an online feature store.
We process the tracking data, do feature transformation and train the models on Spark. Training is done via Photon library (Ogilvie, 2016) for logistic regression and XGBoost library (Chen and Guestrin, 2016) for the gradient boosted tree model. In the online feed recommendation system, various sources of updates (e.g., network’s updates, job recommendations, and breaking news) are evaluated via a real-time ranker. The system scores the consumer side utilities using online features and fetches the feedback sensitivity utilities from the online store. It then combines the utilities and generates the final ranking.
7. Conclusion
In this paper, we present an approach to better represent creators’ interests in a content ecosystem via a consumer facing product, namely newsfeed. There are two key components — first, building a model to predict creation behavior and estimate feedback sensitivity of each creator, and second, incorporating the personalized creator sensitivities into feed ranking and designing experiments to measure improvements on the creator and consumer side. We showed various offline validation for the precision of our modeling approach, and online validation of the approach which is now fully deployed on the LinkedIn feed and delivering significant wins for creators without compromising the consumer experience.
We are currently testing the tree models in production. One specific extension which seems promising is identifying how creation behavior is affected by different kinds of feedback (i.e., likes, comments, reshares) as well as feedback from different consumers. Another line of future work is more accurate attribution since the causal effect of any specific feedback is unobserved, and possible solutions may involve designing special randomized experiments.
Acknowledgement
We would like to thank Preetam Nandy, Rakesh Malladi, Shipeng Yu, Yan Gao and the anonymous KDD reviewers for their careful review and insightful comments. Ajith Muralidharan and Kinjal Basu provided great input during the problem formulation phase. Dylan Wang and the Feed AI team were true partners in the implementation and launch of experiments.
References
- (1)
- xln (2015) 2015. LinkedIn Engineering XLNT. https://engineering.linkedin.com/teams/data/projects/xlnt. (2015).
- Agarwal et al. (2015a) Deepak Agarwal, Shaunak Chatterjee, Yang Yang, and Liang Zhang. 2015a. Constrained optimization for homepage relevance. In Proceedings of the 24th International Conference on World Wide Web. ACM, 375–384.
- Agarwal et al. (2011) Deepak Agarwal, Bee-Chung Chen, Pradheep Elango, and Xuanhui Wang. 2011. Click Shaping to Optimize Multiple Objectives. In KDD. ACM, New York, NY, USA, 132–140.
- Agarwal et al. (2012) Deepak Agarwal, Bee-Chung Chen, Pradheep Elango, and Xuanhui Wang. 2012. Personalized Click Shaping Through Lagrangian Duality for Online Recommendation. In SIGIR. ACM, New York, NY, USA, 485–494.
- Agarwal et al. (2014) Deepak Agarwal, Bee-Chung Chen, Rupesh Gupta, Joshua Hartman, Qi He, Anand Iyer, Sumanth Kolar, Yiming Ma, Pannagadatta Shivaswamy, Ajit Singh, and Liang Zhang. 2014. Activity Ranking in LinkedIn Feed. In KDD. ACM, New York, NY, USA, 1603–1612.
- Agarwal et al. (2015b) Deepak Agarwal, Bee-Chung Chen, Qi He, Zhenhao Hua, Guy Lebanon, Yiming Ma, Pannagadatta Shivaswamy, Hsiao-Ping Tseng, Jaewon Yang, and Liang Zhang. 2015b. Personalizing linkedin feed. In KDD. ACM, 1651–1660.
- Arnaboldi et al. (2012) V. Arnaboldi, M. Conti, A. Passarella, and F. Pezzoni. 2012. Analysis of Ego Network Structure in Online Social Networks. In 2012 International Conference on Privacy, Security, Risk and Trust and 2012 International Confernece on Social Computing. 31–40. https://doi.org/10.1109/SocialCom-PASSAT.2012.41
- Aronow and Samii (2012) Peter M Aronow and Cyrus Samii. 2012. Estimating average causal effects under general interference. In Summer Meeting of the Society for Political Methodology, University of North Carolina, Chapel Hill, July. Citeseer, 19–21.
- Aronow et al. (2017) Peter M Aronow, Cyrus Samii, et al. 2017. Estimating average causal effects under general interference, with application to a social network experiment. The Annals of Applied Statistics 11, 4 (2017), 1912–1947.
- Barrilleaux and Wang (2018) Bonnie Barrilleaux and Dylan Wang. 2018. Spreading the Love in the LinkedIn Feed with Creator-Side Optimization. https://engineering.linkedin.com/blog/2018/10/linkedin-feed-with-creator-side-optimization
- Burke et al. (2009) Moira Burke, Cameron Marlow, and Thomas Lento. 2009. Feed me: motivating newcomer contribution in social network sites. In Proceedings of the SIGCHI conference on human factors in computing systems. ACM, 945–954.
- Chen and Guestrin (2016) Tianqi Chen and Carlos Guestrin. 2016. XGBoost: A Scalable Tree Boosting System. In Proceedings of the 22Nd ACM SIGKDD International Conference on Knowledge Discovery and Data Mining (KDD ’16). ACM, New York, NY, USA, 785–794. https://doi.org/10.1145/2939672.2939785
- Cheng et al. (2016) Heng-Tze Cheng, Levent Koc, Jeremiah Harmsen, Tal Shaked, Tushar Chandra, Hrishi Aradhye, Glen Anderson, Greg Corrado, Wei Chai, Mustafa Ispir, et al. 2016. Wide & deep learning for recommender systems. In Proceedings of the 1st Workshop on Deep Learning for Recommender Systems. ACM, 7–10.
- Eckles et al. (2016) Dean Eckles, René F Kizilcec, and Eytan Bakshy. 2016. Estimating peer effects in networks with peer encouragement designs. Proceedings of the National Academy of Sciences 113, 27 (2016), 7316–7322.
- Forastiere et al. (2017) Laura Forastiere, Edo M. Airoldi, and Fabrizia Mealli. 2017. Identification and estimation of treatment and interference effects in observational studies on networks. ArXiv e-prints (Sept. 2017). arXiv:stat.ME/1609.06245
- Frangakis and Rubin (2002) Constantine E Frangakis and Donald B Rubin. 2002. Principal stratification in causal inference. Biometrics 58, 1 (2002), 21–29.
- Gao et al. (2018) Yan Gao, Viral Gupta, Jinyun Yan, Changji Shi, Zhongen Tao, PJ Xiao, Curtis Wang, Shipeng Yu, Romer Rosales, Ajith Muralidharan, and Shaunak Chatterjee. 2018. Near Real-time Optimization of Activity-based Notifications. In Proceedings of the 24th ACM SIGKDD International Conference on Knowledge Discovery & Data Mining. ACM, 283–292.
- Gubin et al. (2017) Max Gubin, Wayne Kao, David Vickrey, and Alexey Maykov. 2017. News feed ranking model based on social information of viewer. (Feb. 28 2017). US Patent 9,582,786.
- Gui et al. (2015) Huan Gui, Ya Xu, Anmol Bhasin, and Jiawei Han. 2015. Network A/B testing: From sampling to estimation. In Proceedings of the 24th International Conference on World Wide Web. International World Wide Web Conferences Steering Committee, 399–409.
- Gupta et al. (2016) Rupesh Gupta, Guanfeng Liang, Hsiao-Ping Tseng, Ravi Kiran Holur Vijay, Xiaoyu Chen, and Romer Rosales. 2016. Email volume optimization at LinkedIn. In Proceedings of the 22nd ACM SIGKDD International Conference on Knowledge Discovery and Data Mining. ACM, 97–106.
- Hoffmann et al. (2009) Raphael Hoffmann, Saleema Amershi, Kayur Patel, Fei Wu, James Fogarty, and Daniel S. Weld. 2009. Amplifying community content creation with mixed initiative information extraction. In CHI.
- Katzir et al. (2012) Liran Katzir, Edo Liberty, and Oren Somekh. 2012. Framework and algorithms for network bucket testing. In Proceedings of the 21st International Conference on World Wide Web. ACM, 1029–1036.
- Kohavi et al. (2013) Ron Kohavi, Alex Deng, Brian Frasca, Toby Walker, Ya Xu, and Nils Pohlmann. 2013. Online controlled experiments at large scale. In Proceedings of the 19th ACM SIGKDD international conference on Knowledge discovery and data mining. ACM, 1168–1176.
- Koren et al. (2009) Yehuda Koren, Robert Bell, and Chris Volinsky. 2009. Matrix factorization techniques for recommender systems. Computer 8 (2009), 30–37.
- Li et al. (2010) H. Li, Y. Tian, W. Lee, C. L. Giles, and M. Chen. 2010. Personalized Feed Recommendation Service for Social Networks. In 2010 IEEE Second International Conference on Social Computing. 96–103. https://doi.org/10.1109/SocialCom.2010.23
- Ogilvie (2016) Paul Ogilvie. 2016. Open Sourcing Photon ML: LinkedIn’s Scalable Machine Learning Library for Spark. https://engineering.linkedin.com/blog/2016/06/open-sourcing-photon-ml
- Rubin (1974) Donald B Rubin. 1974. Estimating causal effects of treatments in randomized and nonrandomized studies. Journal of Educational Psychology 66, 5 (1974), 688.
- Rubin (1980) Donald B Rubin. 1980. Randomization analysis of experimental data: The Fisher randomization test comment. J. Amer. Statist. Assoc. 75, 371 (1980), 591–593.
- Saint-Jacques et al. (2019) Guillaume Saint-Jacques, Maneesh Varshney, Jeremy Simpson, and Ya Xu. 2019. Using Ego-Clusters to Measure Network Effects at LinkedIn. CoRR abs/1903.08755 (2019).
- Sarwar et al. (2001) Badrul Sarwar, George Karypis, Joseph Konstan, and John Riedl. 2001. Item-based collaborative filtering recommendation algorithms. In Proceedings of the 10th international conference on World Wide Web. ACM, 285–295.
- Shriver et al. (2013) Scott K Shriver, Harikesh S Nair, and Reto Hofstetter. 2013. Social ties and user-generated content: Evidence from an online social network. Management Science 59, 6 (2013), 1425–1443.
- Taylor and Eckles (2017) Sean J. Taylor and Dean Eckles. 2017. Randomized experiments to detect and estimate social influence in networks. ArXiv e-prints (Sept. 2017). arXiv:1709.09636
- Toulis and Kao (2013) Panos Toulis and Edward Kao. 2013. Estimation of causal peer influence effects. In International Conference on Machine Learning. 1489–1497.
- Ugander et al. (2013) Johan Ugander, Brian Karrer, Lars Backstrom, and Jon Kleinberg. 2013. Graph cluster randomization: Network exposure to multiple universes. In Proceedings of the 19th ACM SIGKDD International Conference on Knowledge Discovery and Data Mining. ACM, 329–337.
- Xu et al. (2015) Ya Xu, Nanyu Chen, Addrian Fernandez, Omar Sinno, and Anmol Bhasin. 2015. From Infrastructure to Culture: A/B Testing Challenges in Large Scale Social Networks. In Proceedings of the 21th ACM SIGKDD International Conference on Knowledge Discovery and Data Mining (KDD ’15). ACM, New York, NY, USA, 2227–2236. https://doi.org/10.1145/2783258.2788602
- Yuan et al. (2019) Yiping Yuan, Jing Zhang, Shaunak Chatterjee, Shipeng Yu, and Romer Rosales. 2019. A State Transition Model for Mobile Notifications Via Survival Analysis.. In WSDM. ACM.
8. Reproducibility
We would like to provide some context on how some of our results can be reproduced or used/adopted otherwise by readers of the paper. In addition, we would like to help readers understand the choices behind not revealing certain information and why that should not deter them from expecting good results in their own endeavors on a similar problem.
8.1. Detailed implementation plan
First, we would like to list the various steps in our work and point out which parts have open source tools (or at least algorithms) for the reader to check out.
-
(1)
Analysis tools:
-
•
Correlation analysis: We processed the tracking data using Apache Spark and further analyzed and visualized the data using Python.
-
•
- (2)
-
(3)
and estimation: This can be done at scale by using Equation 8 using Spark and developing a few user defined functions with the basic Dataset based implementations.
-
(4)
Randomized A/B testing: We conducted experiments and measured impact by using LinkedIn’s internal A/B testing platform XLNT (Xu et al., 2015). The paper describes in depth the experimentation platform and challenges of running A/B tests at large scale social networks. The LinkedIn engineering blog post on XLNT (xln, 2015) also summarizes the salient features of the platform quite well. Commercial tools such as Optimizely could be an alternative in a general setting.
-
(5)
Ego-cluster: We leveraged LinkedIn’s internal tool to measure the creator side impact. This tool was also used in (Barrilleaux and Wang, 2018) and is described in detail in (Saint-Jacques et al., 2019). We would also recommend following the design in (Gui et al., 2015) for measuring the peers/network impact.
8.2. Data sensitivity choices
We would also like to help the reader better understand our choices behind revealing and concealing certain information. The general principles we have to follow while reporting the performance of any described method on our products include:
-
•
We cannot compromise a member’s privacy. Hence, any data that reveals member information that is not publicly available cannot be reported.
-
•
We cannot reveal certain business-sensitive information. This generally includes numbers which may have some (potentially remote) connection to revenue or other key metrics, which are not publicly available.
Unless otherwise stated, when we choose to reveal any information, it is implied that it passes both the criteria listed above. Given these constraints, here are the decisions we took and some reasoning behind them:
-
(1)
Training data size: We provided details here since the data size is generally critical to the success of the training process.
-
(2)
Details of the training data generation: Same rationale as above.
-
(3)
Actual feedback sensitivity scores: We decided not to reveal the actual numbers, but provide some relative intuition among large member groups. This was because the actual feedback sensitivity numbers may be too revealing of creator behavior, and also lead to unintentional revelation of some business sensitive metrics.
-
(4)
Actual Probability of Creation vs Past Feedback Received: Same rationale as above.
-
(5)
Offline Evaluation Metrics: We provided the details on the model evaluation metrics (AUROC and AUPRC), as they are important measures of the model success.
-
(6)
Online Metrics: We shared the relative impact (in the form of delta effects) but not the absolute delta effects to showcase the success of this approach without revealing sensitive member data statistics.