Fully automated quantification of in vivo viscoelasticity of prostate zones using magnetic resonance elastography with Dense U-net segmentation
Abstract
Magnetic resonance elastography (MRE) for measuring viscoelasticity heavily depends on proper tissue segmentation, especially in heterogeneous organs such as the prostate. Using trained network-based image segmentation, we investigated if MRE data suffice to extract anatomical and viscoelastic information for automatic tabulation of zonal mechanical properties of the prostate. Overall, 40 patients with benign prostatic hyperplasia (BPH) or prostate cancer (PCa) were examined with three magnetic resonance imaging (MRI) sequences: T2-weighted MRI (T2w), diffusion-weighted imaging (DWI), and MRE-based tomoelastography, yielding six independent sets of imaging data per patient (T2w, DWI, apparent diffusion coefficient (ADC), MRE magnitude, shear wave speed, and loss angle maps). Combinations of these data were used to train Dense U-nets with manually segmented masks of the entire prostate gland (PG), central zone (CZ), and peripheral zone (PZ) in 30 patients and to validate them in 10 patients. Dice score (DS), sensitivity, specificity, and Hausdorff distance were determined. We found that segmentation based on MRE magnitude maps alone (DS, PG: 0.93±0.04, CZ: 0.95±0.03, PZ: 0.77±0.05) was more accurate than magnitude maps combined with T2w and DWI_b (DS, PG: 0.91±0.04, CZ: 0.91±0.06, PZ: 0.63±0.16) or T2w alone (DS, PG: 0.92±0.03, CZ: 0.91±0.04, PZ: 0.65±0.08). Automatically tabulated MRE values were not different from ground-truth values (P>0.05). In conclusion, MRE combined with Dense U-net segmentation allows tabulation of quantitative imaging markers without manual analysis and independent of other MRI sequences and can thus contribute to PCa detection and classification.
Keywords prostate MR elastography MRE learned segmentation magnitude images viscoelasticity diffusion-weighted imaging
1 Introduction
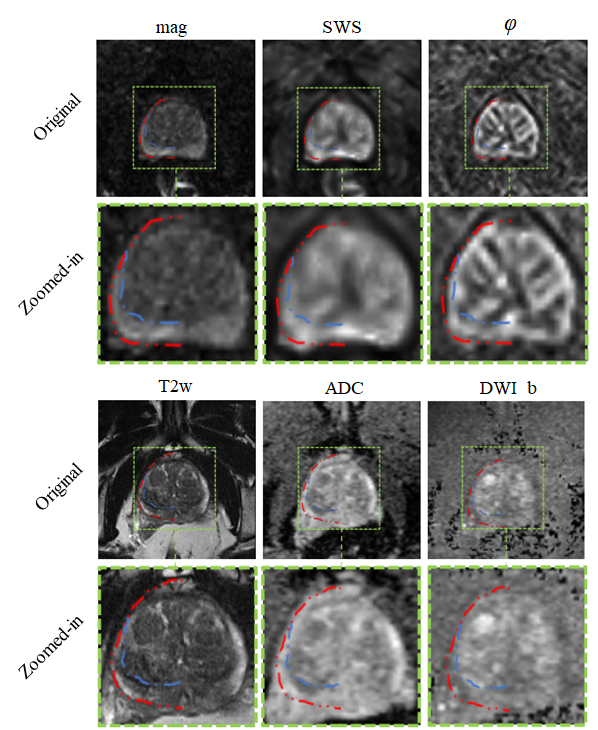
Prostate cancer (PCa) has the highest incidence of all types of cancer in men and is the second leading cause of cancer deaths in men Siegel et al. (2016); Aldoj et al. (2019). Radiological imaging modalities such as magnetic resonance imaging (MRI) play a central role in the diagnosis of PCa and therapy planning. In particular, multiparametric MRI as defined in the Prostate Imaging Reporting and Data System (PI-RADS) has contributed to the standardization of prostate MRI worldwide Turkbey et al. (2019). However, inter- and intrareader agreement is still moderate Becker et al. (2017). This is mainly due to the use of subjective imaging criteria in the assessment of lesion shape and signal intensity as well as manual segmentation procedures of prostate regions, resulting in high variability of reference values. It is noteworthy that even quantitative imaging parameters can vary widely with the size and site of the regions selected for their analysis Sack and Schaeffter (2018). Therefore, accurate segmentation of the prostate gland and its zones is critical for the detection and management of PCa Wang et al. (2016); Terris and Stamey (1991); Zettinig et al. (2015); Sabouri et al. (2017). Automated prostate segmentation using multiparametric MRI (mpMRI) is often performed based on morphologic images such as T2-weighted MRI and transferred to other images which depict microstructural information such as the apparent diffusion coefficient (ADC) measured by diffusion-weighted imaging (DWI). Complementary to DWI, magnetic resonance elastography (MRE) Muthupillai et al. (1995) has been recently introduced for the clinical assessment of PCa Hu et al. (2021); Asbach et al. (2020); Li et al. (2021, 2011); Chopra et al. (2009); Dittmann et al. (2018); Arani et al. (2011); McGrath et al. (2017); Reiter et al. (2020); Sahebjavaher et al. (2013); Sinkus et al. ; Thörmer et al. (2013). MRE provides maps of stiffness and viscosity, which are quantitatively linked with mechanical microstructures in biological soft tissues and their changes due to disease Sack et al. (2013); Hudert et al. (2021). Unlike DWI, where ADC is reconstructed from variations in signal magnitude, MRE values are reconstructed from phase images, while magnitude images have been largely unused except for recent approaches to water diffusion analysis Yin et al. (2017, 2014). Our hypothesis was that MRE magnitude images provide anatomical information that can be used for automated segmentation of prostate zones. Full exploitation of anatomic and viscoelastic information contained in a single set of MRE data would greatly facilitate quantitative parameter extraction without co-registration artifacts. However, for several reasons, automated prostate segmentation is a challenging task Mahapatra and Buhmann (2014). For example, the prostate is a highly heterogeneous organ with complex 3D geometry giving rise to well-known ambiguities of tissue boundaries in MRI. Furthermore, prostate morphology greatly varies among individuals, especially when benign prostatic hyperplasia (BPH) or advanced PCa is present. Figure 1 illustrates these challenges in a representative case of BPH. Numerous studies have tackled the problem of automatic segmentation of MR images of the prostate using various approaches such as atlas segmentation Klein et al. (2017), deformable and statistical modeling Toth and Madabhushi (2012) or machine learning Litjens et al. . For a few years, deep convolutional neural networks (CNNs) have been extensively used for segmentation tasks in various radiological applications, thanks to their suitability for generalization Bengio et al. (2007). In the prostate, CNNs were used for prostate gland segmentation using either slice-wise Zhu et al. or full 3D approaches Milletari et al. ; Yu et al. However, only a few approaches were actually able to segment the prostate gland (PG) and its zones such as the central zone (CZ) and the peripheral zone (PZ) Zabihollahy et al. (2019); Clark et al. ; Ronneberger et al. ; Szegedy et al. .
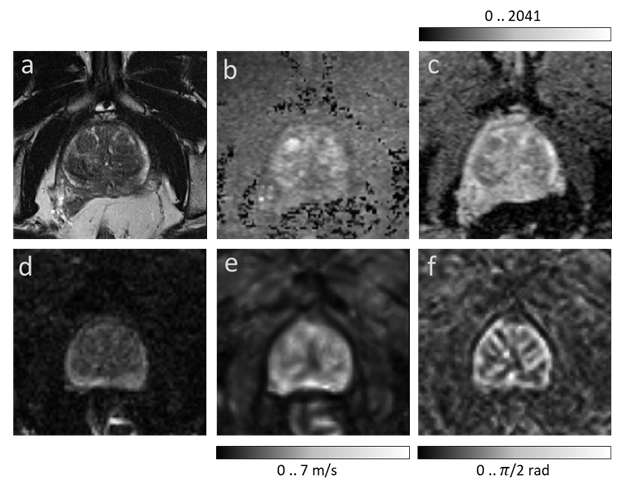
In this study, we used CNNs for automated segmentation of the prostate zones based on T2-weighted (T2w) MRI, DWI, and MRE Aldoj et al. (2020). DWI provides intensity images (based on a specific b-value, DWI_b) and quantitative ADC maps. MRE provides magnitude images (mag), shear wave speed maps of stiffness (SWS, in m/s), and maps of loss angle ( in radians, indicating friction or a material’s fluidity) Streitberger et al. (2020). We explored CNNs for prostate segmentation using 14 possible input combinations of MRE maps as input training data. First, we trained and tested individual networks (models), henceforth termed individual models (IMs), using each of the aforementioned sets with their corresponding manually segmented masks of CZ, PZ, and PG as ground truths. Second, the dataset was rearranged so that it contains all 14 possible input combinations at once to be used as input training data for a single model, henceforth termed unified model (UM). The purpose of this study was to test whether MRE-based tomoelastography data are sufficient to extract anatomic and viscoelastic information for automatic tabulation of zonal mechanical properties of the prostate and to compare MRE-based image segmentation with information extracted by CNNs from other MRI pulse sequences typically acquired in clinical practice.
2 Methods
2.1 Subjects
The imaging data used in this study were used retrospectively and were acquired in a previously reported population of BPH and PCa patients who underwent PI-RADS-compatible mpMRI and MRE Asbach et al. (2020). Our local ethical review board approved this study, and all patients gave written in-formed consent. Forty patients were included, 26 with a PI-RADS score of 2 consistent with BPH. Fourteen men had a suspicious focal lesion (PI-RADS 4: n = 2, maximum tumor diameters of 10 and 11 mm; PI-RADS 5: n = 12, maximum tumor diameters ranging from 16 to 66 mm). In these 14 men, prostate biopsy revealed PCa Gleason scores of 3 + 3 (ISUP class 1, n = 1), 3 + 4 (ISUP class 2, n = 2), 4 + 3 (ISUP class 3, n = 2), 4 + 4 (ISUP class 4, n = 4), and 4 + 5 (ISUP class 5, n = 5).
From the 40 volume datasets of these patients, 30 were randomly selected for training. Each vol-ume dataset included 25 slices, yielding a total of 25 (slices) x 30 (volumes) x 1 (input combination) = 750 training images for each of the 14 input combinations of IMs, and 25 (slices) x 30 (volumes) x 14 (all input combinations) = 10,500 images for UM. In the latter case, all 14 input combinations were included in a single large training set. The remaining 10 datasets with a total of 25 (slices) x10 (volumes) = 250 slices were used for testing.
2.2 MR Imaging
The imaging data were acquired on a 3-Tesla MRI scanner (Magnetom Skyra; Siemens Healthi-neers, Erlangen, Germany) using both the 18-channel phased-array surface coil and a spine array coil. All patients underwent a clinically indicated mpMRI examination of the prostate in accord-ance with PI-RADS version 2 (2015) Barentsz et al. (2016) which included T2-weighted sequences (T2w) in the axial and coronal planes and DWI. Here we used b-values of 0, 50, 500, 1000, and 1400 s/mm2 (b=1400 s/mm2 was used as diffusion weighted image, henceforth referred to as DWI_b). ADC maps were automatically generated by the MRI scanner via monoexponential fitting of all b-values. After the clinical MRI examination, patients underwent multifrequency MRE-based tomo-elastography using a single-shot spin-echo sequence with three excitation frequencies of 60, 70, 80 Hz Asbach et al. (2020). MRE magnitude images (mag) display signal intensities which are T2-weighted with a strong T2* effect. All imaging parameters are summarized in Table 1.
| Map | Axial slices (number) | Slice thickness () | Field of view () | Matrix size (pixels) | Voxel size () | Repetition time (TR) () | Echo time (TE) () | Parallel imaging factor (GRAPPA-algorithm) |
|---|---|---|---|---|---|---|---|---|
| MRE | 25 | 2 | 256x256 | 128x128 | 2x2x2 | 3240 | 69 | 2 |
| T2w | 25 | 3 | 180x180 | 384x384 | 0.47x0.47x3 | 4000 | 116 | 2 |
| DWI | 25 | 3 | 230x230 | 160x160 | 1.44x1.44x3 | 4000 | 56 | 2 |
MRE data processing was based on multifrequency wavefield inversion for generating frequency-compounded SWS and maps. SWS was reconstructed by single-derivative finite-difference operators (k-MDEV) Tzschätzsch et al. (2016) while was obtained by second-order, Laplacian-based, direct inversion (MDEV) Streitberger et al. (2014). Although k-MDEV is noise-resistant and well-suited for SWS visualization, it is limited regarding the quantification of viscosity-related parameters such as Tzschätzsch et al. (2016). Hence, MDEV was used for recovery. Both k-MDEV and MDEV pipelines are publicly available at bioqic-apps.charite.de Meyer et al. . Two experienced radiologists (PA with more than 10 years and FB with 2 years of experience in PIRADS-based PCa detection and classification) segmented and revised the prostate and its zones based on T2w-MRI, DWI, and MRE. The resulting masks of CZ (which includes the transition zone), PZ, and PG were used as ground truth (GT) for training and validation of CNNs. Overall, six independent imaging data were further used for segmentation analysis: T2w, DWI_b, ADC, mag, SWS, and .
2.3 Image preparation and augmentation
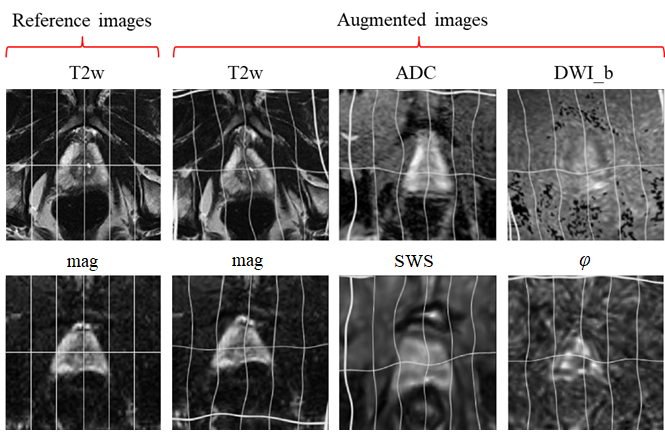
Since T2w, DWI, and MRE images had different resolutions, all images were resampled to a common resolution of 0.5 mm isotropic edge length. Images of the same size and resolution were obtained by positioning a cropping window with a size of 256x256 pixels at the center of each 3D imaging volume. For image augmentation, 9 random elastic deformations were applied to the original images to increase the number of training sets. As described in Simard et al. , elastic deformation can be driven by two main parameters: , which represents the elasticity coefficient, and , which represents a scaling factor that controls the amplitude of the deformation. The two parameters were set to = 21 and = 512. Examples of augmented images are provided in Figure 2.
2.4 Dense U-net
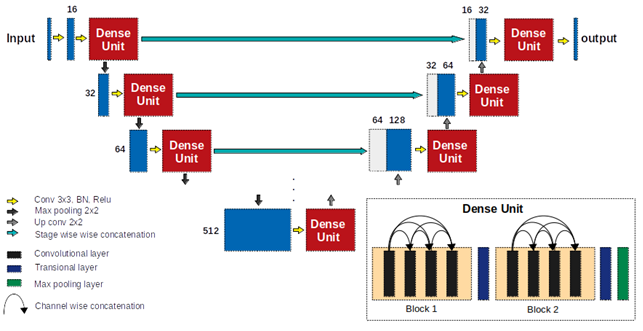
A previously developed Dense U-net Aldoj et al. (2020) based on state-of-the-art U-net convolutional network architecture Ronneberger et al. was used. The network comprised two main parts - an encoder and a decoder - between which skip connections connected feature maps with similar resolutions. Normal stacks of convolutional layers at each stage were substituted with two densely connected blocks. Each dense block consisted of four convolutional layers with 3x3 kernel size followed by a transitional layer. The structure of the network is illustrated in Figure 3.
2.5 Network training
Stochastic gradient descent with a learning rate of 10-3, a momentum of 0.9, and a decay of 10-6 was used in this study to train and test all proposed models. We used cross-entropy (CE) loss as the main loss function, and performed pixel-wise comparison of ground-truth images and the resulting masks. This loss was represented by
| (1) |
with m and I denoting the prediction masks and the ground-truth images, respectively.
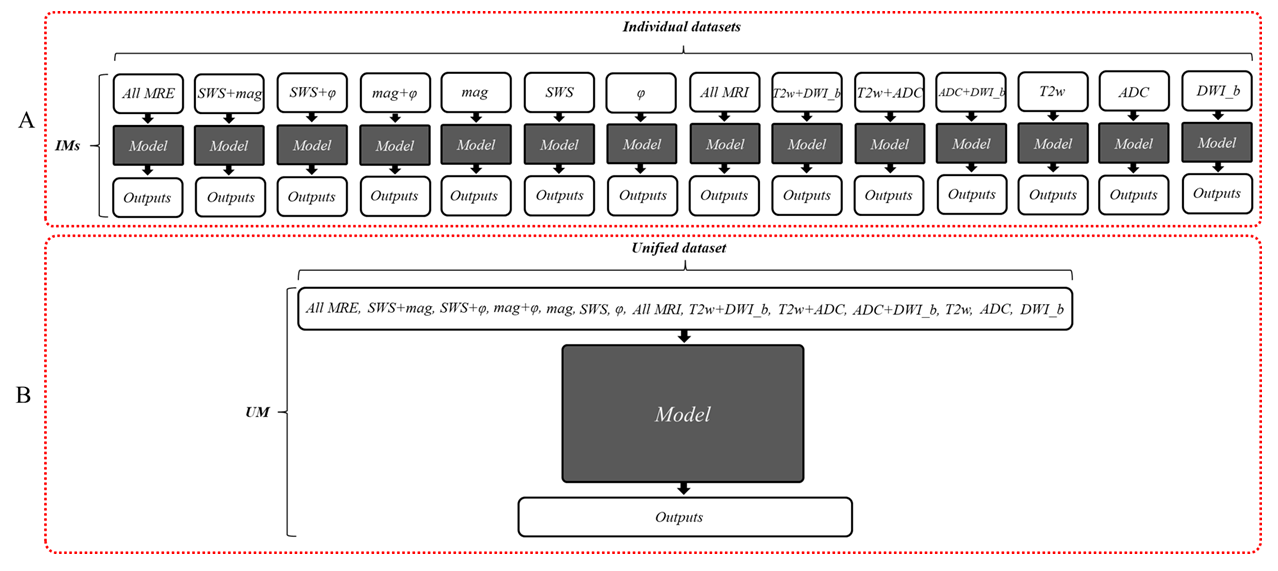
Two main approaches were tested: (i) Individual models (IMs), where we trained and tested a separate model for each combination of sequences/maps or individual sequence/map input. (ii) Unified model (UM) without MRE-MRI co-registration (i.e., a single model for T2w, DWI_b, ADC, mag, SWS, and images, trained on masks that were manually and separately segmented from T2w and mag images), yielding a re-arranged dataset, where all image combinations were taken into account during training, validation and testing. Fourteen input combinations were used for training and testing IMs and the UM, more specifically mag+SWS+, SWS+mag, SWS+, mag+, mag, , SWS, T2w+ADC+DWI_b, T2w+ADC, T2w+ADC, ADC+DWI_b, T2w, ADC and DWI_b. While each of these input combinations was used to train an individual model in IMs, in UM, each input combination represented a subset and was combined with all other subsets to generate a single, large dataset of all 14 input combinations for training and testing the UM. Figure 4 shows how imaging data were used as inputs for IMs and the UM.
2.6 Evaluation
We evaluated all resulting segmentations against manually delineated ground-truth masks using standard evaluation statistics such as mean dice score (DS) ± standard deviation (SD), sensitivity (Sen), specificity (Spc), and Hausdorff distance (HD) as a contour consistency measure, and a t-test with p<0.05 indicating a statistically significant difference.
The dice score is a similarity measure that quantifies the overlap between predicted masks and ground-truth labels, allowing straightforward comparison of segmentation performance Dice (1945). DS was formulated for two binary sets, A and B, as follows:
| (2) |
The Hausdorff distance is the maximum distance between two edge points from two different sets (predicted mask and ground truth). It is expressed in millimeters (mm) and was defined as follows:
| (3) |
where d(i,j) is the Euclidean distance between two points from different sets A and B.
2.7 Implementation details
All models were trained on individual or combinations of MRI/MRE images in a slice-wise fashion, where all images had a size of 256x256 and an in-plane resolution of 0.5x0.5 mm. We used the SimpleITK library for image preprocessing Lowekamp et al. (2013); Yaniv et al. (2018), and Keras with Tensorflow back-end Abadi et al. (2016) as the main library for model implementation, training, and testing. All models were trained on a TitanXP GPU with 2 GB video memory (CUDA version of 10.1) and a batch size of 25 images. Training time of the Dense U-net was around 8.5 hours. The computation time during testing for a single 3D volume (of around 25 slices) was approximately 1.5 sec.
3 Results
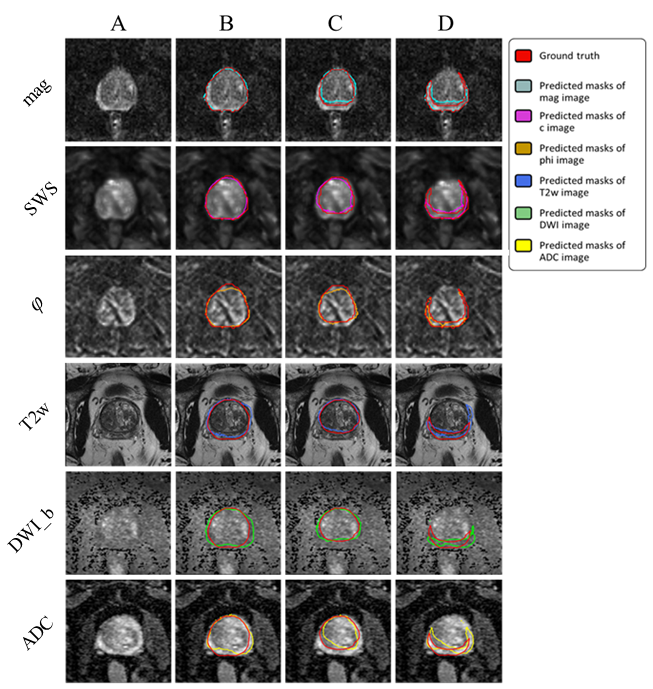
Figure 5 and Figure 6 illustrate segmentation results for each of the two training approaches. The boundary of automatically segmented regions closely follows the boundary of manual segmentations.
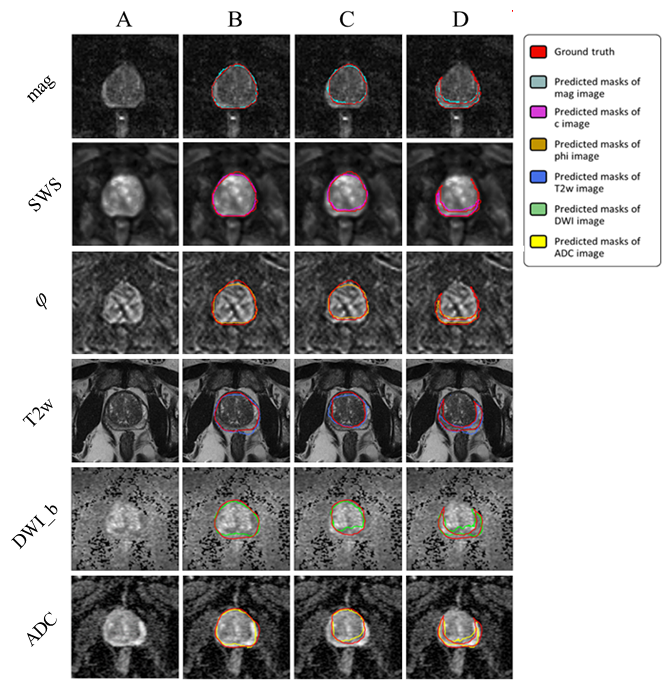
Our experimental results for IMs trained on different combinations of maps showed that the proposed method was capable of efficiently segmenting PG, CZ, and PZ from the input MRI/MRE images. DS ranged from 0.87±0.04 (ADC) to 0.93±0.04 (mag), from 0.85±0.09 (DWI_b) to 0.95±0.03 (mag), and from 0.53±0.10 (ADC+DWI_b) to 0.77±0.05 (mag), for PG, CZ, and PZ, respectively. Also, HD was minimized (i.e., best contour consistency) based on mag with 0.86, 0.76, 0.98 mm (Figure 5 and Table 2). However, performance differences between MRE (mag, SWS, ) and MRI maps (T2w, DWI_b, ADC) were statistically not significant except for CZ, where MRE (mag, SWS, ) had a significantly higher DS than MRI (T2w, DWI_b, ADC, p<0.05).
| Prostate gland | Central zone | Peripheral zone | ||||||||||||||||
|---|---|---|---|---|---|---|---|---|---|---|---|---|---|---|---|---|---|---|
| Model | Dice ↑ | Std ↓ | Median ↑ | Sen ↑ | Spc ↑ | HD ↓ | Dice ↑ | Std ↓ | Median ↑ | Sen ↑ | Spc ↑ | HD ↓ | Dice ↑ | Std ↓ | Median ↑ | Sen ↑ | Spc ↑ | HD ↓ |
| All MRE | 0.92 | 0.04 | 0.91 | 0.92 | 0.99 | 1.04 | 0.94 | 0.03 | 0.93 | 0.93 | 0.99 | 1.08 | 0.73 | 0.05 | 0.74 | 0.72 | 1.00 | 1.35 |
| SWS+mag | 0.91 | 0.04 | 0.90 | 0.90 | 0.99 | 1.22 | 0.93 | 0.04 | 0.92 | 0.91 | 0.99 | 1.41 | 0.69 | 0.04 | 0.69 | 0.65 | 1.00 | 1.72 |
| SWS+ | 0.91 | 0.05 | 0.90 | 0.89 | 0.99 | 1.12 | 0.92 | 0.05 | 0.93 | 0.92 | 0.99 | 1.10 | 0.64 | 0.10 | 0.62 | 0.68 | 1.00 | 1.43 |
| Mag+ | 0.91 | 0.04 | 0.91 | 0.94 | 0.99 | 1.95 | 0.93 | 0.04 | 0.93 | 0.95 | 0.99 | 1.92 | 0.69 | 0.06 | 0.68 | 0.68 | 1.00 | 1.97 |
| Mag | 0.93 | 0.04 | 0.93 | 0.93 | 0.99 | 0.86 | 0.95 | 0.03 | 0.95 | 0.96 | 0.99 | 0.76 | 0.77 | 0.05 | 0.79 | 0.79 | 1.00 | 0.98 |
| 0.90 | 0.05 | 0.88 | 0.87 | 0.99 | 1.18 | 0.91 | 0.05 | 0.92 | 0.89 | 0.99 | 1.19 | 0.52 | 0.11 | 0.54 | 0.57 | 1.00 | 1.66 | |
| SWS | 0.82 | 0.08 | 0.80 | 0.78 | 0.99 | 2.41 | 0.88 | 0.06 | 0.87 | 0.84 | 0.99 | 2.56 | 0.55 | 0.07 | 0.53 | 0.59 | 1.00 | 2.64 |
| All MRI | 0.90 | 0.02 | 0.88 | 0.83 | 1.00 | 1.06 | 0.88 | 0.05 | 0.86 | 0.82 | 1.00 | 1.16 | 0.66 | 0.11 | 0.67 | 0.61 | 1.00 | 1.81 |
| T2w+ADC | 0.90 | 0.04 | 0.89 | 0.88 | 0.99 | 1.30 | 0.87 | 0.06 | 0.88 | 0.84 | 1.00 | 1.35 | 0.62 | 0.13 | 0.66 | 0.65 | 0.99 | 2.82 |
| T2w+DWI_b | 0.91 | 0.04 | 0.90 | 0.90 | 1.00 | 0.98 | 0.91 | 0.06 | 0.90 | 0.86 | 1.00 | 1.00 | 0.63 | 0.16 | 0.66 | 0.68 | 0.99 | 2.11 |
| ADC+DWI_b | 0.88 | 0.05 | 0.87 | 0.84 | 0.99 | 1.44 | 0.87 | 0.06 | 0.86 | 0.83 | 0.99 | 1.46 | 0.53 | 0.10 | 0.55 | 0.52 | 0.99 | 2.84 |
| T2w | 0.92 | 0.03 | 0.92 | 0.93 | 0.99 | 1.05 | 0.91 | 0.04 | 0.91 | 0.89 | 1.00 | 0.87 | 0.65 | 0.08 | 0.65 | 0.72 | 0.99 | 2.90 |
| ADC | 0.87 | 0.04 | 0.86 | 0.86 | 0.99 | 1.41 | 0.86 | 0.06 | 0.84 | 0.84 | 0.99 | 1.41 | 0.55 | 0.08 | 0.57 | 0.55 | 0.99 | 2.38 |
| DWI_b | 0.88 | 0.06 | 0.86 | 0.87 | 0.99 | 1.38 | 0.85 | 0.09 | 0.83 | 0.82 | 1.00 | 1.48 | 0.54 | 0.17 | 0.51 | 0.61 | 0.99 | 2.07 |
| All MRE ave. | 0.91 | 0.04 | 0.90 | 0.91 | 0.99 | 1.23 | 0.93 | 0.04 | 0.93 | 0.93 | 0.99 | 1.24 | 0.67 | 0.07 | 0.67 | 0.68 | 1.01 | 1.52 |
| All MRI ave. | 0.89 | 0.04 | 0.88 | 0.87 | 0.99 | 1.23 | 0.88 | 0.06 | 0.87 | 0.84 | 1.00 | 1.25 | 0.60 | 0.12 | 0.61 | 0.62 | 0.99 | 2.42 |
Unlike IMs, the UM can process any map or combination of maps, which facilitates clinical applications. Compared with IMs, the UM had higher DS in PG and CZ and lower DS in PZ. Assessed for different prostate zones, DS of the UM ranged from 0.77±0.11 (DWI_b) to 0.92±0.04 (mag, SWS, ), from 0.65±0.08 (DWI_b) to 0.86±0.06 (mag, SWS, ), and from 0.28±0.10 (DWI_b) to 0.57±0.05 (mag), for PG, CZ, and PZ, respectively. The smallest HD of 1.15, 1.45, and 1.81 for PG, CZ, and PZ, respectively, was found for mag. Images are presented in Figure 6, and the results are summarized in Table 3.
| Prostate gland | Central zone | Peripheral zone | ||||||||||||||||
|---|---|---|---|---|---|---|---|---|---|---|---|---|---|---|---|---|---|---|
| Model | Dice ↑ | Std ↓ | Median ↑ | Sen ↑ | Spc ↑ | HD ↓ | Dice ↑ | Std ↓ | Median ↑ | Sen ↑ | Spc ↑ | HD ↓ | Dice ↑ | Std ↓ | Median ↑ | Sen ↑ | Spc ↑ | HD ↓ |
| All MRE | 0.92 | 0.04 | 0.92 | 0.87 | 1.00 | 1.17 | 0.86 | 0.06 | 0.82 | 0.80 | 0.99 | 1.61 | 0.56 | 0.05 | 0.56 | 0.54 | 0.99 | 2.00 |
| SWS+mag | 0.91 | 0.04 | 0.91 | 0.87 | 1.00 | 1.19 | 0.85 | 0.06 | 0.81 | 0.78 | 0.99 | 1.64 | 0.55 | 0.05 | 0.56 | 0.54 | 0.99 | 2.01 |
| SWS+ | 0.90 | 0.04 | 0.89 | 0.87 | 0.99 | 1.41 | 0.85 | 0.05 | 0.83 | 0.79 | 0.99 | 1.93 | 0.49 | 0.06 | 0.52 | 0.53 | 0.99 | 2.16 |
| Mag+ | 0.91 | 0.04 | 0.91 | 0.88 | 0.99 | 1.23 | 0.87 | 0.05 | 0.85 | 0.84 | 0.99 | 1.66 | 0.57 | 0.03 | 0.57 | 0.55 | 0.99 | 1.86 |
| Mag | 0.91 | 0.05 | 0.91 | 0.87 | 0.99 | 1.15 | 0.87 | 0.05 | 0.84 | 0.84 | 0.99 | 1.45 | 0.57 | 0.05 | 0.57 | 0.52 | 0.99 | 1.81 |
| 0.88 | 0.04 | 0.88 | 0.85 | 0.99 | 1.54 | 0.83 | 0.04 | 0.82 | 0.76 | 0.99 | 2.03 | 0.44 | 0.07 | 0.47 | 0.49 | 0.98 | 2.43 | |
| SWS | 0.89 | 0.05 | 0.89 | 0.87 | 0.99 | 1.63 | 0.82 | 0.08 | 0.80 | 0.76 | 0.99 | 2.18 | 0.46 | 0.06 | 0.47 | 0.48 | 0.99 | 2.19 |
| All MRI | 0.80 | 0.09 | 0.78 | 0.91 | 0.98 | 2.37 | 0.73 | 0.06 | 0.71 | 0.56 | 1.00 | 2.80 | 0.51 | 0.09 | 0.53 | 0.56 | 0.99 | 3.42 |
| T2w+ADC | 0.80 | 0.09 | 0.78 | 0.91 | 0.98 | 2.34 | 0.72 | 0.05 | 0.70 | 0.55 | 1.00 | 2.86 | 0.49 | 0.09 | 0.52 | 0.55 | 0.99 | 3.56 |
| T2w+DWI_b | 0.81 | 0.09 | 0.80 | 0.90 | 0.98 | 2.04 | 0.74 | 0.06 | 0.72 | 0.58 | 1.00 | 2.63 | 0.40 | 0.08 | 0.41 | 0.41 | 0.99 | 3.82 |
| ADC+DWI_b | 0.80 | 0.09 | 0.75 | 0.88 | 0.98 | 2.25 | 0.670 | .07 | 0.64 | 0.48 | 1.00 | 3.45 | 0.45 | 0.11 | 0.44 | 0.53 | 0.99 | 4.10 |
| T2w | 0.78 | 0.09 | 0.78 | 0.87 | 0.98 | 2.43 | 0.75 | 0.07 | 0.72 | 0.60 | 1.00 | 2.35 | 0.42 | 0.12 | 0.43 | 0.38 | 0.99 | 4.12 |
| ADC | 0.80 | 0.08 | 0.76 | 0.88 | 0.98 | 2.21 | 0.65 | 0.07 | 0.62 | 0.46 | 1.00 | 3.54 | 0.43 | 0.11 | 0.43 | 0.52 | 0.98 | 4.19 |
| DWI_b | 0.77 | 0.11 | 0.76 | 0.88 | 0.98 | 2.42 | 0.65 | 0.08 | 0.64 | 0.49 | 1.00 | 3.38 | 0.28 | 0.10 | 0.30 | 0.33 | 0.98 | 5.29 |
| All MRE ave. | 0.89 | 0.05 | 0.89 | 0.87 | 0.99 | 1.46 | 0.83 | 0.06 | 0.81 | 0.77 | 0.99 | 1.91 | 0.52 | 0.06 | 0.53 | 0.53 | 0.99 | 2.23 |
| All MRI ave. | 0.79 | 0.09 | 0.77 | 0.89 | 0.98 | 2.29 | 0.70 | 0.07 | 0.68 | 0.53 | 1.00 | 3.00 | 0.43 | 0.10 | 0.44 | 0.47 | 0.99 | 4.07 |
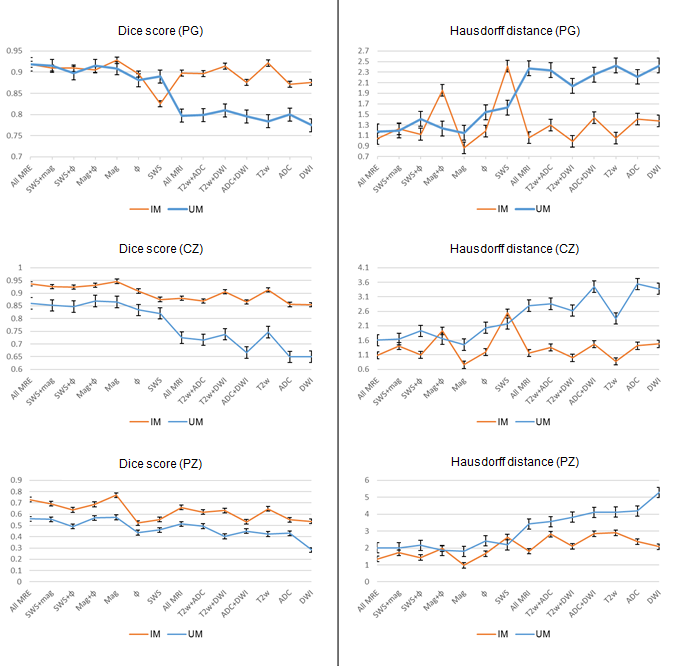
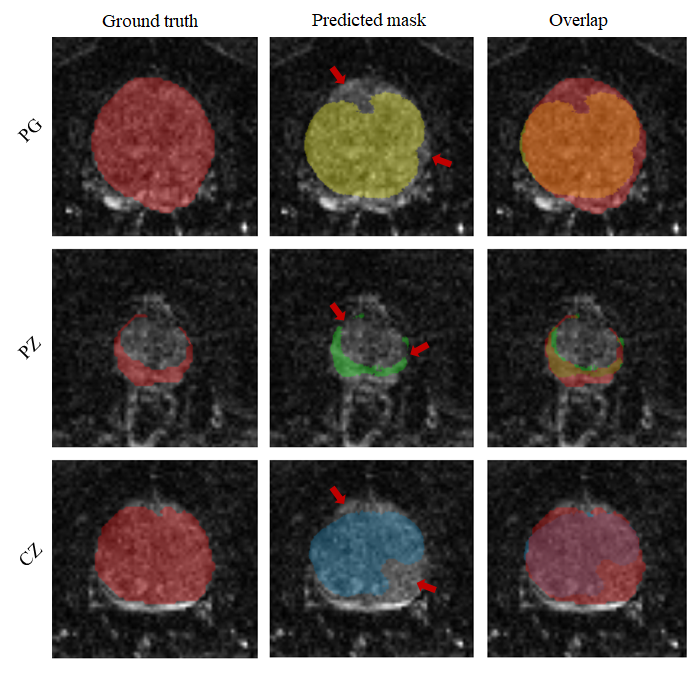
Unlike IMs, the UM showed a significantly higher DS when using MRE data in comparison with MRI data (p < 0.001, 0.05, and 0.05 for PG, CZ, and PZ, respectively). Overall, IMs had significantly more accurate results compared with the UM in terms of both DS and HD with p-values < 0.01 for PG, CZ, and PZ. This is shown in Figure 7, illustrating that DS was higher and HD lower for IMs than for the UM. Figure 8 shows a case where model segmentations were inaccurate compared with the ground-truth masks. Quantitative analysis, for both IMs and the UM, of pixel values in PG, CZ, and PZ showed no significant difference (p>0.05) between ground-truth and automated prostate segmentation. Group mean values are presented in Table 4 and Table 5.
| Pixel values (average ± standard deviation) | T-test (significance at p<0.05) | ||||||||
| Map | PG mask | PG predicted | CZ mask | CZ predicted | PZ mask | PZ predicted | PG P-value | CZ P-value | PZ P-value |
| SWS | 1.28±0.39 | 1.35±0.4 | 1.25±0.32 | 1.36±0.33 | 1.39±0.22 | 1.28±0.22 | 0.87 | 0.81 | 0.83 |
| mag | 33.1±10.46 | 36.56±11.05 | 29.6±7.85 | 34.03±8.31 | 43.21±7.2 | 39.7±7.29 | 0.83 | 0.78 | 0.85 |
| 0.61±0.19 | 0.63±0.19 | 0.64±0.17 | 0.66±0.17 | 0.58±0.09 | 0.56±0.09 | 0.91 | 0.88 | 0.87 | |
| Pixel values (average ± standard deviation) | T-test (significance at p<0.05) | ||||||||
| Map | PG mask | PG predicted | CZ mask | CZ predicted | PZ mask | PZ predicted | PG P-value | CZ P-value | PZ P-value |
| SWS | 1.28±0.39 | 1.29±0.39 | 1.25±0.32 | 1.32±0.3 | 1.39±0.22 | 1.27±0.24 | 0.9 | 0.89 | 0.81 |
| mag | 33.1±10.46 | 34.1±10.6 | 29.6±7.85 | 30.54±7.0 | 43.21±7.2 | 39.6±8.05 | 0.95 | 0.95 | 0.85 |
| 0.61±0.19 | .62±0.19 | 0.64±0.17 | 0.66±0.16 | 0.58±0.09 | 0.57±0.11 | 0.99 | 0.92 | 0.95 | |
4 Discussion
Our study shows that Dense U-net segmentation of prostate zones based on MRE data allows automated tabulation of quantitative imaging markers for the total prostate and for the central and peripheral zones.
4.1 IMs versus UM
Our results show that IMs performed excellent across all maps and sequences with high values for DS and low values for HD. In our experiments, segmentation was most reliable when we used T2w and MRE magnitude images, which provide sufficiently rich anatomical details for automated prostate segmentation while quantitative parameter maps such as SWS, and ADC lack those details. Figure 9 depicts a variety of maps in a patient demonstrating that anatomy of prostate boundaries is well preserved on T2w and MRE magnitude images while it is less clearly visible on ADC, DWI_b, SWS and maps.
For IMs, we found no significant difference between DS of MRE and DS of MRI in PG and PZ while, in CZ, DS of MRE was higher than that of MRI. This may be explained in part by blurring due to larger slice thickness in MRI (3mm) than MRE (2mm). Furthermore, MRI slice volumes covered the entire prostate gland, the seminal vesicles and the periprostatic tissues while MRE volumes were solely focused on the prostate gland given the smaller slice thickness.
In contrast to IMs, the UM could process any input combination of MRI/MRE maps without a need for retraining or fine-tuning the network. Similar to IMs, the UM also favored input combinations with rich anatomical detail, such as T2w and magnitude images. In all experiments, HD of the UM ranged from 1.15 to 5.29 mm, which is significantly inferior to IMs. Moreover, by showing the changes in DS and HD due to all possible input combinations for IMs and UM, Figure 7 illustrates that both IMs and the UM had decent performance while IMs were slightly better. Nevertheless, given the robustness of the UM combined with decently good segmentation results, it is recommended to primarily apply IMs and to use the UM as a second opinion for automated prostate segmentation.
4.2 Quantitative results
Exploiting MRE magnitude images for automatic segmentation instead of high-resolution in-plane T2-weighted MRI had the benefit of not requiring image registration and making full use of the anatomic and viscoelastic information contained in a single MRE dataset. This potentially stabilizes quantitative parameter extraction as any co-registration artifacts are avoided. As the ultimate proof of valid segmentations, viscoelasticity values averaged within volumes of PG, CZ, and PZ obtained from CNNs were not different from those obtained with manually segmented masks (see supplemental information). Thus, we here for the first time used the information of the magnitude signal in prostate MRE, showing that is was fully sufficient for accurate segmentation, which may greatly enhance MRE of the prostate in the future.
4.3 Challenges
Figure 8 shows a case where the model failed to achieve accurate segmentation. Inaccuracies appear to be attributable to under-segmentation and discontinuity. Under-segmentation is visible in both the entire prostate gland (first row) and the CZ (last row), where the model did not properly locate and delineate boundaries. Discontinuity can be seen in the PZ (middle row), where the model resulted in a mask with several unconnected neighboring areas. Many factors can contribute to inaccurate segmentation, including boundary ambiguity, partial volume effects, and tissue heterogeneity. Therefore, radiologists typically use 3D information, which is subjectively interpolated by eye to the ambiguous image slice. However, even including adjacent slices for training in a 2.5-D approach Soerensen et al. or use of full 3D models does not necessarily lead to better segmentation performance due to partial volume effects Drozdzal et al. (2016) .
4.4 Future directions
We will implement the proposed CNN-based segmentation on a server, which is currently used for MRE data processing (https://bioqic-apps.charite.de), in order to make it available to the research community. Our ultimate aim is to accomplish fully automated tabulation of prostate SWS and values based on multifrequency MRE data. Once installed, the Dense U-net will be trained using other sets of MRE data acquired with other scanners and MRE sequences in order to generalize its applicability for prostate segmentation. In a next step, we aim at automated segmentation of other organs including the liver, kidneys, and pancreas based on MRE magnitude images.
4.5 Limitations
Our study has limitations, including the small number of patients, which is attributable to fact that we performed a proof-of-concept exploration of CNNs for MRE-based prostate segmentation. For further improvement of segmentation quality and generalization to other domains, future studies should use multicenter MRI/MRE data acquired with different imaging protocols. Finally, we assembled all data for training in a way that avoids image alignment and registration procedures. While this approach ensured robust results based on single sets of data, we cannot rule out that combinations of MRI and MRE images (e.g., magnitude and T2w) would have resulted in slightly better DS and HD scores.
4.6 Summary
Magnitude images of prostate MRE were used for automated segmentation of prostate subzones based on trained CNNs. As such, MRE data provide all information needed for extraction of viscoelasticity parameters and for delineation of the prostate regions for which those values are of interest for tabulation and automated classification of suspicious prostate lesions. Dense U-net achieved excellent segmentation results using both IMs and the UM and yielded MRE parameters that were not different from ground truth. Compared with standard image segmentation based on T2w images, MRE magnitude images proved to suffice, as demonstrated by excellent Dice scores and Hausdorff dimension results. Quantitative maps of multiparametric MRI including those of DWI and viscoelasticity did not provide adequate anatomic information for learning-based prostate segmentation. Prostate MRE combined with Dense U-nets allows tabulating quantitative imaging markers without manual analysis and independent of other MRI sequences and thus has the potential to contribute to imaging-based PCa detection and classification.
5 Acknowledgments
This work was funded by the German Research Foundation (GRK2260, BIOQIC; SFB1340, CRC Matrix in Vision).
6 Conflict of interest declaration
The authors declare no competing interests. MD is European Society of Radiology (ESR) Research Chair (2019–2022), and the opinions expressed in this article are the author’s own and do not represent the view of ESR. Per ESR guiding principles, the work as Research Chair is on a voluntary basis, and only travel expenses are remunerated.
References
- Siegel et al. [2016] Rebecca L. Siegel, Kimberly D. Miller, and Ahmedin Jemal. Cancer statistics, 2016. CA: A Cancer Journal for Clinicians, 66(1):7–30, 2016. doi:10.3322/caac.21332. URL https://onlinelibrary.wiley.com/doi/abs/10.3322/caac.21332.
- Aldoj et al. [2019] Nader Aldoj, Steffen Lukas, Marc Dewey, and Tobias Penzkofer. Semi-automatic classification of prostate cancer on multi-parametric mr imaging using a multi-channel 3d convolutional neural network. European radiology, pages 1–11, 2019.
- Turkbey et al. [2019] Baris Turkbey, Andrew B Rosenkrantz, Masoom A Haider, Anwar R Padhani, Geert Villeirs, Katarzyna J Macura, Clare M Tempany, Peter L Choyke, Francois Cornud, and Daniel J Margolis. Prostate imaging reporting and data system version 2.1: 2019 update of prostate imaging reporting and data system version 2. European urology, 76(3):340–351, 2019. ISSN 0302-2838.
- Becker et al. [2017] Anton S Becker, Alexander Cornelius, Cäcilia S Reiner, Daniel Stocker, Erika J Ulbrich, Borna K Barth, Ashkan Mortezavi, Daniel Eberli, and Olivio F Donati. Direct comparison of pi-rads version 2 and version 1 regarding interreader agreement and diagnostic accuracy for the detection of clinically significant prostate cancer. European journal of radiology, 94:58–63, 2017. ISSN 0720-048X.
- Sack and Schaeffter [2018] Ingolf Sack and Tobias Schaeffter. Quantification of biophysical parameters in medical imaging. Springer, 2018. ISBN 3319659243.
- Wang et al. [2016] Y. Wang, J. Cheng, D. Ni, M. Lin, J. Qin, X. Luo, M. Xu, X. Xie, and P. A. Heng. Towards personalized statistical deformable model and hybrid point matching for robust mr-trus registration. IEEE Transactions on Medical Imaging, 35(2):589–604, 2016. doi:10.1109/TMI.2015.2485299.
- Terris and Stamey [1991] Martha K. Terris and Thomas A. Stamey. Determination of prostate volume by transrectal ultrasound. The Journal of Urology, 145(5):984–987, 1991. doi:https://doi.org/10.1016/S0022-5347(17)38508-7. URL http://www.sciencedirect.com/science/article/pii/S0022534717385087.
- Zettinig et al. [2015] Oliver Zettinig, Amit Shah, Christoph Hennersperger, Matthias Eiber, Christine Kroll, Hubert Kübler, Tobias Maurer, Fausto Milletarì, Julia Rackerseder, Christian zu Berge, Enno Storz, Benjamin Frisch, and Nassir Navab. Multimodal image-guided prostate fusion biopsy based on automatic deformable registration. International Journal of Computer Assisted Radiology and Surgery, 10(12):1997–2007, 2015. doi:10.1007/s11548-015-1233-y. URL https://doi.org/10.1007/s11548-015-1233-y.
- Sabouri et al. [2017] Shirin Sabouri, Ladan Fazli, Silvia D. Chang, Richard Savdie, Edward C. Jones, S. Larry Goldenberg, Peter C. Black, and Piotr Kozlowski. Mr measurement of luminal water in prostate gland: Quantitative correlation between mri and histology. Journal of Magnetic Resonance Imaging, 46(3):861–869, 2017. doi:10.1002/jmri.25624. URL https://onlinelibrary.wiley.com/doi/abs/10.1002/jmri.25624.
- Muthupillai et al. [1995] R Muthupillai, DJ Lomas, PJ Rossman, James F Greenleaf, Armando Manduca, and Richard Lorne Ehman. Magnetic resonance elastography by direct visualization of propagating acoustic strain waves. science, 269(5232):1854–1857, 1995. ISSN 0036-8075.
- Hu et al. [2021] Bing Hu, Ying Deng, Jingbiao Chen, Sichi Kuang, Wenjie Tang, Bingjun He, Linqi Zhang, Yuanqiang Xiao, Jun Chen, and Phillip Rossman. Evaluation of mr elastography for prediction of lymph node metastasis in prostate cancer. Abdominal Radiology, pages 1–14, 2021. ISSN 2366-0058.
- Asbach et al. [2020] Patrick Asbach, Sa-Ra Ro, Nader Aldoj, Joachim Snellings, Rolf Reiter, Julian Lenk, Torsten Köhlitz, Matthias Haas, Jing Guo, Bernd Hamm, et al. In vivo quantification of water diffusion, stiffness, and tissue fluidity in benign prostatic hyperplasia and prostate cancer. Investigative Radiology, 55(8):524–530, 2020.
- Li et al. [2021] Mengsi Li, Jing Guo, Ping Hu, Huichuan Jiang, Juan Chen, Jiaxi Hu, Patrick Asbach, Ingolf Sack, and Wenzheng Li. Tomoelastography based on multifrequency mr elastography for prostate cancer detection: Comparison with multiparametric mri. Radiology, page 201852, 2021. ISSN 0033-8419.
- Li et al. [2011] Saying Li, Min Chen, Wenchao Wang, Weifeng Zhao, Jianye Wang, Xuna Zhao, and Cheng Zhou. A feasibility study of mr elastography in the diagnosis of prostate cancer at 3.0 t. Acta Radiologica, 52(3):354–358, 2011. ISSN 0284-1851.
- Chopra et al. [2009] Rajiv Chopra, Arvin Arani, Yuexi Huang, Mireía Musquera, Jeff Wachsmuth, Michael Bronskill, and Donald Plewes. In vivo mr elastography of the prostate gland using a transurethral actuator. Magnetic Resonance in Medicine: An Official Journal of the International Society for Magnetic Resonance in Medicine, 62(3):665–671, 2009. ISSN 0740-3194.
- Dittmann et al. [2018] Florian Dittmann, Rolf Reiter, Jing Guo, Matthias Haas, Patrick Asbach, Thomas Fischer, Jürgen Braun, and Ingolf Sack. Tomoelastography of the prostate using multifrequency mr elastography and externally placed pressurized-air drivers. Magnetic resonance in medicine, 79(3):1325–1333, 2018. ISSN 0740-3194.
- Arani et al. [2011] Arvin Arani, Donald Plewes, Axel Krieger, and Rajiv Chopra. The feasibility of endorectal mr elastography for prostate cancer localization. Magnetic resonance in medicine, 66(6):1649–1657, 2011. ISSN 0740-3194.
- McGrath et al. [2017] Deirdre M McGrath, Jenny Lee, Warren D Foltz, Navid Samavati, Theo Van der Kwast, Michael AS Jewett, Peter Chung, Cynthia Ménard, and Kristy K Brock. Mr elastography to measure the effects of cancer and pathology fixation on prostate biomechanics, and comparison with t 1, t 2 and adc. Physics in Medicine & Biology, 62(3):1126, 2017. ISSN 0031-9155.
- Reiter et al. [2020] Rolf Reiter, Shreyan Majumdar, Steven Kearney, Andre Kajdacsy-Balla, Virgilia Macias, Simone Crivellaro, Brandon Caldwell, Michael Abern, Thomas J Royston, and Dieter Klatt. Prostate cancer assessment using mr elastography of fresh prostatectomy specimens at 9.4 t. Magnetic resonance in medicine, 84(1):396–404, 2020. ISSN 0740-3194.
- Sahebjavaher et al. [2013] Ramin S Sahebjavaher, Ali Baghani, Mohammad Honarvar, Ralph Sinkus, and Septimiu E Salcudean. Transperineal prostate mr elastography: initial in vivo results. Magnetic Resonance in Medicine, 69(2):411–420, 2013. ISSN 0740-3194.
- [21] R Sinkus, T Nisius, J Lorenzen, J Kemper, and M Dargatz. In-vivo prostate mr-elastography. In Proc. Intl. Soc. Mag. Reson. Med, volume 11, page 586.
- Thörmer et al. [2013] Gregor Thörmer, Martin Reiss-Zimmermann, Josephin Otto, Karl-Titus Hoffmann, Michael Moche, Nikita Garnov, Thomas Kahn, and Harald Busse. Novel technique for mr elastography of the prostate using a modified standard endorectal coil as actuator. Journal of Magnetic Resonance Imaging, 37(6):1480–1485, 2013. ISSN 1053-1807.
- Sack et al. [2013] Ingolf Sack, Korinna Jöhrens, Jens Würfel, and Jürgen Braun. Structure-sensitive elastography: on the viscoelastic powerlaw behavior of in vivo human tissue in health and disease. Soft matter, 9(24):5672–5680, 2013.
- Hudert et al. [2021] Christian A Hudert, Heiko Tzschätzsch, Birgit Rudolph, Christoph Loddenkemper, Hermann-Georg Holzhütter, Laura Kalveram, Susanna Wiegand, Jürgen Braun, Ingolf Sack, and Jing Guo. How histopathologic changes in pediatric nonalcoholic fatty liver disease influence in vivo liver stiffness. Acta Biomaterialia, 123:178–186, 2021. ISSN 1742-7061.
- Yin et al. [2017] Ziying Yin, Steven P Kearney, Richard L Magin, and Dieter Klatt. Concurrent 3d acquisition of diffusion tensor imaging and magnetic resonance elastography displacement data (dti-mre): theory and in vivo application. Magnetic resonance in medicine, 77(1):273–284, 2017. ISSN 0740-3194.
- Yin et al. [2014] Ziying Yin, Richard L Magin, and Dieter Klatt. Simultaneous mr elastography and diffusion acquisitions: diffusion-mre (dmre). Magnetic resonance in medicine, 71(5):1682–1688, 2014. ISSN 0740-3194.
- Mahapatra and Buhmann [2014] Dwarikanath Mahapatra and Joachim M. Buhmann. Prostate mri segmentation using learned semantic knowledge and graph cuts. IEEE transactions on bio-medical engineering, 61(3):756–764, 2014. doi:10.1109/tbme.2013.2289306. URL https://doi.org/10.1109/TBME.2013.2289306.
- Klein et al. [2017] Stefan Klein, Uulke A. van der Heide, Irene M. Lips, Marco van Vulpen, Marius Staring, and Josien P. W. Pluim. Automatic segmentation of the prostate in 3d mr images by atlas matching using localized mutual information. Medical Physics, 35(4):1407–1417, 2017. doi:10.1118/1.2842076. URL https://aapm.onlinelibrary.wiley.com/doi/abs/10.1118/1.2842076.
- Toth and Madabhushi [2012] R. Toth and A. Madabhushi. Multifeature landmark-free active appearance models: Application to prostate mri segmentation. IEEE Transactions on Medical Imaging, 31(8):1638–1650, 2012. doi:10.1109/TMI.2012.2201498.
- [30] Geert Litjens, Oscar Debats, Wendy van de Ven, Nico Karssemeijer, and Henkjan Huisman. A pattern recognition approach to zonal segmentation of the prostate on mri. pages 413–420.
- Bengio et al. [2007] Yoshua Bengio, Yann LeCun, et al. Scaling learning algorithms towards ai. Large-scale kernel machines, 34(5):1–41, 2007.
- [32] Qikui Zhu, Bo Du, Baris Turkbey, Peter L. Choyke, and Pingkun Yan. Deeply-supervised cnn for prostate segmentation. pages 178–184.
- [33] Fausto Milletari, Nassir Navab, and Seyed-Ahmad Ahmadi. V-net: Fully convolutional neural networks for volumetric medical image segmentation. pages 565–571.
- [34] Lequan Yu, Xin Yang, Hao Chen, Jing Qin, and Pheng-Ann Heng. Volumetric convnets with mixed residual connections for automated prostate segmentation from 3d mr images.
- Zabihollahy et al. [2019] Fatemeh Zabihollahy, Nicola Schieda, Satheesh Krishna Jeyaraj, and Eranga Ukwatta. Automated segmentation of prostate zonal anatomy on t2-weighted (t2w) and apparent diffusion coefficient (adc) map mr images using u-nets. Medical physics, 2019.
- [36] Tyler Clark, Alexander Wong, Masoom A. Haider, and Farzad Khalvati. Fully deep convolutional neural networks for segmentation of the prostate gland in diffusion-weighted mr images. pages 97–104. ISBN 978-3-319-59875-8. doi:10.1007/978-3-319-59876-5_12.
- [37] Olaf Ronneberger, Philipp Fischer, and Thomas Brox. U-net: Convolutional networks for biomedical image segmentation. pages 234–241.
- [38] Christian Szegedy, Sergey Ioffe, Vincent Vanhoucke, and Alexander A. Alemi. Inception-v4, inception-resnet and the impact of residual connections on learning. volume 4, pages 12–12.
- Aldoj et al. [2020] Nader Aldoj, Federico Biavati, Florian Michallek, Sebastian Stober, and Marc Dewey. Automatic prostate and prostate zones segmentation of magnetic resonance images using densenet-like u-net. Scientific reports, 10(1):1–17, 2020.
- Streitberger et al. [2020] Kaspar-Josche Streitberger, Ledia Lilaj, Felix Schrank, Jürgen Braun, Karl-Titus Hoffmann, Martin Reiss-Zimmermann, Josef A Käs, and Ingolf Sack. How tissue fluidity influences brain tumor progression. Proceedings of the National Academy of Sciences, 117(1):128–134, 2020. ISSN 0027-8424.
- Barentsz et al. [2016] Jelle O Barentsz, Jeffrey C Weinreb, Sadhna Verma, Harriet C Thoeny, Clare M Tempany, Faina Shtern, Anwar R Padhani, Daniel Margolis, Katarzyna J Macura, and Masoom A Haider. Synopsis of the pi-rads v2 guidelines for multiparametric prostate magnetic resonance imaging and recommendations for use. European urology, 69(1):41, 2016.
- Tzschätzsch et al. [2016] Heiko Tzschätzsch, Jing Guo, Florian Dittmann, Sebastian Hirsch, Eric Barnhill, Korinna Jöhrens, Jürgen Braun, and Ingolf Sack. Tomoelastography by multifrequency wave number recovery from time-harmonic propagating shear waves. Medical image analysis, 30:1–10, 2016. ISSN 1361-8415.
- Streitberger et al. [2014] Kaspar-Josche Streitberger, Martin Reiss-Zimmermann, Florian Baptist Freimann, Simon Bayerl, Jing Guo, Felix Arlt, Jens Wuerfel, Jürgen Braun, Karl-Titus Hoffmann, and Ingolf Sack. High-resolution mechanical imaging of glioblastoma by multifrequency magnetic resonance elastography. PloS one, 9(10):e110588, 2014. ISSN 1932-6203.
- [44] T Meyer, H Tzschätzsch, J Braun, P Kalra, A Kolipaka, and I Sack. Online platform for extendable server-based processing of magnetic resonance elastography data. In Montreal, Quebec, Canada: Proc 23st Annual Meeting ISMRM, volume 3966.
- [45] Patrice Y. Simard, Dave Steinkraus, and John C. Platt. Best practices for convolutional neural networks applied to visual document analysis. pages 958–958.
- Dice [1945] Lee R. Dice. Measures of the amount of ecologic association between species. Ecology, 26(3):297–302, 1945.
- Lowekamp et al. [2013] Bradley Christopher Lowekamp, David T Chen, Luis Ibáñez, and Daniel Blezek. The design of simpleitk. Frontiers in neuroinformatics, 7:45, 2013. ISSN 1662-5196.
- Yaniv et al. [2018] Ziv Yaniv, Bradley C Lowekamp, Hans J Johnson, and Richard Beare. Simpleitk image-analysis notebooks: a collaborative environment for education and reproducible research. Journal of digital imaging, 31(3):290–303, 2018. ISSN 1618-727X.
- Abadi et al. [2016] Martín Abadi, Ashish Agarwal, Paul Barham, Eugene Brevdo, Zhifeng Chen, Craig Citro, Greg S Corrado, Andy Davis, Jeffrey Dean, and Matthieu Devin. Tensorflow: Large-scale machine learning on heterogeneous distributed systems. arXiv preprint arXiv:1603.04467, 2016.
- [50] Simon John Christoph Soerensen, Richard Fan, Arun Seetharaman, Leo Chen, Wei Shao, Indrani Bhattacharya, Michael Borre, Benjamin Chung, Katherine To’o, and Geoffrey Sonn. Prognet: prostate gland segmentation on mri with deep learning. In Medical Imaging 2021: Image Processing, volume 11596, page 115962R. International Society for Optics and Photonics.
- Drozdzal et al. [2016] Michal Drozdzal, Eugene Vorontsov, Gabriel Chartrand, Samuel Kadoury, and Chris Pal. The importance of skip connections in biomedical image segmentation, pages 179–187. Springer, 2016.